Abstract
One critical challenge in studying neural circuits of freely behaving model organisms is to record neural signals distributed within the whole brain, yet simultaneously maintaining cellular resolution. However, due to the dense packing of neuron cells in animal brains, high numerical aperture (NA) objectives are often required to differentiate neighboring neurons with the consequent need for axial scanning for whole brain imaging. Extending the depth of focus (EDoF) will be beneficial for fast 3D imaging of those neurons. However, current EDoF-enabled microscopes are primarily based on objectives with small NAs (≤0.3 ) such that the paraxial approximation can be applied. In this paper, we started from a nonparaxial approximation of the defocus aberration and derived a new phase mask that was appropriate for large NA microscopic systems. We validated the performance experimentally with a spatial light modulator (SLM) to create the designed phase mask. The performance was tested on different samples such as multilayered fluorescence beads and thick brain tissues, as well as with different objectives. Results confirmed that our design has extended the depth of focus about 10 fold and the image quality is much higher than those based on the most common EDoF method, the cubic phase method, popularly used to generate Airy beams. Meanwhile, our phase mask is rotationally symmetric and easy to fabricate. We fabricated one such phase plate and tested it on the pan-neuronal labeled Caenorhabditis elegans (C.elegans). The imaging performance demonstrated that we can capture all neurons in the whole brain with one snapshot and with cellular resolution, while the imaging speed is increased about 3 fold compared to the system using SLM. Thus we have shown that our method can not only provide the required imaging speed and resolution for studying neural activities in model animals, but also can be implemented as a low-cost, add-on module that can immediately augment existing fluorescence microscopes with only minor system modifications, and yielding substantially higher photon efficiency than SLM-based methods.
1. Introduction
A key goal of imaging the whole brain neural activities of freely behaving animals is to obtain the connection map of the nervous system that controls behavior. Many neurons in the brain are closely related to sensing, learning and memory, however, they are usually densely packed. Thus high NA objectives are often required to distinguish different neurons during whole brain imaging of signals emitted by labels such as genetically encoded calcium indicators (GECI). This is true even when studying small animals such as C.elegans. For example, B-type motor neurons (with cell bodies only 2-3 microns in diameter), which command forward movement, lie in the ventral nerve cord and can be very close and even touch each other during movement [1]. In prior studies, their rhythmic dynamics were recorded with a NA 0.75 objective [2]. In another case, RME neurons, which are responsible for head undulation and are located at the nerve ring of C.elegans, were imaged with a NA 1.3 objective [3]. With large NA, the depth of focus of the objective is 1 micron or even smaller. Axial scanning becomes absolutely necessary to perform whole brain imaging, leading to slow volumetric imaging speeds.
Current strategies to increase the speed of volumetric imaging can be divided into two. One is scanning based and the other is camera based [4]. Specifically, the scanning based methods aim to increase the scanning speed while maintaining high resolution using acoustic lenses and other strategies [5–7]. However their application to whole brain imaging is limited due to the gigantic number of scanning points. Camera-based methods, on the other hand, are parallel in nature and can capture 3D signals in one snapshot. However the image qualities in the captured raw image is sacrificed in one way or another. For example, the light field method can obtain 3D distributed signals at once, but post-processing is required to reconstruct a usable image volume [8,9]. Furthermore, the lateral resolution is still sacrificed even with deconvolution [10–12]. With a NA 1.05 objective and the emission wavelength around 0.5 , the final lateral resolution is only about 3.4 [13].
Extending the depth of focus (EDoF) is another type of camera-based approach. Here the system’s point spread function (PSF) is engineered to be invariant over a range of axial planes through adding a phase mask to the pupil plane. Consequently the camera records the axial projection of the 3D sample under wide field illumination. Various EDoF masks have been proposed previously to obtain volumetric images without axial scanning. They can be further divided into symmetrical and asymmetrical masks. For example, the cubic phase mask, which was proposed initially to extend the depth of focus for photography [14], is popular in microscopy as well because its wide application to generate Airy beams [15]. Its point spread function is not circular and has many side peaks due to the asymmetrical distribution of the phase mask. When used in wide field imaging, post-acquisition processing is required to obtain a high contrast image [16,17]. In contrast, symmetrical EDoF phase masks such as annular masks [18–20] and logarithmic masks [21] yield readily usable images. As shown in our previous work [22] as well as in this study, our phase modulation method produces acceptable wide-field images without the need for deconvolution. However, side lobes are still present, and must be considered if the application involves an image without a certain degree of sparsity. The goal of the phase mask is to alleviate the defocus caused by signals not being in the focal plane. However most EDoF phase mask designs reported so far, including our previous work [22–24], are primarily for imaging systems with small NA, where the defocus function can be well represented by the paraxial approximation. As is discussed above, large NA objectives are often needed to differentiate neurons when imaging whole brain activities. As depth of focus is inversely proportional to the square of the NA, the need for EDoF phase masks when using large NA objectives for fast volumetric imaging is even more urgent.
Here, we report a new EDoF phase mask that is applicable for objectives with large NA. The mask is rotationally symmetric so that the raw image can be interpreted immediately. We tested the design using NA 0.60 objective lenses, which provided a sufficient field of view and resoltuion for studying a freely behaving Caenorhabditis elegans and achieved a tenfold increase in the depth of focus. Images from the pan-neuronal labled C.elegans confirmed that our approach can capture all neurons in the brain in one snapshot with cellular resolution. After validating the design with a spatial light modulator, we also fabricated a phase mask using the transparent material polymethyl methacrylate (PMMA) and achieved similar volumetric imaging performance and faster imaging speed. The paper is organized as follows: in Section 2, we derive our new EDoF phase mask based on a nonparaxial approximation of defocus and perform numerical analysis on the imaging performance. In section 3, we experimentally validate the design and compare with other EDoF methods with the help of a spatial light modulator. The experiment is performed on different samples as well as different objectives. In section 4, we test the design further using an inexpensive fabricated phase mask. Our discussion and concluding remarks are given in Section 5.
2. Theory for a nonparaxial EDoF phase mask
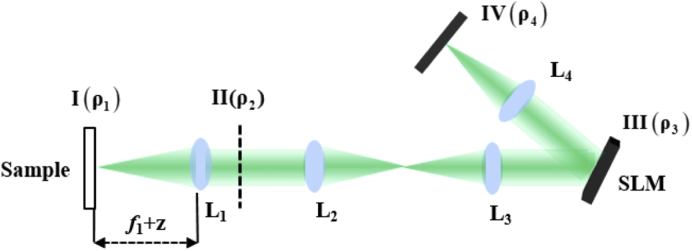
In Fig. 1, we show a sample in plane I imaged by an objective with focal length . A tube lens and an achromatic lens (focal lengths: and ), arranged in a relay system, are placed after the objective to conjugate the objective’s back focal plane II onto a spatial light modulator (plane III). After the phase modulation by SLM and focusing by lens (focal length: ), the image is formed on the camera plane IV.
Fig. 1.
Schematic of the proposed imaging system. The back pupil plane II of the objective () is relayed onto the spatial light modulator (plane III). The Fluorescent signals are recorded by a camera (plane IV) placed in the conjugate plane of the sample plane (plane I).
2.1. Nonparaxial approximation of defocus function
When an on-axis point source is at a distance z away from the front focal plane of the objective, the field at the back focal plane, i.e. pupil plane II, can be written as
| (1) |
in which is the radial coordinate in the pupil plane and is the wavenumber. In this paper, we assume that the system is circularly symmetric, all later analysis is based on polar coordinates (). Thus the theoretical defocus function can be written as
| (2) |
As the defocus distance z is typically small compared to the focal length of the objective when the image can be even recognized and recorded, we can apply a Taylor expansion in terms of z to the theoretical defocus function. Keeping the first two terms, we obtain the nonparaxial approximation of the defocus function, i.e.,
| (3) |
Note that for the traditional paraxial approximation, Taylor series of defocus function is expanded in terms of instead of z and the defocus function is written as [25]
| (4) |
Here the superscript “NP” and “P” indicate nonparaxial approximation and paraxial approximation, respectively. In the large NA case, cannot always be considered small compared to the focal length . However it is still safe to assume that z is much smaller than the focal length in the microscopic system. For example, with a Nikon 10X NA 0.3 objective, the depth of focus is about 10 , the focal length is 20 and is in the range of . With a 40X NA 0.6 objective, the depth of focus is 2 , the focal length is 5 and is in the range of . For a 60X NA 1.4 objective, the depth of focus is 0.5 , the focal length is 3 and is in the range of .
Figure 2 shows a few examples of the defocus function for the above objectives with defocus distance 65 , 30 and 5 , respectively. Both paraxial and nonparaxial approximations are plotted along with the theoretical curves (shown in red, yellow and blue curves). The difference between the approximations and the theory are calculated and plotted as well (shown in purple and green curves). From Fig. 2(a), one can see that when NA is small, both paraxial and nonparaxial approximation are close to theory, the difference in the nonparaxial case is negligible. When NA is larger, the difference between the paraxial approximation and theory is almost an order of magnitude larger while the difference in the nonparaxial case is still negligible (Fig. 2(b)). We have also studied cases with NA up to 1.4 (Fig. 2(c)) and come to the same conclusion that the difference between nonparaxial approximation and theory is negligible. Thus Eq. (3) can be used as a valid approximation of defocus function for microscopes with large NAs.
Fig. 2.
Numerical study of different approximations of the defocus function for NA 0.3 objectives with defocus distance 65 (a), NA 0.6 objectives with defocus distance 30 (b) and NA 1.4 objectives with defocus distance 5 (c). Theory-Nonparaxial and Theory-Paraxial indicates the difference between nonparaxial and paraxial approximation methods to theory, respectively.
2.2. Derivation of EDoF formula
During the derivation, we use scalar diffraction theory and assume that the objective in the imaging system is ideal and that polarization effects can be ignored, which may lead to subtle deviations at very high numerical apertures. The pupil is located at the back focal plane of the microscope objective and is assumed to be perfectly transmissive inside the circular aperture . Since plane III is conjugate to plane II, , using the nonparaxial approximation of the defocus function, we can write the field at plane III as
| (5) |
in which is the radial coordinate. is the phase added to SLM.
The system’s point spread function is the Fourier transform of Eq. (5) and can be written as [25]
| (6) |
where is the zeroth order Bessel function of the first kind, and represents the largest radius that can transmit light in plane III. Hence, the central peak of the PSF can be written as:
| (7) |
The integral results in above equation can be evaluated by the method of stationary phase (See Ref. [26]) as
| (8) |
where is defined as
| (9) |
and is the saddle point for , i.e.,
| (10) |
and denote the first and second derivatives of with respect to respectively. Plugging Eq. (9) into Eq. (10), we have
| (11) |
In this paper we can assume that is a constant in the range of the depth of focus and Eq. (8) can be rewritten as
| (12) |
Combining the above two equations, we obtain a Bernoulli Equation of as follows,
| (13) |
and can write its solution readily as
| (14) |
in which and are constants. In order to evaluate the constants and , we take the derivative of Eq. (14) and use Eq. (11) to obtain the relationship between and as follows,
| (15) |
we can see that each saddle point corresponds to a defocus distance z. Letting the saddle points for the distance to be respectively, we can obtain the solutions of and :
| (16) |
| (17) |
Thus the corresponding phase function is given by:
| (18) |
in which is a constant and is a design parameter which controls the norminal limit of the defocus distance (i.e. increasing leads to an increase in the depth of focus).
2.3. Numerical study
In order to understand the differences between the paraxial and nonparaxial formula better, we first will compare the EDoF phase profiles obtained with both paraxial and nonparaxial approximations. The paraxial approximation formula can be found in our previous work [22] and is rewritten here for completeness:
| (19) |
where is a constant.
In the proposed system, takes the form of Eq. (18). For a conventional system, . During the calculation, the optical parameters for the imaging system are as follows, objective lenses are a 40X NA 0.6 objective ( ) and a 10X NA 0.3 objective ( ) and the focal lengths of other lenses are all 200mm (i.e. ). Design parameter for the NA 0.6 objective and for the NA 0.3 objective respectively.
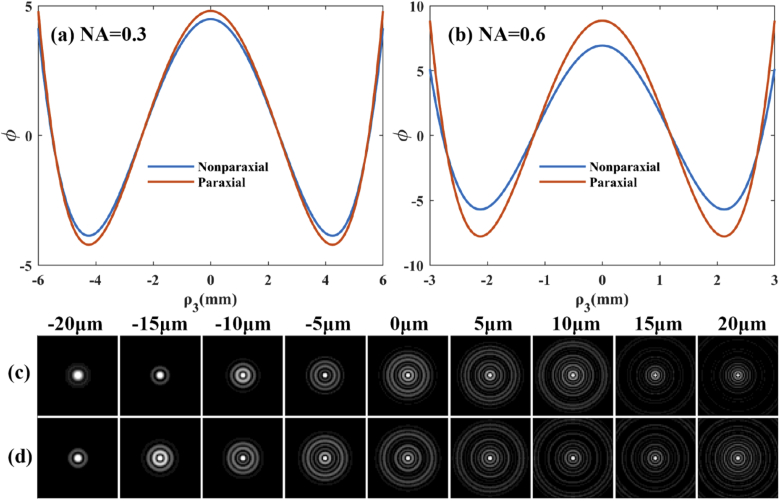
We can plot the phase profiles using Eq. (19) and Eq. (18) and the results are shown in Fig. 3(a) for NA=0.3, and Fig. 3(b) for NA=0.6. Clearly we see that the difference between paraxial and nonparaxial forms grows greater as the NA increases, and for large NAs is in general much larger than . This will have a significant impact on the PSF. Thus we compute the PSFs at NA=0.6 for both forms of the EDoF mask using Eq. (6) with Figs. 3(c) and 3(d) showing the paraxial and nonparaxial forms, respectively. One can see that PSFs with nonparaxial EDoF phase mask tend to be more localized compared to the paraxial case. This will lead to a higher contrast in the acquired images. As is shown in Fig. 3(a), when the NA is smaller, the shape of the EDoF masks, and thus the obtained PSFs, will be similar between the paraxial and nonparaxial forms.
Fig. 3.
Phase profiles of the EDoF phase mask when NA=0.3 (a) and NA=0.6 (b). The difference between paraxial and nonparaxial approximation is more prominent when NA is larger. Accordingly PSFs with nonparaxial formula (c) will be more different than PSFs with paraxial formula (d).
To demonstrate the advantages of our proposed system over conventional system, we can also show some examples of the point spread functions with a NA 0.6 objective at different planes (z=0 , and ) in Fig. 4. Figure 4(a) shows the results of the conventional system and 4(b) the proposed system. We can clearly see that the central lobe of PSF changes much slower in our system compared to the conventional system. In the conventional system, the central lobe can be maintained in a range of 3 while in our system, it can maintain its dominance over side lobes over 30 . The normalized PSF peak values vs axial position for these two systems are computed and plotted in Fig. 4(c), demonstrating the EDoF performance of our design is about 30 . Note that there are some variations in the axial PSF values, likely due to variations in how valid the stationary phase approximation is to the diffraction integral (Eq. (7)) along the axial direction.
Fig. 4.
Curves of point spread function of the conventional system (a) and the proposed system (b). (c) Normalized central peak values vs axial distance.
3. Experimental results
We constructed the experimental setup according to the schematic in Fig. 1 with a Nikon 40X NA 0.6 objective (Nikon, Japan), a tube lens and a pair of achromatic lenses (f200, thorlabs). A blue laser (Coherent, OBIS 488 nm, 100 mW, USA) was used for fluorescence excitation and a dichroic mirror (Semrock, FF500-Di01-25x36, USA) and bandpass filter (Semrock, FF01-525/30-25, USA) were used to separate the excitation and emission. The EDoF phase mask or a flat pattern was loaded onto a spatial light modulator (Hamamatsu, Japan, x13139-01) placed in the Fourier plane III. The fluorescence signal was imaged onto a sCMOS camera (Zyla 4.2, Andor Inc., UK).
3.1. Experimental results of the point spread function measurements
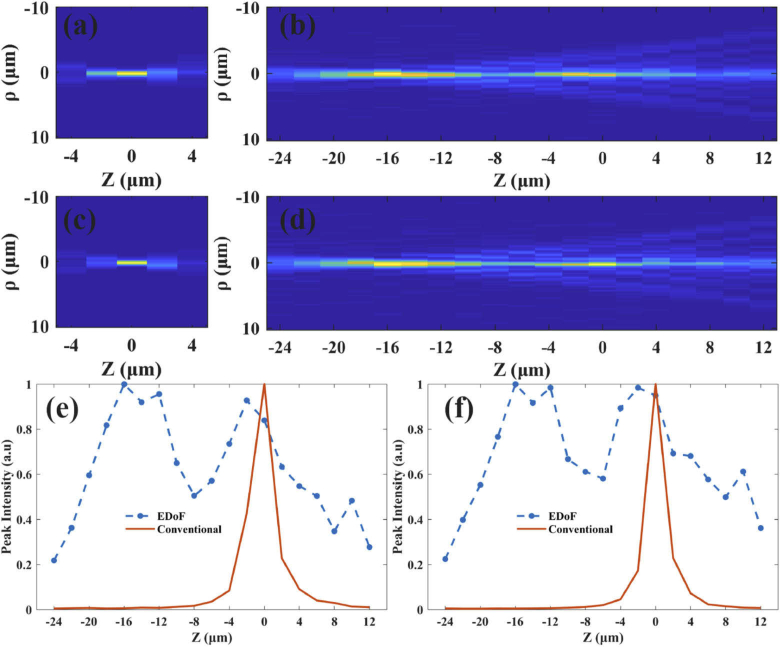
In order to confirm that point spread function of the proposed system is indeed stable within a certain range along the z axis, we used a 500nm diameter fluorescent bead (EX/EM at 488/525nm) as a point source and moved it axially with a translation stage. The measured point spread functions are shown in Fig. 5. The XZ cross sections of PSF from the conventional system and the proposed system are shown in Figs. 5(a) and 5(b), respectively. Due to circular symmetry, YZ cross sections are similar to what are shown here. The peak values of PSFs vs z (normalized to the maximum values) are plotted in Fig. 5(e). Comparing these results one can see that the proposed system gives a stable PSF over an axial range of 30 while the conventional system is stable 3 . Thus the experimental results confirm that the depth of focus of the proposed system is about tenfold of that of the conventional system.
Fig. 5.
EDoF performance and its dependence on the objectives: XZ cross section of measured PSFs from the conventional system (a, c) and the EDoF system (b, d). (e, f) normalized central peak values vs axial distance. (a, b, e) are results measured with the same objective. (c, d, f) are with a different objective but with same magnification and NA.
3.2. Effect of aberration on the proposed EDoF performance
As is well known, aberrations start to creep into the microscopic system with increasing NA. However our EDoF mask is derived on the basis of an aberration-free imaging system with an ideal pupil function. Therefore, it is necessary to confirm whether our method is tolerant to aberrations from the objective lens. During experiments, we found that the objective has minor astigmatism and the overall shape of PSFs is elliptical at small defocus. In order to check whether the EDoF performance of our method is tied to a certain objective, we switched with a different objective with same magnification and NA and measured the PSFs. The corresponding results are shown in Figs. 5(c), 5(d) and 5(f) with the same arrangement. Comparing those figures, we can see that the different objective caused the peak values to be slightly different from each other. However, the general trend of maintaining the stable PSF over 30 still holds. Thus we conclude that our EDoF performance can tolerate small aberrations in the objectives and the design can be applied in general to objectives with a reasonable quality.
3.3. Results from the multi-layered beads sample
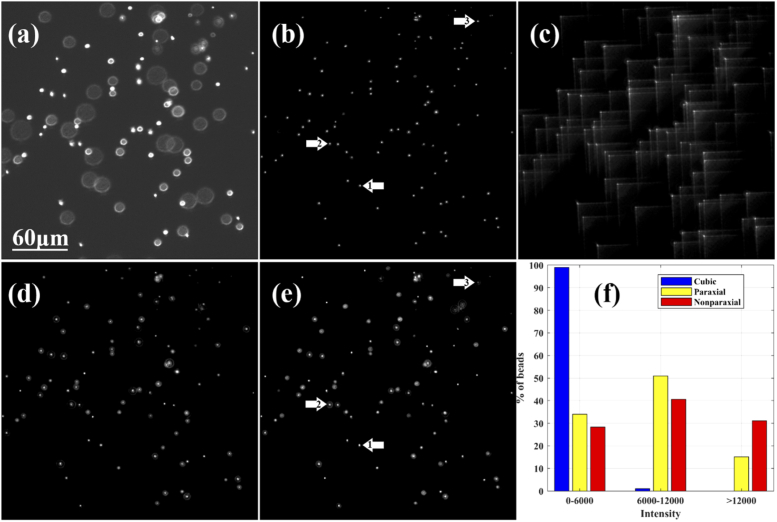
After confirming the EDoF performance on a single bead, we move to beads distributed in 3D space using a multi-layered beads sample. The sample was prepared by first suspending them in agarose and then pouring them into a 100 deep chamber walled with double-sided tape. The captured image of a single plane of the multilayer sample by the conventional system is shown in Fig. 6(a). Through axial scanning over 30 with the conventional system, followed by maximum intensity projection (MIP) of the axial sequence we obtain the digital projection result of the 3D sample (see Fig. 6(b)), which we can regard as ground truth. Images from the EDoF systems, obtained by applying the cubic phase ([16,17])), as well as the paraxial or nonparaxial forms of our phase masks are shown in Figs. 6(c-e), respectively. One can see obviously that the EDoF systems can focus on more beads simultaneously. Comparing our paraxial and nonparaxial designs with the cubic phase method, we can see that our methods give much higher contrast images. This is in accordance with the fact that our Strehl ratios are much higher than the cubic phase method. Comparing the results from paraxial (Fig. 6(d)) and nonparaxial cases (Fig. 6(e)), we can see that the beads in nonparaxial phase mask tend to have a higher contrast, demonstrating the advantage of the new design. The arrows 1, 2 and 3 in Figs. 6(b) and 6(e) represent beads in the z plane of -20 , 0 , 10 . Comparing Figs. 6(b) and 6(e), we can see that our one snapshot result is similar to the MIP result, confirming the ability to extend the depth of focus throughout the entire 30 volume. Note that the exposure times in all images were held to be identical. We can thus also analyze the percentage of fluorescent beads in different peak intensity ranges (shown in Fig. 6(f)). It can be seen that the overall intensity of the nonparaxial design is higher than that of the paraxial case, meanwhile, cubic phase method shows the lowest intensity of the three designs.
Fig. 6.
Imaging results of multi-layered beads. (a) Conventional imaging system. (b) Maximum-Intensity projections of the conventional axial scanning images. (c) The EDoF imaging system using cubic phase designs. (d) The EDoF imaging system using paraxial designs. (e) The EDoF imaging system using nonparaxial designs. (f) The percentage of fluorescent beads in different peak intensity ranges. Note that the images are stretched by contrast to show defocused beads. The arrows 1, 2 and 3 in (b) and (e) represent beads in the z plane of -20 , 0 , 10 .
3.4. Brain tissue
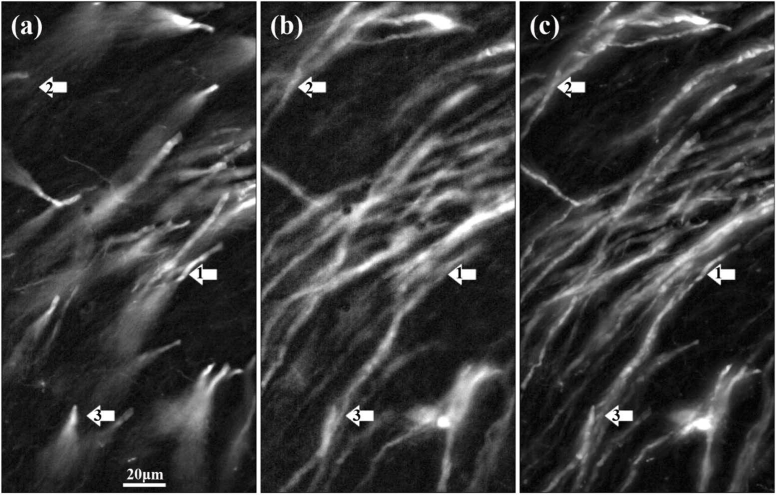
As an example of a biological sample with a continuous 3D structure, we imaged a thick and CLARITY-treated thy1-YFP transgenic mouse brain tissue section. The imaging results of the conventional and our newly proposed EDoF microscopy systems are shown in Figs. 7(a) and 7(b), respectively. As the neuron fibers spread across multiple planes, only part of these fibers are focused by the conventional system (see Fig. 7(a)). With our system, we obtained the continuous fiber structure (shown in Fig. 7(b)). The scan-and-digital-projection result from the conventional system is shown in Fig. 7(c). The structures demarcated by arrows 1, 2 and 3 in Fig. 7 are -20, 0, 10 away from the focal plane and they can be seen clearly and simultaneously by our system. Thus, with the brain tissue, we have also demonstrated that the depth of focus of an NA 0.6 objective is extended to be 30 .
Fig. 7.
Imaging results of brain tissue: typical raw images are captured with the conventional system (a) and the proposed system (b). (c) The Maximum-Intensity projection along the propagation axis with the conventional system. Arrows 1, 2 and 3 represent structures in the z plane of -20 , 0 , 10 .
3.5. Caenorhabditis elegans with pan-neuronal label
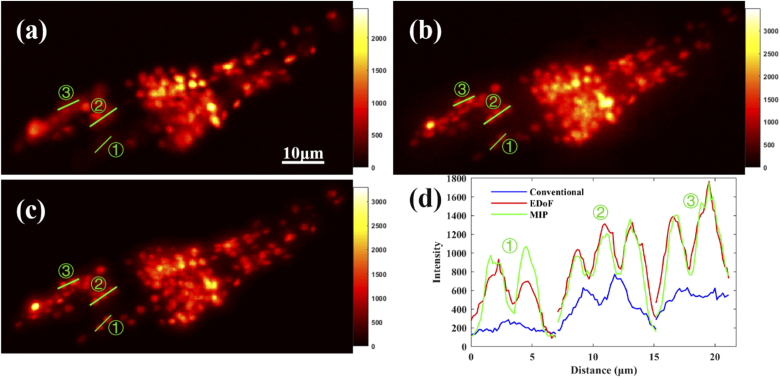
To verify whether our EDoF system can be used to study neural circuits in small organisms, a pan-neuronal nucleus-labelled C.elegans was used as a sample and the imaging results are shown in Fig. 8. Neurons captured by the conventional and our EDoF system are shown in Figs. 8(a) and 8(b), respectively. Compared with the scan-and-digital projection results (see Fig. 8(c)), the conventional system can only focus on part of the brain, while the proposed system can focus on the whole brain. We also draw the intensity distributions of three regions indicated by lines 1, 2 and 3 in Fig. 8(d). It can be seen that our method shows a similar high contrast as the traditional scan-and-digital projection method.
Fig. 8.
Whole brain images of Caenorhabditis elegans. Snapshots acquired with (a) the conventional and (b) the proposed system. (c) is the Maximum-Intensity projection along z-axis of the conventional system. (d) The intensity distributions of the regions indicated by three lines in (a-c).
4. Performance on the fabricated phase mask with the new design
In the work above, the phase mask is realized through a spatial light modulator. However, as the light efficiency of SLM is only about 30 (due to its partial reflectivity and need for polarized input), using a fabricated phase mask will not only reduce the cost of the system, but also help to increase the imaging speed by enhancing photon efficiency. Furthermore, the rotational symmetry of our designed phase mask, allowing the use of conventional fabrication methods, is one key advantage over non-symmetric designs such as the cubic phase mask. For this reason, we designed and fabricated a phase mask using PMMA with high transmittance (100) to replace the SLM. The fabrication process is single point diamond turning (SPDT) by Shen Zhen Nanotech Co., LTD.
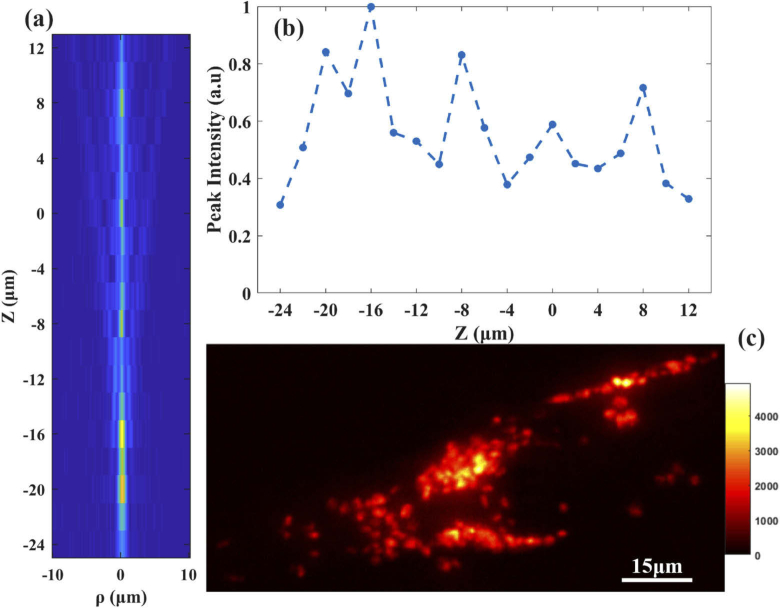
In order to verify the performance of the fabricated phase mask, we measured the point spread function from the newly built system and the results are shown in Figs. 9(a) and 9(b). Compared with the results obtained using a SLM, the PSFs are still stable over 30 . In order to check whether there will be a significant increase in the utilization of the light energy with the newly processed phase mask, we also collected images of Caenorhabditis elegans, as shown in Fig. 9(c). To get a clear image, the exposure time of the newly-built system based on the fabricated phase mask was about 3 times shorter than that of using SLMs when the laser power was kept at the same value of 100 mW. Thus the fabricated phase mask can completely replace the SLM in future implementations.
Fig. 9.
Results using the fabricated phase mask. XZ cross section of measured PSFs (a) and normalized central peak values vs axial distance (b). (c) whole brain images of C.elegans.
5. Discussion and conclusion
In this paper, we started with nonparaxial approximation of the defocus function in microscopy systems and derived a new formula for extending the depth of focus of objective lenses with large NAs. Theoretical analysis and experimental results of fluorescent beads showed that when applying the new formula to a 40X NA 0.6 objective lens, we can achieve up to a tenfold improvement in the depth of focus over the conventional microscopy system. Compared with the paraxial design, the new design leads to brighter PSFs and thus images with higher contrast. We also compared the design with the popularly used cubic phase mask and results showed that both our paraxial and nonparaxial designs lead to a much higher image contrast. Finally we tested the performance on biological samples such as brain tissue and C.elegans. The imaging results on brain tissue showed that our proposed EDoF technique can also be applied to thick biological samples with dense structures without the need for post-processing. For Caenorhabditis elegans, neurons in its brain are not only small (2) but also densely distributed, necessitating high NA imaging. We obtained neuron images in the whole brain with a single snapshot with individual neurons clearly visible. At the same time, we also fabricated a phase mask using the highly transparent material PMMA to replace the SLM, since our design is circularly symmetric and easy to fabricate. Experimental results on C.elegans proved that the phase plate can effectively improve the light efficiency and greatly reduce the exposure time. Thus our method can be implemented as a low cost add-on module to existing fluorescence microscopes for fast imaging of sparse 3D volumes.
With pupil-modulating methods to extend depth of focus, the extended point spread function is likely to have more side lobes. This imposes a sparsity constraint on the sample. However, our PSF has much fewer numbers of side lobes compared to the cubic phase mask (as can be seen in Figs. 6(c) and 6(e)), meaning that the contrast of the eventual image will be higher, enabling on-line use of the images without post processing (for example in motion tracking of the freely-behaving animal). However, in applications where images are only needed for off-line analysis, post-acquisition deconvolution can largely remove the side lobes of the PSF, as demonstrated in our previous work [22]. Meanwhile, our design can be further improved, for example, by considering multiple stationary points in the integral of Eq. (7), by optimizing the shape of PSF instead of peak value only, etc. These will be considered in future work.
In summary, we have demonstrated in this paper that the nonparaxial EDoF mask not only has successfully extended the depth of focus of objectives with large NAs, but also leads to images with much higher contrast and preserved PSF width compared to other methods. We anticipate the system can be gainfully applied to the challenge of recording fast neuron activities in the whole brain of model organisms.
Acknowledgments
The authors thank Ying Ma and Chuanzhen Hu of The University of Science and Technology of China for helpful discussions.
Funding
Ministry of Science and Technology of the People’s Republic of China10.13039/501100002855 (2017YFA0505300); National Natural Science Foundation of China10.13039/501100001809 (31670803).
Disclosures
The authors declare no conflicts of interest.
References
- 1.Schafer W. R., “Neurophysiological methods in c. elegans: an introduction,” in WormBook: The Online Review of C. elegans Biology [Internet], (WormBook, 2006). [DOI] [PMC free article] [PubMed] [Google Scholar]
- 2.Xu T., Huo J., Shao S., Po M., Kawano T., Lu Y., Wu M., Zhen M., Wen Q., “Descending pathway facilitates undulatory wave propagation in caenorhabditis elegans through gap junctions,” Proc. Natl. Acad. Sci. 115(19), E4493–E4502 (2018). 10.1073/pnas.1717022115 [DOI] [PMC free article] [PubMed] [Google Scholar]
- 3.Shen Y., Wen Q., Liu H., Zhong C., Qin Y., Harris G., Kawano T., Wu M., Xu T., Samuel A. D., Zhang Y., “An extrasynaptic gabaergic signal modulates a pattern of forward movement in caenorhabditis elegans,” eLife 5, e14197 (2016). 10.7554/eLife.14197.001 [DOI] [PMC free article] [PubMed] [Google Scholar]
- 4.Mertz J., “Strategies for volumetric imaging with a fluorescence microscope,” Optica 6(10), 1261–1268 (2019). 10.1364/OPTICA.6.001261 [DOI] [Google Scholar]
- 5.Nadella K. N. S., Roš H., Baragli C., Griffiths V. A., Konstantinou G., Koimtzis T., Evans G. J., Kirkby P. A., Silver R. A., “Random-access scanning microscopy for 3d imaging in awake behaving animals,” Nat. Methods 13(12), 1001–1004 (2016). 10.1038/nmeth.4033 [DOI] [PMC free article] [PubMed] [Google Scholar]
- 6.Jabbour J. M., Malik B. H., Olsovsky C., Cuenca R., Cheng S., Jo J. A., Cheng Y.-S. L., Wright J. M., Maitland K. C., “Optical axial scanning in confocal microscopy using an electrically tunable lens,” Biomed. Opt. Express 5(2), 645–652 (2014). 10.1364/BOE.5.000645 [DOI] [PMC free article] [PubMed] [Google Scholar]
- 7.Kong L., Tang J., Little J. P., Yu Y., Lämmermann T., Lin C. P., Germain R. N., Cui M., “Continuous volumetric imaging via an optical phase-locked ultrasound lens,” Nat. Methods 12(8), 759–762 (2015). 10.1038/nmeth.3476 [DOI] [PMC free article] [PubMed] [Google Scholar]
- 8.Levoy M., Ng R., Adams A., Footer M., Horowitz M., “Light field microscopy,” ACM Trans. Graph. 25(3), 924–934 (2006). 10.1145/1141911.1141976 [DOI] [Google Scholar]
- 9.Prevedel R., Yoon Y.-G., Hoffmann M., Pak N., Wetzstein G., Kato S., Schrödel T., Raskar R., Zimmer M., Boyden E. S., Vaziri A., “Simultaneous whole-animal 3d imaging of neuronal activity using light-field microscopy,” Nat. Methods 11(7), 727–730 (2014). 10.1038/nmeth.2964 [DOI] [PMC free article] [PubMed] [Google Scholar]
- 10.Broxton M., Grosenick L., Yang S., Cohen N., Andalman A., Deisseroth K., Levoy M., “Wave optics theory and 3-d deconvolution for the light field microscope,” Opt. Express 21(21), 25418–25439 (2013). 10.1364/OE.21.025418 [DOI] [PMC free article] [PubMed] [Google Scholar]
- 11.Cohen N., Yang S., Andalman A., Broxton M., Grosenick L., Deisseroth K., Horowitz M., Levoy M., “Enhancing the performance of the light field microscope using wavefront coding,” Opt. Express 22(20), 24817–24839 (2014). 10.1364/OE.22.024817 [DOI] [PMC free article] [PubMed] [Google Scholar]
- 12.Pégard N. C., Liu H.-Y., Antipa N., Gerlock M., Adesnik H., Waller L., “Compressive light-field microscopy for 3d neural activity recording,” Optica 3(5), 517–524 (2016). 10.1364/OPTICA.3.000517 [DOI] [Google Scholar]
- 13.Cong L., Wang Z., Chai Y., Hang W., Shang C., Yang W., Bai L., Du J., Wang K., Wen Q., “Rapid whole brain imaging of neural activity in freely behaving larval zebrafish (danio rerio),” eLife 6, e28158 (2017). 10.7554/eLife.28158.001 [DOI] [PMC free article] [PubMed] [Google Scholar]
- 14.Dowski E. R., Cathey W. T., “Extended depth of field through wave-front coding,” Appl. Opt. 34(11), 1859–1866 (1995). 10.1364/AO.34.001859 [DOI] [PubMed] [Google Scholar]
- 15.Vettenburg T., Dalgarno H. I., Nylk J., Coll-Lladó C., Ferrier D. E., Čižmár T., Gunn-Moore F. J., Dholakia K., “Light-sheet microscopy using an airy beam,” Nat. Methods 11(5), 541–544 (2014). 10.1038/nmeth.2922 [DOI] [PubMed] [Google Scholar]
- 16.Quirin S., Peterka D. S., Yuste R., “Instantaneous three-dimensional sensing using spatial light modulator illumination with extended depth of field imaging,” Opt. Express 21(13), 16007–16021 (2013). 10.1364/OE.21.016007 [DOI] [PMC free article] [PubMed] [Google Scholar]
- 17.Quirin S., Jackson J., Peterka D. S., Yuste R., “Simultaneous imaging of neural activity in three dimensions,” Front. Neural Circuits 8, 29 (2014). 10.3389/fncir.2014.00029 [DOI] [PMC free article] [PubMed] [Google Scholar]
- 18.Welford W. T., “Use of annular apertures to increase focal depth,” J. Opt. Soc. Am. 50(8), 749–753 (1960). 10.1364/JOSA.50.000749 [DOI] [Google Scholar]
- 19.Abrahamsson S., Usawa S., Gustafsson M., “A new approach to extended focus for high-speed high-resolution biological microscopy,” in Three-Dimensional and Multidimensional Microscopy: Image Acquisition and Processing XIII, vol. 6090 (International Society for Optics and Photonics, 2006), p. 60900N. [Google Scholar]
- 20.Chu K., George N., Chi W., “Extending the depth of field through unbalanced optical path difference,” Appl. Opt. 47(36), 6895–6903 (2008). 10.1364/AO.47.006895 [DOI] [PubMed] [Google Scholar]
- 21.Chi W., George N., “Electronic imaging using a logarithmic asphere,” Opt. Lett. 26(12), 875–877 (2001). 10.1364/OL.26.000875 [DOI] [PubMed] [Google Scholar]
- 22.Cai B., Zhai X., Wang Z., Shen Y., Xu R., Smith Z. J., Wen Q., Chu K., “Optical volumetric projection for fast 3d imaging through circularly symmetric pupil engineering,” Biomed. Opt. Express 9(2), 437–446 (2018). 10.1364/BOE.9.000437 [DOI] [PMC free article] [PubMed] [Google Scholar]
- 23.Mezouari S., Harvey A. R., “Phase pupil functions for reduction of defocus and spherical aberrations,” Opt. Lett. 28(10), 771–773 (2003). 10.1364/OL.28.000771 [DOI] [PubMed] [Google Scholar]
- 24.Zhou F., Ye R., Li G., Zhang H., Wang D., “Optimized circularly symmetric phase mask to extend the depth of focus,” J. Opt. Soc. Am. A 26(8), 1889–1895 (2009). 10.1364/JOSAA.26.001889 [DOI] [PubMed] [Google Scholar]
- 25.Goodman J. W., “Wave-optics analysis of coherent optical systems,” in Introduction to Fourier Optics, (Roberts and Company Publishers, 2005), chap. 5. [Google Scholar]
- 26.Born M., Wolf E., “Asymptotic approximations to integrals,” in Principles of Optics: Electromagnetic Theory of Propagation, Interference and Diffraction of Light, (Elsevier, 2013), pp. 747–753. [Google Scholar]


