Abstract
We explore the long wavelength limit of soliton self-frequency shift in silica-based fibers experimentally and using numerical simulation. We found that the longest wavelength soliton generated by soliton self-frequency shift is approximately 2500 nm because the soliton loses its energy rapidly at wavelength beyond 2400 nm due to material absorption by silica and water. We demonstrate 1580-2520 nm wavelength-tunable, high-pulse energy soliton generation using soliton self-frequency shift in a large-mode-area silica fiber pumped by a compact fiber source. Soliton pulses with pulse width of ~100 fs and pulse energy up to 73 nJ were obtained. Second harmonic generation of the solitons enables a wavelength-tunable femtosecond source from 950 nm to 1260 nm, with pulse energy up to 21 nJ. Using such energetic pulses, we demonstrate in vivo two-photon excited fluorescence imaging of vasculature and neurons in a mouse brain at wavelength beyond the tuning range of a mode-locked Ti:Sapphire lasers.
OCIS codes: (320.7110) Ultrafast nonlinear optics, (060.2380) Fiber optics sources and detectors, (110.0180) Microscopy
1. Introduction
Soliton sources based on soliton self-frequency shift (SSFS) in optical fibers with anomalous dispersion provide superb pulse quality, femtosecond pulse duration and wide spectral tunability [1–7]. When propagating in an optical fiber, soliton pulses are subject to stimulated Raman scattering (SRS). The longer-wavelength portion can experience Raman amplification at the expense of the optical power in the shorter-wavelength part of the spectrum. At wavelength regimes > 1300 nm, SSFS in standard single-mode fibers and index-guided photonic crystal fibers has been demonstrated [8–11]. Recently, soliton wavelengths up to 2.65 μm, 3 μm, 3.42 μm and 4.3 μm were realized in microstructured tellurite fibers [12], germanium-doped silica fibers [13], chalcogenide fibers [14] and fluoride fibers [5], respectively. However, these solitons suffer from low pulse energy. One way to increase the soliton pulse energy is to increase the effective mode area Aeff in the fiber, because the pulse energy of the Raman-shifted soliton in a fiber is proportional to the effective mode area of the fiber [15]. In previous reports, wavelength-tunable solitons from 1580 nm to 2130 nm with pulse energy up to 44.8 nJ in large-mode-area (LMA) fibers with Aeff = 530 μm2 were demonstrated [4, 15]. However, solitons at longer wavelengths in LMA fibers with high pulse energy have not been demonstrated. In addition, current LMA fibers or photonic crystal rods are all based on silica glass. In this paper, we explore the long wavelength limit of silica-based fibers using SSFS. One of our main motivations and practical applications of pushing the long wavelength limit of SSFS in LMA silica fibers is to create a convenient femtosecond source for long-wavelength multiphoton microscopy (MPM) at wavelength range beyond that of a mode-locked Ti:Sapphire laser.
MPM enables non-invasive, three-dimensional imaging deep within scattering biological tissue. It has been a valuable tool for biological and medical imaging applications [15–24]. Soliton sources have been successfully applied in MPM. A photonic-crystal-fiber-based soliton source that accommodates the requirements of multi-modality biophotonic imaging was demonstrated [25]. Using a fiber-based energetic soliton source, in vivo hippocampal three-photon excited fluorescence imaging to a depth of 1.35 mm in an adult mouse brain has been demonstrated at the 1700 nm spectral window [22]. Using second harmonic generation, excitation sources have been demonstrated in a variety of fibers, e.g., an LMA fiber for two-photon imaging at 775-950 nm [26], a highly nonlinear germanosilicate fiber for coherent anti-Stokes Raman scattering imaging at 850-1100 nm [27], and an LMA fiber for harmonic generation microscopy at 1150 nm [28]. Recently, the long-wavelength spectral window beyond 1060 nm has attracted a lot of attention in MPM because of the reduced tissue scattering at long wavelengths [29], and significant effort has been made to generate energetic pulses at 1060 nm to 1700 nm in fiber-based systems [30–32], including higher-order-mode fibers [33–37]. However, energetic (e.g., > 10 nJ pulse energy), wavelength-tunable soliton sources at the spectral window between 1060 nm and 1300 nm, where high-energy pulses are difficult to generate by a mode-locked laser (e.g., the Ti:Sapphire laser), have not yet been demonstrated. The generation of energetic femtosecond pulses between 1060 nm and 1300 nm today typically requires an optical parametric oscillator (OPO) or an optical parametric amplifier (OPA).
In this paper, we explore the long wavelength limit of SSFS in silica-based fibers, and demonstrate SSFS in a silica LMA fiber with an Aeff ~760 μm2. The generated solitons are wavelength tunable from 1580 nm to 2520 nm, with a pulse energy up to 73 nJ and a pulse width ~100 fs. We perform second harmonic generation (SHG) of the solitons (data shown from 950 to 1260 nm), with pulse energy up to 21 nJ. The frequency-doubled soliton source has large wavelength tuning range, short pulse duration, and high pulse energy. Finally, in vivo two-photon fluorescence imaging of vasculature and neurons in a mouse brain is shown as one of the potential applications by using 1150 nm as the excitation wavelength.
2. Experimental results
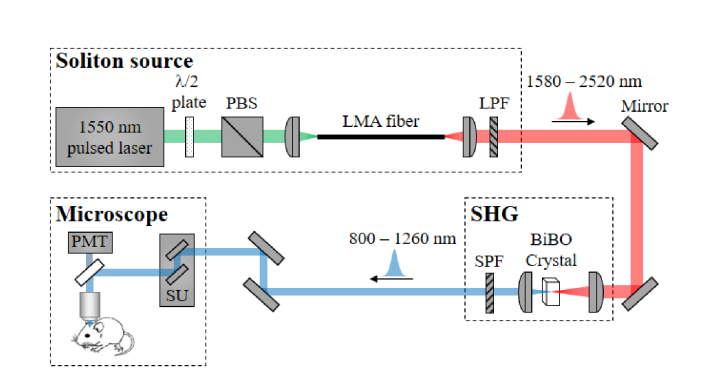
The experimental setup is shown in Fig. 1. The first pump source in our experiment is a fiber-based femtosecond laser (FLCPA-02C, Calmar), delivering 412-fs and linearly polarized pulses with 0.66-MHz repetition rate at 1550 nm. SSFS is performed in a 2-m LMA fiber (LMA-PM-40-FUD, NKT Photonics, which is similar to DC-200/40-PZ-Si, NKT Photonics) with an Aeff of ~760 ± 100 μm2 at 1550 nm. The coupling efficiency is measured to be ~64% (measured at the low input power of ~36 mW, using a C-coated lens with a focal length of 50 mm). With the increase of the input pump power, solitons form and continuously shift from 1580 nm to 2520 nm. To separate the most red-shifted soliton from the residual input and other solitons, long-pass or band-pass filters are used. Pulses at the wavelength between 950 nm and 1260 nm are then obtained by SHG of the soliton source, using a frequency-doubling crystal BiBO (θ = 8°, φ = 0°, L = 1.5 mm, Castech). A short-pass filter is then used to separate the SHG from the solitons. To demonstrate the potential of this source for long-wavelength two-photon microscopy, pulses at 1150 nm are sent into a microscopy and used for in vivo imaging of vasculature and neurons in a mouse brain.
Fig. 1.
Experimental setup of the soliton generation, SHG, and two-photon excited fluorescence imaging. PBS, polarization beam splitter; LPF, long-pass filter; SPF, short-pass filter; SU, scanning unit; PMT, photomultiplier tube.
2.1 Soliton generation
Numerical results of launching 1 μJ and 412 fs Gaussian-shaped pulses at 1550 nm into the fundamental mode of a 2-m-long LMA fiber are shown in Fig. 2. The numerical simulation is performed in the same manner as described in [15]. The dispersion of the LMA fiber is assumed to be identical to silica glass, since the waveguide dispersion for the LMA fiber is negligible. The linear propagation loss α is set to be 0.1 dB/m. Since the output pulse of the pump source has some side lobes, which don’t contribute to the SSFS process, the pulse energy used in the numerical simulation is scaled down to 65% of the pulse energy used in the experiments to better match the experimental data. The spectral and temporal evolution of the pulses along the fiber exhibit the main feature of SSFS, as shown in Fig. 2. The input pulse excites a higher-order soliton and experiences soliton-effect compression. On reaching its minimum pulse duration, the pulse breaks up into a series of fundamental solitons, under the perturbation of higher-order dispersion and Raman scattering. These solitons experience dispersion and frequency shift toward lower frequencies (intrapulse SRS), and eventually separate spectrally and temporally. A comparison of numerical simulations and experimental results is shown in Fig. 3.
Fig. 2.
Simulation results for (a) spectral output, (b) spectral evolution, (c) temporal output, and (d) temporal evolution in the LMA fiber.
Fig. 3.
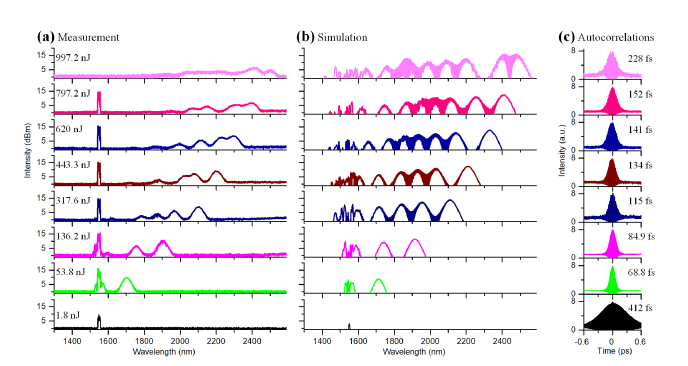
Measured (a) and simulated (b) spectra of SSFS in a 2-m-long LMA fiber. The input pulse energies given in (a) are already scaled by the coupling efficiency (64%). A 1720-nm LP filter is used to remove the residue 1550 nm light at the input pulse energy of 997.2 nJ. (c) Measured second-order interferometric autocorrelation of the input pulse (bottom) and the most red-shifted solitons. The pulse widths (FWHMs) are indicated in the plots using the deconvolution factor of 1.54 for sech2 intensity profile. For display purpose, the traces are offset along the vertical axis.
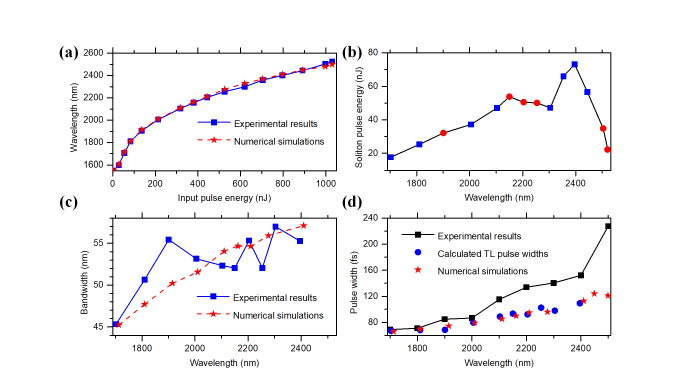
We first characterize the solitons. Experimental results and numerical simulations for a number of input pulse energies are shown in Figs. 3(a) and 3(b), respectively. The soliton continuously shifts to longer wavelengths as input pulse energy increases and thus, the wavelength of the most red-shifted soliton can be tuned by adjusting the input pulse energy, as shown in Fig. 3(a). Note that the input pulse energies given in Fig. 3 are already scaled by the coupling efficiency (64%). The center wavelengths of the most red-shifted solitons as a function of the input pulse energy into the LMA fiber are shown in Fig. 4(a). The longest center wavelength is 2520 nm. The experimental results (blue solid line with squares) and numerical simulations (red dashed line with stars) are both shown in Fig. 4(a). The pulse energy of the most red-shifted soliton is measured by using long-pass (LP, 1630 nm, 1720 nm, 1950 nm, Semrock) or band-pass (BP, 2000-2250 nm, 2250-2500 nm, 2500-2750 nm, Thorlabs) filters and a power meter, taking into account of the transmission of the filters and the collimation lens. The measured soliton energies as a function of the soliton wavelength are shown in Fig. 4(b). The data points represented by the solid squares are directly measured using filters and power meters. Because of the lack of LP or BP filters, for the data points represented by the solid circles, we first measured the total power of the entire filtered spectra using a power meter, and then calculated the power of the most red-shifted soliton using the measured spectra (i.e., by calculating the power underneath the soliton spectrum as a fraction of the power of the entire filtered spectrum). The general trend that the soliton pulse energy increases as its center wavelength increases is observed for wavelength below 2400 nm. The pulse energy has a small dip at ~2200 nm and a rapid drop for > 2400 nm, which can be explained by absorption by silica glass and the OH-vibrational overtones of water content in the fiber (see next section). For the most red-shifted solitons, the bandwidths as a function of the soliton wavelength are shown in Fig. 4(c), and the measured second-order interferometric autocorrelation traces are shown in Fig. 3(c). The pulse widths as a function of the soliton wavelength are shown in Fig. 4(d). In particular, there is a good agreement between the numerical simulations (red stars) and the transform-limited (TL) pulse widths (blue solid circles) calculated from the measured bandwidths [Fig. 4(c)], assuming a sech2 intensity profile. The measured pulse widths (black solid lines with squares) are somewhat higher than the TL pulse widths. This pulse broadening may be due to dispersion of the filters and the collimation lens and the decreasing bandwidth at long wavelengths (see next section).
Fig. 4.
(a) Center wavelengths of the most red-shifted solitons as a function of the input pulse energy into the LMA fiber. Numerical simulations: red dashed line with stars; experimental results: blue solid line with squares. (b) Measured pulse energies of the most red-shifted solitons at various soliton wavelengths. (c) Bandwidths of the most red-shifted solitons at various soliton wavelengths. Numerical simulations: red dashed line with stars; experimental results: blue solid line with squares. (d) Pulse widths of the most red-shifted solitons at various soliton wavelengths. Numerical simulations: red stars; calculated pulse widths assuming TL sech2 pulse using the bandwidths in (c): blue circles; experimental results: black solid line with squares.
2.2 The long wavelength limit of SSFS in silica-based fibers
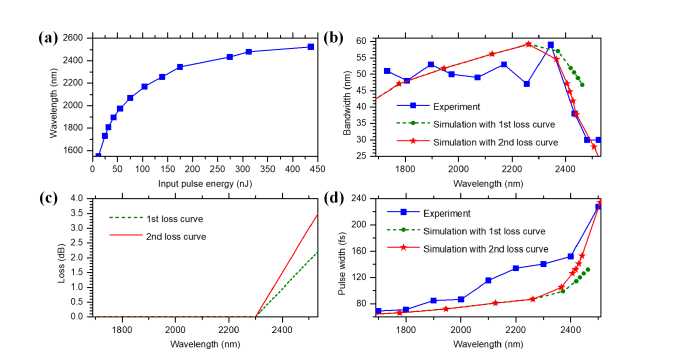
To explore the long wavelength limit of SSFS in silica-based fibers, we conduct further analysis and experiments. To obtain cleaner solitons, we employed an optical parametric amplifier (Monaco-Opera F, Coherent) as the pump source, with shorter pulse width of 70 fs at the wavelength of 1550 nm. The coupling efficiency is measured as 61%. The rest of the experimental configuration is the same as before. The LMA fiber is kept straight to minimize bending loss during these experiments. The measured spectra of SSFS after the LMA fiber are shown in Fig. 5. The center wavelengths of the most red-shifted solitons as a function of the input pulse energy into the LMA fiber are shown in Fig. 6(a). The longest center wavelength is again 2520 nm. Compared to Fig. 4(a), less input pulse energy is required for shifting to the same wavelength due to the shorter and cleaner input pulse. Since there is no overlap in the spectrum between the most red-shifted soliton and the secondary solitons, we can clearly observe that the bandwidth of the most red-shifted soliton starts to narrow after 2350 nm, as shown in Fig. 6(b). This is accompanied by the rapid drop in pulse energy and the increase in pulse width from 2400 nm to 2520 nm, as shown in Figs. 4(b) and 4(d).
Fig. 5.
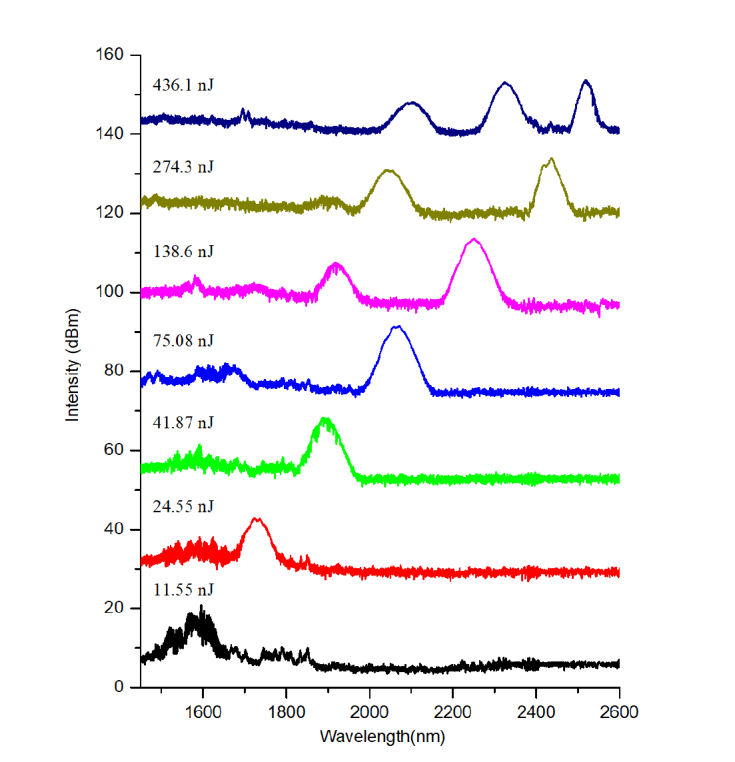
Measured spectra of SSFS in a 2-m-long LMA fiber. The input pulse energies coupled into the LMA fiber are given, with a coupling efficiency of 61%. For display purpose, the traces are offset along the vertical axis.
Fig. 6.
(a) Center wavelengths of the most red-shifted solitons as a function of the input pulse energy into the LMA fiber. (b) Bandwidths of the most red-shifted solitons at various soliton wavelengths. (c) Loss curves used in numerical simulations. (d) Pulse widths of the most red-shifted solitons at various soliton wavelengths.
We performed numerical simulations with increasing loss at the long wavelength, to investigate the impact of light absorption by silica and residue water content on SSFS. The loss due to silica absorption starts around 2300 nm and increases for longer wavelengths, whereas the loss due to water absorption starts around 1800 nm and increases for longer wavelengths as well [38]. The first loss curve we used in the numerical simulation is similar to the loss of bulk dry silica [38], as shown in Fig. 6(c). The bandwidth and pulse width of the simulation results are shown in Figs. 6(b) and 6(d), respectively, which significantly underestimates the decrease in pulse bandwidth when compared to the experimental results. This result shows that absorption by silica glass alone cannot account for the long wavelength limit of SSFS, and other loss mechanisms, such as OH-absorption, may also contribute. The evidence of OH-absorption is manifested by the experimentally measured soliton pulse energy and bandwidth. Both show a dip between 2200 nm and 2400 nm [Figs. 4(b) and 6(b)], which coincides with the OH-absorption peak around 2200 nm [38]. The second loss curve we used in our numerical simulation also starts around 2300 nm but increases faster than the first loss curve, as shown in Fig. 6(c). The bandwidth and pulse width of the simulation results are shown in Figs. 6(b) and 6(d), respectively. The agreement between experimental results and numerical simulation results with the second loss curve is much improved. Therefore, SSFS in the LMA fiber is most likely limited by absorption of both silica and the residue water content. However, even without water absorption, the longest wavelength of SSFS in silica-based fibers will still be limited by the absorption of silica glass to approximately 2400 nm in order not to suffer significant loss of soliton energy and bandwidth [see simulation results in Figs. 6(b) and 6(d)].
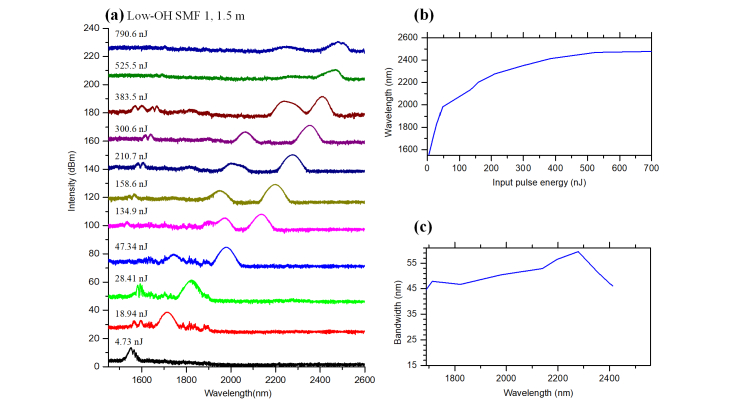
These conclusions on the long wavelength limit are further supported by SSFS experiments performed using a low-OH single mode optical fiber (experimental fiber from Corning, the parameters are similar to those of SMF-28 except for the low-OH feature. The attenuation due to OH at 1380 nm is about 0.026 dB/km). The measured spectra of SSFS after the low-OH SMF are shown in Fig. 7(a). The center wavelengths of the most red-shifted solitons as a function of the input pulse energy are shown in Fig. 7(b). The longest center wavelength is again ~2500 nm. The bandwidth of the most red-shifted solitons is shown in Fig. 7(c), which again starts to decrease around 2300 nm. Interestingly, the soliton bandwidth doesn’t have the dip between 2200 nm and 2400 nm as shown in Figs. 4(b) and 6(b), confirming that absorption due to the water content in the low-OH fiber is negligible.
Fig. 7.
(a) Measured spectra of SSFS in the low-OH single mode fiber, with the input pulse energies before fiber coupling. For display purpose, the traces are offset along the vertical axis. (b) Center wavelengths of the most red-shifted solitons as a function of the input pulse energy before fiber coupling. (c) Bandwidths of the most red-shifted solitons at various soliton wavelengths.
2.3 Second harmonic generation
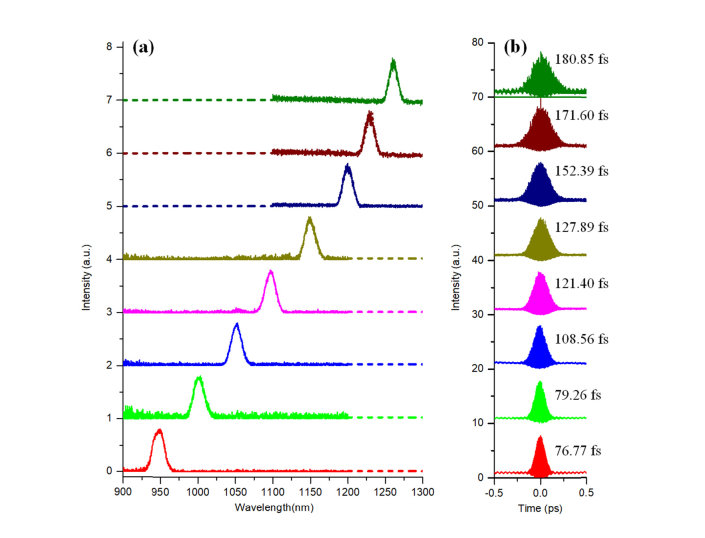
We then characterize the SHG pulses generated from the fiber-based soliton source (Fig. 4). The measured spectra of the SHG pulses are shown in Fig. 8(a). The bandwidths of the spectra centered from 950 nm to 1260 nm vary from 15 nm to 19 nm. The measured second-order interferometric autocorrelation traces are shown in Fig. 8(b). For SHG pulses from 950 nm to 1260 nm, the deconvolved pulse widths [Fig. 8(b)] increase from 77 fs to 180 fs (using the deconvolution factor of 1.54 for sech2 intensity profile), following a similar trend as the soliton pulse width. These results are longer than the calculated transform-limited pulse durations assuming sech2 profiles (from 52 fs to 106 fs), which is likely due to group velocity mismatch [26]. The stability of the SHG pulses at 1150 nm is characterized by measuring the two-photon current generated in a GaAsP photodiode when excited by the source. The measured root-mean-square (RMS) fluctuation of the two-photon signal is 3.274% (from 0.003 kHz to 50 kHz). The pulse energy of the SHG pulses at 1150 nm is measured to be 21 nJ, corresponding to a conversion efficiency of 44.6% for the fundamental wavelength at 2300 nm. Higher conversion efficiency has been demonstrated using the same crystal for SHG at other wavelengths [26,39]. Assuming similar SHG efficiency, the pulse energy for 950 nm to 1260 nm will be in the range of 13 nJ to 32 nJ, with the peak pulse energy at ~1200 nm. To achieve the highest conversion efficiency, however, the orientation of the SHG crystal should be adjusted to the phase-matching angle for each input wavelength. This may produce slightly different beam pointing. The beam pointing problem can be solved by using a periodically poled lithium niobate (PPLN) for SHG.
Fig. 8.
(a) Measured spectra of the SHG pulses. (b) Measured second-order interferometric autocorrelation of the corresponding SHG pulses. For display purpose, the traces are offset along the vertical axis.
2.4 In vivo two-photon excited fluorescence imaging
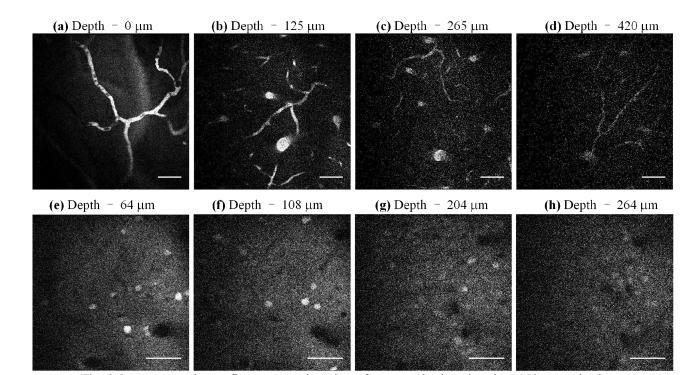
One of our main motivations and practical applications of pushing the long wavelength limit of SSFS in LMA silica fibers is to create a convenient femtosecond source for long-wavelength MPM at wavelength range beyond that of a mode-locked Ti:Sapphire laser. To demonstrate the applications of our source (using the fiber-based femtosecond laser and SSFS), we imaged vasculature and neurons in a mouse brain in vivo. The mouse is 3-month old. The overlying skull was removed by performing a craniotomy before imaging. The vasculature was labelled by a retro-orbital injection of dextran-coupled Texas-Red dye (Invitrogen). The excitation wavelength is 1150 nm. Mouse brain vasculature down to 420 μm below the surface of the brain [Figs. 9(a)-9(d)] can be obtained with a maximum optical power on the brain surface of 2 mW (i.e., 3 nJ). We also imaged red fluorescent protein (RFP) labelled neurons in a B6.Cg-Tg(Thy-Brainbow1.0)HLich/J mouse, with a depth of 264 μm [Figs. 9(e)-9(h)].
Fig. 9.
In vivo two-photon fluorescence imaging of a mouse brain using the 1150 nm pulsed excitation. (a-d) Images of vasculature at different depths, no average. (e-h) Images of neurons, 4 frame averaged. The images were acquired at 4 s/frame and 512x512 pixels/frame. Scale bar: 50 μm.
Figure 9 showed that the fiber-based femtosecond source and SSFS can provide energetic femtosecond pulses for two-photon imaging at wavelengths currently only reachable by OPO or OPA. While the pulse energy is adequate, the average power, and therefore the repetition rate, demonstrated here is too low for optimum two-photon imaging [39]. The average power is limited by the fiber-based femtosecond laser used in this work. However, it is relatively straightforward to scale up the average power (i.e., scaling up the repetition rate) of fiber-based femtosecond laser at 1550 nm while maintaining the same pulse energy [39]. For two-photon deep tissue imaging in the mouse brain, the optimum repetition rate for many common fluorophores is between 1 and 10 MHz [39]. This is a result of the trade-off between the average power at the sample surface and the peak power at the focus. The low repetition rate for deep imaging potentially limits the ability for fast imaging of dynamic phenomena since a minimum of one excitation pulse per pixel is required. Our demonstration shows that SSFS in a silica-based LMA fiber, together with SHG, is a possible approach for obtaining energetic (> 20 nJ), wavelength-tunable femtosecond pulses at > 1060 nm for long-wavelength two-photon microscopy. On the other hand, material absorption in a silica-based fiber appears to limit the longest wavelength of such an approach to ~1260 nm, which only partially overlaps with the long wavelength window of 1300 nm for deep tissue imaging (~1200 nm to 1350 nm) [22]. Further optimizations of the fiber design, e.g., perhaps with heavy Germanium doping, will be needed to push the long wavelength limit of this approach and expand the spectral coverage.
3. Conclusions
In summary, we explore the long wavelength limit of SSFS in silica-based fiber experimentally and using numerical simulation. We found that the longest wavelength soliton generated by SSFS is approximately 2500 nm. The soliton loses its energy rapidly at wavelength beyond 2400 nm due to absorption by silica and residue water content. We demonstrate a 1580-2520 nm wavelength-tunable, high-pulse energy soliton source. Efficient SHG from 950 to 1260 nm is obtained, and its potential application for in vivo two-photon fluorescence microscopy is demonstrated. By increasing the repetition rate and further improving the pulse quality (e.g., reducing the pulse width and the pedestal) of the energetic fiber-based femtosecond laser, the demonstrated method has the potential to provide a low-cost, wavelength-tunable, energetic femtosecond source for long-wavelength two-photon microscopy at the spectral range currently only reachable with OPOs or OPAs.
Acknowledgment
The authors thank all the members in Xu group and Yuxing Tang from Wise group.
Funding
National Institutes of Health/National Institute of Biomedical Imaging and Bioengineering (NIH/NIBIB) (R01EB017274); National Science Foundation NeuroNex Grant (DBI-1707312).
References and links
- 1.Liu X., Xu C., Knox W. H., Chandalia J. K., Eggleton B. J., Kosinski S. G., Windeler R. S., “Soliton self-frequency shift in a short tapered air-silica microstructure fiber,” Opt. Lett. 26(6), 358–360 (2001). 10.1364/OL.26.000358 [DOI] [PubMed] [Google Scholar]
- 2.Judge A. C., Bang O., Eggleton B. J., Kuhlmey B. T., Magi E. C., Pant R., de Sterke C. M., “Optimization of the soliton self-frequency shift in a tapered photonic crystal fiber,” J. Opt. Soc. Am. B 26(11), 2064–2071 (2009). 10.1364/JOSAB.26.002064 [DOI] [Google Scholar]
- 3.Skryabin D. V., Luan F., Knight J. C., Russell P. S., “Soliton self-frequency shift cancellation in photonic crystal fibers,” Science 301(5640), 1705–1708 (2003). 10.1126/science.1088516 [DOI] [PubMed] [Google Scholar]
- 4.Wang K., Xu C., “Tunable high-energy soliton pulse generation from a large-mode-area fiber and its application to third harmonic generation microscopy,” Appl. Phys. Lett. 99(7), 071112 (2011). 10.1063/1.3628337 [DOI] [PubMed] [Google Scholar]
- 5.Tang Y., Wright L. G., Charan K., Wang T., Xu C., Wise F. W., “Generation of intense 100 fs solitons tunable from 2 to 4.3μm in fluoride fiber,” Optica 3(9), 948–951 (2016). 10.1364/OPTICA.3.000948 [DOI] [Google Scholar]
- 6.Gordon J. P., “Theory of the soliton self-frequency shift,” Opt. Lett. 11(10), 662–664 (1986). 10.1364/OL.11.000662 [DOI] [PubMed] [Google Scholar]
- 7.Mitschke F. M., Mollenauer L. F., “Discovery of the soliton self-frequency shift,” Opt. Lett. 11(10), 659–661 (1986). 10.1364/OL.11.000659 [DOI] [PubMed] [Google Scholar]
- 8.Zysset B., Beaud P., Hodel W., “Generation of optical solitons in the wavelength region 1.37–1.49 μm,” Appl. Phys. Lett. 50(16), 1027–1029 (1987). 10.1063/1.97959 [DOI] [Google Scholar]
- 9.Nishizawa N., Goto T., “Compact system of wavelength-tunable femtosecond soliton pulse generation using optical fibers,” IEEE Photonics Technol. Lett. 11(3), 325–327 (1999). 10.1109/68.748223 [DOI] [Google Scholar]
- 10.Fedotov A. B., Voronin A. A., Fedotov I. V., Ivanov A. A., Zheltikov A. M., “Powerful wavelength-tunable ultrashort solitons in a solid-core photonic-crystal fiber,” Opt. Lett. 34(6), 851–853 (2009). 10.1364/OL.34.000851 [DOI] [PubMed] [Google Scholar]
- 11.Chan M. C., Chia S. H., Liu T. M., Tsai T. H., Ho M. C., Ivanov A. A., Zheltikov A. M., Liu J. Y., Liu H. L., Sun C. K., “1.2- to 2.2-μm tunable Raman soliton source based on a Cr:Forsterite laser and a photonic-crystal fiber,” IEEE Photonics Technol. Lett. 20(11), 900–902 (2008). 10.1109/LPT.2008.922339 [DOI] [Google Scholar]
- 12.Koptev M. Y., Anashkina E. A., Andrianov A. V., Dorofeev V. V., Kosolapov A. F., Muravyev S. V., Kim A. V., “Widely tunable mid-infrared fiber laser source based on soliton self-frequency shift in microstructured tellurite fiber,” Opt. Lett. 40(17), 4094–4097 (2015). 10.1364/OL.40.004094 [DOI] [PubMed] [Google Scholar]
- 13.Anashkina E. A., Andrianov A. V., Yu Koptev M., Muravyev S. V., Kim A. V., “Generating femtosecond optical pulses tunable from 2 to 3 μm with a silica-based all-fiber laser system,” Opt. Lett. 39(10), 2963–2966 (2014). 10.1364/OL.39.002963 [DOI] [PubMed] [Google Scholar]
- 14.Cheng T., Kanou Y., Asano K., Deng D., Liao M., Matsumoto M., Misumi T., Suzuki T., Ohishi Y., “Soliton self-frequency shift and dispersive wave in a hybrid four-hole AsSe2-As2S5 microstructured optical fiber,” Appl. Phys. Lett. 104(12), 121911 (2014). 10.1063/1.4869756 [DOI] [Google Scholar]
- 15.Wang K., Horton N. G., Charan K., Xu C., “Advanced fiber soliton sources for nonlinear deep tissue imaging in biophotonics,” IEEE J. Sel. Top. Quantum Electron. 20(2), 50–60 (2014). 10.1109/JSTQE.2013.2276860 [DOI] [Google Scholar]
- 16.Denk W., Strickler J. H., Webb W. W., “Two-photon laser scanning fluorescence microscopy,” Science 248(4951), 73–76 (1990). 10.1126/science.2321027 [DOI] [PubMed] [Google Scholar]
- 17.Xu C., Webb W. W., “Measurement of two-photon excitation cross sections of molecular fluorophores with data from 690 to 1050 nm,” J. Opt. Soc. Am. B 13(3), 481–491 (1996). 10.1364/JOSAB.13.000481 [DOI] [Google Scholar]
- 18.Kerr J. N. D., Denk W., “Imaging in vivo: watching the brain in action,” Nat. Rev. Neurosci. 9(3), 195–205 (2008). 10.1038/nrn2338 [DOI] [PubMed] [Google Scholar]
- 19.Dombeck D. A., Harvey C. D., Tian L., Looger L. L., Tank D. W., “Functional imaging of hippocampal place cells at cellular resolution during virtual navigation,” Nat. Neurosci. 13(11), 1433–1440 (2010). 10.1038/nn.2648 [DOI] [PMC free article] [PubMed] [Google Scholar]
- 20.Olivier N., Luengo-Oroz M. A., Duloquin L., Faure E., Savy T., Veilleux I., Solinas X., Débarre D., Bourgine P., Santos A., Peyriéras N., Beaurepaire E., “Cell lineage reconstruction of early zebrafish embryos using label-free nonlinear microscopy,” Science 329(5994), 967–971 (2010). 10.1126/science.1189428 [DOI] [PubMed] [Google Scholar]
- 21.Williams R. M., Flesken-Nikitin A., Ellenson L. H., Connolly D. C., Hamilton T. C., Nikitin A. Y., Zipfel W. R., “Strategies for high-resolution imaging of epithelial ovarian cancer by laparoscopic nonlinear microscopy,” Transl. Oncol. 3(3), 181–194 (2010). 10.1593/tlo.09310 [DOI] [PMC free article] [PubMed] [Google Scholar]
- 22.Horton N. G., Wang K., Kobat D., Clark C. G., Wise F. W., Schaffer C. B., Xu C., “In vivo three-photon microscopy of subcortical structures within an intact mouse brain,” Nat. Photonics 7(3), 205–209 (2013). 10.1038/nphoton.2012.336 [DOI] [PMC free article] [PubMed] [Google Scholar]
- 23.Sinefeld D., Paudel H. P., Ouzounov D. G., Bifano T. G., Xu C., “Adaptive optics in multiphoton microscopy: comparison of two, three and four photon fluorescence,” Opt. Express 23(24), 31472–31483 (2015). 10.1364/OE.23.031472 [DOI] [PMC free article] [PubMed] [Google Scholar]
- 24.Ouzounov D. G., Wang T., Wang M., Feng D. D., Horton N. G., Cruz-Hernández J. C., Cheng Y. T., Reimer J., Tolias A. S., Nishimura N., Xu C., “In vivo three-photon imaging of activity of GCaMP6-labeled neurons deep in intact mouse brain,” Nat. Methods 14(4), 388–390 (2017). 10.1038/nmeth.4183 [DOI] [PMC free article] [PubMed] [Google Scholar]
- 25.H. Tu and S. A. Boppart, “Versatile photonic crystal fiber-enabled source for multi-modality biophotonic imaging beyond conventional multiphoton microscopy,” in Proc. SPIE, (SPIE, 2010), 75692D. [Google Scholar]
- 26.Wang K., Liu T.-M., Wu J., Horton N. G., Lin C. P., Xu C., “Three-color femtosecond source for simultaneous excitation of three fluorescent proteins in two-photon fluorescence microscopy,” Biomed. Opt. Express 3(9), 1972–1977 (2012). 10.1364/BOE.3.001972 [DOI] [PMC free article] [PubMed] [Google Scholar]
- 27.Krauss G., Hanke T., Sell A., Träutlein D., Leitenstorfer A., Selm R., Winterhalder M., Zumbusch A., “Compact coherent anti-Stokes Raman scattering microscope based on a picosecond two-color Er:fiber laser system,” Opt. Lett. 34(18), 2847–2849 (2009). 10.1364/OL.34.002847 [DOI] [PubMed] [Google Scholar]
- 28.Huang J.-Y., Guo L.-Z., Wang J.-Z., Li T.-C., Lee H.-J., Chiu P.-K., Peng L.-H., Liu T.-M., “Fiber-based 1150-nm femtosecond laser source for the minimally invasive harmonic generation microscopy,” J. Biomed. Opt. 22(3), 36008 (2017). 10.1117/1.JBO.22.3.036008 [DOI] [PubMed] [Google Scholar]
- 29.Dana H., Mohar B., Sun Y., Narayan S., Gordus A., Hasseman J. P., Tsegaye G., Holt G. T., Hu A., Walpita D., Patel R., Macklin J. J., Bargmann C. I., Ahrens M. B., Schreiter E. R., Jayaraman V., Looger L. L., Svoboda K., Kim D. S., “Sensitive red protein calcium indicators for imaging neural activity,” eLife 5, e12727 (2016). 10.7554/eLife.12727 [DOI] [PMC free article] [PubMed] [Google Scholar]
- 30.Chung H.-Y., Liu W., Cao Q., Song L., Kärtner F. X., Chang G., “Megawatt peak power tunable femtosecond source based on self-phase modulation enabled spectral selection,” Opt. Express 26(3), 3684–3695 (2018). 10.1364/OE.26.003684 [DOI] [PubMed] [Google Scholar]
- 31.Liu W., Chia S.-H., Chung H.-Y., Greinert R., Kärtner F. X., Chang G., “Energetic ultrafast fiber laser sources tunable in 1030-1215 nm for deep tissue multi-photon microscopy,” Opt. Express 25(6), 6822–6831 (2017). 10.1364/OE.25.006822 [DOI] [PubMed] [Google Scholar]
- 32.You S., Tu H., Chaney E. J., Sun Y., Zhao Y., Bower A. J., Liu Y.-Z., Marjanovic M., Sinha S., Pu Y., Boppart S. A., “Intravital imaging by simultaneous label-free autofluorescence-multiharmonic microscopy,” Nat. Commun. 9(1), 2125 (2018). 10.1038/s41467-018-04470-8 [DOI] [PMC free article] [PubMed] [Google Scholar]
- 33.Lee J. H., van Howe J., Xu C., Ramachandran S., Ghalmi S., Yan M. F., “Generation of femtosecond pulses at 1350 nm by Cerenkov radiation in higher-order-mode fiber,” Opt. Lett. 32(9), 1053–1055 (2007). 10.1364/OL.32.001053 [DOI] [PubMed] [Google Scholar]
- 34.van Howe J., Lee J. H., Zhou S., Wise F., Xu C., Ramachandran S., Ghalmi S., Yan M. F., “Demonstration of soliton self-frequency shift below 1300 nm in higher-order mode, solid silica-based fiber,” Opt. Lett. 32(4), 340–342 (2007). 10.1364/OL.32.000340 [DOI] [PubMed] [Google Scholar]
- 35.Pedersen M. E. V., Cheng J., Charan K., Wang K., Xu C., Grüner-Nielsen L., Jakobsen D., “Higher-order-mode fiber optimized for energetic soliton propagation,” Opt. Lett. 37(16), 3459–3461 (2012). 10.1364/OL.37.003459 [DOI] [PubMed] [Google Scholar]
- 36.L. Rishøj, B. Tai, P. Kristensen, and S. Ramachandran, “Characterization of Intermodal Group Index Matched Soliton Interactions leading to MW Peak Powers at 1300 nm,” in Conference on Lasers and Electro-Optics, (Optical Society of America, 2017), STh3K.2. 10.1364/CLEO_SI.2017.STh3K.2 [DOI] [Google Scholar]
- 37.Tai B., Rishøj L., Ramachandran S., “Ultrafast, high energy, wideband wavelength conversion via continuous intra-pulse and discrete intermodal Raman scattering,” in Conference on Lasers and Electro-Optics, (Optical Society of America, 2018), SM1K.1. 10.1364/CLEO_SI.2018.SM1K.1 [DOI] [Google Scholar]
- 38.Humbach O., Fabian H., Grzesik U., Haken U., Heitmann W., “Analysis of OH absorption bands in synthetic silica,” J. Non-Cryst. Solids 203, 19–26 (1996). 10.1016/0022-3093(96)00329-8 [DOI] [Google Scholar]
- 39.Charan K., Li B., Wang M., Lin C. P., Xu C., “Fiber-based tunable repetition rate source for deep tissue two-photon fluorescence microscopy,” Biomed. Opt. Express 9(5), 2304–2311 (2018). 10.1364/BOE.9.002304 [DOI] [PMC free article] [PubMed] [Google Scholar]


