Abstract
Nutrient pollution is a widespread water quality problem, which originates from excess nutrient runoff from agricultural land, improperly managed farming operations, and point sources such as wastewater treatment plants. Some nutrient pollution impacts include harmful algal blooms (HABs), hypoxia, and eutrophication. HABs are major environmental events that cause severe health threats and economic losses (e.g., tourism, real estate, commercial fishing). A dimension of the nutrient pollution problem that has not received much attention is that this interacts with organic waste management practices. As a result, it is important to connect the time and location of point and nonpoint nutrient source releases, nutrient soil content, spatial layout, and hydrology of agricultural lands with the transport of nutrients to water bodies and their impacts on aquatic ecosystems. In this work, we show how nutrient concentration in water bodies and other spatiotemporal factors are related to HAB development and how logistics management of livestock waste can be used to conduct space–time management of nutrient pollution. A case study for the Upper Yahara Watershed in the State of Wisconsin (U.S.) is employed to demonstrate the practicability of the modeling framework. Our framework reveals that logistics network management for waste and nutrients can reduce the incidence rates of HABs, but reducing it to nonharmful levels would require long-term efforts such as installing nutrient recovery technologies, coordinating manure storage and application, and deploying management incentive plans.
Keywords: logistics network, livestock waste, multiscale, nutrient pollution, harmful algal blooms, nutrient transport
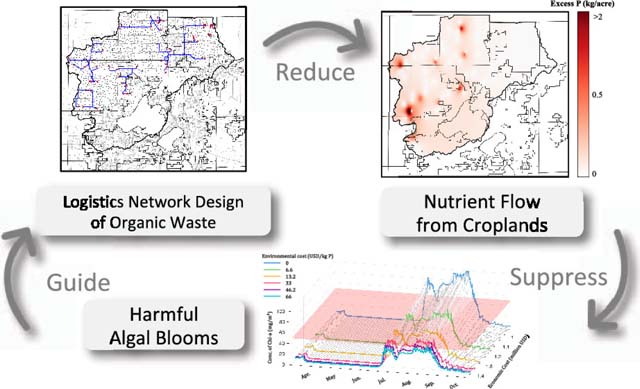
Graphical Abstract
Introduction
Anthropogenic nutrient pollution, primarily consisting of nitrogen and phosphorus, is one of the most widespread water quality problems facing the U.S., with far-ranging repercussions for environmental quality, human health, and economic success. Sources of nutrient pollution are classified as either nonpoint or point sources. Nonpoint sources include nutrient releases from agricultural land, natural land, and stormwater, while point sources include nutrient releases from permitted facilities such as wastewater treatment plants (WWTPs).a Particularly, harmful algal blooms (HABs) represent a critical and challenging nutrient pollution impact. Excess nutrient releases act as a predictor of lowering water quality.(1) A number of studies have been conducted to identify the nutrient pollution hot spots either from a holistic material flow perspective(2) or for a particular geographical location.(3)
Algal species generate significant levels of toxins that threaten human and aquatic life. Rapid algae growth is associated with subsequent decreases in dissolved oxygen content of the water body, resulting in widespread die-offs of aquatic life. HABs have economic impacts in the form of remediation costs for water treatment and reduction in real estate values of impacted areas. Specifically, algae create unpleasant odors and visual esthetics that decrease the value of recreational water systems.(4) In 2009, it was estimated that 30% of the lakes from 36 states in the U.S. have reported toxic cyanobacterial bloom issues.(5) The U.S. Environmental Protection Agency (U.S. EPA) estimates that nutrient pollution and associated HABs lead to annual tourism losses of one billion dollars and to commercial fishing annual losses of tens of millions of dollars.b
Multiple indicators have been proven to measure nutrient pollution and to estimate the risk and severity of HABs. One simple indicator is the concentration of nitrogen and phosphorus in a water body, which is used by many regulatory bodies for monitoring and controlling water quality. For example, the suggested phosphorus concentration for lake water in the State of Wisconsin is 15–40 mg P/m3.(6)(6) In life cycle assessment studies, the so-called eutrophication potential (EP) metric is usually calculated using nutrient release and fate factors.(7,8) The EP metric is a suitable metric of the long-term impact of nutrient release but neglects short-term seasonal impacts. Diverse indicators have also been developed to directly measure the severeness of HABs such as the Secchi depth, algae cell density, concentration of chlorophyll a (chl a), and concentration of toxins (e.g., microcystins).(9) Carlson(10) proposed a comprehensive indicator, the trophic state index (TSI), which incorporates the Secchi depth, phosphorus concentration, and chl a concentration. The TSI is used in water quality reports to classify the severity of eutrophication of a water body.(11) Specifically, a water body is eutrophic when the TSI is larger than 50 and is hypereutrophic if the TSI is larger than 60.
Nutrient pollution and HAB issues have been widely studied from the perspectives of human health, economic analysis, prediction and monitoring, treatment, and remediation.(12–15) Interestingly, a dimension of the nutrient pollution problem that has not received as much attention is how this interacts with agricultural logistics network (LN) management practices. This is important because the transport of nutrients to water bodies is a spatiotemporal phenomenon that involves multiple scales and that is tightly related to the spatial layout and geography of agricultural lands surrounding the water bodies, to the timing of nutrient source application, and to regional nutrient imbalances. Specifically, by designing an appropriate logistics network that stores, mobilizes, and processes organic waste, it is possible to balance and recycle nutrients more effectively and, with this, control the timing and location of nutrient runoff to water bodies. The value of logistics network management on the mitigation of environmental impacts of livestock waste has been previously analyzed from the perspective of air quality (air emissions and energy efficiency) but not from the perspective of water quality.(16) Akram et al. provide a framework to optimize nutrient recovery using a transportation network in Pakistan and Sweden.(17) Other recent studies have focused on the prediction of nutrient pollution and HABs using statistical modeling and machine learning techniques.(18) Such studies consider diverse factors that affect HAB development such as geography and in-excess nutrient flows but do not offer alternatives into how to influence and control such flows.
In this work, we analyze how logistics networks can be used to enable the spatiotemporal control of in-excess nutrient flows and associated HABs. To do so, we propose a computational framework that incorporates a logistics network model that seeks to identify optimal locations for waste storage and processing technologies, as well as optimal strategies for the mobilization of waste and derived products in a given region.(19,20) In addition, the framework incorporates a medium-fidelity nutrient transport model, which captures the dynamics of the transport process from agriculture lands to water bodies. Moreover, the framework incorporates an algae bloom prediction model that tracks the nutrient concentration of a water body over time and relates this to the algae bloom level. The framework integrates these models to design a four-dimensional model for organic waste management that simultaneously mitigates investment, transportation, operational, and environmental costs. We present a series of case studies in the Upper Yahara Watershed in the State of Wisconsin to illustrate the practicability of the framework
Computational Framework
In this section, we introduce a computational framework to connect the logistics network, nutrient transport, and HAB prediction models. The structure of the framework is summarized in Figure 1. First, data regarding geographical locations, market information, crops, point-source waste weekly supply, and technology information are fed into the logistics network model. The model then outputs the decision-making information (e.g., transportation routes, technology arrangement) together with net nutrient releases at each location. Then, the nonpoint release data obtained from the logistics network model and the point-source data are imported into the nutrient fate and transport model to estimate the amount of nutrients that reach the water body. In the third step, the HAB simulation model takes outputs from previous models to simulate the trend and distribution (over depth) of the concentration of chl a. The results of this model then provide feedback information to the logistics network design procedure, and adjustments can be made when solving the logistics network model. We note that feedback information (i.e., the difference between the actual and suggested chl a concentrations) is not directly incorporated in the logistics network design problem but can be used by a decision-maker to close the loop. In particular, the chl a concentration is an indicator of HAB development as an end-point ecosystem response to nutrient pollution and human health risk; if the risk level is too high (average chl a concentration larger than 50 mg/m3), the decision-maker needs to adjust the design parameters (e.g., environmental cost or type of technology) of the logistics network. These models are solved recursively until the HAB levels are satisfactory or until the model finds that the logistics network alone cannot eliminate HAB threats given the spatial and temporal scopes of uncontrolled externalities (weather, uncontrolled nutrient release, etc.).
Figure 1.
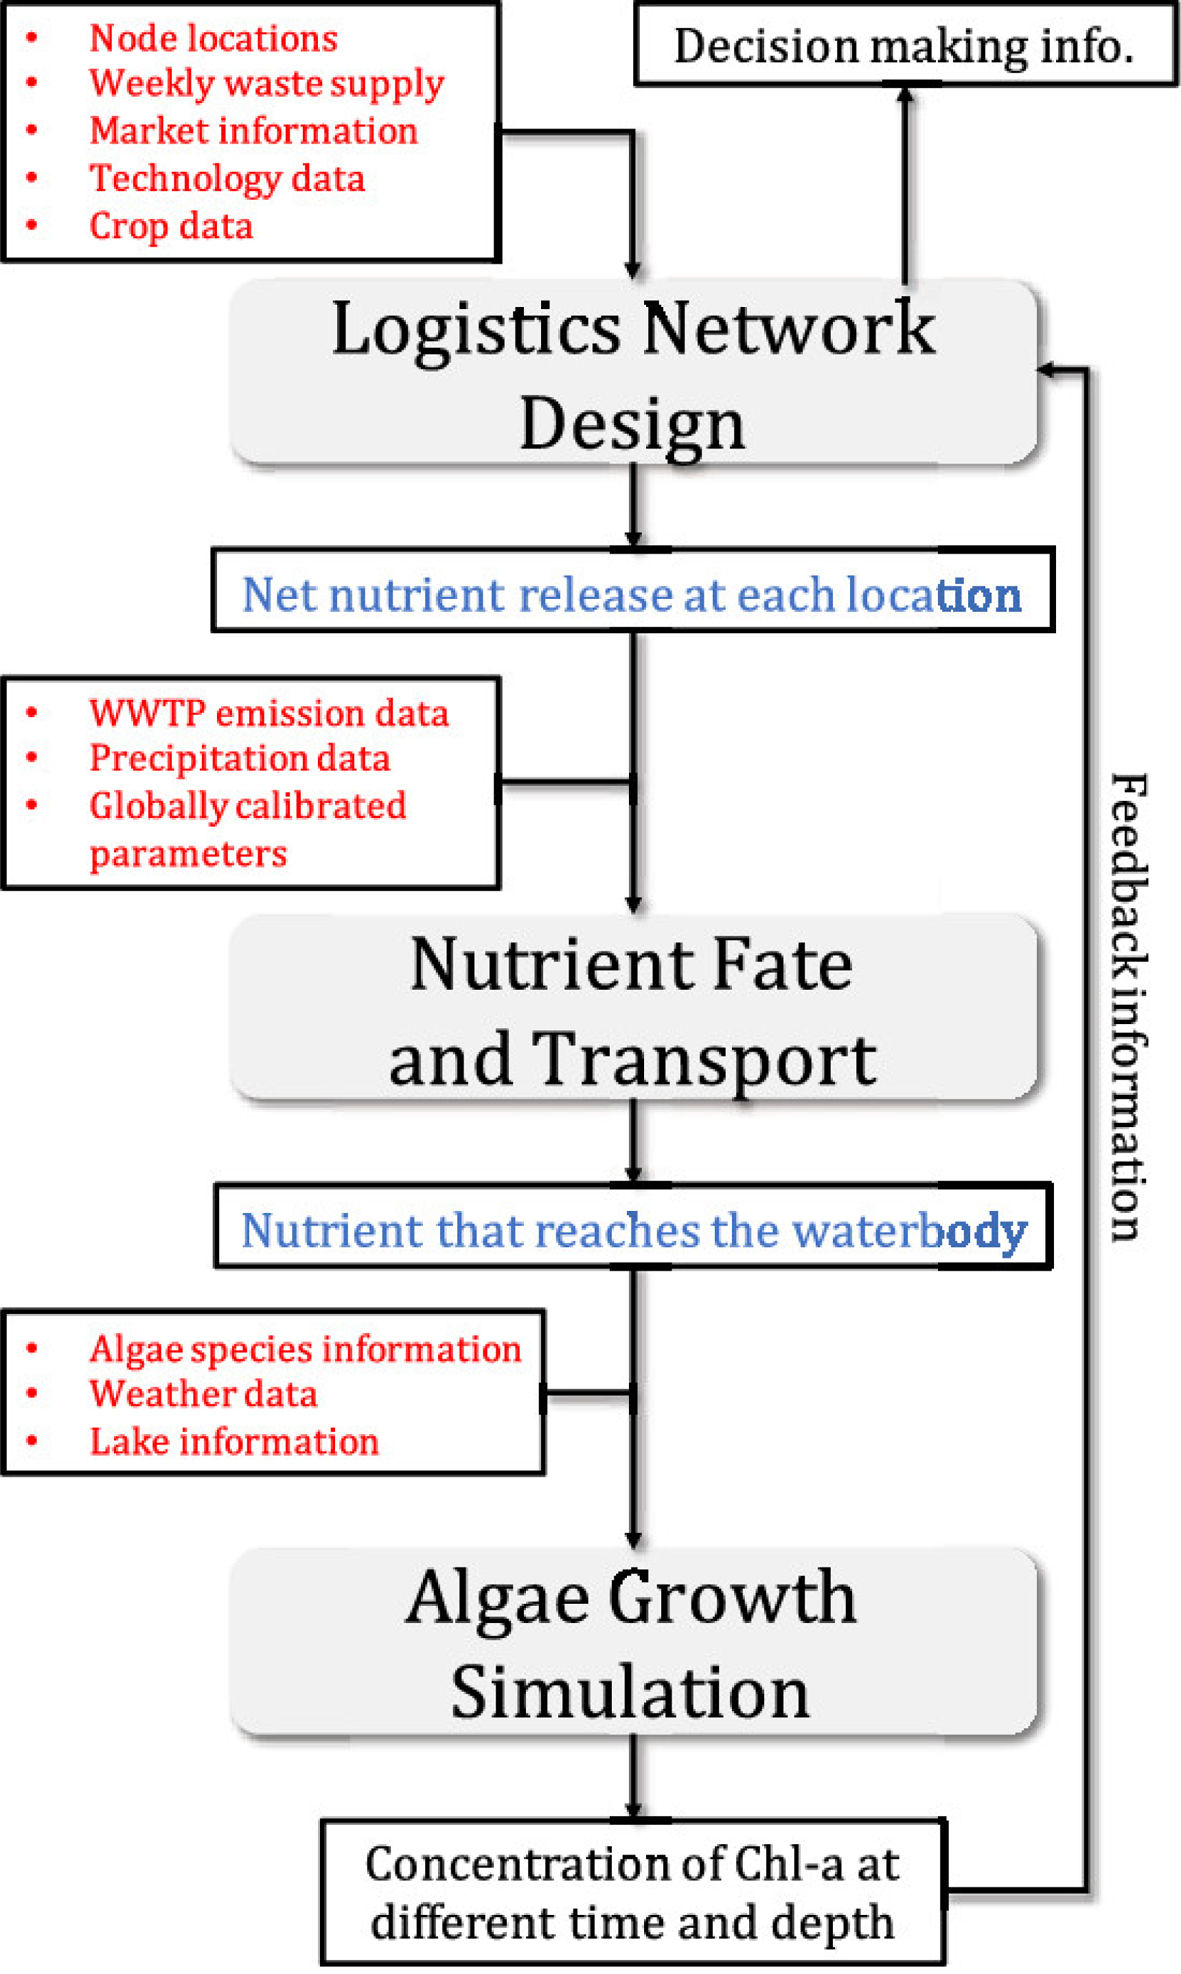
Structure of the proposed computational framework.
Logistics Network Model
In this section, we introduce the logistics network model for organic waste management used in this framework. We extend the logistics network model used in refs (19,20) by incorporating a temporal dimension. This allows us to capture the impact of waste storage, crop growth, seasonality, and nutrient transport dynamics. The logistics network structure is shown in Figure 2. We use N to represent the set of geographical (spatial) nodes (e.g., farms and agriculture lands), N to represent the set of geographical nodes excluding external customers, P to represent the set of materials exchanged and transformed (e.g., raw manure and solid manure), S to represent the set of time periods, and T to represent the set of processing technologies (e.g., solid–liquid separation, granulation). All variables and parameters are defined in the Nomenclature section
Figure 2.
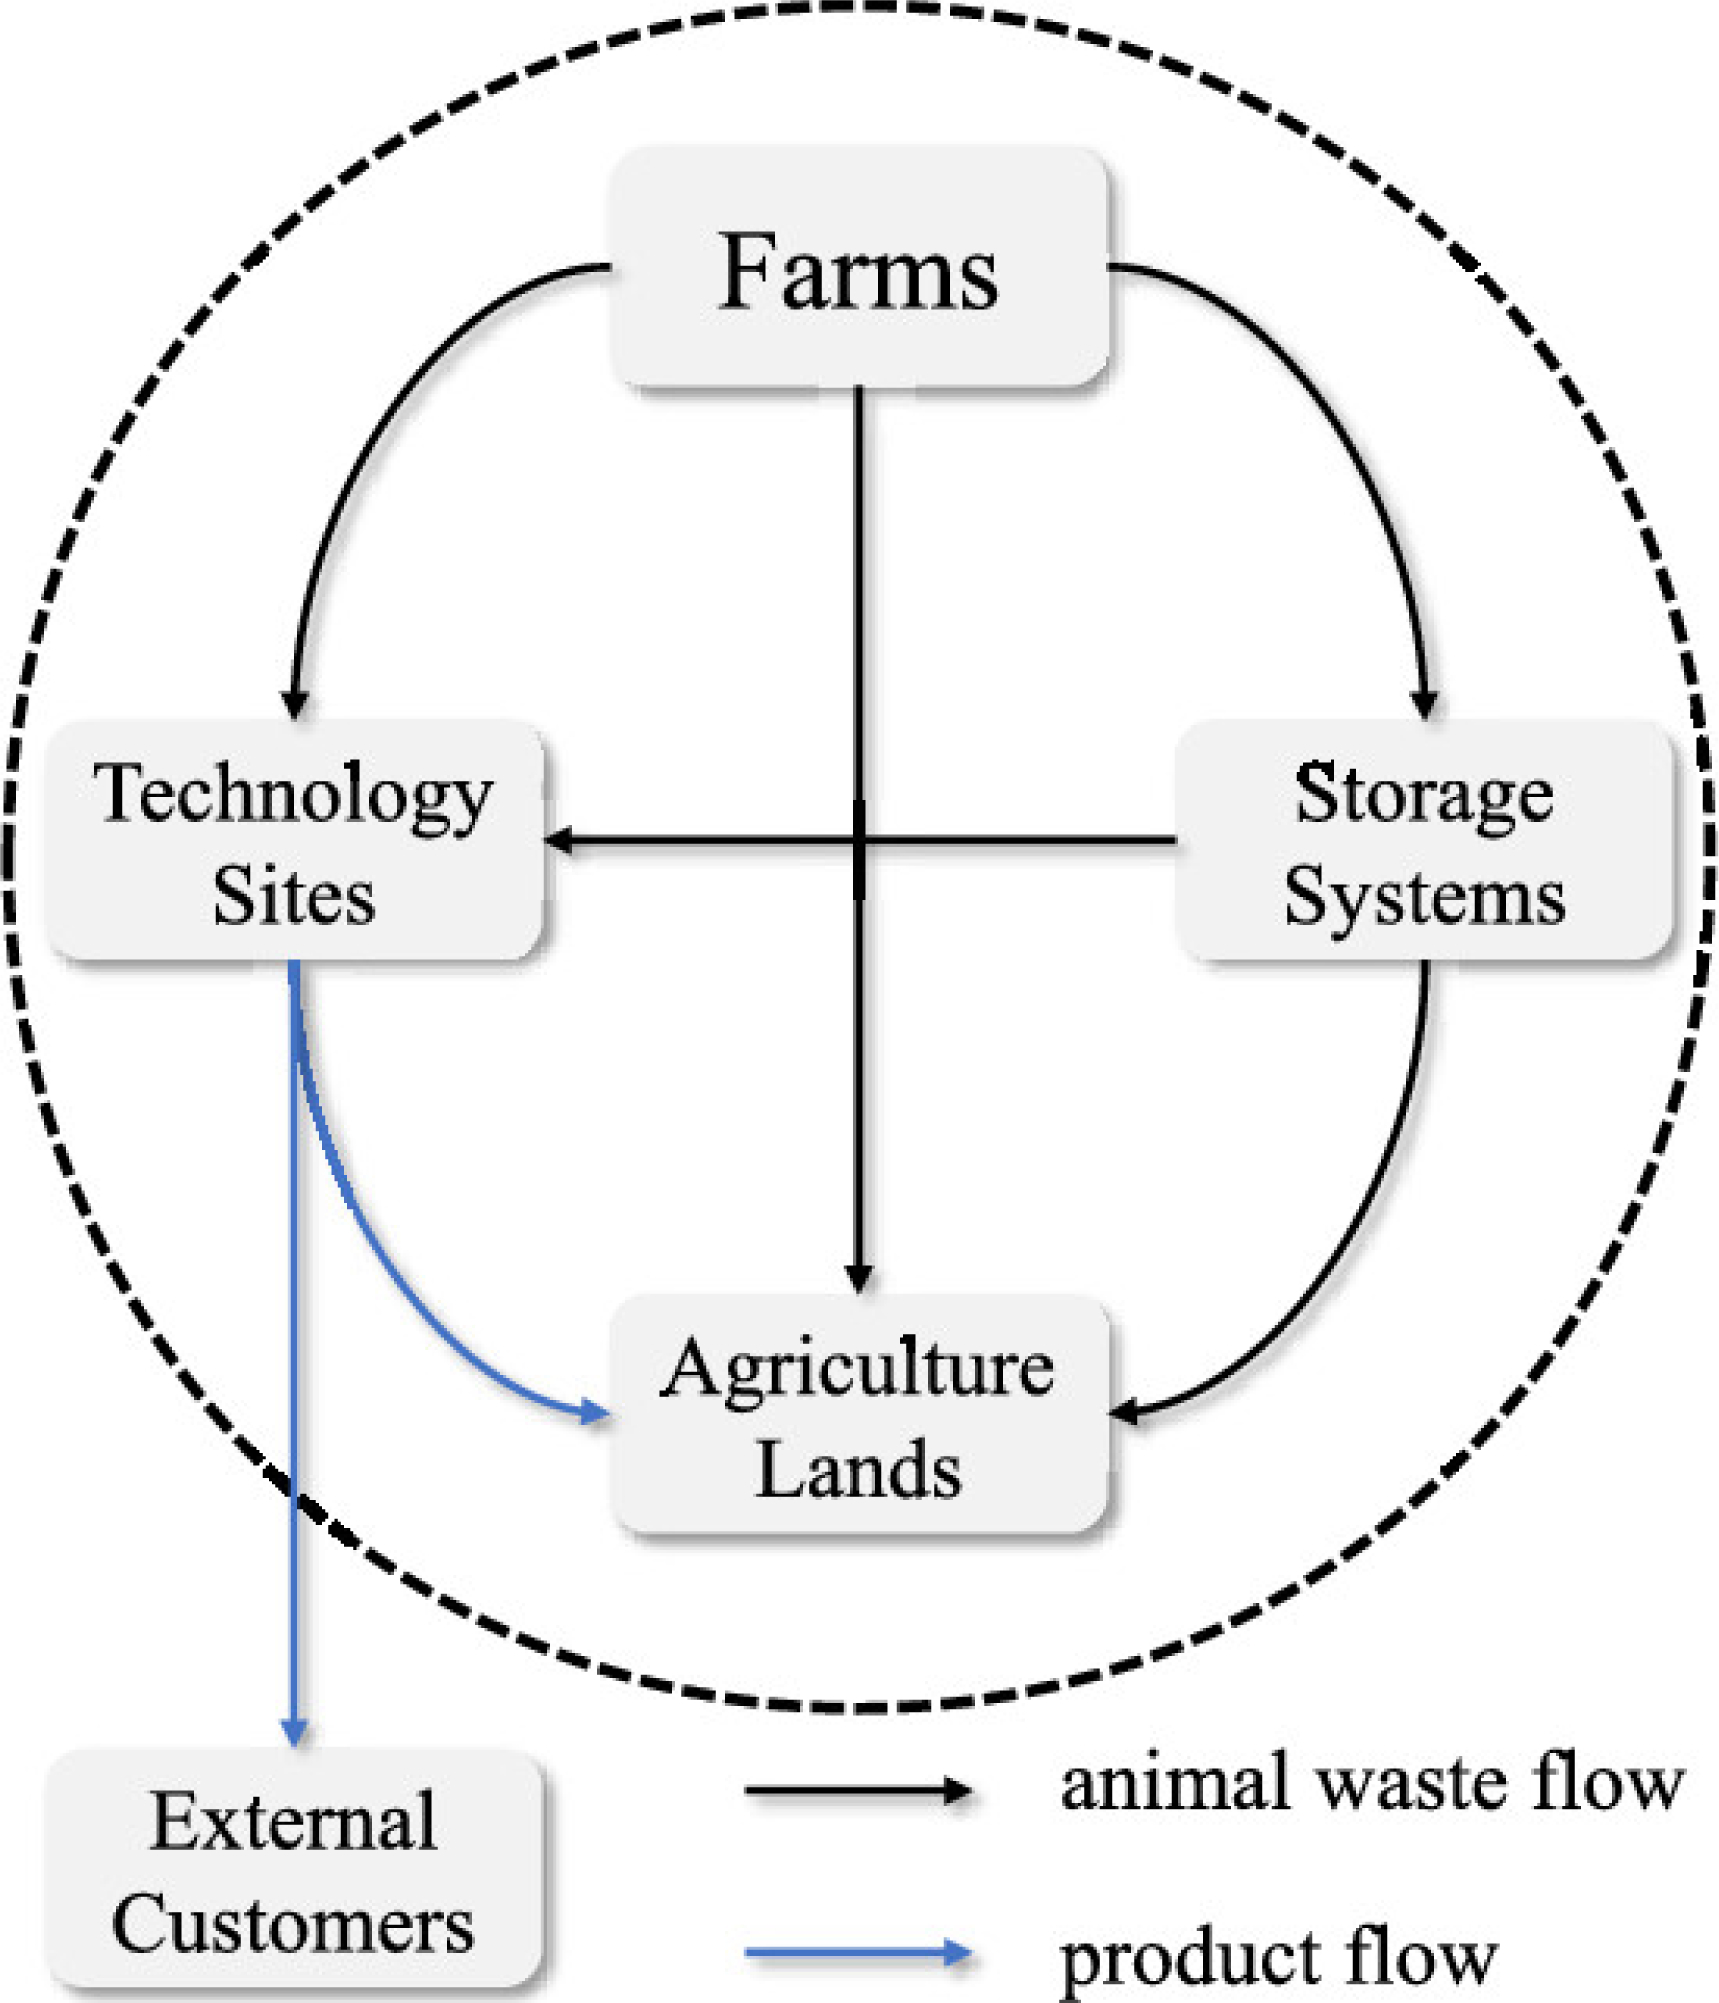
High-level logistics network structure.
Material Balance and Conversion
Equation 1 captures the material balances at each spatial node and at each time step. The left-hand side contains the storage amount from the previous time period Ii,p,τ–1, supply amount si,p,τ, total inflow ∑jfj,i,p,τ, and generation amount ∑tgi,t,p,τ. We note that, for the generation term, a positive value represents production and a negative value represents consumption. The right-hand side contains the storage amount in this time period Ii,p,τ, demand amount (consumption) di,p,τ, and total outflow ∑jfi,j,p,τ
| (1) |
Equation 2 captures material transformation through technologies. The generation term of each material gi,t,p,τ is calculated using the generation term of reference material for the specific technology and the relationship between the yield factors αt,p. For example, the separation technology t′ has a reference material of raw cow manure p′ with yield factor (transformation ratio) αt′,p′ = −1 and consumption amount gi′,t′,p′,τ′ = −1000 at node i′ and time τ′. The values are negative because raw manure is consumed by technology. Next, for one of the output products, the solid fraction of raw manure (denoted as p*), with yield αt′,p* = 0.05 (which means that 0.05 unit mass is generated per 1 unit mass of reference material consumed), the corresponding generated amount of material p* is
| (2) |
Capacity Constraints
We use eqs 3–5 to capture bounds for the demands, storage, and generation due to customer’s demand capacity, storage capacity, and technology capacity. The binary variables xi,p and yi,t are used to indicate the installation of storage systems and technologies at a special spatial location, respectively. In practice, many farms are already equipped with storage systems and some basic technologies like a screw press. Therefore, we can fix a part or all binary variables xi,p and yi,t when solving realistic problems. We note that because we define the reference material of technology as the main raw material, the corresponding generation term is always nonpositive (because the raw material is consumed), as indicated in eq 5
| (3) |
| (4) |
| (5) |
We also impose bounds on the flow variables to satisfy transportation capacity, as shown in eq 6
| (6) |
Nutrient Balance
Equations 7 and 8 capture phosphorus and nitrogen balances at each node and in each time period and help model nutrient management plans (NMPs). The net nutrient releases NPi,τ (phosphorus) and NNi,τ (nitrogen) are calculated using the fertilizer supplement amounts ferPi,τ and ferNi,τ, organic waste release amount (which is calculated using nutrient content coefficients eP,p and eN,p and demand di,p,τ), and the crop needs for phosphorus and nitrogen, respectively (Pdi,τ and Ndi,τ). The net nutrient release is forced to be non-negative to ensure the growth of crops. We note that here we use a simple NMP model, in which only nutrient inputs and outputs are considered. In more advanced NMP models, the nutrient goal is set by accounting for more factors such as results from a soil test and optimal nutrient requirements for different crops
| (7) |
| (8) |
Economic Metrics
We use eqs 9–12 to calculate the investment cost Cinv for any new installed technology and storage systems, transportation cost Ctrans,τ for material movement, operational cost Cop,τ for technologies, fertilizer cost Cfer,τ to support crop growth when there is a nutrient deficiency, and supply cost Csup,τ for organic waste. The investment cost is calculated using the binary variables xi,p and yi,t. In eq 9, β and γ are the depreciation factors that capture the entire life of the technologies and storage systems, Cinv,t is the investment cost for technology t, and Cinv,p is the investment cost for a storage system with material p. The transportation cost is calculated using the transportation flow fi,j,p,τ, the distance between nodes Di,j, and the cost per-unit flow per-unit distance Ctrans,p. The operational cost is calculated using the consumption amount of the raw material in each technology and the unit operational cost Cop,t for technology t. We note that Cop,t is a comprehensive number that counts different aspects such as utility and labor. The fertilizer cost is calculated using the amount of used fertilizer and the breakdown market prices of the nitrogen and phosphorus in the fertilizers (ρP and ρN), respectively. We note that the fertilizer costs are calculated under different assumptions; for instance, when one fertilizer contains N and P simultaneously or when the farmer decides to satisfy nitrogen need only. The supply cost and revenue are calculated using eqs 13 and 14 by taking the product of supply and demand values with their corresponding prices ( and )
| (9) |
| (10) |
| (11) |
| (12) |
| (13) |
| (14) |
Objective Function
The logistics network design problem is a conflict resolution (multi-objective) problem that seeks to trade-off multiple economic and environmental metrics (e.g., profit and nutrient pollution) that affect diverse stakeholders. In this work, we consider cost, revenue, and nutrient released into the environment
| (15) |
To solve this optimization problem, we use a collective function to represent the social preference by assuming that all stakeholders cooperate to achieve a common goal. The solution obtained under this approach contrasts with that obtained in a competitive market setting, in which every stakeholder maximizes its own individual objective.
In eq 16, λP and λN represent the per-unit environmental costs of excess phosphorus and nitrogen. High values of the environmental cost represent a strict policy where noncompliance with the NMPs will result in a high economic penalty, while low values represent a more forgiving (loose) policy. For simplicity, we assume that the environmental costs are uniform throughout the study region and do not change over time
| (16) |
Nutrient Transport Model
A nutrient transport model is used to capture the dynamics of nutrient release from point sources (e.g., WWTPs) and nonpoint sources (e.g., agricultural lands) to the water bodies. Nutrient emissions from WWTPs directly enter the water body, while nutrients from nonpoint sources result from the spreading of fertilizer and animal manure on croplands, and other natural processes such as deposition fixation of gaseous nitrogen and weathering of rocks. These nutrients reach the water bodies through the soil, surface runoff, and groundwater.
There are many models and tools available to study nutrient transport phenomena.(21) Some of these are based on the simulation of soil/hydrology, such as soil and water assessment tool (SWAT) and environmental policy integrated climate.(22) The results from these models are more accurate, but they usually require more input data on the soil conditions and of the hydrological system in the study region. To reduce the need for input data and the computational burden, a less-complex nutrient transport model is required. In this work, we use a watershed model called nutrient export from watersheds 2 (NEWS2). Here, we provide a brief review of the model structure. Model details can be found in refs (23,24). The components of this model are illustrated in Figure 3, and the corresponding datasets will be discussed in the next section.
Figure 3.

Sketch of nutrient transport NEWS2 model.
The NEWS2 model predicts the total nutrient that exits a watershed and enters a water body (yieldE) directly from point sources (RSpntE) and nonpoint sources (RSdifE), as described by eq 17. The subscript E indicates the type of the nutrient, which can be either nitrogen (N) or phosphorus (P)
| (17) |
The contribution of point sources is estimated from the human population (I) within the study region, and the fraction of nutrients removed by the WWTPs (hwfrem,E) is described by eq 18, where WShwE is the amount of nutrient E in human waste
| (18) |
The nonpoint sources are divided into an explicit component (RSdifexpl,E) and a nonexplicit component (RSdifec,E) (eq 19). The nonexplicit component is computed using globally calibrated parameters (ECF) and surface runoff (Rnat), seen in eq 20. The subscript F indicates the form of the nutrient, which can be either organic (O) or inorganic (I). The function fF is defined in eq 21, where aF and bF are also globally calibrated parameters
| (19) |
| (20) |
| (21) |
The explicit component includes nutrients released from natural lands (WSdifnat,E) such as wetlands and anthropogenic lands (WSdifant,E) such as agriculture lands. For both terms, a nutrient balance is conducted based on the nutrient input, including fertilizer (WSdiffe,E), animal waste (WSdifma,E), fixation (WSdiffix,nat,E and WSdiffix,ant,E), and deposition (WSdifdep,nat,E and WSdifdep,ant,E), and nutrient output (animal grazing and plant removal, WSdifex,E), as described by eqs 23 and 24. The variables in the nutrient balance equations are either obtained from the logistics network model (highlighted in bold) or directly from data
| (22) |
| (23) |
| (24) |
After solving the logistics network model, the values corresponding to the nutrients from fertilizers, nutrients from animal waste, and nutrients taken by crops are communicated to the nutrient transport model using eqs 25–27. The nutrients from fertilizer in the watershed are the summation of all of the fertilizer nutrient applied in each node; the nutrient from animal waste in the watershed includes the nutrient from all land-applied products at the nodes, and the nutrients taken by crops in the watershed are the summation of the nutrient uptake for all nodes. In other words, the nutrient transport model uses the overall nutrient balance of the entire study area using high-resolution data from the logistics design model
| (25) |
| (26) |
| (27) |
A watershed export coefficient (FEws,F) is used to calculate the fraction of nutrients that finally enters the water body. This parameter is estimated using the surface runoff and globally calibrated parameters (eF), as described by eqs 28 and 29. The surface runoff Rnat (m) is related to precipitation using a standard curve number method (eqs 30 and 31),(25) where t is 1 day in the time scope considered (e.g., for annual calculation t = 1, 2, …, 365), PRt is the daily precipitation (mm), St is the daily rainfall retention parameter (mm), and CNt is the curve number for day t
| (28) |
| (29) |
| (30) |
| (31) |
Some simplifying assumptions were made to make the NEWS2 model more compatible with our framework. NEWS2 is used to calculate the annual nutrient output from a watershed, and therefore we assume that a biweekly output can be calculated using the same model and parameters given the finer input data. However, the transport delay in the soil and the river should be considered using eqs 32–34, where Rg,t is the generated runoff at day t (mm), Rt is the runoff entering water body at day t (mm), Rstor,t is the stored runoff within the watershed in day t (mm), surlag is the surface runoff lag coefficient (day), and tc is the time of concentration (days). In addition, the NEWS2 model is typically used for large river basins (e.g., Mississippi River Basin). In our case study, we assume that a smaller watershed can also fit into this model when using global parameters. Although these assumptions may lead to lower accuracy, they still capture the basic features needed for our analysis
| (32) |
| (33) |
| (34) |
After the modification, the model can calculate the nutrient release yieldE,τ at a smaller time scope τ. We use a simple approximation method, which assumes that the daily nutrient inflow is proportional to the ratio of the daily runoff and the total runoff in τ. This leads to the following equations that connect the yieldE,τ and Pin,t, Nin,t in the algae growth model
| (35) |
Algae Growth Model
Algae growth in a water body depends on seasonal dynamic factors such as water temperature, sunlight, and nutrient concentration. Therefore, steady-state modeling or models with annual time resolutions are not adequate. For example, the nutrient release at a given time may not cause HABs immediately but may contribute significantly at a later point in time when other seasonal factors become more favorable (e.g., the application of manure in cold months leads to nutrient accumulation in the soil, which, in turn, will raise the probability of HABs in the spring when nutrients runoff with melted snow). Therefore, long-term proactive management actions must be taken in advance, but determining a suitable lead time is nontrivial.
The phytoplankton responses to environmental change (PROTECH) algae growth model was used. We briefly review the key features of this model. Further details can be found in the original publications.(26,27) The PROTECH model uses the concentration of chlorophyll a (chl a) as an indicator of the algae formation and simulates the algae growth at different depths of the water body and at various times. PROTECH is a one-dimensional spatial model (vertical dimension) and ignores the horizontal gradients of nutrient concentration, temperature, and other physical properties of the lake or recipient water body where the HABs may occur. Furthermore, it assumes that the nutrient concentration is uniform throughout the water body.
The daily change in the concentration of chl a is given by eq 36, where X represents the concentration of chl a (mg/m3), r′ represents the growth rate (day–1), and G, S, and D represent the rate of decrease in the concentration of chl a due to animal grazing, settling out of the region because of algae movement, and dilution [mg/(m3 day)]
| (36) |
The growth rate r′ is determined by eq 37, where r′cor(θ,I) is the growth rate determined by the temperature and photoperiod conditions (i.e., the physiological reaction of algae to the length of day), r′P is the growth rate determined by the phosphorus supply, and r′N is the growth rate determined by the nitrogen supply. In the original model, silicon is also considered as a limiting nutrient for diatoms, but in this work, we ignore the impact of silicon because diatoms typically cause HABs only in marine water
| (37) |
To determine r′cor(θ,I), an ideal growth rate at 20 °C needs to be determined first using eq 38, where s and v are the average surface area (μm2) and volume (μm3) of an algae cell. This equation represents the relationship between unlimited growth rate at 20 °C and the size of an algae cell. Then, the influence of temperature is considered using eq 39, where r′θ is the ideal growth rate at temperature θ (°C), and b is an algae-species-related constant (eq 40) obtained using the geometry of the algae cells
| (38) |
| (39) |
| (40) |
The influence of light conditions is critical in the development of HABs. We use eq 41 to calculate the photon flux Ik [mol/(m2 s)] necessary to saturate the growth rate at temperature θ, where αr is also an algae-species-related constant [eq 42, where m is the maximum cell dimension of an algae species (μm)]. The light compensation depth hp (m) is calculated using eq 43 (if the algae is in a deeper position, then the growth rate is limited by the light), where I0 is the photon flux at the water surface (which can be obtained using the weather information like clearness), and ϵ (m–1) is the vertical light extinction coefficient. We use eq 44 to determine r′(θ,I), the growth rate limited by temperature and light conditions, where z (m) is the depth where the algae cell is located. For cells above the light compensate depth (z ≤ hp), we only discount the temperature-limited rate r′θ by the length of daytime T (h); while for cells below (z > hp), the rate decreases exponentially. Finally, to determine the value of r′cor(θ,I), the respiration effect needs to be corrected using eq 45
| (41) |
| (42) |
| (43) |
| (44) |
| (45) |
The nutrient-limiting rates r′P and r′N are calculated based on the assumption that the algae mass composition follows a concentration ratio of N/P/chl a equal to 8.3:1.2:1.(28) We first calculate the total demand of N and P based on the growth rate r′cor(θ,I). If the nutrient supply in the water body is sufficient (larger than the nutrient demand), then we set the nutrient-limiting rate (r′P or r′N) to infinity since the nutrient is not limiting the growth of algae; otherwise, we set the nutrient-limiting rate as the product of r′cor(θ,I) and the ratio of the nutrient supply and demand (which is less than 1).
For the rate of decrease in the concentration of chl a, the grazing rate is computed based on the current chl a concentration and temperature; the settling rate is determined by the depth of the mixed layer of the lake, the light profile in the lake, and the corresponding algae movement actions; and the dilution rate is calculated based on the inflow volume and the lake volume. After calculating the chl a concentration change using eq 36, we update the nutrient concentration in the water body using eqs 46 and 47, where Pt and Nt are the phosphorus and nitrogen concentrations (mg/m3) in the water body at time t (day), respectively, V is the volume of the lake (m3), w is the dilution ratio (the ratio of the total daily volume inflow and V), and Pin,t and Nin,t are the inflow phosphorus and nitrogen (mg) at time t, respectively, which are obtained from the nutrient transport model (highlighted in bold)
| (46) |
| (47) |
We note that all of the rate calculations and the growth mechanisms are the same for each algae species but each species has its own parameters. Based on the natural conditions in the lake and the algae characteristics, the model automatically selects the dominant species in the water body.
Case Study
In this section, we demonstrate the applicability of the proposed framework by considering a case study in the State of Wisconsin (WI).
Study Region
We choose the Upper Yahara Watershed (Lake Mendota basin) as the study region. The map in Figure 4 shows the geographical location and boundary of the study region and the density of agriculture lands (farms and cropland) in the region. The Upper Yahara Watershed has a total area of 530 km2, of which approximately 205 km2 are croplands.(29)
Figure 4.
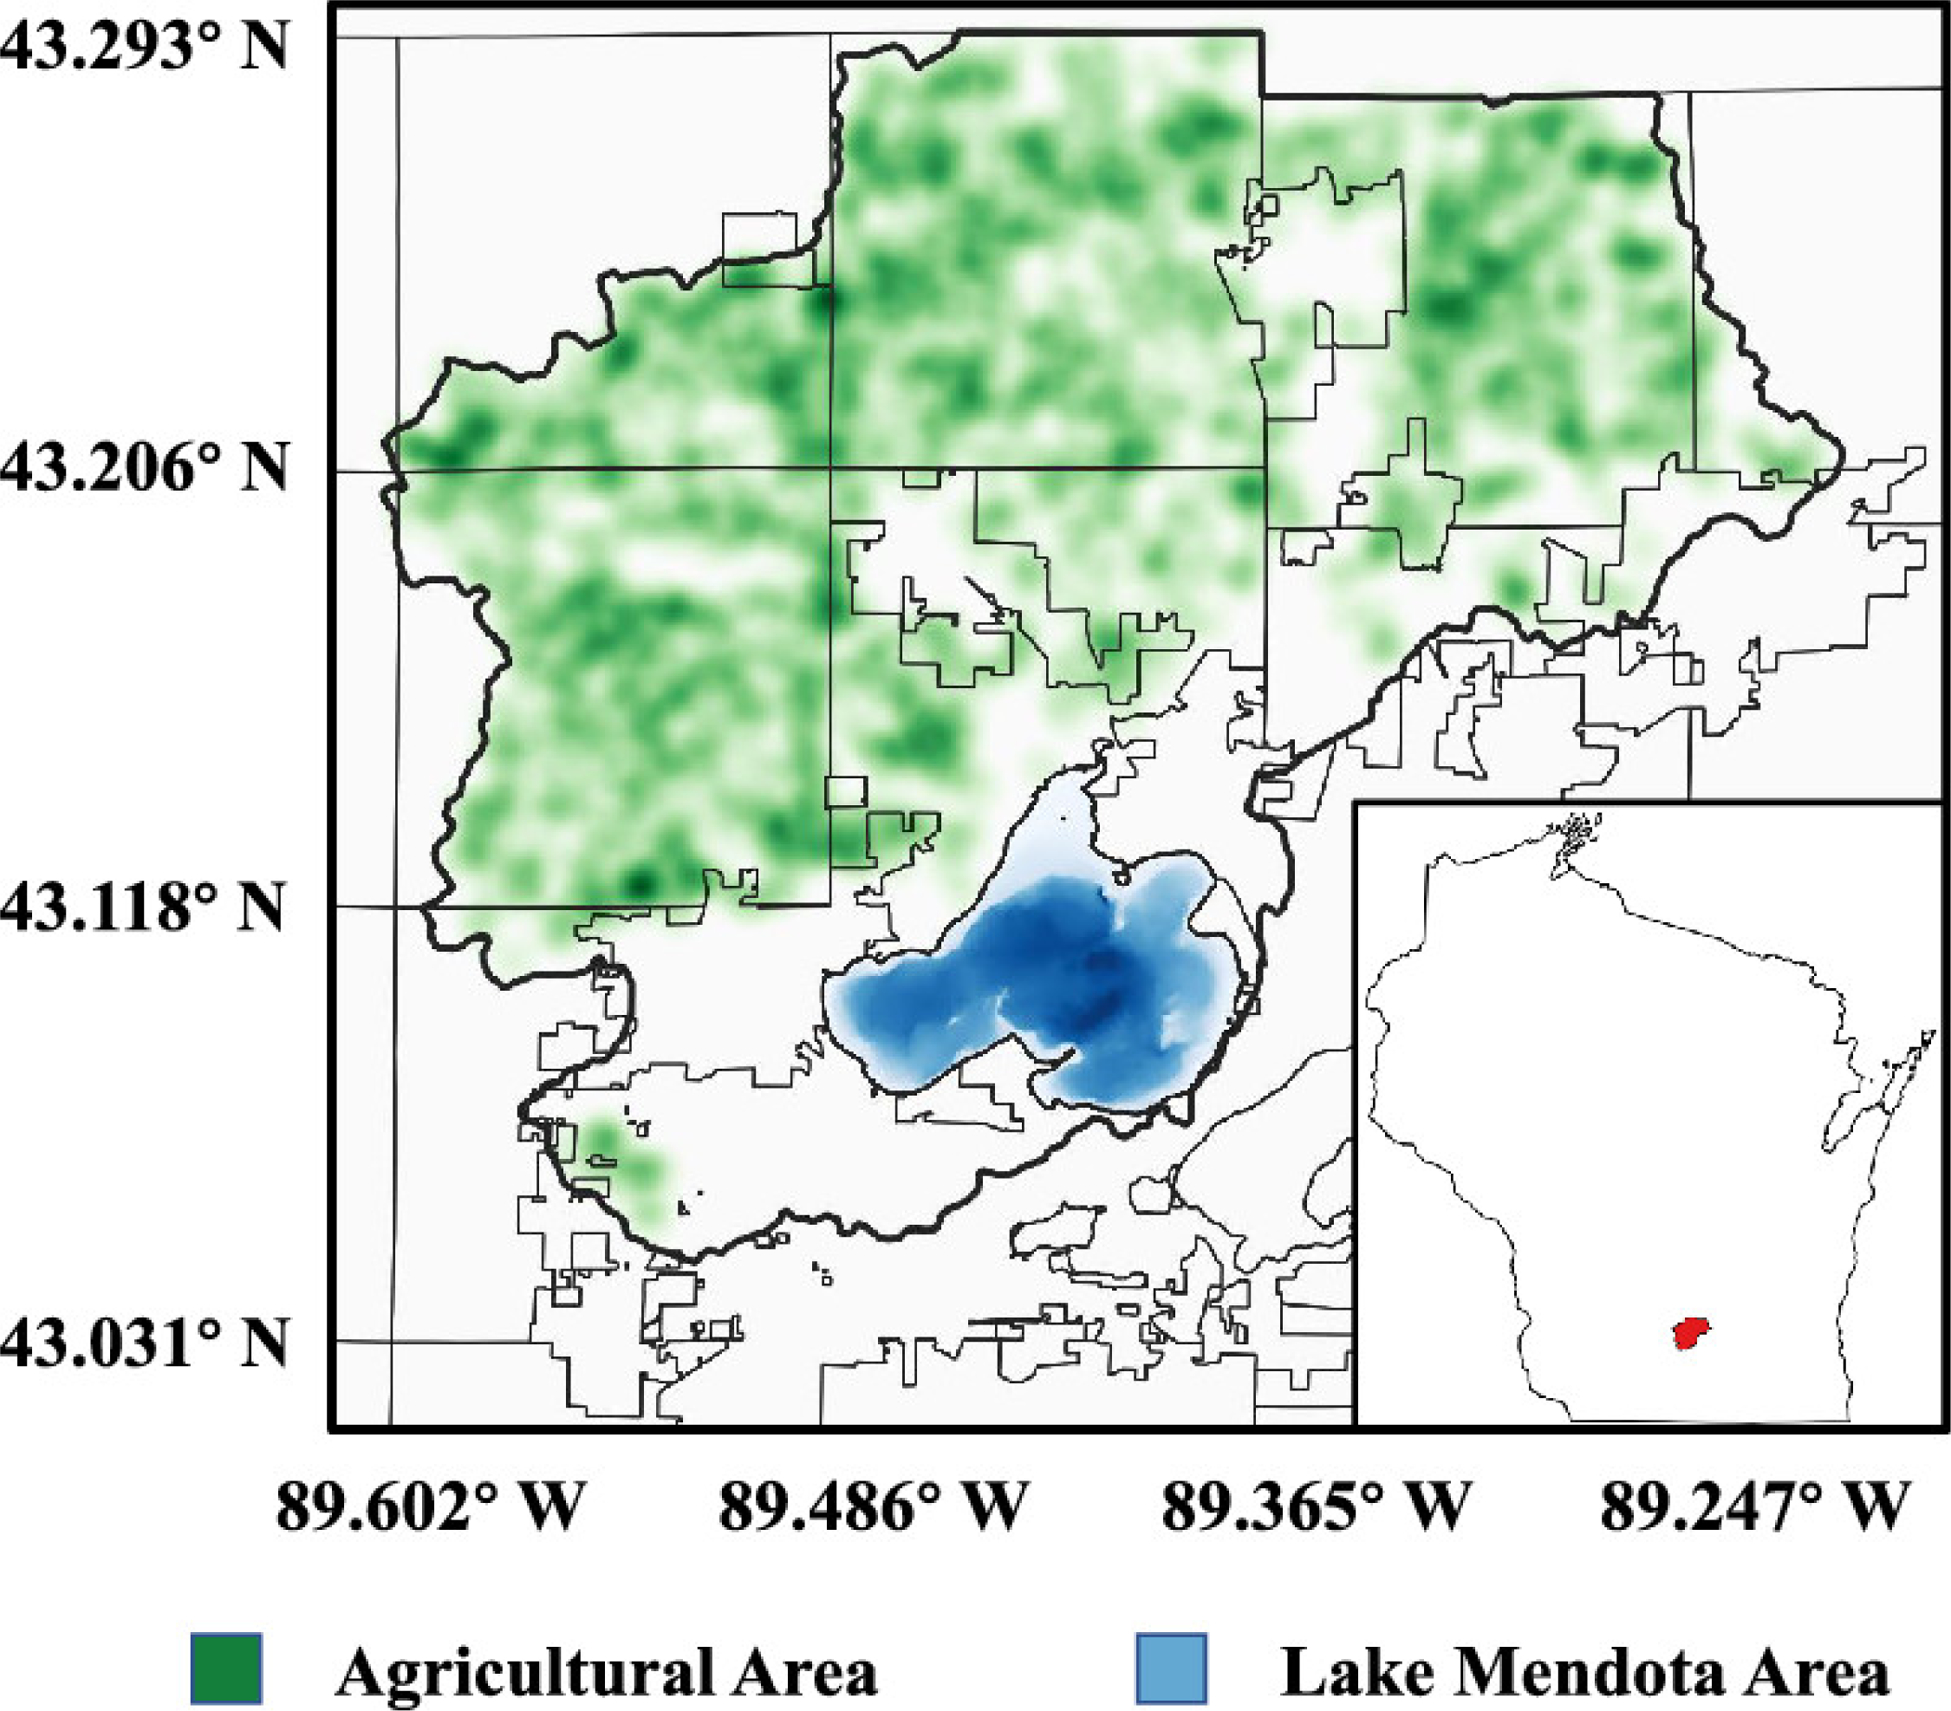
Agricultural land density in Upper Yahara Watershed region in Wisconsin.
The study region is currently affected by significant nutrient pollution due to high-intensity agricultural activities. We define the nutrient balance index (NBI) as the ratio of nutrient applied to the land to the amount of nutrient that is removed by crops. This implies that when NBI is greater than 1, the nutrient will accumulate in the region and potentially create nutrient pollution issues while, when NBI is less than 1, it indicates that there is a nutrient deficiency in the soil (overall soil fertility may be declining and therefore is not sustainable in the long run). The NBI values for phosphorus in the Upper Yahara Watershed in the years 2012 and 2013 were estimated to be 1.95 and 1.35, respectively.(30) We estimate that the NBI value for the year 2017 was 1.46 based on crop planting, nutrient removal by those crops, and the nutrients added to the land in the form of animal waste. The exact values of such imbalance are difficult to ascertain due to the inherent uncertainty in crop yield values and manure composition.(31) In addition, according to the statistics from the U.S. Decennial Census, the population in the City of Madison has increased since the 1990s at a rate of 10% per decade. The increasing population causes more intense human activity and the generation of more organic waste. As a result, it is anticipated that nutrient accumulation in the study region will persist in recent years.
The excess nutrients in the study region impact water quality. The Wisconsin Department of Natural Resources has reported that the TSI value for Lake Mendota has been fluctuating between 50 and 60 since the 1980s,c indicating that the lake is eutrophic and at an increased risk of suffering from HABs. The UW-Madison Center for Limnology also publishes frequent updates of HAB events in Lake Mendota.d
Model Settings and Data Collection
The computational framework requires significant and different types of data. In this section, we discuss the settings and data input for each model. The data flow of the modeling framework is presented in Figure 5. The data and code are available at https://github.com/zavalab/JuliaBox/tree/master/SC_HABs.
Figure 5.
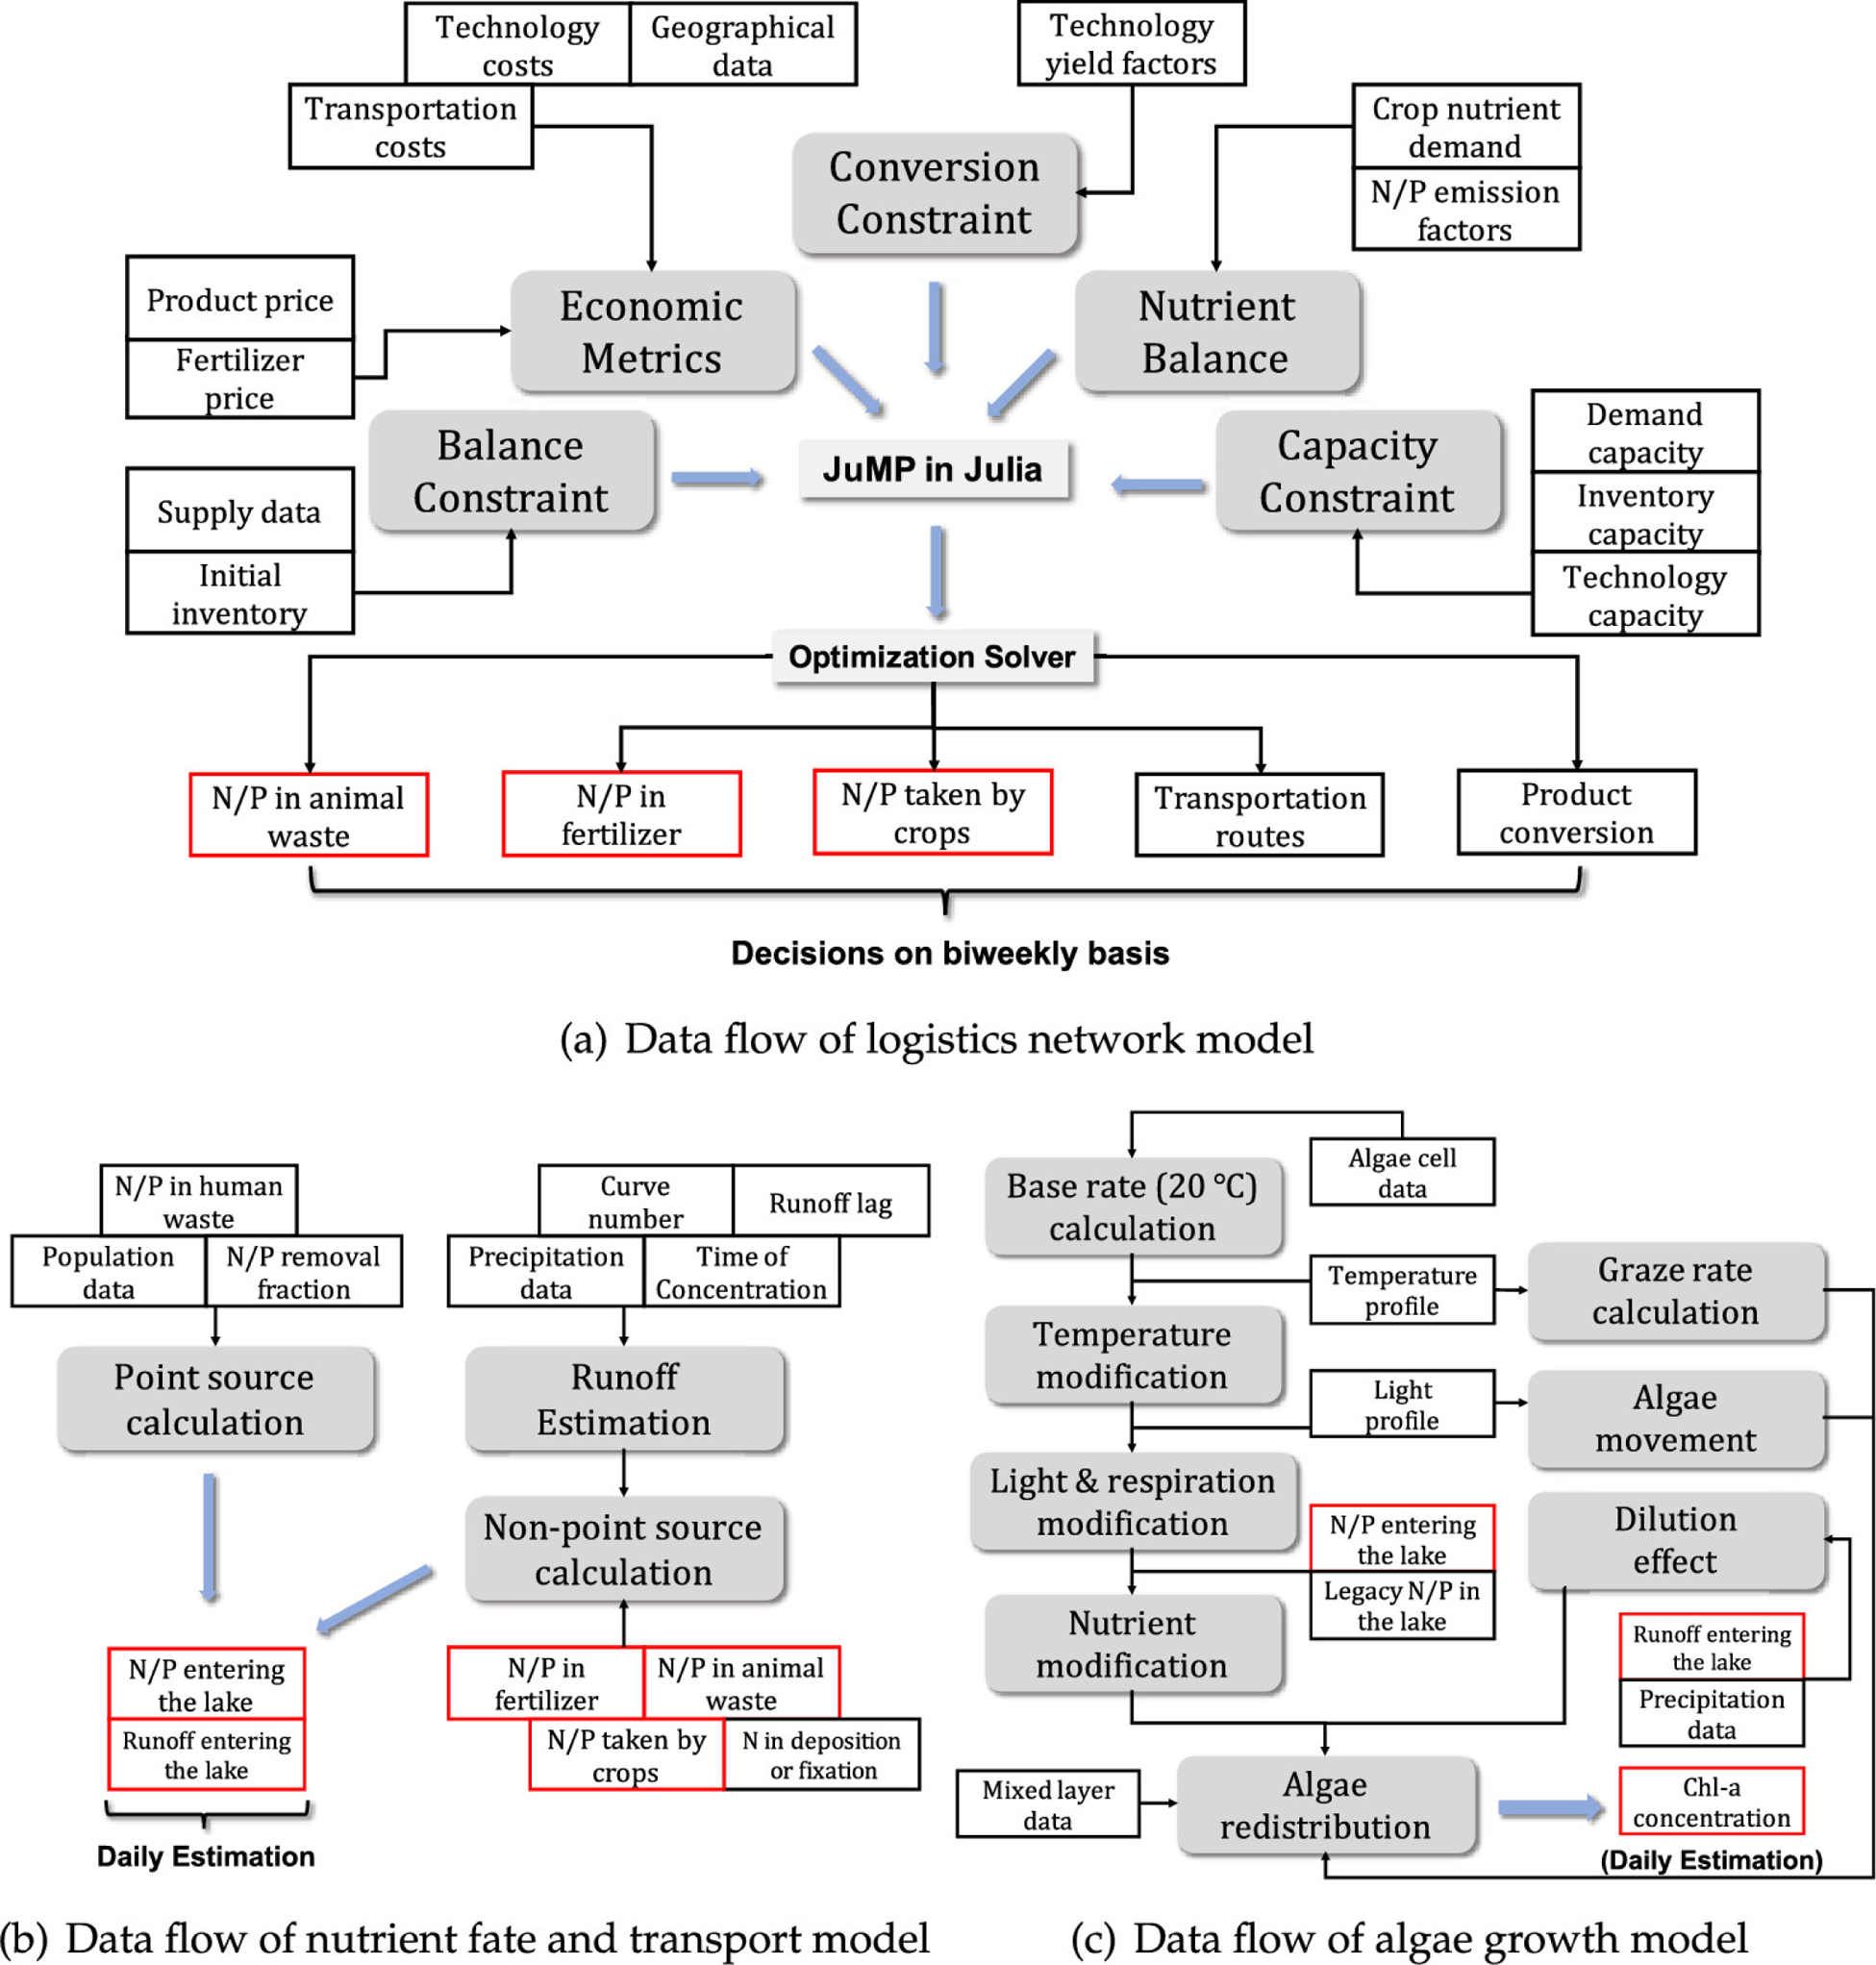
Data flow of the modeling framework (red boxes are linking variables): (a) data flow of logistics network model, (b) data flow of nutrient fate and transport model, and (c) data flow of algae growth model.
Setting and Data for Logistics Network Model
The logistics network model as described in Figure 5a requires significant input data corresponding to node locations, supply values of organic waste, demand values of derived products, crops within the study area, storage systems, and technologies. In our study, we consider 1371 nodes, which include 55 beef farms, 148 dairy farms, 1167 agriculture lands, and an external customer located outside the study region that is used to help balance the region (e.g., this can be a set of companies requesting solid manure as fertilizer). To reduce computational complexity, we assume that agriculture lands within 5 km belong to the same management organization, which reduces the 1167 agriculture lands to 88 nodes. Farms supply cow manure, beef manure, and heifer manure. The supply amount is estimated based on the number of animals at each farm.(29,32) We assume that waste production is uniformly distributed throughout the year.(33) The time step in the model is set to 2 weeks. At a particular point in time, animal waste can be sent to agricultural lands, to a storage system, or to separation (processing) technologies to produce solid and liquid manure fractions. We use existing data for storage systems and fix the associated binary variables.(32) Yield factors, the separation efficiency of nutrients, investment, and operational costs are obtained from the previous studies.(34) We also assume that only those farms with more than 500 animal units are equipped with separation technologies. The liquid and solid fractions of manure can be used for land application separately, and the solid fraction can also be sold to the external customer.
The nutrient demand at agriculture lands is calculated using crop types reported in 2017,(32) the land area, and the nutrient removal rate provided by USDA’s crop nutrient tool (which automates and incorporates information in the Agricultural Waste Management Field Handbook(35)). Based on the nutrient uptake curves of several crops (corn, wheat),(36) we observe that nutrient accumulation in the crops is almost linear in time. Therefore, we assume that nutrient demand is distributed evenly during the growing season. We note that, if there are rigorous fertilizing models available, we can incorporate those models into the framework by modifying the nutrient demand at different times and tracking surplus nutrient at a given time. The growing time for different crops is obtained from the Agricultural Handbook provided by the National Agricultural Statistics Service of the United States Department of Agriculture.(37) For legumes (such as soybean), we currently set the nitrogen demand as zero because of their capability of nitrogen fixation. In reality, however, farmers do apply nitrogen fertilizers on these crops (although the quantity is relatively small compared with that of other crops such as corn). We will relax this assumption in future work. By solving this model, we provide decision-making information (e.g., transportation and storage planning) and values regarding nutrient releases from manure, fertilizers, and nutrient uptake by crops, which can be used in the nutrient transport model.
The logistics network models solved in our studies are large-scale linear programming problems. The models were formulated using the Julia-based modeling framework JuMP and were solved with Gurobi (version 7.5.2). The model instances solved are computationally challenging. The largest model contains 360 935 linear constraints and over 20 743 603 variables before presolving and requires around 6 h to solve.
Setting and Data for Nutrient Transport Model
The nutrient transport model requires also significant input data corresponding to the nutrient release from point and nonpoint sources, and the average precipitation within the study area, as shown in Figure 5b. For point-source releases, we observe that there is no effluent directly to Lake Mendota from WWTPs according to the Madison Metropolitan Sewerage District.e Nutrient release corresponding to the nonpoint sources, specifically the agricultural sector (fertilizer, animal waste, and crop uptake), is extracted from the results of the logistics network model, as explained in the previous section (eqs 25–27). For the nutrient fixation data, we use global parameters reported by Bouwman et al.(38) Specifically, the P fixation and deposition amount are 0; the N fixation rate is 5 kg excess N/(ha year) for nonleguminous crops and 25 kg excess N/(ha year) for leguminous crops. The N deposition amount is 1.5 g N/(m2 year).(39) For the nutrient releases from the natural area, we simply assume that it is 1/6 of the nutrient release from the agricultural area.(40) Using this nutrient release data along with the data on precipitation, the time of concentration (which is 3.3 days estimated using equations in National Engineering Handbook(41)), and the curve number (which is set as an average value of 70(42)), the model calculates the runoff value. The nutrient transport delay in the water body (e.g., from the river to lake) is ignored because this occurs at a faster time scale than the one considered here. By running this model, we can obtain the nutrient flows into the water body and runoff volume, which are used to update the nutrient environment in the algae growth model.
Setting and Data for Algae Growth Model
The algae growth model as described in Figure 5c requires input data to capture algal cell information (surface area, volume, maximum dissension, and movement under light conditions), the amount of nutrients entering the system (from the nutrient transport model using eqs 46 and 47), lake volume, average depth, and weather data. In this study, we consider eight algae species that represent the typical species found in lakes with certain properties such as edibility, nitrogen fixation, and fast movement. The algae cell information is obtained from ref (43). The lake information is obtained from the Wisconsin DNR. The temperature profile and mixed layer depth throughout the year are generated using the FLAKE model.(44) The weather conditions, including sunlight intensity and duration of days, are calculated using the SWAT model.(22)
Time Scales
In this modeling framework, there are several physical processes with different time scales. However, assuming uniform time distribution of events as described in the previous sections allows us to combine, run, and solve the models within the same time scale. The growth of crops usually takes months. We capture the aggregate nutrient requirements during this growth phase on a biweekly time scale. In the logistics model, we make decisions every 2 weeks about the transportation routes, storage planning, and technology processing. The nutrient balance is calculated every 2 weeks, and by assuming that the nutrient runoff is proportional to the daily runoff, we test its impact of nutrient pollution on HAB development on a daily basis.
Notes on Uncertainties
The uncertainty in this framework can be mainly attributed to the data inputs for the modeling components. In the logistics design model, the crop yields and nutrient demand are the main sources of uncertainty. Although we use the standard values reported by USDA as the nutrient requirements for all of the crops, the real value can be influenced by multiple external seasonal factors such as soil conditions, climate and precipitation, cultivation activities, etc. These factors can be incorporated into the model when there is a rigorous fertilizing/crop growing model available. Additionally, these uncertainties can be considered independent of decisions, and therefore, one can reformulate the model as an exogenous stochastic optimization problem. However, this will remarkably increase the size of the problem and the computational intensity in solving the procedure. For the nutrient transport model, some global parameters applied can cause errors in the prediction specific to the Upper Yahara Watershed. This error can be reduced by considering more rigorous soil–water assimilation (this is part of our future work). Also, the use of historical datasets to predict future system performance introduces more uncertainty in the results.
Scenario Description
We study the time period spanning April to the end of October since HABs are more likely to occur during this period. We begin the analysis by specifying manure storage levels. This helps capture the effects of winter manure application strategy because if the initial storage level is low, then this indicates that farmers spread manure during the winter. We also specify the initial phosphorus and nitrogen concentrations in the lake to capture its starting nutrient status. In addition to the initial conditions, technology availability needs to be specified to define the scope of manure treatment. We also specify how strict the NMP is in the logistics network by adjusting the penalty coefficients λP and λN. The logic of this decision-making procedure is summarized in Figure 6. If the algae prediction indicates high risk, we change the setting of the logistics network to adjust the management actions (e.g., increase the use of technologies and increase the environmental cost). We also use the framework to study the impacts of the changes in the logistics network on final HAB results.
Figure 6.
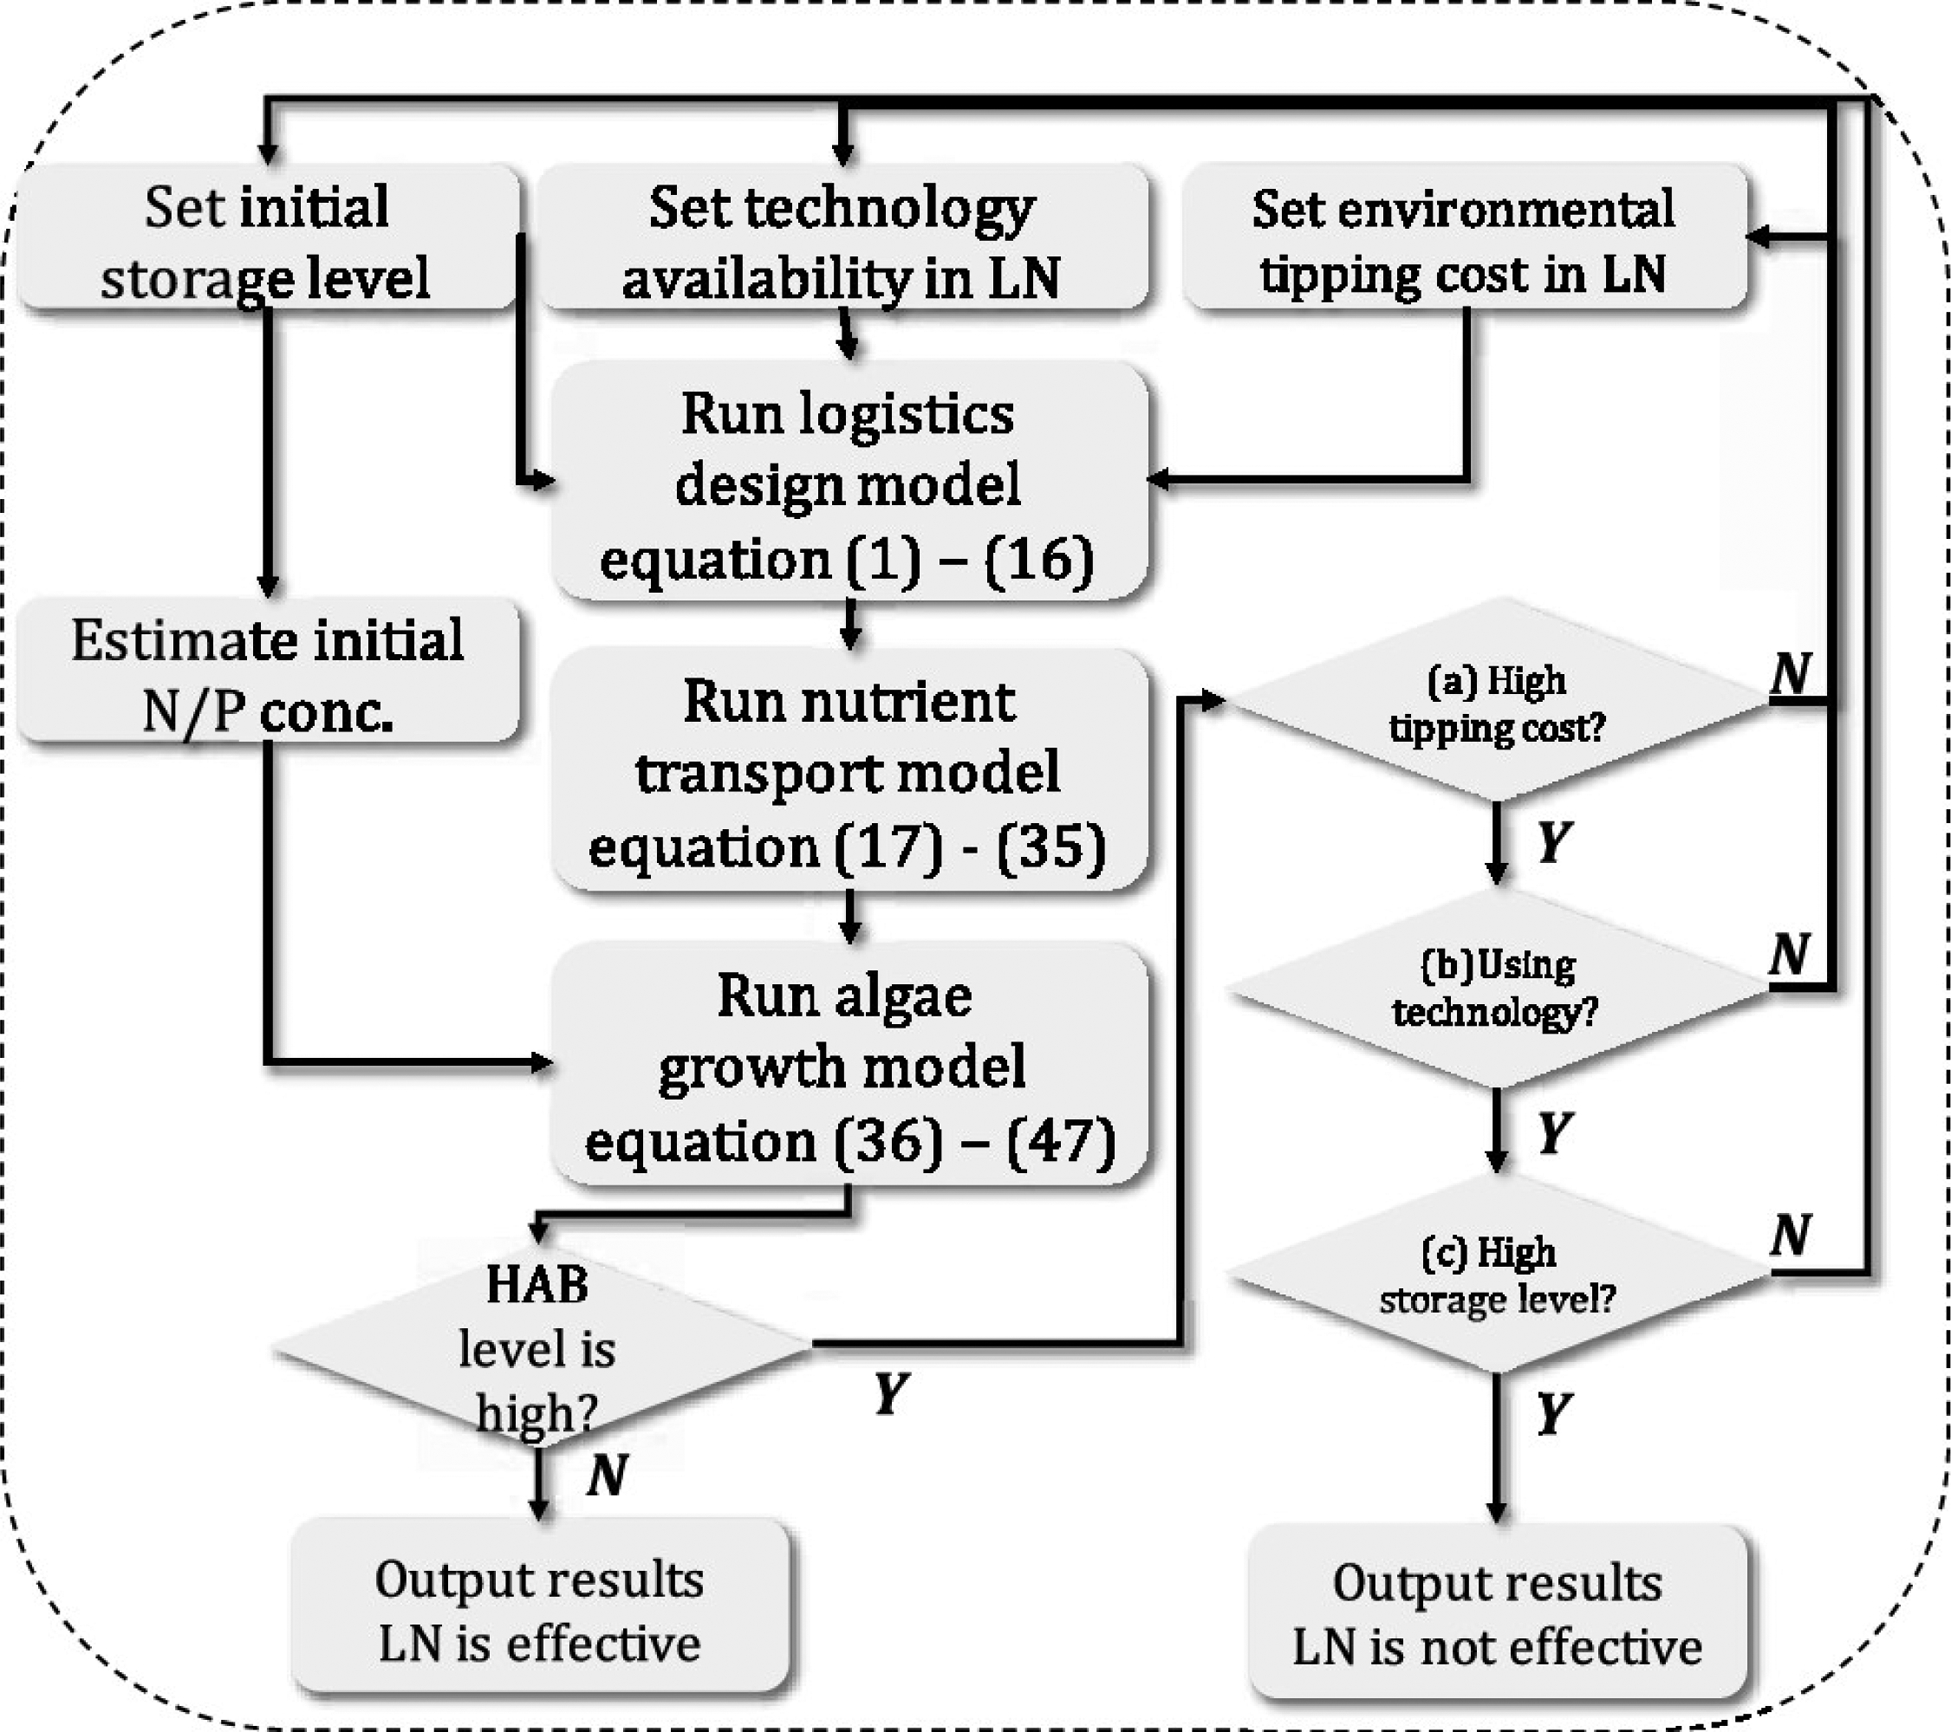
Workflow of the computational framework (LN stands for logistics network).
We ran eight scenarios in total (listed in Table 1). For the initial condition, we estimate the concentration of phosphorus in the lake using historical data from the Wisconsin DNR. The Wisconsin DNR has annual water quality reports for most lakes in WI, and we select the P concentration in early April in the year 2016 and year 2018 to represent the high- and low-concentration scenarios, respectively. The low-concentration (45 mg P/m3) scenarios correspond to an effective manure winter application strategy (90% manure is stored, while 10% is applied to land). Due to limited information about storage levels in wintertime for this study area, we estimated this percentage by estimating the total amount of winter manure generated and the nutrient demand by winter crops including winter wheat and hays. In contrast, a high nutrient concentration (120 mg P/m3) scenarios correspond to an ineffective manure winter application strategy (70% manure is stored, while 30% is applied to land). The storage level is obtained from a simple calculation, which assumes that the initial phosphorus concentration difference in the lake (75 mg P/m3) is purely caused by the excess manure applied, which is around 20% of the manure generated during wintertime.
Table 1.
Characteristics of Scenarios Analyzed
| scenario | winter storage percentage (%) | initial nutrient concentration | NMP | technology |
|---|---|---|---|---|
| I | 70 | high | strict | none |
| II | 70 | high | loose | none |
| III | 90 | low | strict | none |
| IV | 90 | low | loose | none |
| V | 70 | high | strict | separation |
| VI | 70 | high | loose | separation |
| VII | 90 | low | strict | separation |
| VIII | 90 | low | loose | separation |
We also consider scenarios in which separation technologies are and are not used. We assume that the solid fraction after separation can be sold, while the liquid fraction and the raw manure (slurry) are not demanded by external customers due to transportation and storage issues. For the NMPs, in the strict NMP scenarios, the nutrient credit reported in ref (45) is used as the penalty coefficient of phosphorus (for nitrogen, we discount the value using the scaling factors from ref (46), i.e., U.S. $33 kg–1 excess P and U.S. $4.5 kg–1 excess N), while in the loose NMP scenarios, the coefficient is set to zero. The scenarios are summarized in Table 1. We note that the current condition in the State resembles that of scenario II and scenario VI (the initial nutrient concentration is high, most farms do not have NMPs, and only large farms are equipped with technologies).
Results and Discussion
In this section, we analyze the results obtained for the WI case study for different scenarios. We also propose some suggestions from perspectives of logistics network waste management strategies for spatiotemporal HAB control and prevention.
HAB Prediction
The HAB prediction results for all of the scenarios obtained from the PROTECH model are presented in Figure 7. Here, the green, yellow, and red dashed lines represent the low, moderate, and high probability HAB onset levels associated with different adverse health effects. The health effects are estimated by the World Health Organization.(47) The blue solid line is the average chl a concentration near the lake surface (<0.5 m), where most recreational activities occur.
Figure 7.
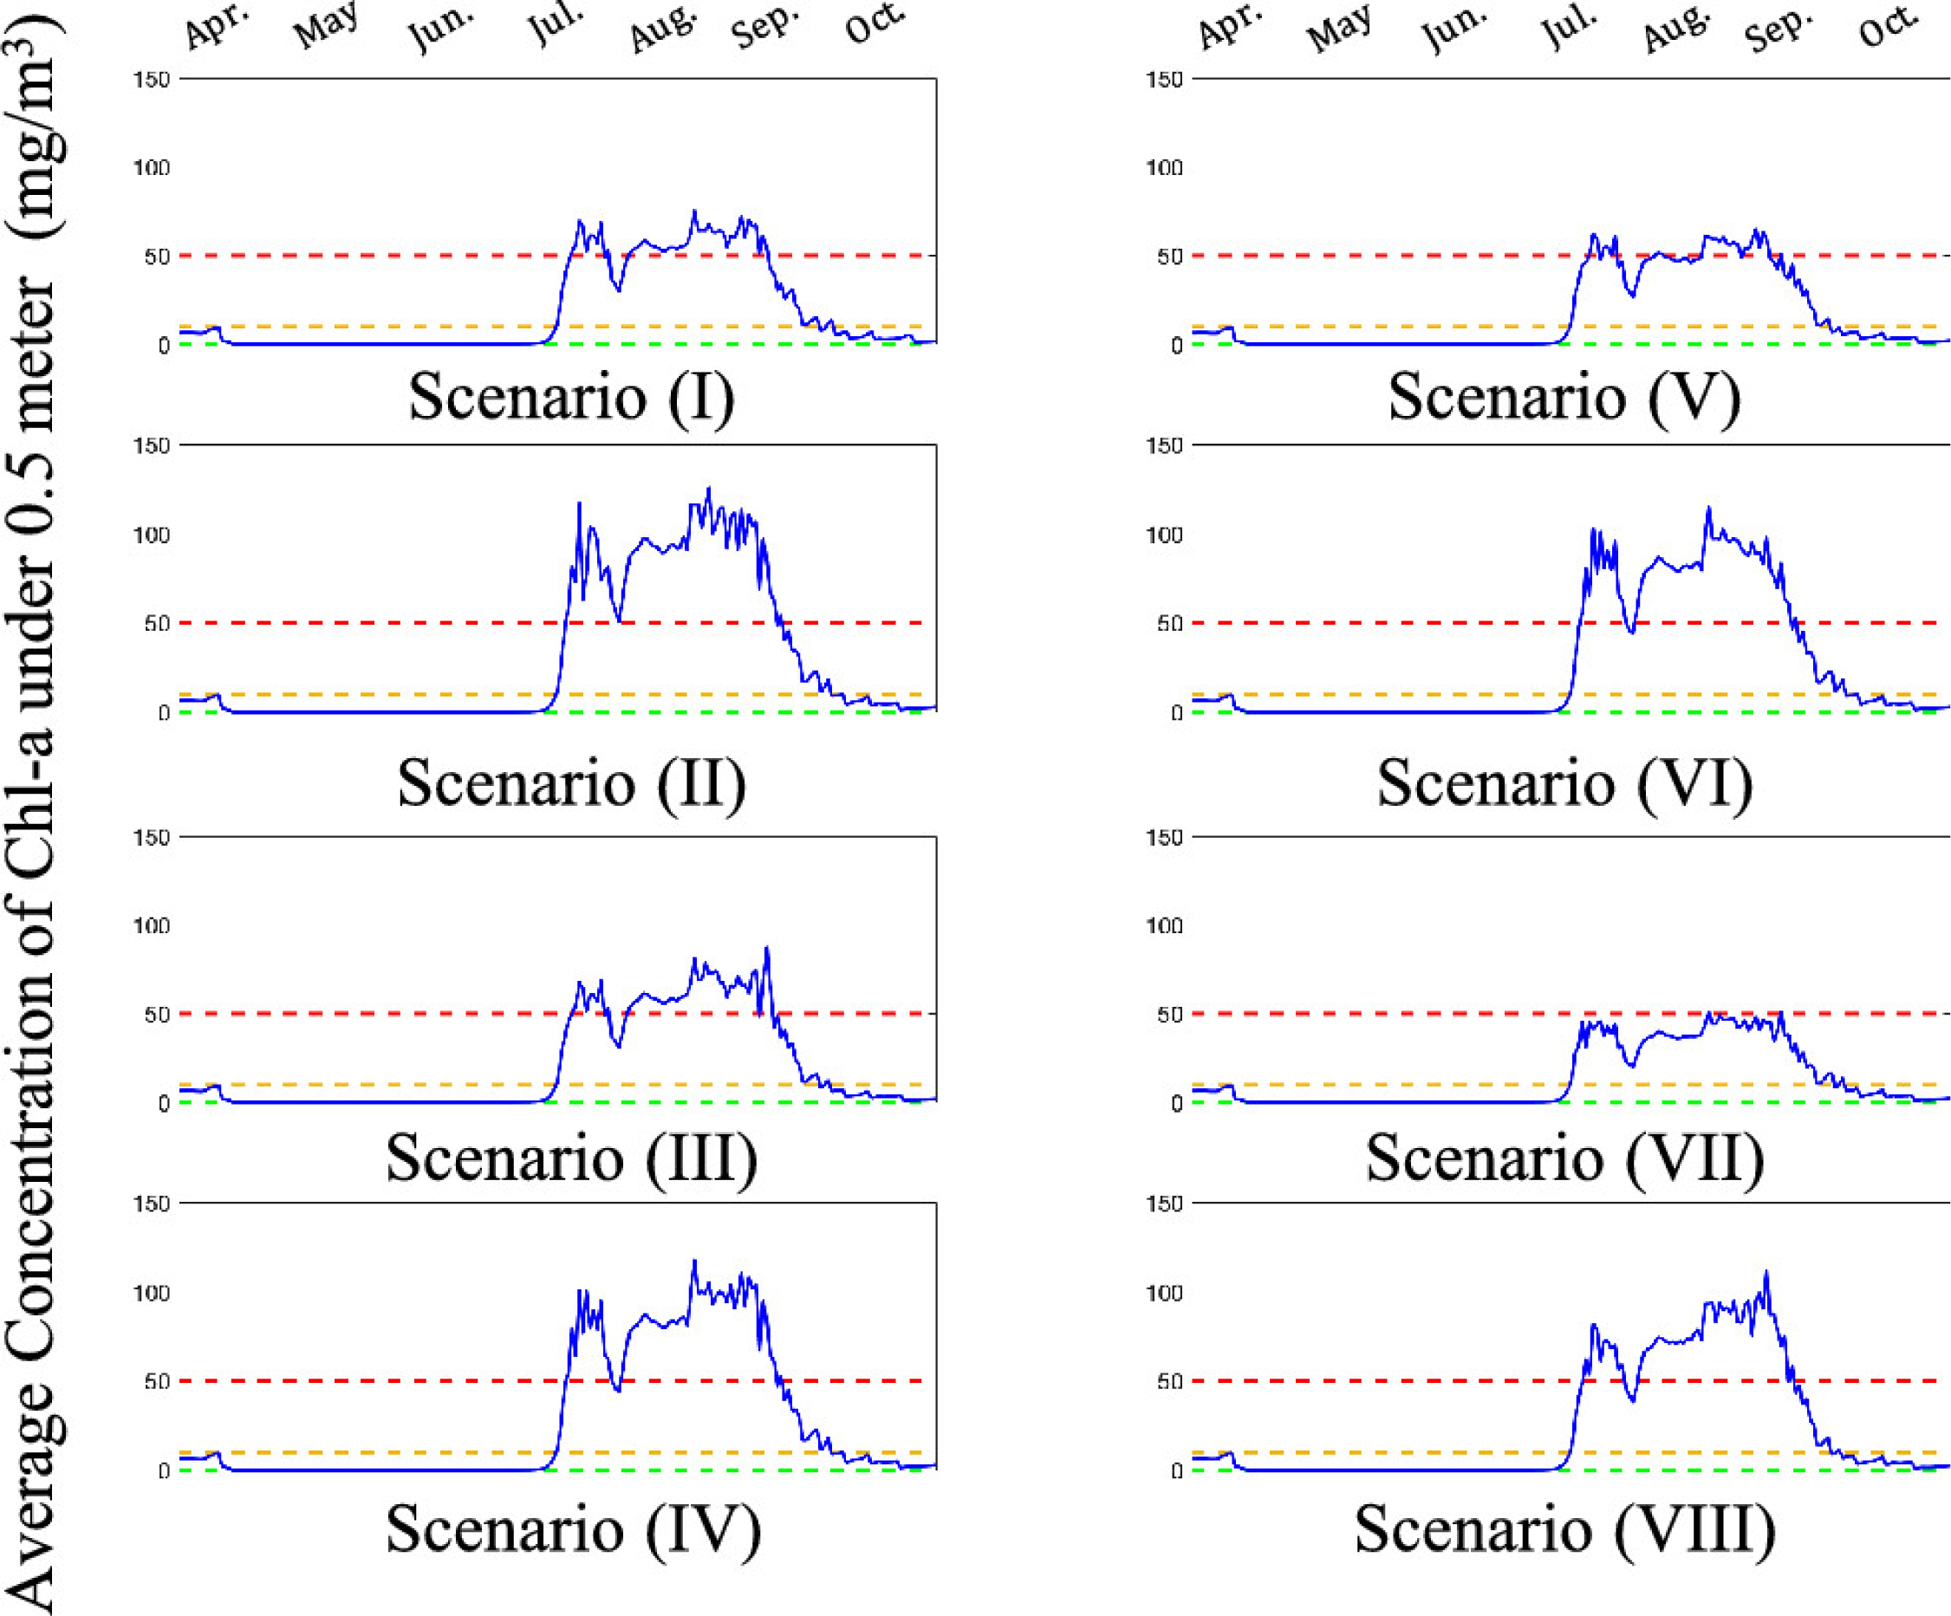
Average chlorophyll a concentration near the lake surface (<0.5 m) for scenarios considered. The green, yellow, and red dashed lines represent the low, moderate, and high probability levels of acute health effects due to HABs. Blue solid line is the temporal profile achieved by implementing the designed organic waste management logistics network.
We observe that, in all scenarios explored, HABs are more likely to occur in summer months (July, August, and early September) due to the higher temperature and favorable sunlight conditions. We also note that the occurrence and severity of HABs depend on the initial concentration of algae in the lake. Calculations confirm that environmental conditions (temperature and sunlight) and phosphorus concentration are the key limiting factors of algal growth. This observation is consistent with the assumption commonly made in many life cycle analysis methods.(21) Specifically, it is often assumed that phosphorus is the limiting factor for algal growth in inland surface water, while nitrogen is the limiting factor in marine water. Our results show that reducing the chl a concentration below high-risk levels (scenario VII) requires a combination of initiatives. Specifically, this can only be achieved by having high levels of winter store, reducing the base nutrient concentration level of the lake, enforcing strict NMP policies, and implementing separation technologies to mobilize waste outside the region. Maintaining chl a levels at the high-risk levels (scenarios I, III, V) requires enforcing strict NMP policies (regardless of the other factors). We thus see that potential NMP policies play a key role in HAB control.
The concentration of chl a at different depth and time for each scenario is shown in Figure 8. Here, red indicates a high chl a concentration and blue indicates a low chl a concentration. We can see that algae cells are mainly aggregated at the surface of the lake during the summertime (due to favorable light and temperature conditions). For scenario II, the surface concentration of chl a reaches over 300 mg/m3 (corresponding to a cell density of 600 000 cells/mL). Together with the impact of sunlight, slow-moving water, and other natural forces, there is a risk of forming algal scum on the lake surface. For the best scenario (scenario VII), the surface concentration of chl a can be reduced by a factor of 3 (to 100 mg/m3).
Figure 8.
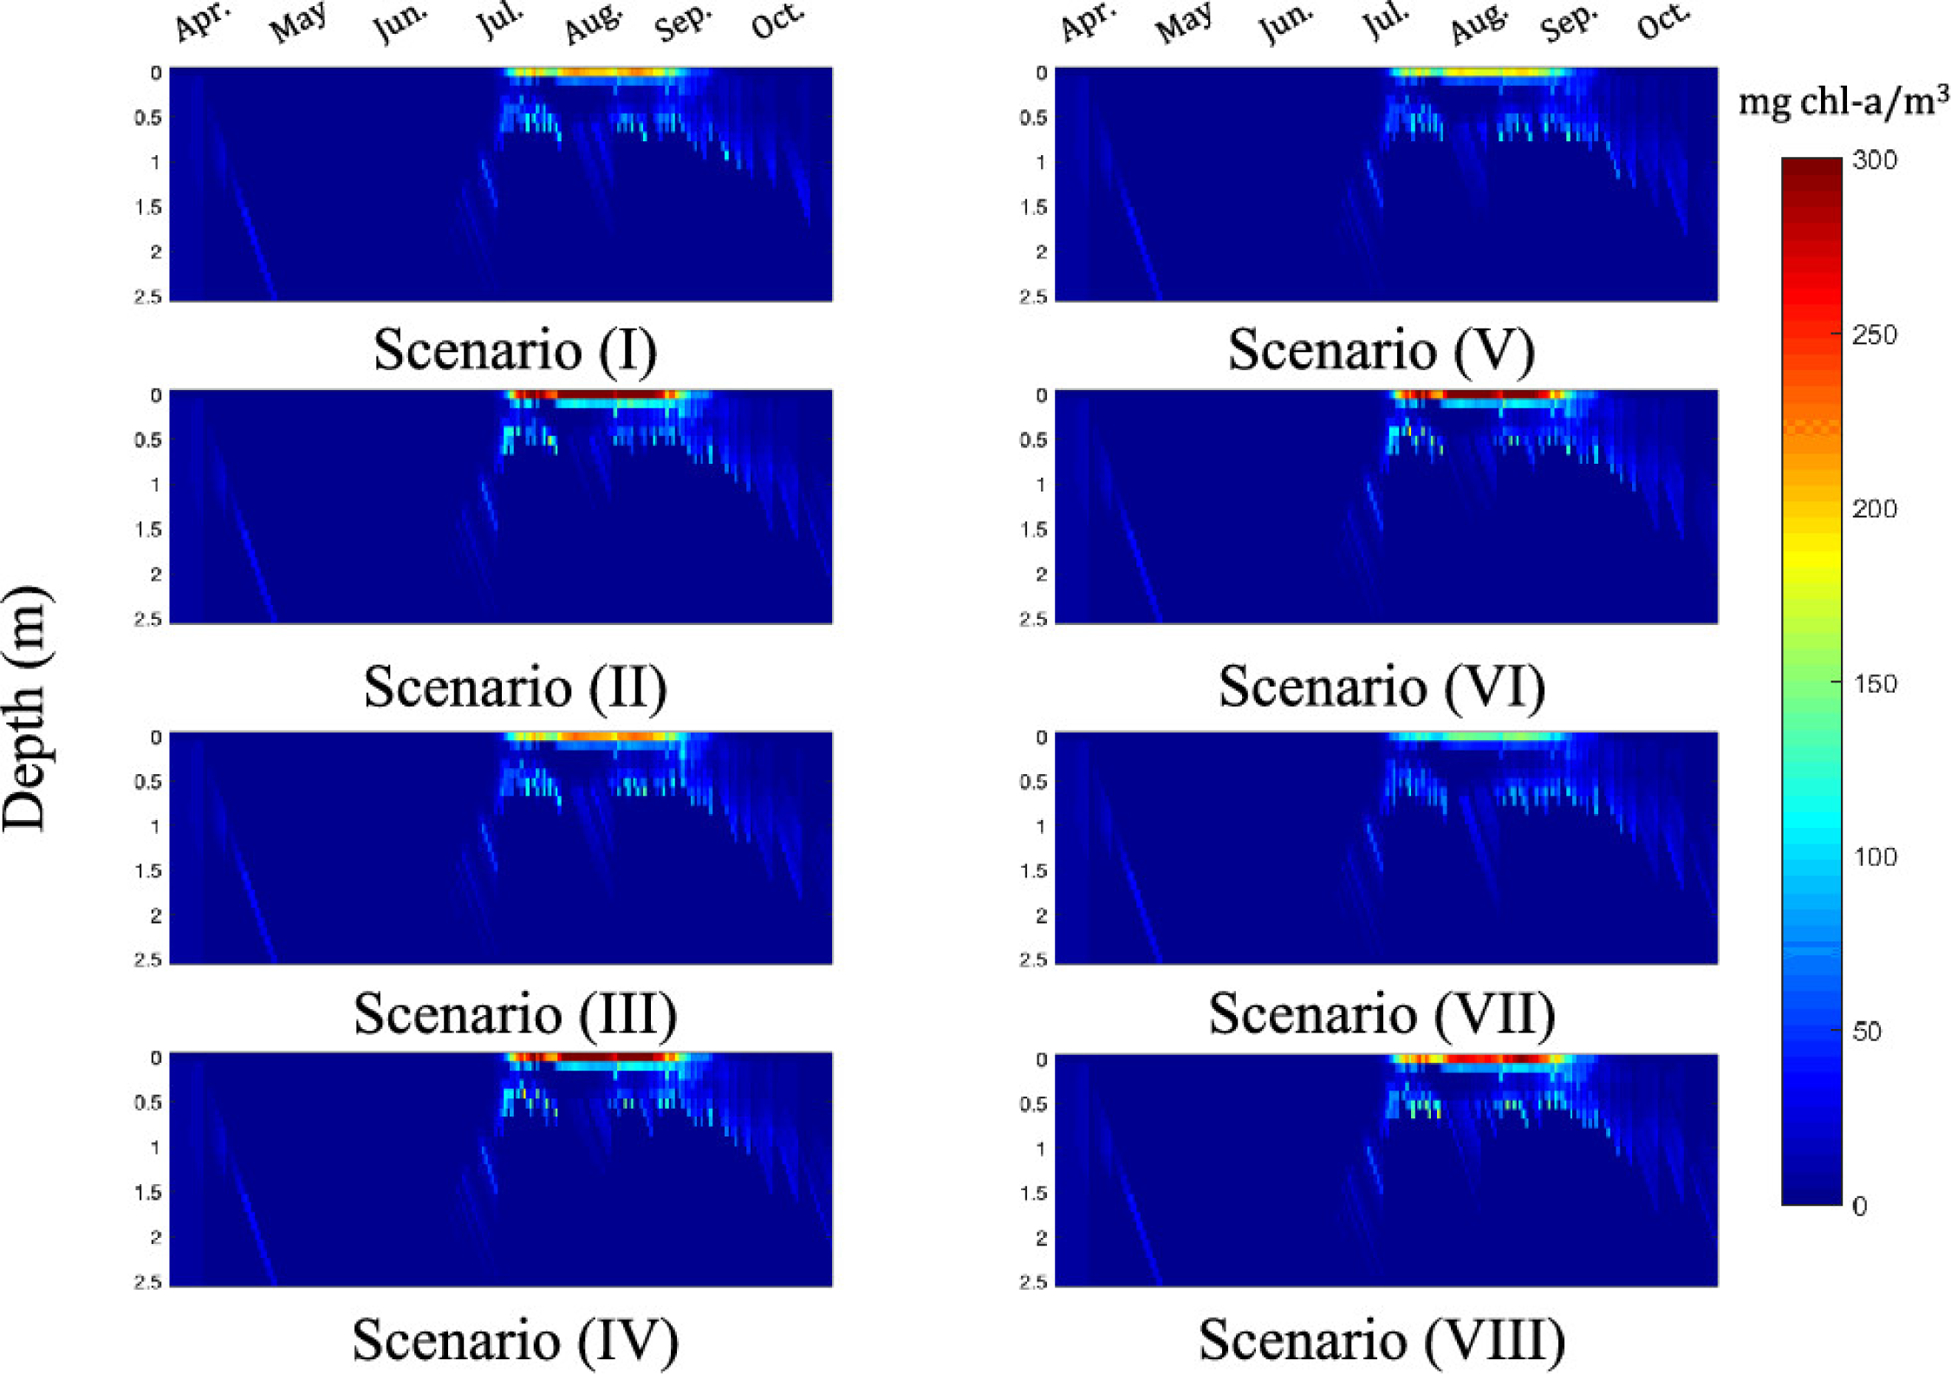
Chlorophyll a concentration in the lake at different depths and times.
From the above analysis, we find that incorporating appropriate logistics network management strategies in storage planning, nutrient application planning, and with the use of nutrient recovery technology, we can reduce the HAB level from a high-risk level to a moderate-risk level within 1 year. To further reduce the risk of HABs, mid-term efforts (e.g., perennial nutrient management) are necessary. Specifically, when the initial conditions are not favorable for lake health (representing a poor manure application planning in winter), the predicted HAB level is always higher. In scenario II, the HAB level can reach the warning level of a high probability of causing acute health impacts to humans. Even with strict NMPs and the use of technologies, the chl a concentration is still around the warning line (scenario V). The model does confirm that it is not recommended to apply manure during the winter since the nutrient demand from crops is low and the nutrients accumulated in the soil will travel to the surface water when the spring runoff occurs. Thus, the winter application activity can impact the HAB situation in the following summer, and investing storage systems to manage winter manure is critical to displace the timing of nutrient flows and HABs.
Under the current fertilizer market prices and their nutrient content,(48) farmers prefer to buy fertilizers from retailers instead of storing, transporting, and applying existing animal manure. Therefore, there should be an external driving force to make the system avoid this economically feasible but environmentally unsound solution. One strategy is to achieve this driving force through NMPs. In particular, our results reveal that a strict NMP can reduce the HAB level regardless of technology usage and initial condition (Figure 7). At present, only large concentrated animal feeding operations and their associated agriculture lands are required to follow NMPs. Small farms are not mandated to follow NMPs and are more likely to use external fertilizers and spread animal waste during winter months.
By using manure separation technologies, we can reduce the HAB level by reducing the amount of excess nutrient in the study region (when there is external demand for products). We also observe that the use of technology can have a larger impact on HAB reduction when combined with strict NMP policies and proper storage planning (scenario VII).
Logistics Network Design and Nutrient Pollution
In addition to the results obtained with the PROTECH model, we can gain insights from the results of the logistics network model. In Figure 9, we present the mobilization (transportation) routes for manure for scenarios V and VI at different times. The overall inventory levels for manure are presented in Figure 10. We note that in Figure 10, two clusters for starting and ending trajectory points are because we have assumed (for the case study) two winter storage percentage values as shown in Table 1. For all scenarios, the inventory levels of manure have a similar trend. At the beginning of April, the inventory levels increase because most crops have not been planted and the system needs to store the waste. After the short increase in the inventory level, there is a drop because the land nodes need nutrients to support crop growth and also because the logistics network needs to clear storage space for the coming inventory in the subsequent winter. This trend is also evident from the transportation maps (Figure 9). For both scenarios, the majority of farms transfer waste to storage systems in early April and then haul the waste agricultural lands in the following months. We also observe that the NMP influences the nutrient output of the logistics network system by adjusting spatial mobilization (transportation) instead of temporal mobilization (inventory levels). For transportation in scenario V where the NMP is strict, the transportation routes are longer with an average transportation distance of 2.28 km in August for livestock waste (more mobilization is needed). This is because the logistics network is monitoring the locations where nutrients are in demand and the farmers send the animal waste to the exact agricultural land to achieve high efficiency in nutrient reuse. On the other hand, in scenario VI (where the NMP is not enforced strictly), the farmers only send the waste to the nearest lands (with an average transportation distance of 1.62 km in August for livestock waste) to achieve a lower transportation cost. The transportation routes for other scenarios follow similar trends. By comparing Figures 9 and 10, we observe that, although all scenarios seem to have used up the livestock waste, the spatial distribution is different. In some scenarios (e.g., scenario V), the manure is used at lands where the nutrient is needed, while for other scenarios (e.g., scenario VI), the manure distribution is uneven resulting in nutrient surplus at specific hot spots while other lands face nutrient deficiency.
Figure 9.
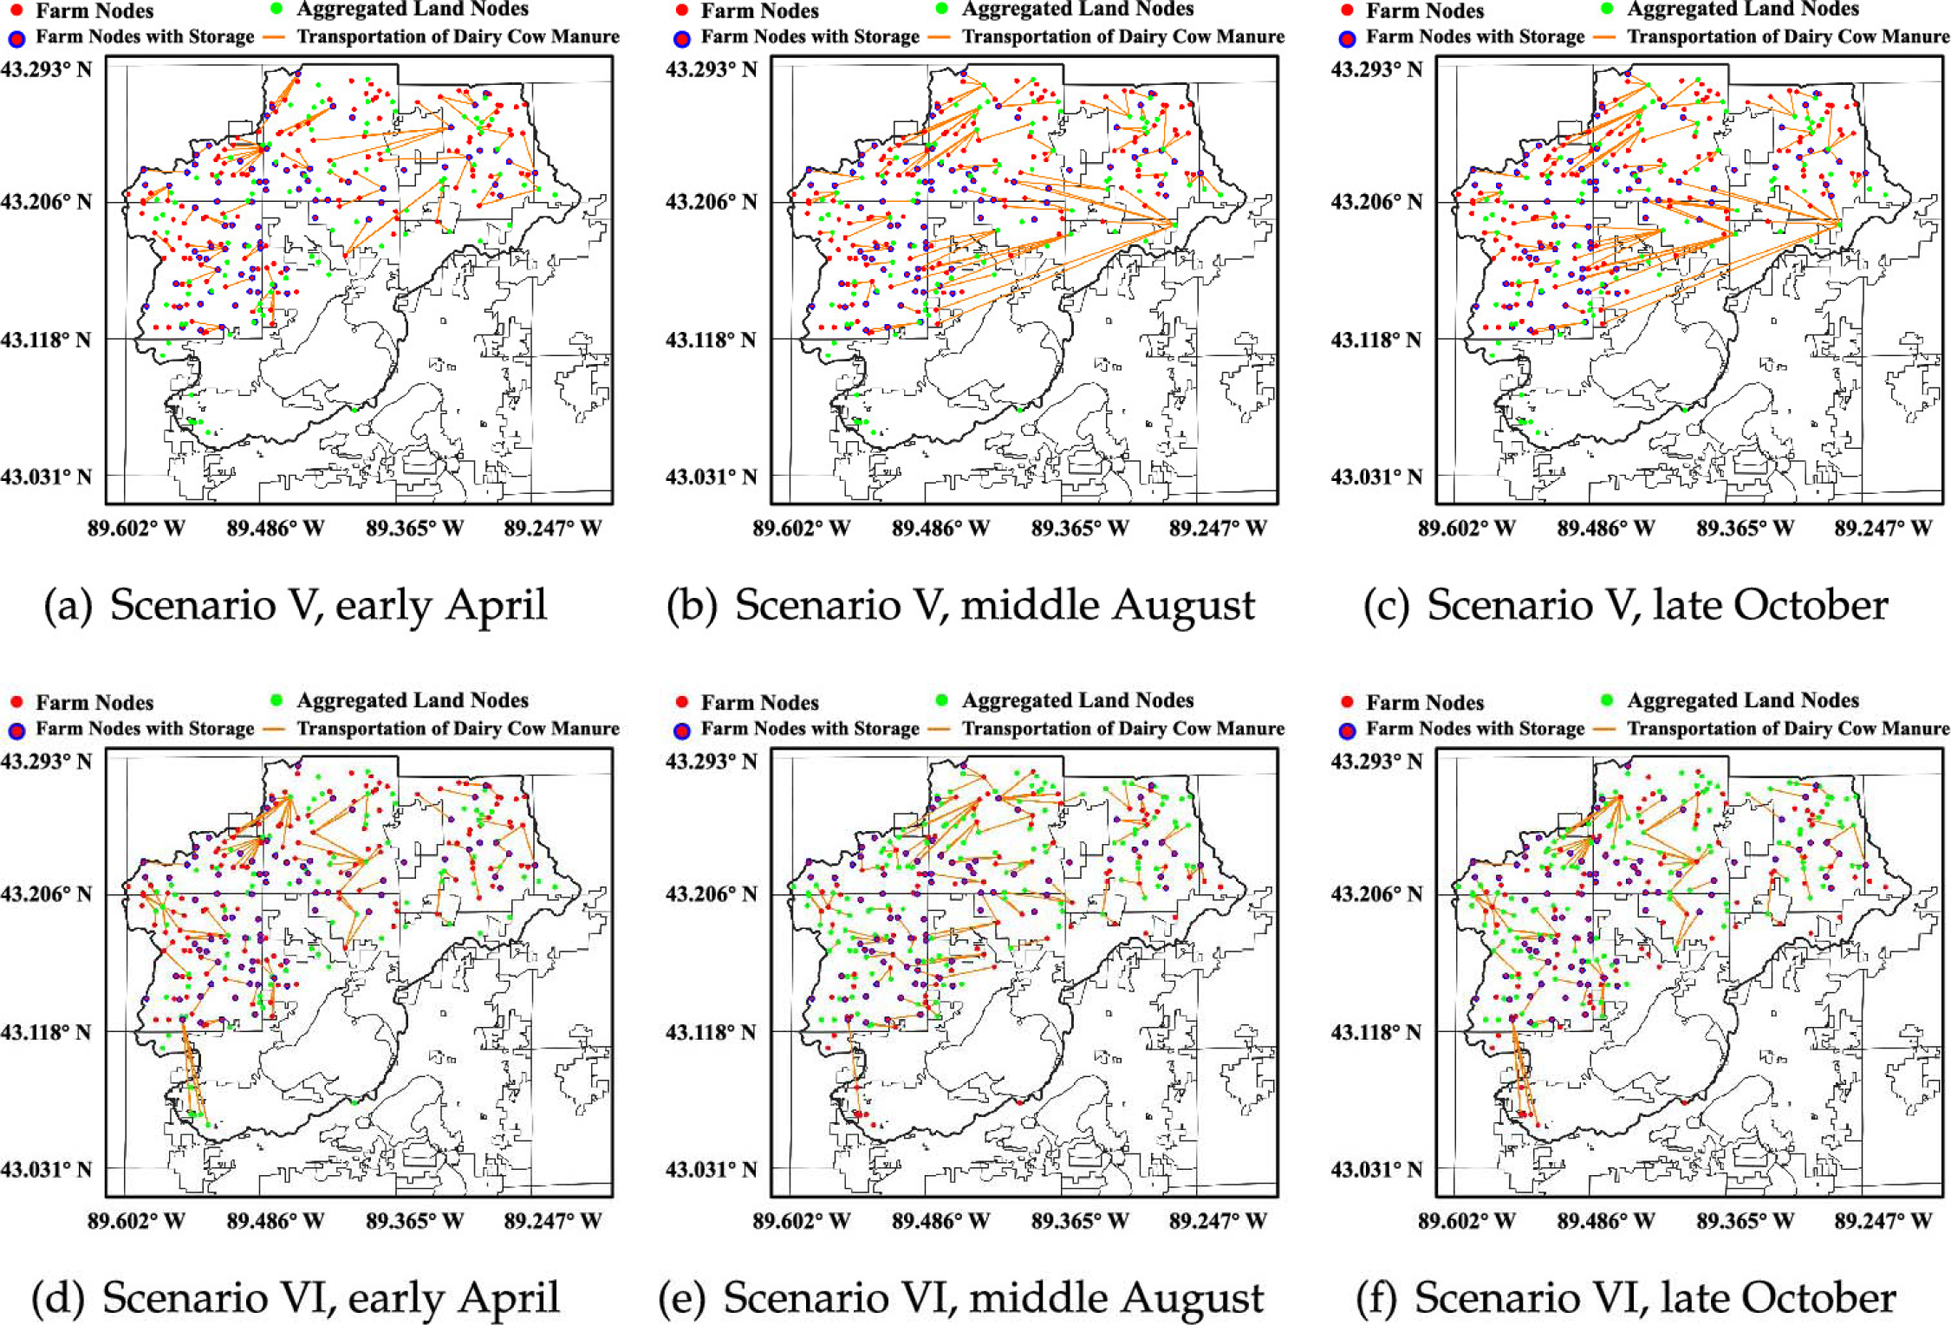
Waste transportation logistics in scenarios V and VI at different times: (a) scenario V, early April, (b) scenario V, middle August, (c) scenario V, late October, (d) scenario VI, early April, (e) scenario VI, middle August, and (f) scenario VI, late October.
Figure 10.
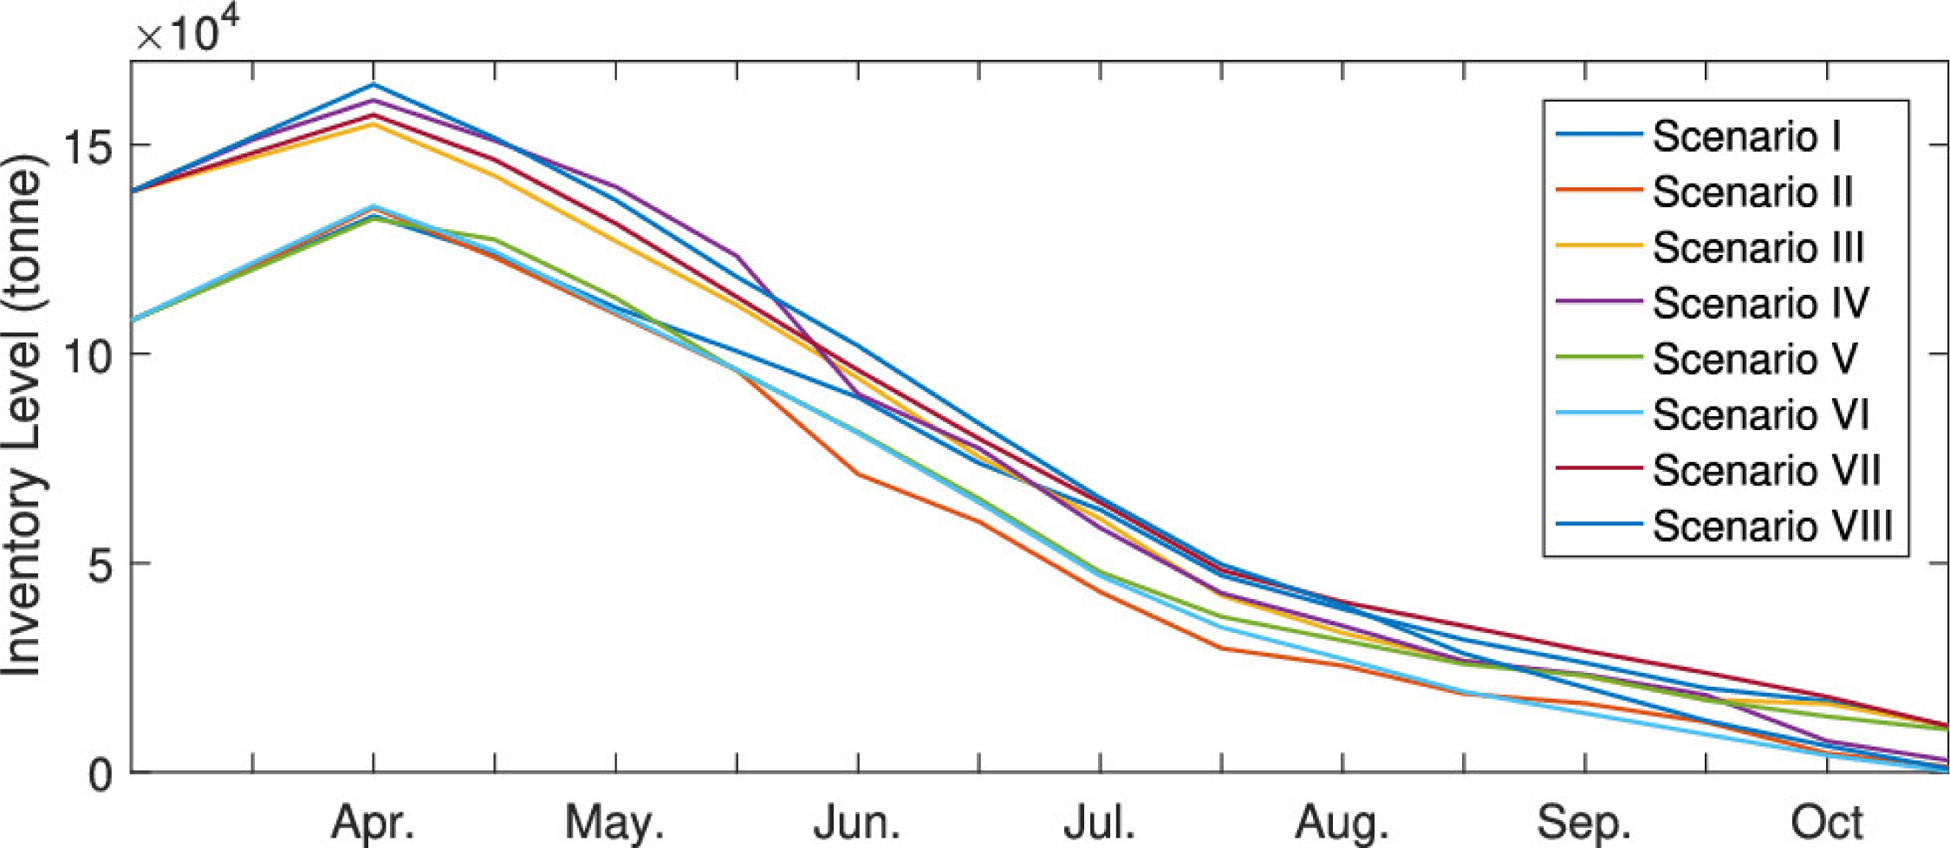
Overall inventory levels for manure.
In Figure 11, we present the nutrient loading maps for scenarios II, VI, and VII at different time periods. For scenarios II and VI, since the NMP enforcement is loose and fertilizers are demanded by farmers, the phosphorus is highly imbalanced in the area. Scenario II presents a more severe situation since no nutrient recovery technology is installed. For scenario VII, even though the winter storage level is higher, we find that with proper logistic design, a more balanced P distribution is achievable. We also note that most excess phosphorus appears in April when the nutrient demand from crops is relatively small. When the nutrient demand increases, the excess phosphorus decreases. As mentioned earlier, we can draw a similar conclusion that a potential preventive action is to stimulate the involvement of the storage systems before the crops are planted to store the animal waste for later use. For scenario VII, we note that, although the hot spots are similar, the nutrient loading is reduced, and this suppresses the development of HABs. The presence of similar P hot spots in all scenarios shows the consistency of the economic-driven logistics network.
Figure 11.
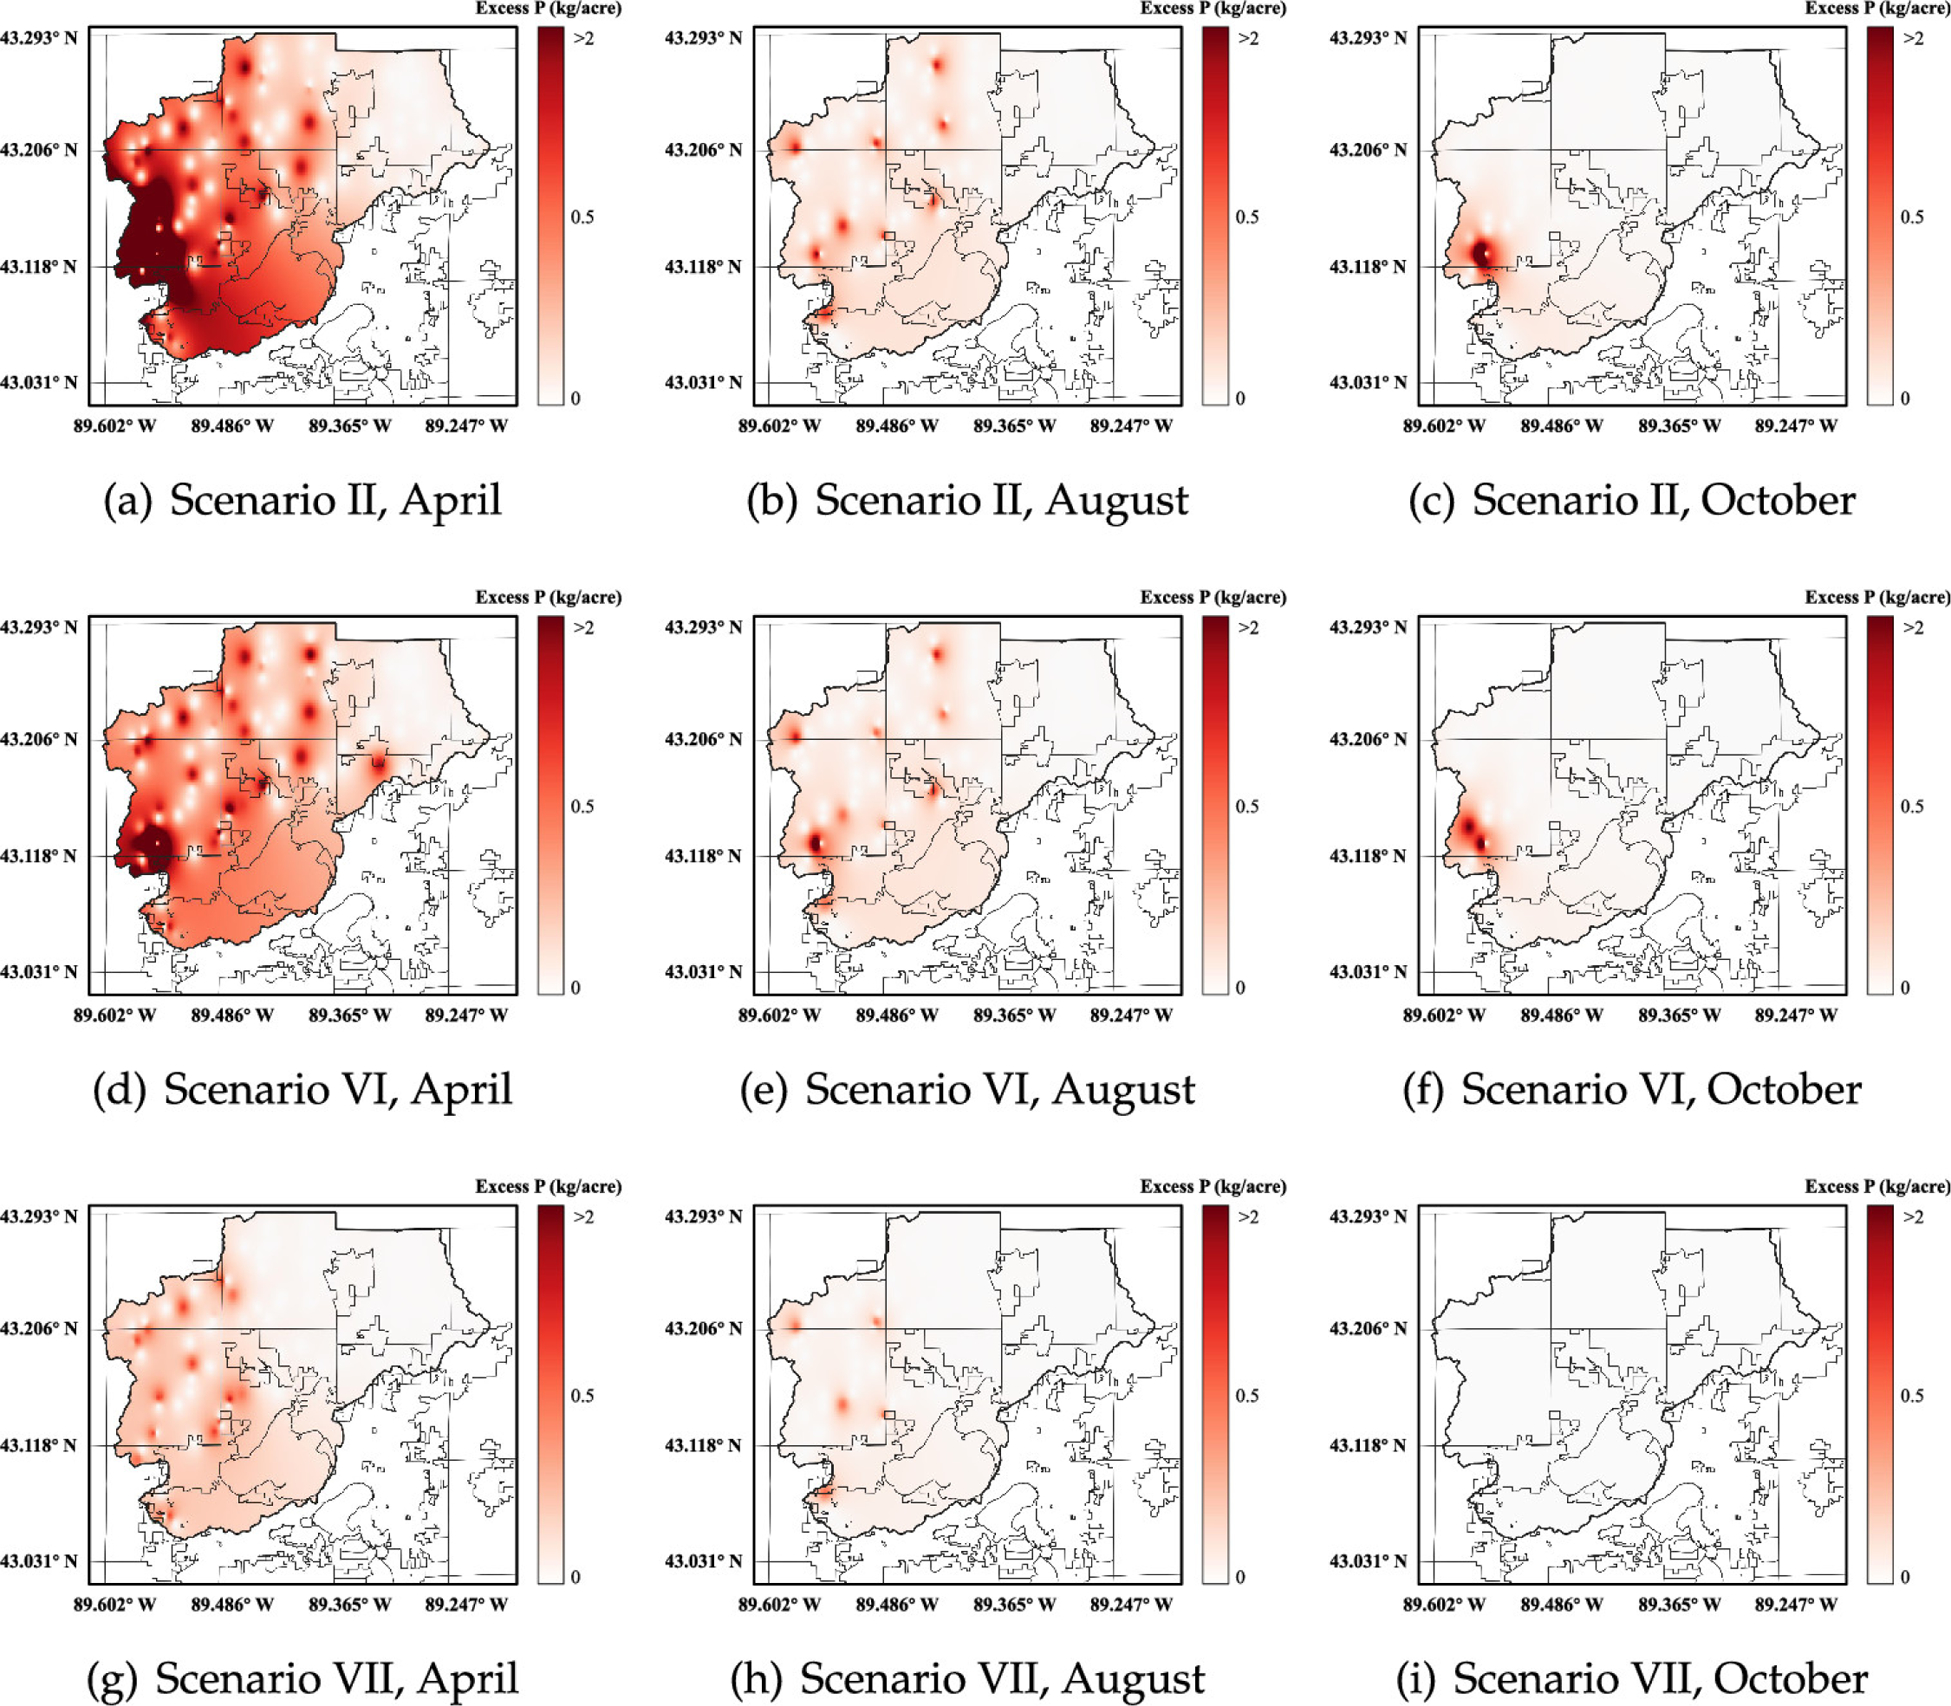
Phosphorus loadings in scenarios II, VI, and VII and at different times: (a) scenario II, April, (b) scenario II, August, (c) scenario II, October, (d) scenario VI, April, (e) scenario VI, August, (f) scenario VI, October, (g) scenario VII, April, (h) scenario VII, August, and (i) scenario VII, October.
Trade-Off Analysis between Economic and Environmental Objectives
Finally, we perform a trade-off analysis between the economic costs (transportation, technology, and fertilizer costs) and the HAB levels by varying the environmental costs (enforcing NMP more strictly) in the logistics network under two settings, presented in Figure 12. This problem is a trade-off problem in the sense that the unit environmental cost acts as a weight (e.g., price guarantee, feed-in tariff) of the environmental objective, and by varying this parameter, we are varying the relative importance of the economic and environmental objectives. The modeling framework seeks to find pareto solutions that coordinate the two objectives on the pareto front. The red plane represents the high probability levels of acute health effects due to HABs. Figure 12a shows the trade-off with a 70% initial storage, a high initial nutrient concentration (120 mg P/m3), and the use of separation technology. The environmental costs of excess phosphorus are U.S. $0, $6.6, $13.2, and $19.8 kg–1 excess P (scenario VI has the same initial condition with an environmental cost of U.S. $0 kg–1 excess P). The ratio of the environmental costs of excess phosphorus and nitrogen remains unchanged. From the graph, we find that the cost necessary to keep the curve near the red plane is about U.S. $1.25 million. To be specific, this cost only includes transportation cost and pure operational cost of technology; no additional investment is included. If we further increase the environmental costs, we cannot decrease the HAB level further. In this case, the cost associated with HAB prevention reaches U.S. $0.36 million given the worst-case cost is U.S. $0.89 million.
Figure 12.
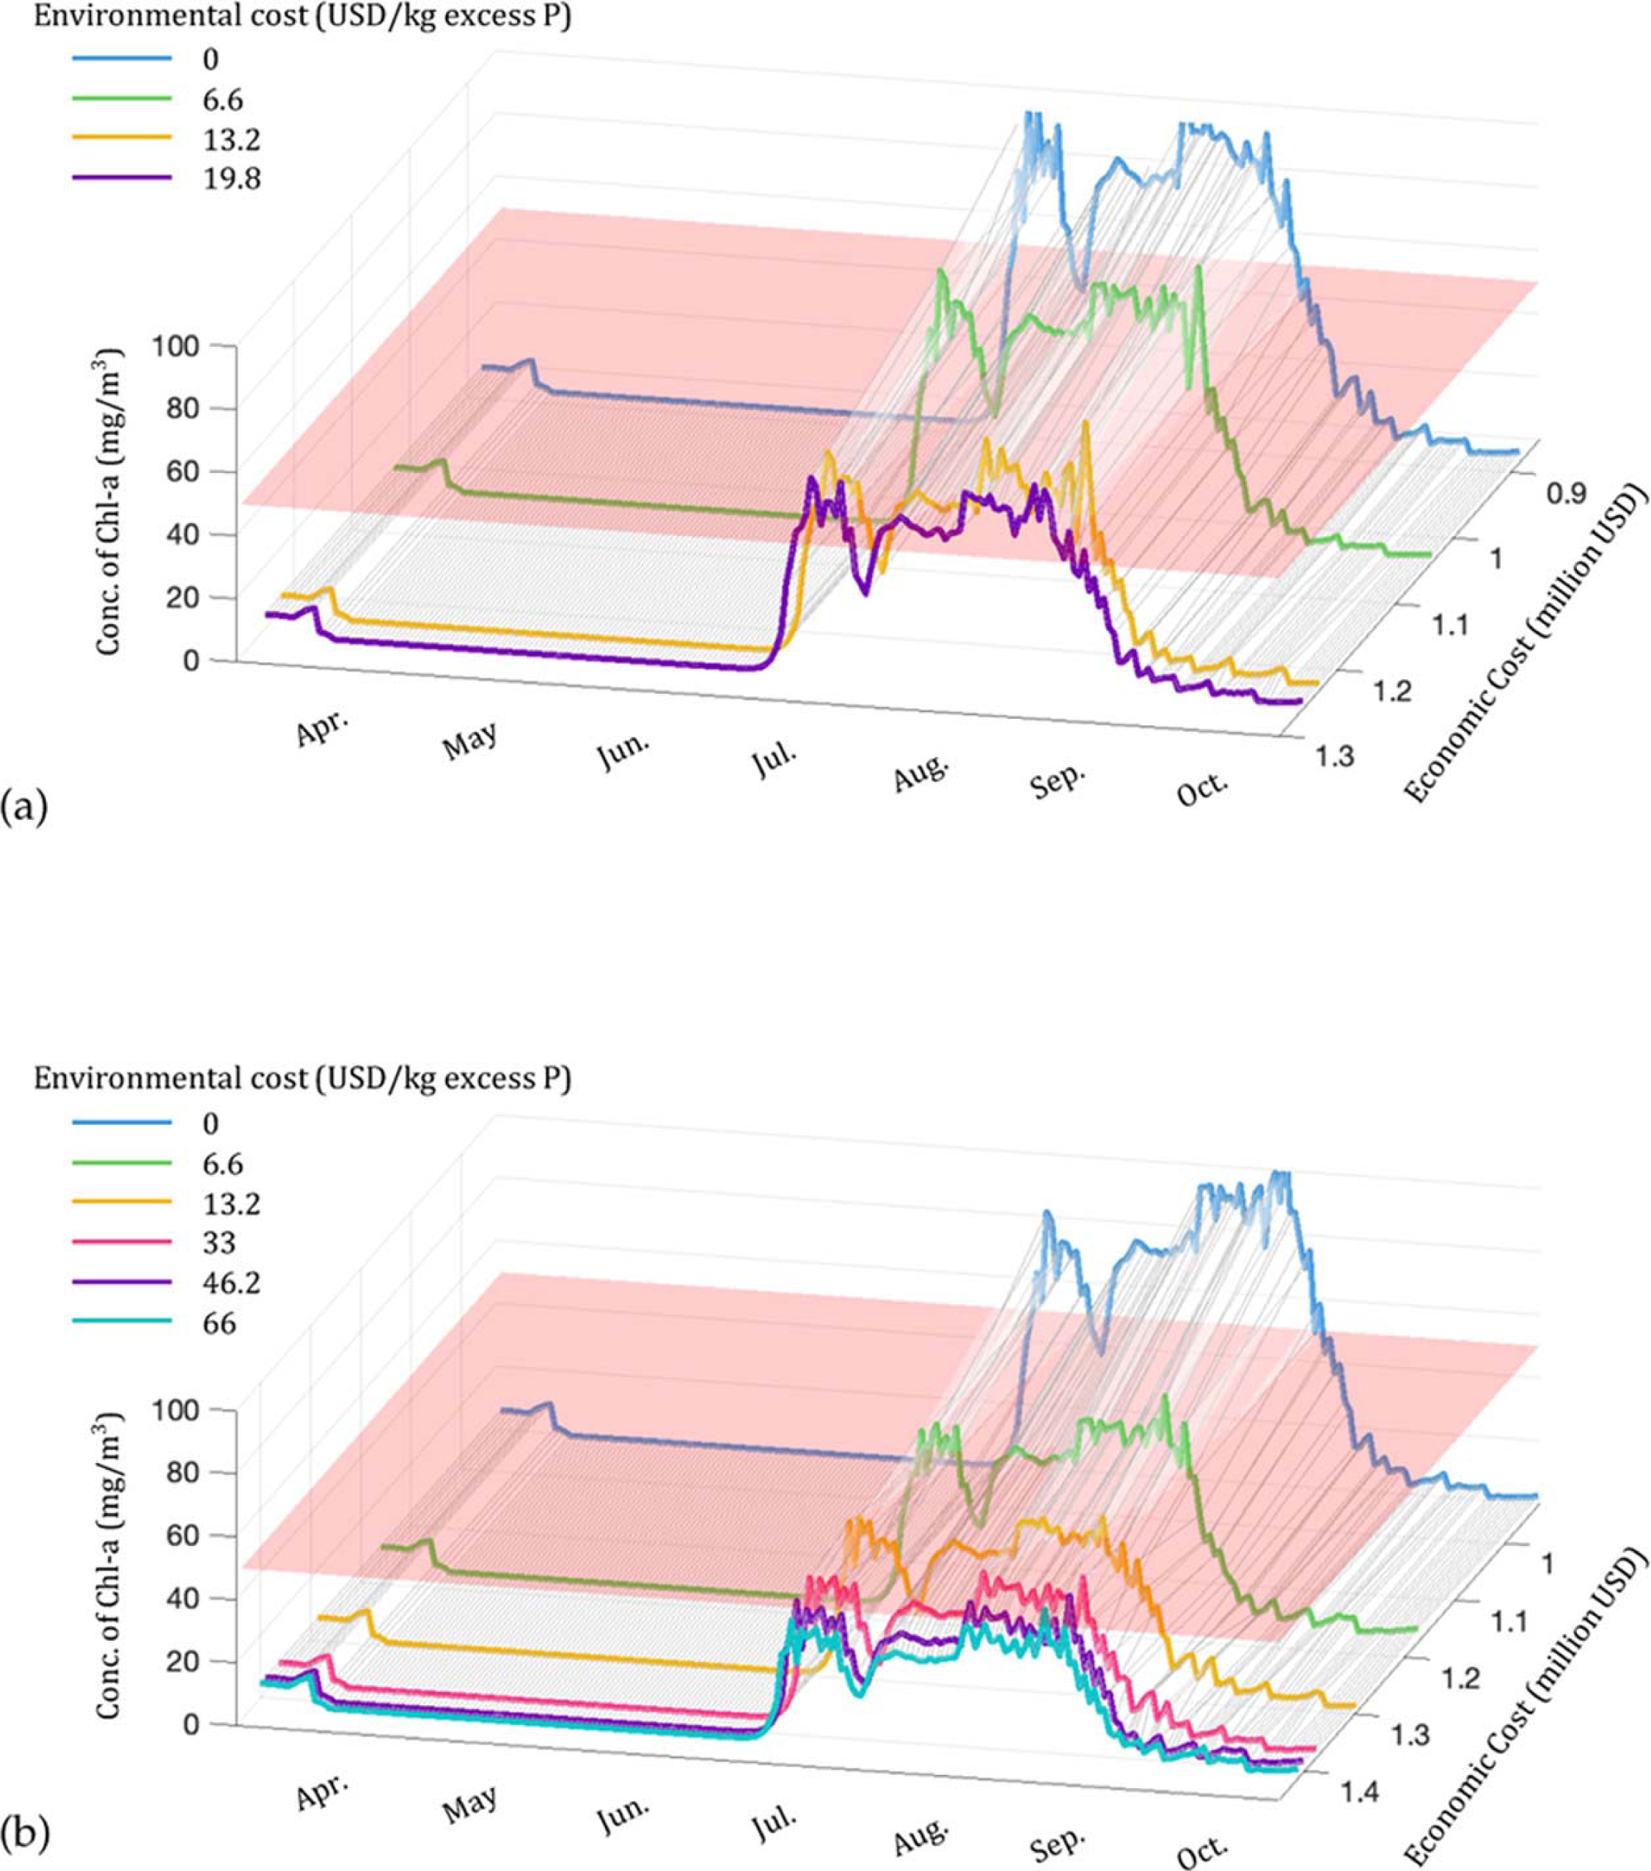
Trade-off analysis between economic costs and nutrient pollution levels: (a) trade-off analysis with a 70% initial storage, a high initial nutrient concentration, and the use of separation technologies, and (b) trade-off analysis with a 90% initial storage, a low initial nutrient concentration, and the use of separation technologies.
Figure 12b shows the trade-off with a 90% initial storage, a low initial nutrient concentration (45 mg P/m3), and the use of separation technology. The environmental costs of excess phosphorus are U.S. $0, $6.6, $13.2, $33, $46.2, and $66 kg–1 excess P, respectively (scenarios VII and VIII have the same initial condition with an environmental cost of U.S. $33 and $0 kg–1 excess P, respectively). The cost to keep the curve under the red plane is still around U.S. $1.40 million. We note that our estimate of prevention cost is conservative because it does not factor in storage cost, cost related to policy implementation, and cost of technology development and investment. Additionally, if we compare the two cases we studied, we find that when the starting condition is relatively better (high winter storage and low nutrient concentration), we have the option to spend more money in the logistics and inventory planning to avoid nutrient runoff and reduce the HAB levels to a relatively large extent compared to present conditions. On the other hand, if the starting condition is not favorable (initial storage is low and the nutrient has already entered the lake), a small reduction in the HAB levels can be achieved. Since the current situation in the study area is closer to the worse case, mid- and long-term prevention efforts and remediation actions (e.g., direct lake cleaning, HAB scum removal) will be needed to control the nutrient runoff from agricultural lands and to accelerate the recovery of the lake.
Concluding Remarks and Future Work
In this work, we presented a computational framework to manage organic waste from agriculture activities for reducing and preventing nutrient pollution and HABs. We employed an existing nutrient fate and transport model NEWS2, and an algae growth model PROTECH, to study the impact of the decisions made in the logistics network management on the environment. This modeling framework can be used to predict if a HAB will occur in the worst case and if offhand preventive actions are enough to prohibit the occurrence by controlling the related environmental conditions. We also provided a case study for the Upper Yahara Watershed in the state of Wisconsin to show the practicability of the modeling framework. We have found that the logistics network management for waste and nutrients can reduce the incidence rates of HABs effectively but reducing to a nonharmful level may require long-term efforts such as installing advanced manure treatment technologies and storage systems. In addition, we studied the impact of different nutrient pollution control strategies including coordinated manure storage and application, nutrient management incentive plans, and nutrient recovery technologies. We found that all three strategies can reduce nutrient release by a certain amount and, by extension, reduce the level of HABs. Among them, using strict nutrient management plans can achieve the best immediate effects, and coordinated manure application planning in winter has a significant influence on the occurrence of HABs in the following summer. The three strategies have synergistic effects in the sense that, when applied together and considering a unit environmental cost incentive for nutrient recovery (price guarantee), they can reduce the HAB levels to the greatest extent. In addition, this contribution aims to offer more realistic nutrient pollution prevention and control costs and employ this framework for the design and evaluation of feasible and efficient nutrient management incentives and policies.
In future work, we plan to extend our framework to incorporate a perennial setting and plan to use site-specific soil and crop data (to include legacy phosphorus in the soil). The concentration of legacy phosphorus in the soil can play a significant auxiliary role in guiding the logistics network design to adjust the phosphorus preference in cropland nutrient recycling and to understand the long-term impact of nutrient management strategies. In addition, we intend to refine our modeling framework by examining the influence of the investment of new nutrient recovery technologies on the HAB development, incorporating more rigorous fertilizing models for different types of crops and more accurate nutrient transport models.
Synopsis.
This modeling framework proposes a logistic network management for waste and nutrients to conduct space−time control of nutrient pollution and harmful algal blooms in water bodies.
Variables
- Ii,p,τ
inventory level of material p at node i and at the end of time period τ
- fi,j,p,τ
transportation flow of material p from node i to node j at time period τ
- gi,t,p,τ
the generation amount (consumption if negative) of material p through technology t at node i and at time period τ
- di,p,τ
demand value of material p at node i and at time period τ
- xi,p
binary variable to indicate the installation of storage system for material p at node i
- yi,t
binary variable to indicate the installation of technology t at node i
- NPi,τ
net excess phosphorus at node i and at time period τ
- NNi,τ
net excess nitrogen at node i and at time period τ
- ferPi,τ
phosphorus from fertilizers at node i and at time period τ
- ferNi,τ
nitrogen from fertilizers at node i and at time period τ
- Cinv
total investment cost
- Ctrans,τ
total transportation cost in time period τ
- Cop,τ
total operational cost in time period τ
- Cfer,τ
total fertilizer cost in time period τ
- Csup,τ
total supply cost in time period τ
- Rτ
total revenue in time period τ
Parameters
- si,p,τ
supply value of material p at node i and at time period τ
- αt,p
yield factor of material p in technology t
- pref(t)
the reference material of technology t
demand capacity of material p at node i and at time period τ
storage capacity of material p at node i
- Ct
reference capacity of technology t
capacity of the transportation flow of material p from node i to node j at time period τ
- eP,p
phosphorus emission coefficient of material p
- eN,p
nitrogen emission coefficient of material p
- Pdi,τ
phosphorus demand of crops at node i and at time period τ
- Ndi,τ
nitrogen demand of crops at node i and at time period τ
- Cinv,t
investment cost of technology t
- Cinv,p
investment cost of the storage system for material p
- β
depreciation factor for the investment cost of technologies
- γ
depreciation factor for the investment cost of storage systems
- Di,j
distance between node i and node j
- Ctrans,p
transportation cost of material p per-unit distance and per unit of flow
- Cop,t
operational cost of technology t when processing one unit of reference material
- ρP
market price for one unit of phosphorus in fertilizer
- ρN
market price for one unit of nitrogen in fertilizer
- ρi,p,τs
supply price of material p at node i and at time period
- ρi,p,τd
demand price of material p at node i and at time period τ
- λP
environmental cost per-unit excess phosphorus
- λN
environmental cost per-unit excess nitrogen
Footnotes
The views expressed in this article are those of the authors and do not necessarily reflect the views or policies of the U.S. Environmental Protection Agency. Mention of trade names, products, or services does not convey and should not be interpreted as conveying, official U.S. EPA approval, endorsement, or recommendation.
The authors declare no competing financial interest.
References
- 1.Ruane E; Treacy M; McNamara K; Humphreys J Farm-gate phosphorus balances and soil phosphorus concentrations on intensive dairy farms in the south-west of Ireland. Ir. J. Agric. Food Res 2014, 105–119 [Google Scholar]
- 2.Cordell D; Neset T-SS; Prior T The phosphorus mass balance: identifying ‘hotspots’ in the food system as a roadmap to phosphorus security. Curr. Opin. Biotechnol 2012, 23, 839–845, DOI: 10.1016/j.copbio.2012.03.010 [DOI] [PubMed] [Google Scholar]
- 3.Kovacs A; Honti M; Zessner M; Eder A; Clement A; Blöschl G Identification of phosphorus emission hotspots in agricultural catchments. Sci. Total Environ 2012, 433, 74–88, DOI: 10.1016/j.scitotenv.2012.06.024 [DOI] [PMC free article] [PubMed] [Google Scholar]
- 4.Heisler J; Glibert PM; Burkholder JM; Anderson DM; Cochlan W; Dennison WC; Dortch Q; Gobler CJ; Heil CA; Humphries E Eutrophication and harmful algal blooms: a scientific consensus. Harmful Algae 2008, 8, 3–13, DOI: 10.1016/j.hal.2008.08.006 [DOI] [PMC free article] [PubMed] [Google Scholar]
- 5.Graham JL; Loftin KA; Kamman N Monitoring Recreational Freshwaters. Lakelines; NALMS, 2009; Vol. 29, pp 18–24. [Google Scholar]
- 6.Wisconsin Department of Natural Resources. Guidance for Implementing Wisconsin’s Phosphorus Water Quality Standards for Point Source Discharges; Wisconsin Department of Natural Resources, 2017. [Google Scholar]
- 7.Goedkoop M; Heijungs R; Huijbregts M; De Schryver A; Struijs J; Van Zelm R ReCiPe 2008: A Life Cycle Impact Assessment Method Which Comprises Harmonised Category Indicators at the Midpoint and the Endpoint Level; Ministerie van VROM, 2009; Vol. 1. [Google Scholar]
- 8.Bare J Tool for the Reduction and Assessment of Chemical and Other Environmental Impacts (TRACI) TRACI version 2.1 User’s Guide; Environmental Protection Agency Office of Research and Development: Washington, DC, 2012. [Google Scholar]
- 9.Paul MJ; Walsh B; Oliver J; Thomas D Algal Indicators in Streams: A Review of Their Application in Water Quality Management of Nutrient Pollution; United States Environmental Protection Agency, 2017. [Google Scholar]
- 10.Carlson RE A trophic state index for lakes. Limnol. Oceanogr 1977, 22, 361–369, DOI: 10.4319/lo.1977.22.2.0361 [DOI] [Google Scholar]
- 11.Division of Environmental Management. Wisconsin Water Quality Report to Congress; Wisconsin Department of Natural Resources, 2016. [Google Scholar]
- 12.Backer L; Manassaram-Baptiste D; LePrell R; Bolton B Cyanobacteria and algae blooms: review of health and environmental data from the Harmful Algal Bloom-Related Illness Surveillance System (HABISS) 2007–2011. Toxins 2015, 7, 1048–1064, DOI: 10.3390/toxins7041048 [DOI] [PMC free article] [PubMed] [Google Scholar]
- 13.Adams CM; Larkin SL; Hoagland P; Sancewich B Assessing the Economic Consequences of Harmful Algal Blooms: A Summary of Existing Literature, Research Methods, Data, and Information Gaps Harmful Algal Blooms: A Compendium Desk Reference; John Wiley & Sons, 2018; pp 337–354. [Google Scholar]
- 14.Johansen R; Beck R; Nowosad J; Nietch C; Xu M; Shu S; Yang B; Liu H; Emery E; Reif M Evaluating the portability of satellite derived chlorophyll-a algorithms for temperate inland lakes using airborne hyperspectral imagery and dense surface observations. Harmful Algae 2018, 76, 35–46, DOI: 10.1016/j.hal.2018.05.001 [DOI] [PMC free article] [PubMed] [Google Scholar]
- 15.Dai G; Zhong J; Song L; Guo C; Gan N; Wu Z Harmful algal bloom removal and eutrophic water remediation by commercial nontoxic polyamine-co-polymeric ferric sulfate-modified soils. Environ. Sci. Pollut. Res 2015, 22, 10636–10646, DOI: 10.1007/s11356-015-4274-4 [DOI] [PubMed] [Google Scholar]
- 16.Zandi Atashbar N; Labadie N; Prins C Modelling and optimisation of biomass supply chains: a review. Int. J. Prod. Res 2018, 56, 3482–3506, DOI: 10.1080/00207543.2017.1343506 [DOI] [Google Scholar]
- 17.Akram U; Tonderski K; Quttineh N-H; Wennergren U; Metson GS Optimizing nutrient recycling from excreta in Sweden and Pakistan: Higher spatial resolution makes transportation more attractive. Front. Sustainable Food Syst 2019, 3, 50 DOI: 10.3389/fsufs.2019.00050 [DOI] [Google Scholar]
- 18.Scown MW; McManus MG; Carson JH Jr.; Nietch CT Improving Predictive Models of In-Stream Phosphorus Concentration Based on Nationally-Available Spatial Data Coverages. J. Am. Water Resour. Assoc 2017, 53, 944–960, DOI: 10.1111/1752-1688.12543 [DOI] [PMC free article] [PubMed] [Google Scholar]
- 19.Sampat AM; Martin E; Martin M; Zavala VM Optimization formulations for multi-product supply chain networks. Comput. Chem. Eng 2017, 104, 296–310, DOI: 10.1016/j.compchemeng.2017.04.021 [DOI] [Google Scholar]
- 20.Hu Y; Scarborough M; Aguirre-Villegas H; Larson RA; Noguera DR; Zavala VM A Supply Chain Framework for the Analysis of the Recovery of Biogas and Fatty Acids from Organic Waste. ACS Sustainable Chem. Eng 2018, 6, 6211–6222, DOI: 10.1021/acssuschemeng.7b04932 [DOI] [Google Scholar]
- 21.Morelli B; Hawkins TR; Niblick B; Henderson AD; Golden HE; Compton JE; Cooter EJ; Bare JC Critical review of eutrophication models for life cycle assessment. Environ. Sci. Technol 2018, 52, 9562–9578, DOI: 10.1021/acs.est.8b00967 [DOI] [PMC free article] [PubMed] [Google Scholar]
- 22.Neitsch SL; Arnold JG; Kiniry JR; Williams JR Soil and Water Assessment Tool, Theoretical Documentation version 2009; Texas A&M University, 2011. [Google Scholar]
- 23.Mayorga E; Seitzinger SP; Harrison JA; Dumont E; Beusen AH; Bouwman A; Fekete BM; Kroeze C; Van Drecht G Global nutrient export from WaterSheds 2 (NEWS 2): model development and implementation. Environ. Modell. Software 2010, 25, 837–853, DOI: 10.1016/j.envsoft.2010.01.007 [DOI] [Google Scholar]
- 24.McCrackin ML; Harrison JA; Compton JE A comparison of NEWS and SPARROW models to understand sources of nitrogen delivered to US coastal areas. Biogeochemistry 2013, 114, 281–297, DOI: 10.1007/s10533-012-9809-x [DOI] [Google Scholar]
- 25.Cronshey R Urban Hydrology for Small Watersheds; USDA, 1986. [Google Scholar]
- 26.Reynolds C; Irish A; Elliott J The ecological basis for simulating phytoplankton responses to environmental change (PROTECH). Ecol. Modell 2001, 140, 271–291, DOI: 10.1016/S0304-3800(01)00330-1 [DOI] [Google Scholar]
- 27.Markensten H; Pierson DC Weather driven influences on phytoplankton succession in a shallow lake during contrasting years: application of PROTBAS. Ecol. Modell 2007, 207, 128–136, DOI: 10.1016/j.ecolmodel.2007.04.023 [DOI] [Google Scholar]
- 28.Stumm W; Morgan JJ Aquatic Chemistry: Chemical Equilibria and Rates in Natural Waters; John Wiley & Sons, 2012; Vol. 126. [Google Scholar]
- 29.Sharara M; Sampat A; Good LW; Smith AS; Porter P; Zavala VM; Larson R; Runge T Spatially explicit methodology for coordinated manure management in shared watersheds. J. Environ. Manage 2017, 192, 48–56, DOI: 10.1016/j.jenvman.2017.01.033 [DOI] [PubMed] [Google Scholar]
- 30.Larson R; Sharara M; Good L; Porter T; Zavala V; Sampat A; Smith A Evaluation of Manure Storage Capital Projects in the Yahara River Watershed, Technical Report for Dane County, WI; University of Wisconsin-Extension and UW-Madison College of Agricultural and Life Sciences, Biological Systems Engineering, 2016. [Google Scholar]
- 31.Sampat AM; Hu Y; Sharara M; Aguirre-Villegas H; Ruiz-Mercado G; Larson RA; Zavala VM Coordinated Management of Organic Waste and Derived Products. Comput. Chem. Eng 2019, 128, 352–363, DOI: 10.1016/j.compchemeng.2019.06.008 [DOI] [PMC free article] [PubMed] [Google Scholar]
- 32.Sharara MA; Runge T; Larson R; Primm JG Techno-economic optimization of community-based manure processing. Agric. Syst 2018, 161, 117–123, DOI: 10.1016/j.agsy.2018.01.006 [DOI] [Google Scholar]
- 33.Cabrera VE; Mathis C; Kirksey R; Baker T NM-Manure: A Seasonal Prediction Model for Manure Excretion by Dairy Cattle in New Mexico; Agricultural Experiment Station, College of Agriculture and Home Economics, New Mexico State University, 2007. [Google Scholar]
- 34.Sampat AM; Martín-Hernández E; Martín M; Zavala VM Technologies and logistics for phosphorus recovery from livestock waste. Clean Technol. Environ. Policy 2018, 1563–1579, DOI: 10.1007/s10098-018-1546-y [DOI] [Google Scholar]
- 35.USDA. Soil Conservation Service. Agricultural Waste Management Field Handbook; National Engineering Handbook; United States Department of Agriculture: Washington, 1992. [Google Scholar]
- 36.Jones C; Olson-Rutz K; Dinkins C Nutrient Uptake Timing by Crops; Montana State University: Montana, 2011. [Google Scholar]
- 37.NASS USDA. Usual Planting and Harvesting Dates for US Field Crops Agricultural Handbook; United States Department of Agriculture, 1997; Vol. 628. [Google Scholar]
- 38.Bouwman A; Beusen AH; Billen G Human alteration of the global nitrogen and phosphorus soil balances for the period 1970–2050. Global Biogeochem. Cycles 2009, 23 DOI: 10.1029/2009GB003576 [DOI] [Google Scholar]
- 39.Dentener F; Stevenson D; Ellingsen K; Van Noije T; Schultz M; Amann M; Atherton C; Bell N; Bergmann D; Bey I The global atmospheric environment for the next generation. Environ. Sci. Technol 2006, 40, 3586–3594, DOI: 10.1021/es0523845 [DOI] [PubMed] [Google Scholar]
- 40.Montgomery R SWAT Model to estimate Baseline Phosphorus Loading to the Yahara Watershed; Montgomery Associates: Resource Solutions (MARS), 2014. [Google Scholar]
- 41.NRCS, USDA. National Engineering Handbook: Part 630—Hydrology; USDA Soil Conservation Service: Washington, DC, 2004. [Google Scholar]
- 42.Dane County Erosion Control and Stormwater Management Manual; Dane County Land & Water Resources Department, 2002. [Google Scholar]
- 43.Elliott J; Irish A; Reynolds C Predicting the spatial dominance of phytoplankton in a light limited and incompletely mixed eutrophic water column using the PROTECH model. Freshwater Biol 2002, 47, 433–440, DOI: 10.1046/j.1365-2427.2002.00813.x [DOI] [Google Scholar]
- 44.Mironov D; Heise E; Kourzeneva E; Ritter B; Schneider N; Terzhevik A Implementation of the lake parameterisation scheme FLake into the numerical weather prediction model COSMO. Boreal Environ. Res 2010, 218–230 [Google Scholar]
- 45.Sampat AM; Ruiz-Mercado GJ; Zavala VM Economic and Environmental Analysis for Advancing Sustainable Management of Livestock Waste: A Wisconsin Case Study. ACS Sustainable Chem. Eng 2018, 6, 6018–6031, DOI: 10.1021/acssuschemeng.7b04657 [DOI] [PMC free article] [PubMed] [Google Scholar]
- 46.Norris GA Impact characterization in the tool for the reduction and assessment of chemical and other environmental impacts: Methods for acidification, eutrophication, and ozone formation. J. Ind. Ecol 2002, 6, 79–101, DOI: 10.1162/108819802766269548 [DOI] [Google Scholar]
- 47.World Health Organization. Guidelines for Safe Recreational Water Environments: Coastal and Fresh Waters; World Health Organization, 2003; Vol. 1. [Google Scholar]
- 48.Schnitkey G Current Fertilizer Prices and Projected 2016 Fertilizer Costs. farmdoc daily (5):232, Department of Agricultural and Consumer Economics, University of Illinois at Urbana-Champaign, December 15, 2015. [Google Scholar]


