

Abstract
4-Aminobenzoic acid (4ABA) is a biologically relevant, small organic molecule with two protonation sites: the amino group (N-protomer) and the carboxyl group (O-protomer). The O-protomer is energetically preferred in the gas-phase, while the higher energy N-protomer can be trapped using aprotic solvents such as acetonitrile during electrospray ionization. Here, we focus on the structure of the O-protomer, which can occur in three low-lying isomeric forms that result from different orientations of the OH groups relative to the benzene ring. We report the vibrational spectra of both N- and O-protomers of the cryogenically cooled ions in the gas phase over the spectral range 800–4000 cm−1. The bands arising from the OH stretches are isolated from the nearby NH stretching fundamentals using isotopic labeling as well as by analysis of the shifts in these fundamentals upon attachment of D2 and N2 molecules to the OH groups of the O-protomer. The spectra of isomers derived from the different locations of the adducts were isolated using two-color, IR-IR photofragmentation spectroscopy. The docking motifs by which the O-protomer binds to another 4ABA molecule is also explored and found to feature a bifurcated arrangement involving attachment of both OH groups of the protonated head group to the carbonyl group of the neutral partner.
Keywords: 4-Amniobenzoic acid, para-Amniobenzoic acid, vibrational spectroscopy, protomer, isomer-selective
Graphical Abstract

1. Introduction
4-Aminobenzoic acid (para-aminobenzoic acid, 4ABA) is a versatile molecule [1–4] that is useful in the syntheses of a diverse array of compounds with practical applications [2, 5–9]. Here we are concerned with the protonated acid, H+−4ABA, a species that occurs in two isomeric forms according to whether protonation occurs at the amine or carboxyl groups, hereafter denoted the N- and O-protomers, with the calculated structures indicated in Fig. 1. Interestingly, the relative energies of the two protomers is strongly solvent dependent such that the O-protomer is 30–40 kJ/mol more stable in isolation (i.e., the gas phase), but the N-protomer is ~20 kJ/mol more stable in water. [10–12]. This scenario raises interesting possibilities when the cations are introduced into the gas phase using electrospray ionization [12–15]. In particular, spraying from acetonitrile (ACN) solutions yields the higher energy N-protomer, while spraying in water yields the O-protomer. Although both of these protomers have been characterized by vibrational spectroscopy and ion mobility [12, 13, 16], the spectral coverage of the IR studies is incomplete and the measurements were carried out on ions at relatively high temperature. Here and specifically address the structure of the protonated carboxylic head group of the O-protomer, which could occur in three rotameric forms (Fig.1A–C). Recently, Davies et al. [17] reported infrared spectra of protonated acetic acid in He nanodroplets, where they isolated the OH features of the E- and Z-OH and showed that the E,Z-rotamer is the only rotamer present in the gas phase. Here, the spectra are obtained using the tagging technique [18, 19], hence the various bands are found to shift according to the location of the tag, X = D2 and N2. We use this effect to our advantage by sorting out the isomers that differ according to the tag position using two-color IR-IR photobleaching and following the evolution of the band shifts displayed when the interaction is systematically modified in the series H+−4ABA•Xn=1,2, X = D2 and N2. This information, complemented by spectra of the various isotopologues arising from H/D substitution, yield an unambiguous assignment of the NH and OH stretches to one of the rotameric forms of H+−4ABA. Finally, we consider how the O-protomer binds to strong H-bond acceptors by comparing the spectrum of 4ABA binary complex with calculated patterns to establish the possible binding motifs.
Figure 1.
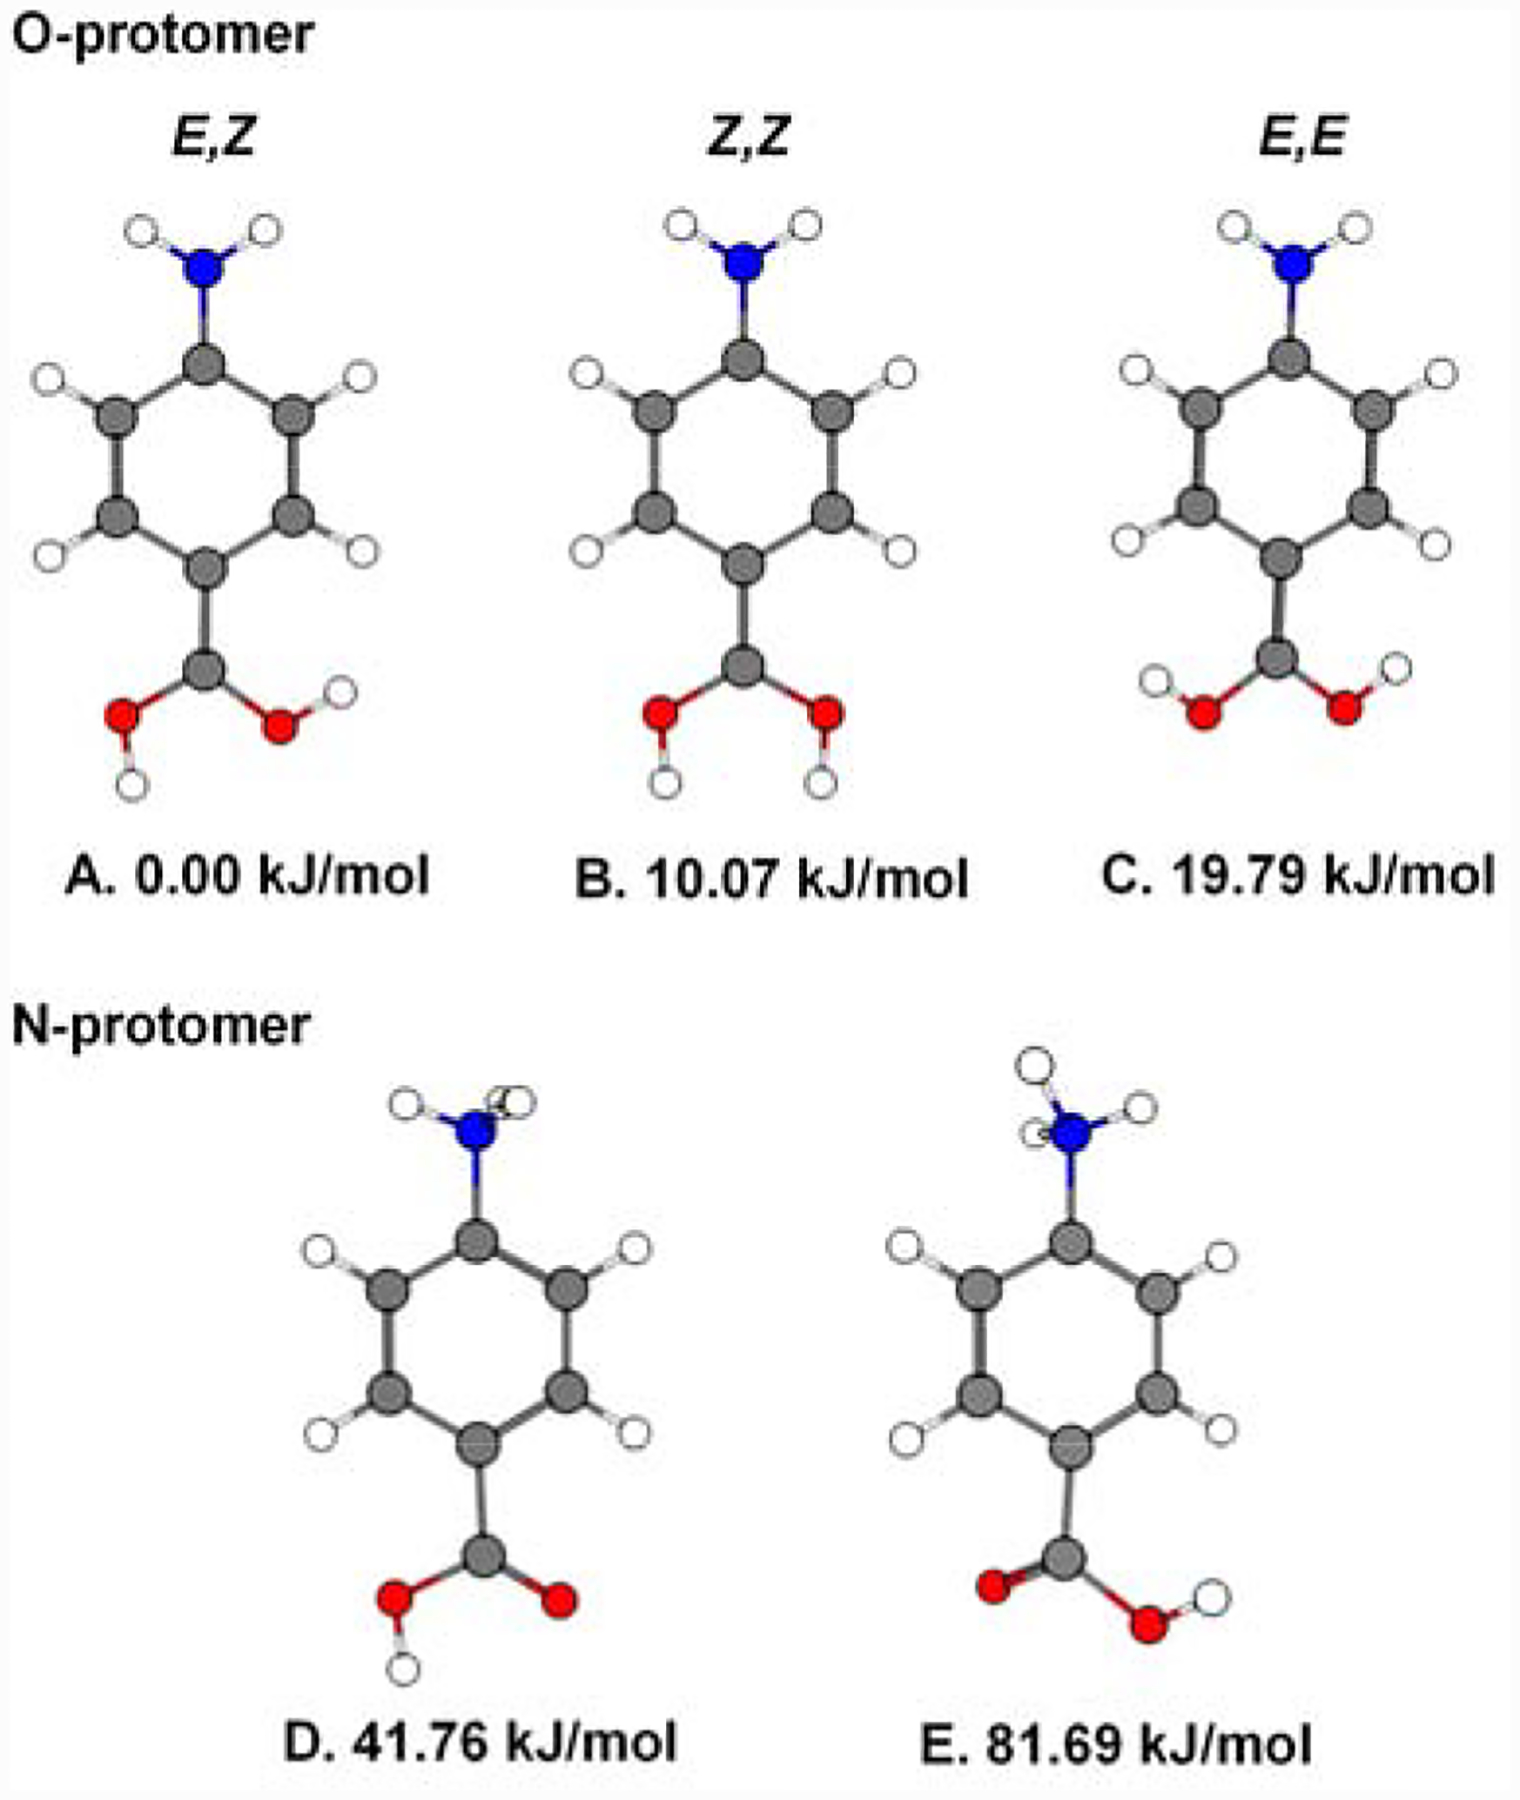
Geometry optimized structures of the possible rotamers of both the O- and N- protomers of H+−4ABA calculated at the B3LYP/aug-cc-pVTZ level of theory. ZPE corrected relative energies are displayed beneath the structures.
2. Experimental and Computational Methods
A detailed description of our method has been published in references [19, 20]. Briefly, 10 mM solutions of 4ABA powder (obtained from Sigma Aldrich with no further purification) dissolved in a (pH ~2) solution of formic acid and H2O, D2O, or 1:1 ACN:H2O underwent electrospray ionization (ESI), and the resulting ions were then transported to a 3D copper Paul trap using octupole radiofrequency ion guides. In the isotope substitution study, D2O doped with H2O was placed in the capsule for isotope exchange. The ions were then cooled to 15 K and “tagged” with He buffer gas doped with 25% X (X = D2, N2). The Xn=1,2-tagged species were then transferred to a double focusing tandem time-of-flight photofragmentation mass spectrometer described elsewhere [20]. Infrared radiation in the 600–4000 cm−1 region was generated by a LaserVision OPO/OPA. Resonant excitation of the Xn=1,2-tagged ion results in the evaporation of weakly bound tag molecule(s), creating a photofragment ion, which is monitored continuously to generate the vibrational predissociation spectrum. For the isomer selective study, a second laser was used to perform double-resonance spectroscopy: a “probe” laser was fixed on a particular probe transition while another “bleach” IR laser intersects the same ion packet before it interacts with the probe laser. As the pump laser removes population from the species selected by the probe frequency, the photofragment yield from the probe laser appears as a series of dips to unveil the isomer-selective spectrum. Minimum energy structures were calculated using the Gaussian 09 program package [21] with DFT/B3LYP method. Calculations of involving the monomer of H+4ABA (with and without D2 tag) were performed with the aug-cc-pVTZ basis set. The dimer, H+(4ABA)2, were calculated with the 6–311++G(d,p) basis set.
3. Results and Discussion
3.1. IRPD spectra of the D2-tagged N- and O-protomers of H+−4ABA
The spectra of the N- and O- protomers are easily isolated using the fact that the gas phase O-generated by spraying 4ABA dissolved in water, while the N-protomer is favored when it is sprayed in a mixed solvent consisting of acetonitrile and water (1:1 volume ratio) [11–16]. Figure 2 compares the D2-tagged spectra of the ions generated from ACN:H2O (Fig. 2A) and the formic acid solution (Fig. 2B). These spectra are indeed completely different and readily assigned to the expected protomers by cursory inspection of the band patterns. Specifically, the spectrum in Fig. 2A contains the carbonyl stretch at 1791 cm−1 that is unique to the N-protomer [12], as well as a singular OH stretch in the vicinity expected for a nonbonded OH group of carboxylic acid [27, 28]. The −NH3+ motif is also clear in the 3200–3400 cm−1 region as observed in many protonated amino compounds [22–25], indicated by the blue arrow in Figure 2A. Thus, the spectrum in Fig. 2A is unambiguously assigned to the N-protomer. The fact that the spectrum in Fig. 2B does not contain the C=O stretch, on the other hand, indicates that none of the N-protomer is prepared with the ACN solution, and indeed the −NH3+ signature is also missing while the OH stretching region is more complex as expected with two −COH groups on the protonated acid group. Consequently, the spectrum in Fig. 2B is that of the O-protomer. We note that, although these messenger-tag predissociation spectra are better resolved and more complete, parts of these spectra were reported earlier and are consistent with those obtained in this work. In particular, reported IRMPD spectra for the N-protomer in the NH/OH stretching region only show one peak in the NH3 stretching region [16, 29] where three peaks were expected, possibly due to IRMPD transparency [30], which could suppress absorptions. For the O-protomer, peak assignments suffer from the closely spaced NH2 and OH stretches as well as coupling-induced splitting on the NH2 group. For example, the NH2 antisymmetric stretch has been reported to be very close in energy with the OH stretches of the O-protomer [13, 16, 29], a typical scenario for systems with these functionalities [19, 23, 24, 31, 32]. Additionally, reported calculated spectra of the three O-rotamers showed that the OH stretches are close in energy [13]. Consequently, the isomeric composition of the O-protomer generated in the gas-phase is unresolved.
Figure 2.

Spectrum of H+−4ABA•D2 sprayed in H2O:ACN (A) vs. in H2O (B). Peaks assignments for trace A and trace B (fingerprint region) are in good agreement with electronic structure calculations (Fig. S1) and is colored accordingly. The presence of the carbonyl stretch at 1791 cm−1 in trace A unambiguously signifies the presence of the N-protomer. The NH and OH stretching region of trace B remains unassigned. Blue arrow indicates the −NH3+ stretching region for various protonated amino compounds in Ref. [22–25]. Calculated frequency are scaled by a factor of 0.968 according to the CCCBDB [26].
3.2. Assignment of the OH and NH stretches in the O-protomer through isotopic substitution and tag perturbations
To separate contributions from NH versus OH stretches in the O-protomer spectrum, we performed isotopic substitution, specifically involving incorporation of a single H atom into the otherwise perdeuterated H+−4ABA scaffold to quench coupling between the two NH groups. Note that in the absence of isotope fractionation, the single H atom can occupy two or three distinct sites depending on which rotamer(s) are present. The NH2 symmetric and antisymmetric stretches are expected to collapse into a single peak, whereas the distant OH stretches, which are only weakly coupled, are expected to remain largely intact. The isotopically labeled spectrum is shown in Figure 3A. Comparison with the spectrum of the all H isotopologue Figure 3B reveals the emergence of a new peak at 3495 cm−1 (blue) while the two peaks at 3441 cm−1 and 3542 cm−1 in the single H isotopologue (blue in Fig. 3B) are missing. Three peaks (red and orange) are persistent and therefore assigned to the OH stretches. The 3495 cm−1 feature falls almost exactly at the midpoint of the two missing bands and is therefore assigned to the uncoupled NH stretch of the NHD moiety. This procedure then establishes the vsym and vasym contributions of the NH2 group to the spectrum of the all H isotopologue (Fig. 3B) as blue features in Fig. 3B (3441 cm−1 and 3542 cm−1, respectively).
Figure 3.

A) Isotopically labeled vibrational spectrum of H+−4ABA•D2 (which occurs as the 4-amino-d2-benzoic acid-d1 and 4-amino-d1-benzoic acid-d2 isotopomers). Predissociation spectra of B) H+−4ABA•D2, C) H+−4ABA•(D2)2, D) H+−4ABA•N2, and E) H+−4ABA•(N2)2. Blue peaks represent NH stretches, red for bound OH, and orange for free OH.
Having identified the −NH2 contribution to the D2 tagged spectrum of the all H H+−4ABA isotopologue, we next consider the assignments of the three remaining peaks (3478, 3554, and 3595 cm−1) that did not shift in the single H spectrum in the context of the OH stretching contribution from the remaining two OH groups. The fact that there are more than two peaks raises the possibility that more than one rotamer is in play as well as the perturbation of the intrinsic spectrum by the D2 tag. To address the tag effect, we extended the study to include addition of a second D2 as well as complexation with a more strongly binding adduct, in this case N2. The relative strengths reflect the respective gas-phase basicities of 495 and 424 kJ/mol [33] for N2 and D2, respectively, and hence the expected redshift of the bound OH frequency should be larger for N2. Since the charge is localized on the carboxyl group for the O-protomer, the tag species is expected to interact only with the OH groups, thus only the peaks associated with the OH groups are expected to shift while the NH groups remain unchanged. Figure 3B–D summarize the result, where the 3441 and 3542 cm−1 peaks are recovered in all spectra, confirming the assignment that they are the vsym and vasym stretches of the NH2 group, respectively. Since the isotope study verified that the OH groups are very weakly coupled, we expect that attachment of a single tag will leave one OH at its intrinsic location, , while the other bound OH, , shifts in ways that depends on the binding strength of the adduct. If the dominant rotamer is isomer B or C in Figure 1, where both OH groups point in the same direction, then we would expect two OH stretching peaks since the tag species would break the degeneracy of the two . The case for isomer A is more complex, since the tag species could either bind to the E- or Z- positions, which could have different binding strengths [34], hence different redshifting magnitudes. That should yield a pattern of four bands, whereas the observed spectrum of the single tag only has three, which does not correspond to either of the scenarios outlined for the behavior of a single species.
One way to resolve this paradox is to add a second tag, which should yield a single band for rotamers B and C (Fig. 1) since the quasi-equivalent OH groups are both tagged, and two bands for the E,Z isomer (A in Fig. 1) if the intrinsic frequencies of the distinct OH groups are different and both are tagged. Harmonic calculations, for example, predict that the Z-OH group falls 48 cm−1 below that of E. The O-protomer spectrum of the 4-ABA•(D2)2 cluster is presented in Fig. 3C and indeed displays two bands (red) in addition to the blue bands from the NH2 group. Note that the highest energy feature disappears from the spectrum, indicating that this transition is due to the free OH of one of the distinct OH groups in the E,Z isomer. Based on the calculated behavior, this is assigned to the E-OH group pointing toward the ring, while the lower energy feature is retained and therefore is due to the fundamental. This exercise does not, however, reveal the location of the Z-OH group as only the E-OH feature was removed with the second tag. This remaining ambiguity can be resolved, however, by introduction of the more strongly bound N2 molecule, which yields the spectrum displayed in Fig. 3D. Indeed, a new band appears 89 cm−1 below the (D2) feature, which is expected for the shift when D2 is replaced by N2 on the Z-OH group. Now, there are four bands in addition to the two from the NH2 group, which is the pattern expected for the E,Z isomer described above. In that analysis (3D), the two highest frequency OH bands are the non-bonded, and hence intrinsic features of the E,Z O-protomer, as indicated in Fig. 3B. Curiously, however, that the N2 tagged spectrum contains a peak that is very close to the assigned D2-tagged Z-OH group. And the new assignment for the free Z-OH band appears very close to that assigned to the bound OH of the E-OH in the (D2)2 spectrum (Fig. 3C). This suggests that there is an accidental near degeneracy in play such that the locations of the bound OH groups are overlapping free positions, and the D2-tagged E-OH falls very close to the frequency of the free Z-OH! This scenario is consistent with the pattern in the H+−4ABA•(N2)2 spectrum (Fig. 3E), which establishes the frequencies of the bound E and Z-OH groups. Note that fingerprint region is not complicated by tag effects (Fig. S2).
3.3. Isolation of the tag site isomers in the H+−4ABA•D2 spectrum with IR2MS3 isomer-selective spectroscopy
Although self-consistent, this analysis of the tag shifts relies on two accidental near coincidences such that bands that fall in similar locations in the patterns are assigned to different species. This unfortunate circumstance could be resolved by introduction of yet another tag with intermediate binding energy, but a more systematic way to unambiguously establish the assignment is to leverage the fact that two isomers are invoked to explain the H+−4ABA•D2 spectrum (Fig. 3B), which differ according to which of the distinct OH groups is bound to the D2 molecule. As such, the spectra of each isomer can be isolated using two-color, IR-IR photobleaching, a method in which the populations of the isomers are removed upon excitation of the transitions associated each. By setting a probe laser on a specific transition monitoring the photofragmentation, the population of the isomer responsible for this transition is continuously monitored. When a second, powerful laser (the bleach laser) is scanned through the entire spectrum prior to the interrogation by the probe laser, all of the features associated with the probed isomer are revealed as population depletion or dips as a function of the bleach laser frequency. The method requires three stages of mass selection to separate the actions by the bleach and probe lasers, and is therefore classified as an IR2MS3 method of secondary ion analysis [20].
The isomer-selective scans revealed two distinct patterns that are overlapping in the non-selective spectrum (Fig. 3B), which are displayed as the depletion or “dip” spectra in Figure 4C and 4E. These were obtained by setting “probe” laser at the two positions, 3595 cm−1 (Fig. 4C) and 3554 cm−1 (Fig. 4E) indicated by the black arrows in Fig. 4, while scanning the spectrum with another “bleach” laser from 2900–3800 cm−1. The 3595 cm−1 band corresponds to the highest energy band in Fig. 3B, assigned to the fundamental. As such, we expect the Z-OH to be bound to the D2 tag, and indeed one of the three remaining dips in Fig. 4C appears at the band (red at 3478 cm−1). The more interesting case is that obtained with the probe laser set at 3554 cm−1, which we provisionally assigned to the band, should reveal the location of the bound E-OH group as a second dip. Interestingly, the bleach scan (Fig. 4D) only displays a single dip beyond the two expected for the NH2 bands. This confirms that the transition from the bound E-OH group, , indeed accidentally falls under the band, confirming the analysis based on tag shifts.
Figure 4.

A) IRMPD spectrum of H+−4ABA reproduced with permission from Ref. [13] B) Non-selective predissociation spectra of H+−4ABA•D2 in H2O. C) and E) Double resonance spectra with probe positions at 3595 cm−1 and 3554 cm−1, respectively, denoted by vertical black arrows. Dashed red and cyan vertical arrows on top of trace 4A at 3482 and 3550 cm−1, respectively, denote previously reported Z- and E-OH frequencies for protonated acetic acid [17]. Calculated spectra of the E,Z-isomer of H+−4ABA•D2 with D2 at the Z- (D) and E-position (F) at the B3LYP/aug-cc-pVTZ level of theory. Calculated frequencies are scaled by 0.96. Optimized structures of the isomers are shown to the right with ZPE corrected relative energies displayed above them. Blue peaks represent NH stretches, red for Z-OH, and cyan for E-OH. Horizontal arrows represent the D2 tag-induced shift of the Z-OH (red) and E-OH (cyan) groups.
The assignment of the two free OH transitions for E,Z isomer yields a close approximation to the expected spectrum for the bare ion. These positions are indicated by the dashed lines in Fig. 4A, which displays the IRMPD spectrum reported by Polfer for the bare ion at room temperature [13, 29]. Given the broadening expected for the non-linear method applied to ions with significant internal energy, the agreement of the observed features with those obtained from the tagged species is excellent, in turn establishing that the E,Z isomer was also in play in those studies. Curiously, the reported free Z- and E- OH frequencies measured in this study (3554 and 3595 cm−1, respectively) are higher than those observed in protonated acetic acid (H+-AA, 3482 and 3550 cm−1) [17]. This observation indicates the range of frequencies exhibited by the protonated carboxylic acid motif (R-C(OH) +2) with different R-groups. Although in both cases, the occurs at a lower frequency than the , the splitting between the two is significantly different (41 and 68 cm−1 for H+−4ABA and H+-AA, respectively).
3.4. Differences in the tag binding energies to the E- and Z-OH groups and anticooperativity upon N2 binding to both
Although the tag perturbations are rather large in this system, their behavior is also useful in that they encode how the orientation of the OH group affects the binding energy to that group. In both cases, the Z-OH group exhibits a much larger shift than the E-OH (see Table 1). Note that both molecules are predicted to bind with their axes roughly perpendicular to the OH group, which is typical for H-bond to cations [35]. In the case of the Z-OH, D2 binds with the center of the bond along the OH axis, while in the more weakly bound E-OH configuration, it is off this axis by about 30.8°. This misalignment appears to reduce the strength of this interaction, likely a result of the steric interference by the nearby CH group on the ring. Another interesting aspect of the tag shifts is the that for the more strongly interacting N2 complexes, attachment of a second molecule causes the OH groups originally bound to N2 to undergo blue shifts with magnitudes (14 and 10 cm−1) such that the Z-OH is more affected than the more weakly interacting E-OH group. This represents an anti-cooperative effect [36–39] between the two OH groups such that binding to one of them weakens the bond already in play with the other. This effect is not observed as strongly in D2 because D2 is a weaker H-bond acceptor than N2.
Table I.
Summarizing the experimental and calculated assigned normal modes of the O- and N- protomer. Calculated frequencies were computed at the B3LYP/aug-cc-pVTZ level of theory. The N-protomer calculated frequencies were scaled by 0.968 according to the CCCBDB. The calculated frequencies of H+−4ABA•X (X = D2, N2) O-protomer were scaled by 0.96.
| Band label | Observed freq. (cm−1) | Calculated scaled freq. (cm−1) | Description |
|---|---|---|---|
| O-protomer | |||
| 3441 | 3439 | NH2 symmetric strethch | |
| 3542 | 3549 | NH2 antisymmetric strethch | |
| 3595 | 3614 | Free E-OH stretch of the E,Z-rotamer | |
| 3554 | 3569 | Free Z-OH stretch of the E,Z-rotamer | |
| 3554 | 3547 | D2 bound E-OH stretch of the E,Z-rotamer | |
| 3478 | 3456 | D2 bound Z-OH stretch of the E,Z-rotamer | |
| 3492 | 3502 | N2 bound E-OH stretch of the E,Z-rotamer | |
| 3389 | 3388 | N2 bound Z-OH stretch of the E,Z-rotamer | |
| 3502 | - | 2N2 bound E-OH stretch of the E,Z-rotamer | |
| 3403 | - | 2N2 bound Z-OH stretch of the E,Z-rotamer | |
| N-protomer | |||
| 1470 | 1467 | NH3 umbrella mode | |
| νC=0 | 1791 | 1749 | Carbonyl stretch |
| 3235 | 3212 | Symmetric NH3 stretch | |
| 3273 | 3316 | Asymmetric NH3 stretch | |
| 3316 | 3358 | Asymmetric NH3 stretch | |
| νOH | 3574 | 3610 | Free OH stretch |
3.5. The proton bound dimer: complexation with 4ABA
Having clarified the assignments in the protomers, it is of interest to explore the docking motif by which the O-protomer attaches to neutral 4ABA in light of the previous work that identified the key linkage in the binary complex starting with the N-protomer [12]. In that case, the dimer is asymmetrical such that the NH+ attaches to the C=O group leading to a “head-to-tail” arrangement (representative structure shown in Fig. 5E). The spectrum of the D2 tagged H+-(4ABA)2 binary complex is displayed in Fig. 5A, along with the calculated (scaled) harmonic spectra for several minimum energy candidate structures identified in our search of the potential energy landscape. We can immediately establish that this is different from the species generated from the N-protomer by absence of the free C=O stretch (red in Fig. 5E) in the experimental spectrum [12]. On the other hand, two of the sharp bands in the region of the free NH region are in the same locations as found in the O-protomer, while the third feature highest in energy (red, ) falls at the same location as the free acid OH stretch in the N-protomer. All of these telltale bands are consistent with the spectrum predicted for the lowest energy isomer (Fig. 5B), which features a linkage between the two carboxylic acid groups. Interestingly, however, this is different from the motif found for the proton bound dimer of formic acid, which occurs with a C=O--H+--O=C type arrangement where the extra proton binds the two carbonyl groups together [40]. The structure in Fig. 5B, on the other hand, exhibits an unusual bifurcated motif in which the Z,Z form of the protonated O-protomer binds quasi-symmetrically to the C=O group on the neutral partner. That configuration also rationalizes the two very diffuse bands that appear in the 2500–3000 cm−1 range (labeled θ and χ in Fig. 5A) as due to the symmetric and asymmetric stretching modes of the two OH groups on the O-protomer that are attached to the oxygen atom. Such broadening is often observed in such cases where displacements in the soft, intermolecular modes strongly modulate the frequency of the bound OH groups [41]. In this case, the hinging mode corresponding to the flex of the two moieties at the linkage is a likely candidate for the coupling that leads to the breadths of the bands. We also explored the generality of this bifurcated motif in the brief survey of the H+−4ABA•H2O complex, which is also calculated dock in the bifurcated motif as evidenced by the appearance of two broad features that occur at 3390 and 3265 cm−1. The IRMPD spectrum of the bare complex is included in Fig. S3.
Figure 5.

A) Vibrational spectrum of H+-(4ABA)2 sprayed in H2O. B-E) calculated spectra of the possible binding motifs of H+-(4ABA)2 at the B3LYP/6–311++G(d,p) level of theory. Calculated frequencies were scaled by 0.95. Representative structures and their corresponding ZPE corrected relative energies are displayed above the calculated spectra. Blue represents NH stretches, red for OH stretches, cyan for free E-OH, and orange for transitions that involve the shared proton.
4. Summary
We report the vibrational spectra of the D2- and N2-tagged O- and N-protomers of protonated 4-aminobenzoic acid (H+−4ABA), which are obtained by electrospray ionization of 4-aminobenzoic acid at pH=~2 in water and a 1:1 solution of water and acetonitrile. The spectrum of the isotopologue with one H and three D atoms in all exchangeable sites confirms the assignments of the NH stretches in the spectrum of the all-H isotopologue and establishes that the OH stretches on the protonated carboxylic acid head group are essentially uncoupled. The tag molecules introduce a substantial perturbation of the OH stretching vibrations of the O-protomer, and isomer-specific, two-color IR-IR photobleaching spectroscopy confirms that the single tag species occurs in two isomeric forms. These correspond to the two distinct OH groups in the E,Z rotamer, which is the only structural isomer of the O-protomer generated under these conditions. The tag shift is observed to be much larger for the bound Z-OH group than that for the E-OH. Addition of a second N2 tag results in blue shifts of both the bound Z- and E-OH groups, thus establishes a weak anticooperativity effect where a second H-bond weakens the first. The spectrum of the proton bound dimer, prepared by attachment of 4ABA to the O-protomer of H+−4ABA, indicates that this system binds through contacts between the two carboxylic acid functionalities. This linkage is distinct from that reported earlier that started from the N-protomer where the dimer adopted a “head-to-tail” arrangement. The linkage identified here for the O-protomer features a bifurcated interaction where both OH groups of the Z,Z-rotamer bond to the carbonyl group of the neutral acid.
Supplementary Material
Highlights.
4-Aminobenzoic acid (4ABA) has two protomers: N-protomer or carboxylic O-protomer
The O-protomer has three low energy rotamers: E,Z; Z,Z; and E,E
Isomer-selective spectroscopy confirms only the E,Z isomer is present
Site-specific binding shows that the E- and Z-OH have different H-bond strengths
The O-protomer binds to a neutral 4ABA through a bifurcated motif to the Z,Z isomer
7. Acknowledgement
We thank David Russell for discussions regarding the behavior displayed by protonated 4-aminobenzoic acid prepared using different electrospray ionization conditions.
6. Funding Information
M.A.J. thanks the Air Force Office of Scientific Research (AFOSR) under Grant Nos. FA9550-17-1-0267 (DURIP) and FA9550-18-1-0213. T.K. thanks the National Institutes of Health for stipend support provided under Biophysical Training Grant No. 5T32GM008283-32.
Footnotes
Publisher's Disclaimer: This is a PDF file of an unedited manuscript that has been accepted for publication. As a service to our customers we are providing this early version of the manuscript. The manuscript will undergo copyediting, typesetting, and review of the resulting proof before it is published in its final form. Please note that during the production process errors may be discovered which could affect the content, and all legal disclaimers that apply to the journal pertain.
Supplementary Materials
Supporting experimental and computational data includes detailed vibrational predissociation and calculated spectra as well as Cartesian coordinates for the optimized minimum energy structures recovered in our electronic structure calculations.
Conflicts of interest
The authors declare no conflict of interest.
Declaration of interests
The authors declare that they have no known competing financial interests or personal relationships that could have appeared to influence the work reported in this paper.
9. References
- [1].Akberova SI, New biological properties of p-aminobenzoic acid, Biol Bull+, 29 (2002) 390–393. [PubMed] [Google Scholar]
- [2].Kratky M, Konecna K, Janousek J, Brablikova M, Jand’ourek O, Trejtnar F, Stolarikova J, Vinsova J, 4-Aminobenzoic Acid Derivatives: Converting Folate Precursor to Antimicrobial and Cytotoxic Agents, Biomolecules, 10 (2020). [DOI] [PMC free article] [PubMed] [Google Scholar]
- [3].Sowinska M, Morawiak M, Bochynska-Czyz M, Lipkowski AW, Zieminska E, Zablocka B, Urbanczyk-Lipkowska Z, Molecular Antioxidant Properties and In Vitro Cell Toxicity of the p-Aminobenzoic Acid (PABA) Functionalized Peptide Dendrimers, Biomolecules, 9 (2019). [DOI] [PMC free article] [PubMed] [Google Scholar]
- [4].Patel HM, Bhardwaj V, Sharma P, Noolvi MN, Lohan S, Bansal S, Sharma A, Quinoxaline-PABA bipartite hybrid derivatization approach: Design and search for antimicrobial agents, Journal of Molecular Structure, 1184 (2019) 562–568. [Google Scholar]
- [5].Kadhum WR, Oshizaka T, Ichiro H, Todo H, Sugibayashi K, Usefulness of liquid-crystal oral formulations to enhance the bioavailability and skin tissue targeting of p-amino benzoic acid as a model compound, Eur J Pharm Sci, 88 (2016) 282–290. [DOI] [PubMed] [Google Scholar]
- [6].Kluczyk A, Popek T, Kiyota T, de Macedo P, Stefanowicz P, Lazar C, Konishi Y, Drug evolution: p-aminobenzoic acid as a building block, Current Medicinal Chemistry, 9 (2002) 1871–1892. [DOI] [PubMed] [Google Scholar]
- [7].Valverde A, Serafan V, Montero-Calle A, Gonzalez-Cortes A, Barderas R, Yanez-Sedeno P, Campuzano S, Pingarron JM, Carbon/Inorganic Hybrid Nanoarchitectures as Carriers for Signaling Elements in Electrochemical Immunosensors: First Biosensor for the Determination of the Inflammatory and Metastatic Processes Biomarker RANK-ligand, Chemelectrochem, 7 (2020). [Google Scholar]
- [8].Karri SN, Ega SP, Srinivasan P, Synthesis of novel fluorescent molecule and its polymeric form with aniline as fluorescent and supercapacitor electrode materials, Polym Advan Technol, n/a. [Google Scholar]
- [9].Santos C.d.C., Santos PCM, Rocha KLS, Thomasini RL, de Oliveira DB, Franco DL, Ferreira LF, A new tool for dengue virus diagnosis: Optimization and detection of anti-NS1 antibodies in serum samples by impedimetric transducers, Microchemical Journal, 154 (2020) 104544. [Google Scholar]
- [10].Zhang XX, Oscarson JL, Izatt RM, Schuck PC, Li D, Thermodynamics of macroscopic and microscopic proton ionization from protonated 4-aminobenzoic acid in aqueous solution from 298.15 to 393.15 K, J. Phys. Chem. B, 104 (2000) 8598–8605. [Google Scholar]
- [11].Tian Z, Kass SR, Gas-Phase versus Liquid-Phase Structures by Electrospray Ionization Mass Spectrometry, Angewandte Chemie International Edition, 48 (2009) 1321–1323. [DOI] [PubMed] [Google Scholar]
- [12].Seo J, Warnke S, Gewinner S, Schollkopf W, Bowers MT, Pagel K, von Helden G, The impact of environment and resonance effects on the site of protonation of aminobenzoic acid derivatives, Phys Chem Chem Phys, 18 (2016) 25474–25482. [DOI] [PubMed] [Google Scholar]
- [13].Cismesia AP, Nicholls GR, Polfer NC, Amine vs. carboxylic acid protonation in ortho-, meta-, and para-aminobenzoic acid: An IRMPD spectroscopy study, Journal of Molecular Spectroscopy, 332 (2017) 79–85. [DOI] [PMC free article] [PubMed] [Google Scholar]
- [14].Tian Z, Kass SR, Gas-phase versus liquid-phase structures by electrospray ionization mass spectrometry, Angew Chem Int Ed Engl, 48 (2009) 1321–1323. [DOI] [PubMed] [Google Scholar]
- [15].Hebert MJ, Russell DH, Tracking the Structural Evolution of 4-Aminobenzoic Acid in the Transition from Solution to the Gas Phase, J Phys Chem B, 124 (2020) 2081–2087. [DOI] [PubMed] [Google Scholar]
- [16].Schmidt J, Meyer MM, Spector I, Kass SR, Infrared Multiphoton Dissociation Spectroscopy Study of Protonated p-Aminobenzoic Acid: Does Electrospray Ionization Afford the Amino- or Carboxy-Protonated Ion?, Journal of Physical Chemistry A, 115 (2011) 7625–7632. [DOI] [PubMed] [Google Scholar]
- [17].Davies JA, Besley NA, Yang SF, Ellis AM, Probing Elusive Cations: Infrared Spectroscopy of Protonated Acetic Acid, Journal of Physical Chemistry Letters, 10 (2019) 2108–2112. [DOI] [PubMed] [Google Scholar]
- [18].Spieler S, Duong CH, Kaiser A, Duensing F, Geistlinger K, Fischer M, Yang N, Kumar SS, Johnson MA, Wester R, Vibrational Predissociation Spectroscopy of Cold Protonated Tryptophan with Different Messenger Tags, Journal of Physical Chemistry A, 122 (2018) 8037–8046. [DOI] [PubMed] [Google Scholar]
- [19].Menges FS, Perez EH, Edington SC, Duong CH, Yang N, Johnson MA, Integration of High-Resolution Mass Spectrometry with Cryogenic Ion Vibrational Spectroscopy, J. Am. Soc. Mass Spectrom, 30 (2019) 1551–1557. [DOI] [PMC free article] [PubMed] [Google Scholar]
- [20].Yang N, Duong CH, Kelleher PJ, Johnson MA, McCoy AB, Isolation of site-specific anharmonicities of individual water molecules in the Ī ·(H2O)2 complex using tag-free, isotopomer selective IR-IR double resonance, Chem. Phys. Lett, 690 (2017) 159–171. [Google Scholar]
- [21].Frisch MJ, Trucks GW, Schlegel HB, Scuseria GE, Robb MA, Cheeseman JR, Scalmani G, Barone V, Mennucci B, Petersson GA, Nakatsuji H, Caricato M, Li X, Hratchian HP, Izmaylov AF, Bloino J, Zheng G, Sonnenberg JL, Hada M, Ehara M, Toyota K, Fukuda R, Hasegawa J, Ishida M, Nakajima T, Honda Y, Kitao O, Nakai H, Vreven T, Montgomery JJA, Peralta JE, Ogliaro F, Bearpark M, Heyd JJ, Brothers E, Kudin KN, Staroverov VN, Kobayashi R, Normand J, Raghavachari K, Rendell A, Burant JC, Iyengar SS, Tomasi J, Cossi M, Rega N, Millam JM, Klene M, Knox JE, Cross JB, Bakken V, Adamo C, Jaramillo J, Gomperts R, Stratmann RE, Yazyev O, Austin AJ, Cammi R, Pomelli C, Ochterski JW, Martin RL, Morokuma K, Zakrzewski VG, Voth GA, Salvador P, Dannenberg JJ, Dapprich S, Daniels AD, Farkas Ö, Foresman JB, Ortiz JV, Cioslowski J, Fox DJ, Gaussian 09, Revision D.01, in, Gaussian, Inc., Wallingford, CT, 2009. [Google Scholar]
- [22].Chang TM, Prell JS, Warrick ER, Williams ER, Where’s the Charge? Protonation Sites in Gaseous Ions Change with Hydration, J Am Chem Soc, 134 (2012) 15805–15813. [DOI] [PubMed] [Google Scholar]
- [23].Fischer KC, Sherman SL, Garand E, Competition between Solvation and Intramolecular Hydrogen-Bonding in Microsolvated Protonated Glycine and beta-Alanine, Journal of Physical Chemistry A, 124 (2020) 1593–1602. [DOI] [PubMed] [Google Scholar]
- [24].Leavitt CM, Wolk AB, Kamrath MZ, Garand E, Van Stipdonk MJ, Johnson MA, Characterizing the Intramolecular H-bond and Secondary Structure in Methylated GlyGlyH+ with H2 Predissociation Spectroscopy, J. Am. Soc. Mass Spectr, 22 (2011) 1941–1952. [DOI] [PubMed] [Google Scholar]
- [25].Voss JM, Fischer KC, Garand E, Accessing the Vibrational Signatures of Amino Acid Ions Embedded in Water Clusters, Journal of Physical Chemistry Letters, 9 (2018) 2246–2250. [DOI] [PubMed] [Google Scholar]
- [26].Johnson III RD, NIST Standard Reference Database Number 101, in, 2019.
- [27].Hu YJ, Fu HB, Bernstein ER, IR plus vacuum ultraviolet spectroscopy of neutral and ionic organic acid monomers and clusters: Propanoic acid, Journal of Chemical Physics, 125 (2006). [DOI] [PubMed] [Google Scholar]
- [28].Inokuchi Y, Nishi N, Infrared photodissociation spectroscopy of protonated formic acid and acetic acid clusters, Journal of Physical Chemistry A, 107 (2003) 11319–11323. [Google Scholar]
- [29].Patrick AL, Cismesia AP, Tesler LF, Polfer NC, Effects of ESI conditions on kinetic trapping of the solution-phase protonation isomer of p-aminobenzoic acid in the gas phase, International Journal of Mass Spectrometry, 418 (2017) 148–155. [DOI] [PMC free article] [PubMed] [Google Scholar]
- [30].Yacovitch TI, Heine N, Brieger C, Wende T, Hock C, Neumark DM, Asmis KR, Vibrational spectroscopy of bisulfate/sulfuric acid/water clusters: structure, stability, and infrared multiple-photon dissociation intensities, J. Phys. Chem. A, 117 (2013) 7081–7090. [DOI] [PubMed] [Google Scholar]
- [31].Leavitt CM, Wolk AB, Fournier JA, Kamrath MZ, Garand E, Van Stipdonk MJ, Johnson MA, Isomer-specific IR-IR Double Resonance Spectroscopy of D2-tagged Protonated Dipeptides Prepared in a Cryogenic Ion Trap, J Phys Chem Lett, 3 (2012) 1099–1105. [DOI] [PubMed] [Google Scholar]
- [32].Wolk AB, Leavitt CM, Garand E, Johnson MA, Cryogenic Ion Chemistry and Spectroscopy, Acc. Chem. Res, 47 (2014) 202–210. [DOI] [PubMed] [Google Scholar]
- [33].Yang N, Duong CH, Kelleher PJ, McCoy AB, Johnson MA, Deconstructing Water’s Diffuse OH Stretching Vibrational Spectrum With Cold Clusters, Science, 364 (2019) 275–278. [DOI] [PubMed] [Google Scholar]
- [34].Olesen SG, Hammerum S, Redshift or Adduct Stabilization-A Computational Study of Hydrogen Bonding in Adducts of Protonated Carboxylic Acids, Eur J Mass Spectrom, 15 (2009) 239–248. [DOI] [PubMed] [Google Scholar]
- [35].Johnson CJ, Wolk AB, Fournier JA, Sullivan EN, Weddle GH, Johnson MA, Communication: He-Tagged Vibrational Spectra of the SarGlyH+ and H+(H2O)2,3 Ions: Quantifying Tag Effects in Cryogenic Ion Vibrational Predissociation (CIVP) Spectroscopy, J. Chem. Phys, 140 (2014) 221101. [DOI] [PubMed] [Google Scholar]
- [36].Ludwig R, The Effect of Hydrogen Bonding on the Thermodynamic and Spectroscopic Properties of Molecular Clusters and Liquids, Physical chemistry chemical physics : PCCP, 4 (2002) 5481–5487. [Google Scholar]
- [37].Albrecht L, Chowdhury S, Boyd RJ, Hydrogen Bond Cooperativity in Water Hexamers: Atomic Energy Perspective of Local Stabilities, Journal of Physical Chemistry A, 117 (2013) 10790–10799. [DOI] [PubMed] [Google Scholar]
- [38].Guevara-Vela JM, Romero-Montalvo E, Gomez VAM, Chavez-Calvillo R, Garcia-Revilla M, Francisco E, Pendas AM, Rocha-Rinza T, Hydrogen Bond Cooperativity and Anticooperativity Within the Water Hexamer, Physical chemistry chemical physics : PCCP, 18 (2016) 19557–19566. [DOI] [PubMed] [Google Scholar]
- [39].Olesen SG, Guasco TL, Roscioli JR, Johnson MA, Tuning the intermolecular proton bond in the H5O2+ ‘Zundel ion’ scaffold, Chem. Phys. Lett, 509 (2011) 89–95. [Google Scholar]
- [40].Leavitt C, Vibrational Characterization of Complexes Featuring Ionic Hydrogen Bonds, in: Chemistry, Yale University, New Haven, 2013. [Google Scholar]
- [41].Craig SM, Menges FS, Duong CH, Denton JK, Madison LR, McCoy AB, Johnson MA, Hidden Role of Intermolecular Proton Transfer in the Anomalously Diffuse Vibrational Spectrum of a Trapped Hydronium Ion, Proc. Natl. Acad. Sci. USA, 114 (2017) E4706–E4713. [DOI] [PMC free article] [PubMed] [Google Scholar]
Associated Data
This section collects any data citations, data availability statements, or supplementary materials included in this article.