

Abstract
Background:
Phthalates and their potential replacements, including non-phthalate plasticizers, are ubiquitous in home environments due to their presence in building materials, plastics, and personal care products. As a result, exposure to these compounds is universal. However, the primary pathways of exposure and understanding which products in the home are associated most strongly with particular exposures are unclear.
Objectives:
We sought to investigate the relationships between phthalates and non-phthalate plasticizers in paired samples of house dust, hand wipes, and their corresponding metabolites in children’s urine samples (n=180). In addition, we compared product use or presence of materials in the household against all compounds to investigate the relationship between product use or presence and exposure.
Methods:
Children aged 3–6 years provided hand wipe and urine samples. Questionnaires were completed by mothers or legal guardians to capture product use and housing characteristics, and house dust samples were collected from the main living area during home visits.
Results:
Phthalates and non-phthalate replacements were detected frequently in the environmental matrices. All urine samples had at least 13 of 19 phthalate or non-phthalate replacement metabolites present. Hand wipe mass and dust concentrations of diisobutyl phthalate, benzyl butyl phthalate (BBP), bis(2-ethylhexyl) phthalate, and di-isononyl phthalate were significantly associated with their corresponding urinary metabolites (rs=0.18–0.56, p<0.05). Bis(2-ethylhexyl) terephthalate (DEHTP) in dust was also significantly and positively correlated with its urinary metabolites (rs=0.33, p<0.001). Vinyl flooring was most significantly and positively associated with particular phthalate exposures (indicated by concentrations in environmental matrices and urinary biomarkers). In particular, children who lived in homes with 100% vinyl flooring had urinary concentrations of monobenzyl phthalate, a BBP metabolite, that were 15 times higher than those of children who lived in homes with no vinyl flooring (p<0.0001). Levels of BBP in hand wipes and dust were 3.5 and 4.5 times higher, respectively, in those homes with 100% vinyl flooring (p<0.0001 for both).
Conclusions:
This paper summarizes one of the most comprehensive phthalate and non-phthalate plasticizer investigation of potential residential exposure sources conducted in North America to date. The data presented herein provide evidence that dermal contact and hand-to-mouth behaviors are important sources of exposure to phthalates and non-phthalate plasticizers. In addition, the percentage of vinyl flooring is an important consideration when examining residential exposures to these compounds.
Introduction
Phthalate esters are used in a wide variety of consumer products (Schettler, 2006). High molecular weight phthalates are primarily used as plasticizers in a variety of building materials, industrial products, and consumer products, sometimes at levels as high as 10–30% by mass (Bi et al., 2015; Gong et al., 2015). Low molecular weight phthalates are more often used as solvents or carriers in personal care products, particularly for fragrances (Api, 2001; Gong et al., 2014, 2015). As such, phthalates are some of the most abundant chemicals found in the indoor environment and were detected at the highest concentration compared to several chemical classes in U.S. indoor dust (Mitro et al., 2016). Because of their widespread use in everyday products, human exposure to phthalates is common, and biomarkers of exposure have been detected in the urine of the majority of the U.S. general population (CDC, 2019).
Over the last decade, several phthalates have been the focus of global concern and subsequent bans. The U.S. Consumer Product Safety Commission banned diisobutyl phthalate (DiBP), di-n-butyl phthalate (DBP), benzyl butyl phthalate (BBP), bis(2-ethylhexyl) phthalate (DEHP), and di-isononyl phthalate (DiNP) from use in children’s toys and child care articles in their Consumer Product Safety Improvement Act of 2008 and subsequent update in 2017 (United States Consumer Product Safety Commission, 2017). Similar bans have been made for use of DiBP, DBP, BBP, and DEHP in all products in the European Union (European Chemicals Agency, 2017). Despite the removal of these phthalate esters from new products, their extensive use over the last several decades has ensured that many of these compounds will persist in recycled products and thus in the indoor environment. Due to these global phase-outs and bans, several other plasticizers (e.g., bis(2-ethylhexyl) terephthalate (DEHTP), bis(2-ethylhexyl) adipate (DEHA)) have been introduced to the market as replacements. Although far less is known about these replacements and their presence indoors, we expect them to be ubiquitously detected in the environment, much like their predecessors.
Phthalates and non-phthalate plasticizers have octanol-air partitioning coefficients (logKoa) calculated or estimated to range from 7 to 13 (Bergh et al., 2011; Cousins and Mackay, 2000). As such, they have a wide range of partitioning behaviors across multiple orders of magnitude. However, with the variation in physical-chemical properties, little is known about the primary pathways by which individuals are exposed, and exposure routes may differ between compounds. In particular, exposures may vary based on their uses in consumer products and in the home environment (e.g., fragrance in a perfume versus a coating in vinyl flooring). Hand wipes have been previously used to examine dermal absorption of phthalates among children, and significant, positive associations were observed between several parent compounds on hand wipes and their urinary metabolites (Gong et al., 2014, 2015). Indoor dust has also been shown to be correlated with urinary metabolites among children and to contribute to total phthalate exposure through comparisons with the inhalation and dermal absorption pathways (Bekö et al., 2013; Langer et al., 2014).
Here, we sought to identify the primary exposure pathways for phthalates and other plasticizers among children ages 3–6 years by comparing hand wipes and house dust samples to metabolites measured in spot urine samples. Further, we examined how specific housing characteristics, such as the percentage of vinyl flooring in the home, and behaviors contributed to increased exposure to several phthalate compounds and their replacements.
Materials and Methods
Study Population.
Mothers participating in the Newborn Epigenetics STudy (NEST), a prospective pregnancy cohort study based in Durham, North Carolina (2005–2011), were re-contacted and their children were invited to participate in the Toddler’s Exposure to SVOCs in the Indoor Environment (TESIE) study (Hoffman et al., 2018; Hoyo et al., 2011). Hoffman et al. 2018 provides a description of recruitment and enrollment procedures for the TESIE study. Briefly, 203 children from 190 different families participated in the TESIE study between September 2014 and April 2016 when children were 3–6 years of age. Study team members conducted home visits with each family enrolled in the TESIE study to collect environmental samples and biospecimens as well as data about the home environment and children’s health and behavior. All study protocols and related materials were reviewed and approved by the Duke Medicine Institutional Review Board. Legal guardians provided informed consent prior to the collection of samples and questionnaire data for the TESIE study, and mothers provided informed consent prior to participation in NEST. The involvement of the Centers for Disease Control and Prevention (CDC) laboratory was determined not to constitute engagement in human subject research.
Home Environment Characteristics.
During home visits, research personnel administered questionnaires to parents that focused on housing characteristics, children’s health and behavior, and personal care product use. These questions were intended to collect information on the frequency of the child’s product use (e.g., nail polish, wipes, lotion) and familial habits (e.g., how often children consumed food from microwaved plastic containers). In addition, information on the square footage of the home and specific rooms in the home (e.g., bathrooms, living room) was collected in the questionnaires. Researchers visually identified rooms with vinyl flooring and measured the square footage of these individual rooms in each home, providing a calculation of the percentage of the home that contained vinyl flooring. Housing data were later verified using county property tax records; 2018 tax assessment data (or the most recent year available) were used to verify the total square footage of homes. Tax assessment information was unavailable for public housing units (n=39), which included apartments (n=28), mobile homes/trailers (n=6), and single family homes (n=4 attached, n=1 detached), and thus verification of housing characteristics such as home age and total square footage was not possible for these residences.
Hand Wipe Extraction.
Families were instructed not to wash their child’s hands for at least 1 hour prior to our home visit. During the visit, research staff collected a hand wipe sample from each child using pre-cleaned cotton twill wipes (4×4 in., MG Chemicals), as described in Phillips et al. 2018. Briefly, a gloved researcher soaked the twill wipe with 3 mL isopropyl alcohol and wiped the entire surface area of both of the child’s hands. Based on previous work indicating that normalizing to the surface area of the child’s hands does not reduce variability in hand wipe measurements, hand wipes were assessed on a per-wipe basis (Stapleton et al., 2008). Hand wipes were rewrapped in aluminum foil and stored at −20°C until analysis. Hand wipes were extracted and analyzed as described in Phillips et al. 2018. In brief, wipes were spiked with 76 ng of each of the following internal standards: d4-dimethyl phthalate (d4-DMP), d4-diethyl phthalate (d4-DEP), d4-BBP, and d4-DEHP. All analytical standards, both labeled and unlabeled, were sourced from Cambridge Isotope Laboratories, Inc. (Tewksbury, MA). Analytes and corresponding metabolites are presented in Table S1. The wipes were extracted in 1:1 dichloromethane:hexane (v/v) using sonication, and extracts were concentrated to ~1 mL using a SpeedVac™ Concentrator. Extracts were then fractionated using Florisil® solid-phase extraction cartridges (Supel-clean ENVI-Florisil, 6 mL, 500 mg; Supelco), eluting the F2 fraction (containing phthalates) with 10 mL of ethyl acetate. F1 fractions eluted using 6 mL hexane and F3 fractions eluted using 6 mL methanol were also collected and used for analyses not shown here. F2 fractions were concentrated to ~1 mL and reconstituted in hexane prior to GC/MS analysis. DiNP was quantified using an analytical standard containing a series of DiNP isomers and co-eluted with DEHTP; thus, the peaks following the retention time for DEHTP were integrated. As such, the values for DiNP presented here are conservative estimates for the actual values found on hand wipes. Details regarding the GC/MS conditions and ions monitored are included in supporting information (Table S2). Recovery of internal standards was assessed using 13C2-dicyclohexyl phthalate (98.88 ng) for all of the deuterated internal standards. Field blanks (n=14) were analyzed in each batch for quality assurance and quality control (Table S3). Due to interferences in the chromatography, DEP was not quantified in the hand wipe extracts.
Dust Extraction.
Families were instructed not to clean their homes, specifically mop or vacuum, for at least two days prior to the scheduled visit. For collection of the house dust sample, the entire exposed floor area of the room in which the child spent the most time active and awake, typically a living room or play room, was vacuumed using a Eureka Mighty Mite vacuum fitted with a cellulose thimble within the hose attachment (Stapleton et al., 2012). Each thimble was wrapped in aluminum foil and stored at −20°C until analysis.
Prior to extraction, dust samples were sieved to <500 microns then extracted in the same manner as the hand wipe samples, with minor adjustments. Dust extracts were split by mass, reserving ~25% for cell-based toxicity assays and 25% for non-targeted analysis (not discussed in this manuscript). The remaining 50% was used for targeted analyses as described here. Internal standards (d4-DMP, d4-DEP, d4-BBP, d4-DEHP; all at 1,156.07 ng) were spiked following extraction and prior to any cleanup steps. Laboratory blanks (n=6) and house dust standard reference material (n=5; SRM 2585 National Institute of Standards and Technology (NIST), Gaithersburg, MD) were analyzed in each batch for quality assurance and quality control (Table S3). Measurements of phthalates (DMP, DEP, DiBP, DBP, DEHP, DiNP) in SRM 2585 were 73–103% of the average values reported by Bergh et al. and Luongo and Ostman with the exception of BBP and DiNP, both of which were about 25% of the reported values (Bergh et al., 2012; Luongo and Östman, 2016). Our measurements varied more from Mercier et al. and Larsson et al., in the range of 32–108%, and with BBP being about 20% of the reported averages (Larsson et al., 2017; Mercier et al., 2014). Our measurements were similar to most of the reported values in the literature and deemed acceptable for quality assurance and quality control purposes. During quantification, all the quantified phthalates and non-phthalate plasticizers in the dust samples had at least 50% of samples falling above the calibration curve. The samples were unavailable to be reanalyzed as diluted samples, and therefore some of the data represent estimates above the calibration curve.
Urine Extraction.
Families were given collection kits for urine samples during the home visit. Three spot urine samples were collected from each child over the course of a 48-hour period, with times of sampling recorded. Urine samples were stored frozen in the families’ homes during the sampling period and were transported to Duke University research laboratory on ice and then stored at −20°C. Prior to analysis, the individual samples were thawed and thoroughly mixed, and equal volumes of each urine sample were pooled to form a composite. Individual urine samples or timing of these spot urine samples were not evaluated since we utilized the pooled sample for all of our analyses. Specific gravity (SG) was measured in each sample using a digital handheld refractometer (Atago). A modification of previously described methods (Silva et al., 2007) was used to measure 17 phthalate metabolites and 2 metabolites from the non-phthalate plasticizer di(isononyl)cyclohexane-1,2-dicarboxylate (DINCH) (CDC, 2016). Average outdoor temperature was retrieved from the National Weather Service website based on the week of sample collection to examine the potential impact of temperature on exposure pathways. Previous work within this study population has observed changes in exposure based on temperature, and thus average outdoor temperature was included as a covariate in comparisons conducted herein (Hoffman et al., 2018).
Statistical Analyses.
All analyses were performed using SAS statistical software (version 9.4; SAS Institute Inc., Cary, NC) for analytes detected in >70% of samples. Method detection limits (MDLs) were determined using three times the standard deviation of the average lab blank levels for dust samples and field blank levels for the hand wipes. In urine, MDLs were calculated as 3S0, where S0 (determined from the replicate analysis of low-level standards) was the standard deviation as the concentration approaches zero (Taylor, 1987). MDLs were normalized to the average mass of dust extracted (0.059 mg). Values that were less than MDL were replaced with MDL/2 (Antweiler and Taylor, 2008). Preliminary analyses indicated that plasticizer concentrations in hand wipes and in dust, as well as metabolite concentrations in urine, were right-skewed. Spearman correlations were therefore used to assess relationships within and between matrices. These were performed for both unadjusted and specific gravity corrected urinary metabolite concentrations (Boeniger et al., 1993). These coefficients were not differentiable and therefore only specific gravity corrected results are presented here. Certain parent compounds metabolize to multiple metabolites, and for these chemicals, we evaluated associations based on the molar sum of the metabolites. Investigating these plasticizers on a molar sum basis may allow us to better characterize the relationship between parent compounds in hand wipes or dust and total corresponding urinary metabolites. All analyses were conducted with the individual metabolites as well and displayed similar relationships as their molar sums; thus, the associations of parents with molar sums for these specific compounds are shown here and the individual metabolite data are included in SI.
Participants were asked to provide all samples although circumstances arose in which certain samples could not be collected or analyzed. As such, there was not complete overlap in the number of participants for each sample type, and therefore relationships were evaluated for the maximum number of paired samples available.
To examine predictors of phthalates and non-phthalate replacements in household dust, hand wipes and urine (metabolites), generalized estimating equations were used. These models account for residual intra-family correlations that may be introduced by including siblings in the models. Additional analyses on the effect of various categorical variables on plasticizer concentration in dust and hand wipes and urinary metabolite concentrations were conducted. These analyses included child’s nail polish use, child hand lotion use, frequency of child’s food consumption from microwaved plastic, child’s use of scented and unscented wipes, and the percentage of vinyl flooring in the home. Outcome variables were all log10-transformed prior to analysis to account for their non-normal distribution.
Covariates.
Regression analyses were adjusted for covariates based on our a priori expectation of association with outcomes and predictors variables of interest. Models evaluating predictors of plasticizers in household dust included mother’s race/ethnicity, mother’s education level at the time of birth, and average outdoor temperature (continuous). Models investigating predictors of phthalates and phthalate replacements on children’s hands and urinary metabolites additionally included the child’s age and sex. To investigate the relationship between urinary metabolite and parent compound in dust or hand wipes, concentrations were divided into quartiles, with the exception of hand wipe levels of DBP which were divided into tertiles due to its less frequent detection.
Results and Discussion
Study Population and Home Environment.
The demographics of the study population and home characteristics are described in Table 1 and more extensively in Hoffman et al. 2018. Briefly, the TESIE study included 203 children, 55.7% of which were male, from 190 households. The median age of children in the study was 54 months (4.5 years), with child age ranging from 38–73 months. Approximately 41% of mothers identified as non-Hispanic white, while 37% of mothers identified as non-Hispanic black, 20% identified as Hispanic, and 2% identified as other race/ethnicity. Those participants identifying as other race/ethnicity were excluded from the adjusted analysis (n=3). Approximately half of mothers (44%) had completed a four-year college degree program at the time of their child’s birth. Biological specimens were collected between September 2014 and April 2016.
Table 1.
Selected demographic characteristics of children participating in the TESIE study, selected product use patterns, and household characteristics of the TESIE study participants.
| Characteristic | N | % |
|---|---|---|
| Child Sex | ||
| Male | 113 | 55.7% |
| Female | 90 | 44.3% |
| Age | ||
| 38–47 months | 34 | 16.0% |
| 48–59 months | 130 | 64.0% |
| 60–73 months | 39 | 19.2% |
| Ethnicity | ||
| Non-Hispanic white | 84 | 41.4% |
| Non-Hispanic black | 75 | 36.9% |
| Hispanic white | 41 | 20.2% |
| Other | 3 | 1.5% |
| Maternal education | ||
| Less than college graduate | 113 | 55.7% |
| College graduate or more | 90 | 44.3% |
| Mean | range | |
| Child age | 53.9 | 38–73 |
| Average temp (°C) | 15.5 | −4.4–29.4 |
| Use information | N | % |
| Do not use baby wipes | 98 | 48.3% |
| Use baby wipes (scented) | 33 | 16.3% |
| Use baby wipes (unscented) | 72 | 35.5% |
| Do not use nail polish | 132 | 65.0% |
| Use nail polish | 71 | 35.0% |
| Microwave plastic | 105 | 51.7% |
| Do not microwave plastic | 97 | 47.8% |
| Child does not use lotion | 56 | 27.6% |
| Child uses lotion 1–5 times/month | 40 | 19.7% |
| Child uses lotion 6–29 times/month | 29 | 14.3% |
| Child uses lotion daily | 78 | 38.4% |
| Vinyl in children’s homes | N | % |
| 0% vinyl | 62 | 30.5% |
| 0.1–5% vinyl | 26 | 12.8% |
| 5.1–10% vinyl | 21 | 10.3% |
| 10.1–32% vinyl | 37 | 18.2% |
| 32.1–99.9% vinyl | 0 | 0.0% |
| 100% vinyl | 18 | 8.9% |
| no information | 39 | 19.2% |
Vinyl flooring percentage and product use information are reported in Table 1. Greater than 50% of parents reported that their child used lotion or baby wipes, but child nail polish use was less common (35% of parents reported nail polish use at least once per month). Seventy-five percent of home contained at least some vinyl flooring. We categorized the percentage of the home covered in vinyl flooring using measurements of rooms with vinyl (measured by our study team) and the total home square footage (from tax assessment records). Houses with no information on total square footage of the home were included in an “unknown” category for analyses unless the flooring was exclusively vinyl (and thus, measured by our study team). The majority of those homes without information on total square footage were identified as apartments or mobile home/trailers, which meant specific square footage was undeterminable with tax assessment records.
Phthalates and Non-Phthalate Plasticizers in Individual Matrices.
Hand wipes.
In general, the phthalate esters and non-phthalate replacements were frequently detected in the children’s hand wipes (n=202), with a majority of the compounds detected in >90% of the samples (Table 2). To the authors’ knowledge, this study examines the broadest range of phthalates and non-phthalate plasticizers in hand wipe samples to date. Measured in all 202 hand wipe samples, DEHTP, one of the replacements for DEHP, was the most abundant compound (median=2,401 ng/wipe). This suggests that DEHTP, as it replaces DEHP in its consumer product uses as a plasticizer and in floorings, toys, etc., may be one of the most prominent phthalate compounds to which children are exposed. To the authors’ knowledge, this is the first time that DEHTP has been assessed in hand wipe samples. DEHP was also measured at relatively high levels (median=1,842 ng/wipe), which is similar to trends reported previous studies examining both children and adult exposures via hand wipes (Bu et al., 2018; Gong et al., 2014). The higher molecular weight phthalates were generally more abundant on the hand wipes than the lower molecular weight compounds, which suggests that hand-to-mouth behavior may be an important pathway of exposure for these larger phthalate esters. Since hand wipes may also capture exposures that occur via dermal uptake, these results may also suggest that dermal absorption may be an important exposure pathway for these plasticizers.
Table 2.
Descriptive statistics for phthalates and non-phthalate plasticizers with their urinary metabolites.
| Matrix and Compound | Detection Frequency (%) | MDLa | Median | Minimum | 95th Percentile |
|---|---|---|---|---|---|
| Hand Wipe (ng/wipe) n=202 | |||||
| Phthalates | |||||
| DMP | 90 | 2.4 | 11 | ND | 120 |
| DiBP | 91 | 7.2 | 21 | ND | 123 |
| DBP | 49 | 48 | - | ND | 558 |
| BBP | 97 | 12 | 138 | ND | 1,110 |
| DEHP | 99 | 99 | 1,842 | ND | 12,105 |
| DiNP | 80 | 14 | 94 | ND | 1,755 |
| DEHTP | 100 | 2.5 | 2,401 | 102 | 16,708 |
| Non-phthalate plasticizers | |||||
| DEHA | 36 | 180 | - | ND | 3,043 |
| TOTM | 100 | 1.3 | 49 | 0.7 | 480 |
| Dust (ng/g) n=188 | |||||
| Phthalates | |||||
| DMP | 38 | 70 | - | - | 1,781 |
| DEP | 70 | 234 | 1,937 | ND | 12,239 |
| DiBP | 99 | 77 | 4,367 | ND | 33,898 |
| DBP | 99 | 210 | 9,634 | ND | 72,532 |
| BBP | 99 | 172 | 13,641 | ND | 132,508 |
| DEHP | 100 | 573 | 118,570 | 6,213 | 484,043 |
| DiNP | 96 | 188 | 78,751 | ND | 787,600 |
| DEHTP | 100 | 167 | 133,649 | 4,506 | 817,386 |
| Non-phthalate plasticizers | |||||
| DEHA | 47 | 859 | - | - | 17,168 |
| TOTM | 81 | 230 | 4,965 | ND | 36,193 |
| SG-corrected urine (ng/mL) n=180 | |||||
| MEP | 100 | 1.2 | 39 | 3.2 | 254 |
| MiBP | 100 | 0.80 | 19 | 1.8 | 77 |
| MHiBP | 100 | 0.40 | 7.1 | 0.90 | 25 |
| MBP | 100 | 0.40 | 20 | 2.5 | 91 |
| MHBP | 98 | 0.40 | 2.8 | ND | 14 |
| MCPP | 99 | 0.40 | 3.8 | ND | 18 |
| MBzP | 100 | 0.30 | 17 | 1.3 | 361 |
| MEHP | 72 | 0.80 | 1.9 | ND | 11 |
| MEOHP | 100 | 0.20 | 13 | 1.9 | 48 |
| MEHHP | 100 | 0.40 | 20 | 1.9 | 80 |
| MECPP | 100 | 0.40 | 31 | 8.8 | 121 |
| MCOP | 100 | 0.30 | 21 | 2.2 | 175 |
| MNP | 53 | 0.90 | 1.2 | ND | 7.6 |
| MCNP | 100 | 0.20 | 4.3 | 0.78 | 24 |
| MONP | 100 | 0.40 | 6.3 | 0.5 | 49 |
| MHINCH | 97 | 0.40 | 2.6 | ND | 14 |
| MCOCH | 86 | 0.50 | 1.5 | ND | 6.9 |
| MECPTP | 100 | 0.20 | 65 | 14 | 551 |
| MEHHTP | 100 | 0.40 | 8.7 | 1.7 | 62 |
Dust MDL values were normalized to average mass of dust extracted (0.059 mg).
House Dust.
The phthalates and alternative plasticizers were commonly and abundantly detected in the indoor house dust with 6 of the analytes detected in >95% of samples (Table 2). Like hand wipes, DEHTP was the most abundant compound measured in the house dust (median=133 μg/g dust) followed closely by DEHP (median=118 μg/g dust). Indoor dust levels of DEHTP in this study are much higher than previous reports of the terephthalate in Germany from the early 2000s and similar to more recent measurements in Swedish preschool dust (Larsson et al., 2017; Nagorka et al., 2011). Studies examining indoor dust in the United States similarly report DEHP to be the most abundant phthalate compound of those measured with phthalates being the most abundant class of compounds (Guo and Kannan, 2011; Mitro et al., 2016; Subedi et al., 2017). Compared to organophosphate esters in the same samples, the phthalates and alternatives were measured at 2–3 orders of magnitude higher, suggesting that exposure through dust for these compounds might be much higher than for any of the organophosphate flame retardants/plasticizers (Phillips et al., 2018). In this study, DMP was not frequently detected, which suggests that with its lower molecular weight, this compound is either not common to materials/products in the home environment, or it did not significantly partition to the indoor dust.
Urinary Metabolites.
Of the 19 phthalate and non-phthalate plasticizer metabolites assessed in the pooled urine samples, all of the metabolites were detected in >50% of samples with 13 detected in every sample (Table 2). Similar to the hand wipes and dust, one of the DEHTP metabolites, MECPTP, was the most abundant of all metabolites measured in the urine samples (median=65 ng/mL) followed by MEP (median=39 ng/mL), the metabolite of DEP. Concentrations of the DEHTP metabolites were much higher than previous reports among U.S. adults from samples taken over the last twenty years (Silva et al., 2017), which suggests that children’s exposure to DEHTP could be higher than for adults. This is also reflected in another study among U.S. adults analyzing for different DEHTP metabolites (Nayebare et al., 2018). A more detailed examination of the phthalate metabolites compared to NHANES children from a similar age group (Silva et al., 2019) was previously discussed in Hoffman et al. 2018. In addition, concentrations of unadjusted urinary MBzP in this study population (geometric mean = 25 ng/mL) were similar to those observed in inner-city children who experienced respiratory inflammation and wheeze (95% CI: 16–34 ng/mL) (Just et al., 2012). Also, these observed concentrations of MBzP were considerably higher than those measured in children aged 3–5 years from NHANES 2015–2016 (geometric mean = 8.27 ng/mL) (Calafat et al., 2017).
The urinary metabolites with the largest 95th percentile values were MBzP (major metabolite of BBP) and MECPTP (one metabolite of DEHTP). The reference dose (RfD) of BBP is listed at 200 μg/kgbw/day (U.S. EPA IRIS, 1989a). Based on an assumed urinary excretion of 13 mL/hr for children ages 3–4 years (Egeghy and Thomas, 2006) and the recorded body weights of the children, we were able to determine relative doses of BBP based on urinary measurements of MBzP (Table S13). The 95th percentile exposure of BBP for children in this study is approximately 4% of the listed RfD for BBP (Median = 0.15% of BBP RfD; Maximum = 31% of BBP RfD). Currently, no RfD has been set for DEHTP. As a result, we calculated an approximate RfD using a NOAEL of 79 mg/kgbw/day (European Chemicals Agency, 2019). Assuming two uncertainty factors of 10, each for inter- and intra-species variability, we estimated an RfD for DEHTP of 790 μg/kgbw/day. Comparing this RfD for DEHTP to the dose of DEHTP, calculated based on the summed metabolites (MECPTP and MEHHTP), the 95th percentile exposure of DEHTP in children in this study is approximately 2% of our estimated RfD for DEHTP (Median = 0.2% of DEHTP RfD; Maximum = 7% of DEHTP RfD). However, estimated exposure to BBP and DEHTP compared to their reference doses are much smaller than for DEHP. DEHP has a reference dose of 20 μg/kgbw/day, which indicates that the 95th percentile exposure of DEHP in children within this study is approximately 30% of the RfD, with the maximum exposure estimates being well over the safe reference dose for DEHP (U.S. EPA IRIS, 1989b). Further details regarding the calculations and assumptions made in calculating these values are included in the Supporting Information.
Comparing Hand Wipes and Dust to Urine.
Spearman correlations coefficients for phthalates and non-phthalate plasticizers and their metabolites, both on a molar sum basis and individually, can be found in Tables 3 and S4.
Table 3.
Spearman correlation coefficients for phthalate, non-phthalate plasticizers, and their corresponding metabolite levels measured in paired hand wipes (n = 179) and dust (n = 178) with ≥70% detection and specific-gravity corrected urine.
| Urine | |||||||||||
|---|---|---|---|---|---|---|---|---|---|---|---|
| MEP | ΣDiBPa | ΣDBPb | MCPP | MBzP | ΣDEHPc | ΣDiNPd | MCNP | ΣDINCHe | ΣDEHTf | ||
| DMP | 0.07 | 0.10 | 0.07 | 0.07 | 0.10 | 0.08 | −0.02 | 0.05 | 0.06 | 0.05 | |
| DiBP | 0.10 | 0.33† | 0.10 | 0.07 | 0.08 | 0.05 | 0.04 | 0.00 | 0.00 | 0.02 | |
| BBP | 0.16* | 0.23# | 0.35† | 0.08 | 0.56† | 0.11 | 0.03 | 0.00 | 0.01 | 0.03 | |
| Hand Wipe | DEHP | 0.04 | 0.14 | 0.09 | 0.18* | 0.16* | 0.25† | 0.19* | 0.07 | −0.01 | −0.03 |
| DiNP | 0.11 | 0.18* | 0.15 | 0.25† | 0.15* | 0.20# | 0.27† | 0.17* | 0.01 | −0.03 | |
| DEHTP | 0.13 | 0.17* | 0.10 | 0.01 | 0.18* | 0.02 | 0.05 | 0.04 | 0.13 | 0.13 | |
| TOTM | −0.09 | 0.10 | −0.02 | 0.09 | 0.08 | 0.05 | 0.16* | 0.09 | 0.06 | −0.03 | |
| DEP | 0.10 | 0.00 | 0.09 | 0.19* | 0.03 | 0.06 | 0.12 | 0.07 | 0.02 | 0.08 | |
| DiBP | 0.31† | 0.42† | 0.33† | 0.31† | 0.25† | 0.23# | 0.23# | 0.21# | 0.09 | 0.18* | |
| DBP | 0.17* | 0.19* | 0.26† | 0.10 | 0.13 | 0.14 | 0.04 | 0.06 | 0.10 | 0.19* | |
| Dust | BBP | 0.33† | 0.21† | 0.29† | 0.06 | 0.44† | 0.06 | 0.04 | 0.05 | 0.09 | 0.27† |
| DEHP | 0.00 | 0.13 | 0.12 | 0.22* | 0.04 | 0.18* | 0.15* | 0.17* | 0.03 | 0.08 | |
| DiNP | 0.03 | 0.08 | 0.11 | 0.24* | 0.05 | 0.18* | 0.19* | 0.13 | 0.14 | 0.17* | |
| DEHTP | 0.12 | 0.12 | 0.08 | 0.17* | 0.11 | 0.01 | 0.13 | 0.13 | 0.13 | 0.33† | |
| TOTM | −0.01 | 0.08 | −0.05 | 0.05 | 0.01 | −0.11 | −0.07 | −0.02 | −0.02 | 0.00 | |
p<0.05,
p<0.01,
p<0.001
ΣDiBP= Molar sum of MHiBP and MiBP
ΣDBP = Molar sum of MHBP and MBP
ΣDEHP = Molar sum of MEHP, MEOHP, MEHHP, and MECPP
ΣDiNP = Molar sum of MCOP and MONP
ΣDINCH = Molar sum of MHINCH and MCOCH
ΣDEHTP = Molar sum of MECPTP and MEHHTP
Overall, the strongest correlation between a parent plasticizer and a urinary metabolite was observed between BBP and its major metabolite MBzP (rs=0.56 and 0.44 in hand wipes and dust, respectively, p<0.001, Table 3). A similar correlation has been noted among children of a similar age for urinary MBzP and daycare dust BBP in Germany (Fromme et al., 2013).This strong correlation implies that both hand wipe mass and dust concentrations of BBP are effective metrics for estimating residential exposure. The next strongest correlation was between DiBP and the molar sum of all DiBP urinary metabolites (Table 3). This trend held for both hand wipe masses and dust concentrations (rs=0.33 and 0.42, respectively, p<0.001) again implying that measuring exposure using either hand wipe mass and dust concentration measurements are effective at estimating exposure. We also observed statistically significant positive relationships between DEHP and DiNP in hand wipes and summed urinary metabolites (p<0.001) and for DiBP, DBP, DEHP, DiNP and DEHTP in dust and total corresponding urinary metabolites. Again, this implies that measuring these phthalates in hand wipes and house dust is a useful metric of exposure in children and suggests that the home environment is a major source of exposure to these chemicals.
Table 3 also presents correlations between parent compounds and other metabolites that are not directly related through metabolism pathways. This may imply a co-exposure or co-occurrence of particular parent compounds in residential products or articles resulting in dissimilar urinary metabolite associations. Previous studies have demonstrated similar results, citing that such correlations may exist due to diet or other lifestyle habits not accounted for in this investigation (Calafat et al., 2017). In particular, dust DiBP was significantly and positively correlated with 9 of the 10 measured urinary metabolites and molar sums presented in Table 3; however, DiBP can metabolize to MHiBP and MiBP in humans, which are displayed as the molar sum ΣDiBP (Koch et al., 2012). A similar, though less dramatic, pattern was found for BBP and DiNP, which were positively and significantly correlated with several measured urinary metabolites, other than their corresponding metabolite(s).
Regression analyses adjusting for additional covariates (including child’s age and sex, mother’s education and race, and average outdoor temperature) showed similar patterns to the Spearman correlation analyses (Figure 1). These additional covariates were used for consistency across similar studies with the same dataset that investigated different classes of chemicals (Phillips et al., 2018). In general, higher levels of parent compounds in dust or hand wipes were associated with higher concentrations of urinary metabolites. For example, a significant relationship between BBP and urinary MBzP was observed for the top two quartiles of hand wipe levels, with an increasing trend across all categories (Figure 1). A similar trend was observed for BBP in dust, suggesting that of all the phthalates evaluated with biomarkers available, BBP exposure as evaluated by hand wipes and dust was most strongly associated with its urinary metabolite. This suggests that house dust may be an important source of BBP because both hand wipes and dust were positively associated with urinary MBzP at the highest quartiles. Additionally, while hand wipes are more likely to integrate exposures across multiple microenvironments, BBP levels in house dust and paired hand wipes were significantly correlated (rs=0.27, p=0.0001), which signifies that BBP is ubiquitous throughout indoor environments. Similarly significant associations were also observed between hand wipes and dust for DiBP, DEHP, and DiNP (rs = 0.16 – 0.26, p < 0.05; Table S5), which indicates that the home environment may be a contributor to the levels found on children’s hands.
Figure 1.
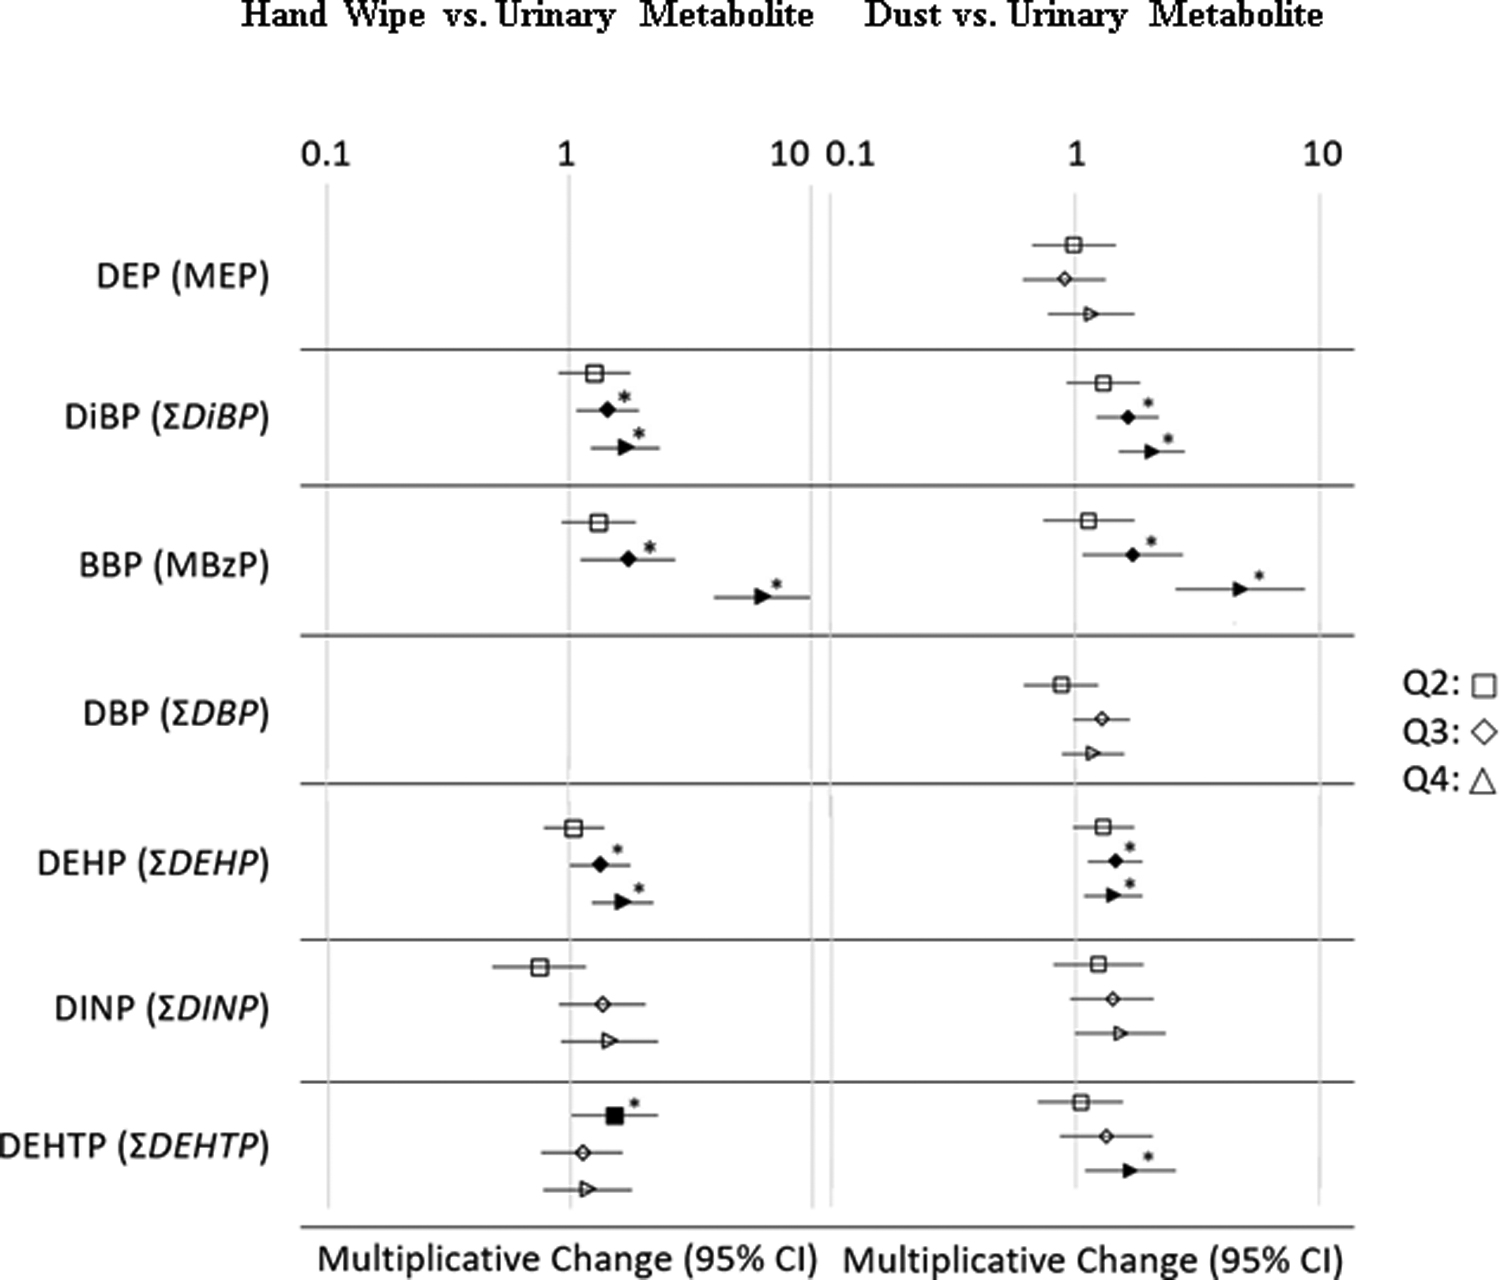
Multiplicative change results of regression analyses (adjusted for covariates child’s sex and age, mother’s education and race, and average outdoor temperature) and 95% confidence intervals for predicting phthalate urinary metabolites based on mass of parent phthalate on hand wipes and concentration in dust.
Associated urinary metabolites are provided in figure text. Q1 (reference category) not shown. Filled shapes with an asterisk (*) signifies statistically significant (p < 0.05) associations. DEP in hand wipes was not included due to interferences in the chromatography, and DBP in hand wipes was not analyzed due to low detection limit
Hand wipe levels of these phthalate and non-phthalate plasticizers may also provide important information on children’s exposures in particular. Children have more hand-to-mouth contacts than adults, and this may be an important pathway of exposure for plasticizers that can be captured by the hand wipes in addition to dermal absorption, where uptake may occur via transdermal penetration as discussed by Weschler and Nazaroff (2012). Further, previous studies have shown that inhalation of indoor air alone can possibly account for only 10% of total exposure to phthalates such as BBP, thereby indicating that for many of these compounds, the majority of individual exposure would be via other pathways (e.g., dust, dermal absorption, hand-to-mouth contact) (Bekö et al., 2013). The significant and positive correlations between BBP in dust and hand wipes to its urinary metabolite, MBzP, in particular, suggest that residential indoor environmental exposures are meaningful when assessing the total BBP exposure experienced by children. This is particularly noteworthy because of the potential adverse health outcomes for and sensitivity of vulnerable populations, such as pregnant women and children, to BBP (Shu et al., 2019).
Similar to the Spearman correlation analyses, models that examined the effect of hand wipes levels of both DiBP and DEHP on their corresponding molar summed urinary metabolites were associated after adjusting for covariates in regression analyses. Positive relationships between dust concentration and urinary metabolites for DiBP, DEHP, DiNP, and DEHTP were observed. Correlations between both DiBP and DEHP in hand wipes and dust as compared to their corresponding urinary metabolites suggest that these sampling techniques are effective exposure metrics for residential phthalate exposures. While the primary pathway of exposure for several phthalates, and particularly DEHP, has been attributed to diet (Serrano et al., 2014), our results suggest that the home environment also contributes towards the total daily exposure. Some low molecular weight phthalates have been associated with diet as well (Colacino et al., 2010; Ji et al., 2010), although some studies suggest exposure to low molecular weight phthalates is thought to occur predominantly through the use of personal care products (Pacyga et al., 2019; Parlett et al., 2013; Serrano et al., 2014). Further detailed information on all phthalates and plasticizer alternatives in the three exposure matrices evaluated can be found in Tables S6 and S7.
Housing Characteristics and Exposure Matrices
The presence of vinyl flooring in the home was of particular interest since vinyl has been shown to be a source of certain phthalates such as BBP, DiNP and DEHP (Shu et al., 2019; Xu et al., 2009, 2010). Polyvinyl chloride (PVC) flooring can contain up to 30% (w/w) of phthalate plasticizers such as BBP (Bi et al., 2015); because they are not covalently bound to the flooring, these phthalates can leach into the home environment and lead to residential exposure (Salaudeen et al., 2018; Shu et al., 2019; Sicińska, 2018). Previous studies have observed significantly elevated levels of house dust BBP and urinary MBzP in pregnant women in homes with PVC flooring compared to other flooring types (Bi et al., 2018; Shu et al., 2019). While vinyl flooring could be a source of BBP in the home, it is important to note that we did not directly test the vinyl flooring for phthalates in this study. According to a recent publication, DEHTP is a common plasticizer used in a wide variety of applications such as coatings, adhesives, and sealants in products often found in residential environments (e.g., flooring, cable insulations, toys). It is marketed as an alternative plasticizer in response to recent phthalate bans worldwide (Eastman Chemical Company, 2014) Therefore, DEHTP may be commonly found in more recent vinyl flooring installations. This may suggest that the homes we sampled with 100% vinyl was older and contained BBP as a plasticizer. A majority of the homes with 100% vinyl flooring in this study were public housing, and thus they may not have been renovated in some time.
Figure 2 compares the measurements of phthalate and non-phthalate plasticizers on hand wipes and in dust between homes with no vinyl flooring (0%) and homes with 0.1–5%, 5.1–10%, 10.1–33%, or 100% vinyl flooring in the TESIE study. For children living in 100% vinyl homes, levels of BBP measured on their hand wipes were 350% higher than those living in homes without any vinyl flooring, (10β = 4.5, 95% CI = 2.2 – 9.3, p < 0.0001), while dust concentrations of BBP were associated with a 450% increase as compared to homes with no vinyl flooring (10β = 5.5, 95% CI = 2.7 – 11.4, p < 0.0001) (Figure 2). These BBP trends in dust were significant across all homes with any vinyl flooring, though a significant result was only observed for hand wipes for children living in homes with 100% vinyl flooring (Table S11, S12). Though no other phthalates or non-phthalate plasticizers measured in hand wipes showed statistically significant associations in homes with 100% vinyl flooring, DiNP concentrations in dust were also significantly higher in homes with 10.1–32% vinyl flooring (10β = 1.9, 95% CI = 1.2 – 3.0, p<0.05) (Table S12).
Figure 2.
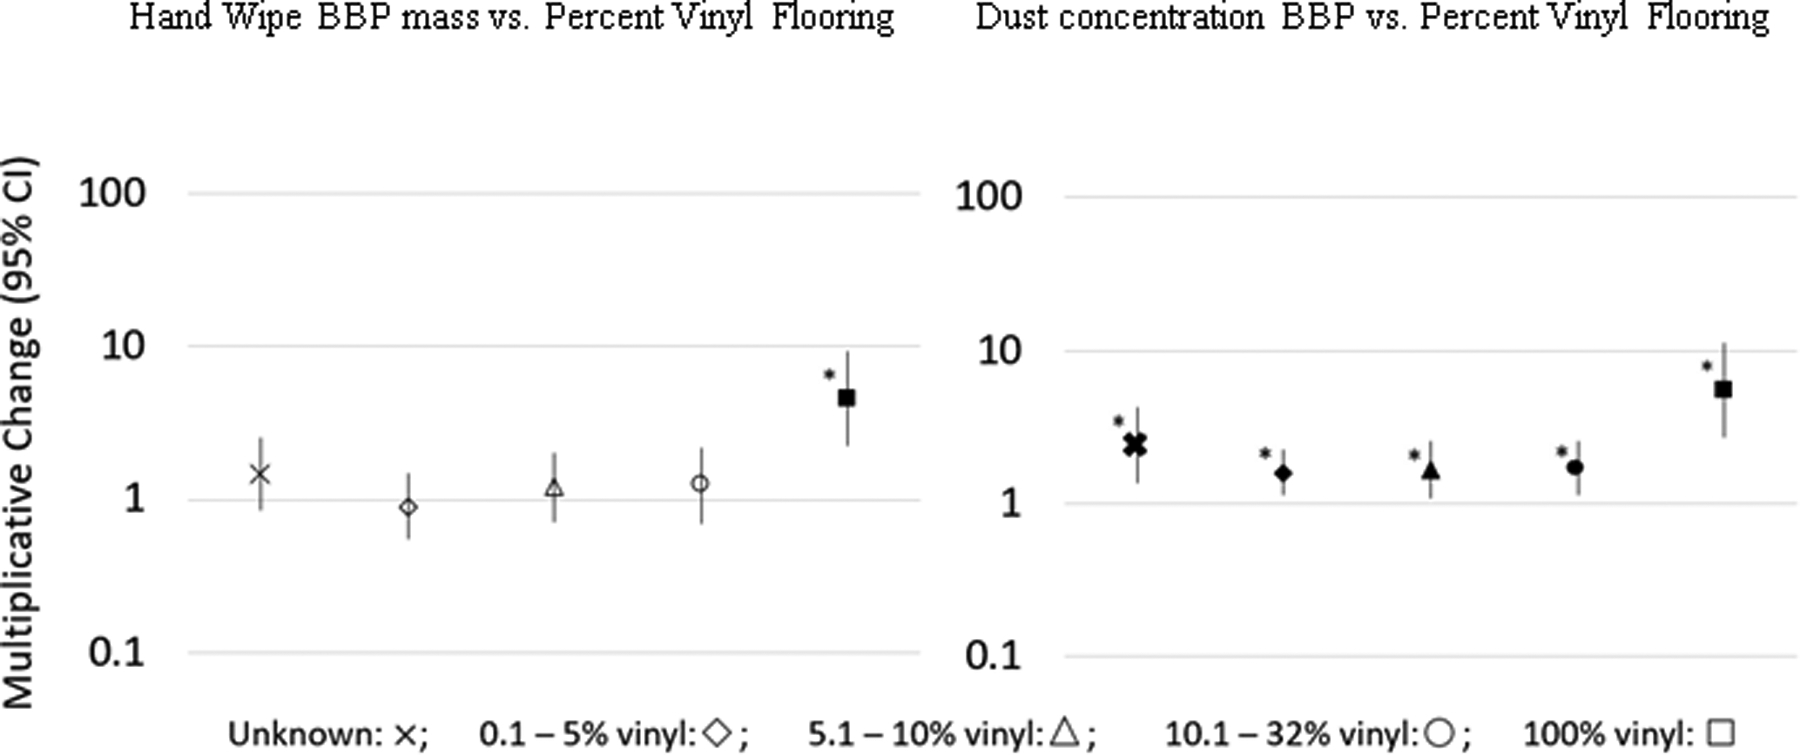
Multiplicative change results of regression analyses (adjusted for covariates child’s sex and age, mother’s education and race, and average outdoor temperature) and 95% confidence intervals of vinyl flooring as a predictor of hand wipe BBP mass and dust concentration BBP. The magnitude of increase in BBP compared to percentage of vinyl flooring in the home are compared to homes with 0% vinyl flooring (reference category), which is represented at a multiplicative change of 1.
Filled shapes with an asterisk (*) signify significant (p < 0.05) associations.
As shown in Figure 3, MBzP was substantially higher in children living in houses with 100% vinyl flooring (10β = 16.3, 95% CI = 6.7 – 39.4, p < 0.0001). Urinary MBzP was also elevated among children living in homes where the percentage of vinyl was unknown, most of which were apartment buildings or mobile homes/trailers (10β = 2.0, 95% CI = 1.1 – 3.5, p<0.05; Table S10). Although not as strongly associated as with MBzP, similar associations with urinary metabolites were observed among children living in homes with 100% vinyl flooring for metabolites of DEP, DBP, DEHP, and DINCH (10β = 1.9 – 3.0, p < 0.05; 95% CI per metabolite found in Table S10). The positive associations observed for other urinary metabolites in children from 100% vinyl homes suggest that these compounds may be present in vinyl flooring along with BBP, thus leading to co-exposure, or may represent additional products or articles more frequently found in homes that have 100% vinyl flooring. As many of the homes with 100% vinyl flooring in this study were likely public housing developments, there may be implications regarding socioeconomic status that are important when considering exposures to endocrine disrupting compounds such as phthalates.
Figure 3.
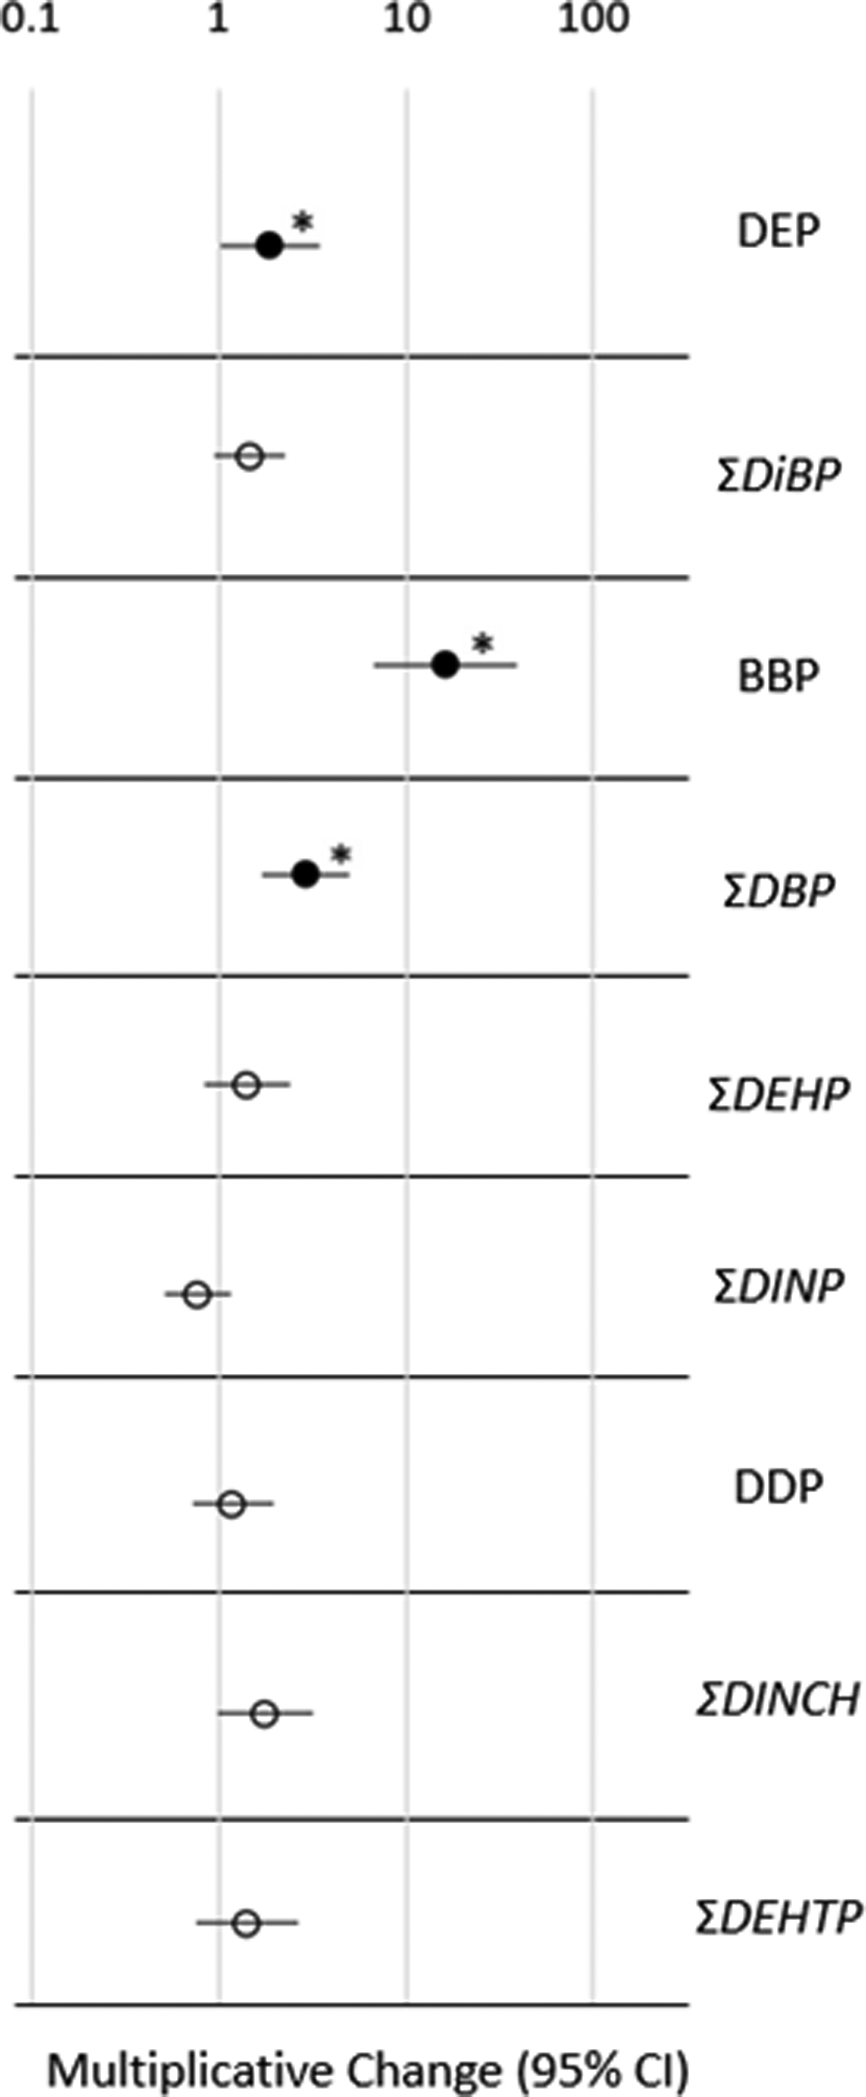
Multiplicative change results of regression analyses (adjusted for covariates child’s sex and age, mother’s education and race, and average outdoor temperature) and 95% confidence intervals of 100% vinyl flooring as a predictor of urinary phthalate or phthalate alternative metabolite concentration, listed by parent compound. The magnitude of urinary metabolite found in people living in 100% vinyl flooring homes is compared to homes with 0% vinyl flooring (reference category).
Filled shapes with an asterisk (*) signifies significant (p < 0.05) associations.
Other housing characteristics (e.g., age of home) and behavioral patterns (e.g., frequency of personal care product use, consumption of food from microwaved plastic) were queried and examined in our analyses; however, the results of these investigations were largely null (presented in supporting information). This is somewhat contradictory to what has been reported previously. For example, Hsieh and colleagues recently reported positive association between the use of person care products, including lotion, and urinary phthalate metabolite concentrations among pregnant women (Hsieh et al., 2019). While adult women may have different behaviors and product use habits than children, similarly elevated phthalate urinary metabolites among children has been associated with products such as liquid soap, hair care products, face creams, and sunscreen (Philippat et al., 2015; Sakhi et al., 2017). Because of possible recall bias present in the questionnaire results, our overall results may be biased towards the null because of exposure misclassifications. Thus, despite observing a lack of significant associations in this study, other studies suggest that product use, behavior, and other aspects of the home environment could still be important for evaluating exposure to phthalates and non-phthalate plasticizers.
Limitations and Strengths.
The results of this study should be interpreted in the context of several potential limitations. First, we analyzed the home environment at a single point in time, potentially limiting our ability to evaluate longer-term exposures. In addition, we only sampled dust from the main living area in the home, which may not accurately capture exposure to chemicals in other areas of the home or outside the home (e.g., school). We did not assess potential exposure via diet or inhalation nor did we test products within the home (e.g., children’s toys or flooring) for phthalates. A model that includes the contribution of these other exposure pathways, various microenvironments, and individual behavior may strengthen observed associations with urinary biomarkers. As a biomarker of exposure to phthalates and non-phthalate replacements, we used a composite sample comprised of three urine samples per child collected over a 48-hour period. However, many of the metabolites that we assessed have relatively short half lives in the human body, exposure to the parent compound may be episodic in nature, and it is likely that exposure over longer periods is more variable. Our study population was a convenience sample from an established pregnancy cohort. While that may limit the generalizability of the results to the broader population, it should not impact the internal validity of the study. With the wealth of data available herein, we cannot rule out residual confounding of our results due to factors such as socioeconomic status (SES). Mother’s education was used as a proxy for SES, though this proxy may be unable to account for other nuanced effects of SES. In addition, statistical significance was set at α = 0.05, and adjustments were not made for multiple comparisons. However, this has been recommended and generally accepted in the epidemiologic literature (Rothman, 1990).
Our study has several important strengths, including the relatively large size for an exposure study of children and a diverse study population. The collection of paired samples (urine, hand wipes, house dust), the use of a pooled urine sample per child (rather than a single spot urine), and the analysis for a large suite of phthalates and non-phthalate replacement plasticizers are additional strengths of our work.
Conclusion
Phthalate parent compounds were detected in nearly all of the hand wipe and dust samples collected in this study, and metabolites were detected in all children’s urine samples, suggesting ubiquitous exposures for children in the TESIE study. Exposure to these compounds likely come from residential environments, and this investigation of vinyl flooring and phthalate metabolite urinary concentrations may shed light on the pathway of exposure to certain phthalates. Our results suggest that hand wipes and dust provide good estimates of indoor home exposure to phthalates, with dust providing improved metrics of exposure for some of the higher molecular weight phthalates and hand wipes being better for examining exposure to lower molecular weight phthalates. This result also could be dependent on product use in the home as the chemicals have vastly different physicochemical properties and usages. Through a more detailed examination of how vinyl flooring may have contributed to children’s exposure in this study, we hope that future work can evaluate ways to reduce or eliminate exposure to these compounds, especially in light of their potential adverse health impacts.
Supplementary Material
Acknowledgements
Funding for this research was provided by grants from the U.S. Environmental Protection Agency (Grant 83564201) and NIEHS (R01 ES016099). Additional support for ALP was provided by NIEHS (T32-ES021432). Thanks to Albert Chen for help with home data collection. We also thank our participants for opening their homes to our study team and helping us gain a better understanding of children’s exposures to SVOCs.
Footnotes
Supporting Information
Additional information is available on compound names and corresponding metabolites (Table S1), GC/MS analytical method and m/z ions (Item S1, Table S2), blank levels of analytes in each matrix (Table S3), expanded correlation table for hand wipes and dust with individual metabolites (Table S4), correlation table for hand wipes and dust for parent plasticizer compounds (Table S5), additional details on regression analyses for hand wipes and dust (Tables S6 and S7), additional product analyses with hand wipes and urine (Table S8 and S9), expanded vinyl flooring regression analyses (Table S10–12), and calculations of BBP and DEHTP doses compared to RfDs (Table S13).
The authors declare no competing financial interests.
Publisher's Disclaimer: Disclaimer
The findings and conclusions in this report are those of the authors and do not necessarily represent the views of the Centers for Disease Control and Prevention (CDC). Use of trade names is for identification only and does not imply endorsement by the CDC, the Public Health Service, or the US Department of Health and Human Services.
References
- Antweiler RC, Taylor HE, 2008. Evaluation of Statistical Treatments of Left-Censored Environmental Data using Coincident Uncensored Data Sets: I. Summary Statistics. Environ. Sci. Technol 42, 3732–3738. doi: 10.1021/es071301c [DOI] [PubMed] [Google Scholar]
- Api AM, 2001. Toxicological profile of diethyl phthalate: a vehicle for fragrance and cosmetic ingredients. Food Chem. Toxicol 39, 97–108. doi: 10.1016/S0278-6915(00)00124-1 [DOI] [PubMed] [Google Scholar]
- Bekö G, Weschler CJ, Langer S, Callesen M, Toftum J, Clausen G, 2013. Children’s Phthalate Intakes and Resultant Cumulative Exposures Estimated from Urine Compared with Estimates from Dust Ingestion, Inhalation and Dermal Absorption in Their Homes and Daycare Centers. PLoS One 8, e62442. doi: 10.1371/journal.pone.0062442 [DOI] [PMC free article] [PubMed] [Google Scholar]
- Bergh C, Luongo G, Wise S, Östman C, 2012. Organophosphate and phthalate esters in standard reference material 2585 organic contaminants in house dust. Anal. Bioanal. Chem 402, 51–59. doi: 10.1007/s00216-011-5440-2 [DOI] [PubMed] [Google Scholar]
- Bergh C, Torgrip R, Emenius G, Ostman C, 2011. Organophosphate and phthalate esters in air and settled dust - a multi-location indoor study. Indoor Air 21, 67–76. [DOI] [PubMed] [Google Scholar]
- Bi C, Liang Y, Xu Y, 2015. Fate and Transport of Phthalates in Indoor Environments and the Influence of Temperature: A Case Study in a Test House. Environ. Sci. Technol 49, 9674–9681. doi: 10.1021/acs.est.5b02787 [DOI] [PubMed] [Google Scholar]
- Bi C, Maestre JP, Li H, Zhang G, Givehchi R, Mahdavi A, Kinney KA, Siegel J, Horner SD, Xu Y, 2018. Phthalates and organophosphates in settled dust and HVAC filter dust of U.S. low-income homes: Association with season, building characteristics, and childhood asthma. Environ. Int 121, 916–930. doi: 10.1016/j.envint.2018.09.013 [DOI] [PubMed] [Google Scholar]
- Boeniger MF, Lowry LK, Rosenberg J, 1993. Interpretation of Urine Results Used to Assess Chemical Exposure with Emphasis on Creatinine Adjustments: A Review. Am. Ind. Hyg. Assoc. J 54, 615–627. doi: 10.1080/15298669391355134 [DOI] [PubMed] [Google Scholar]
- Bu Z, Wang J, Yu W, Li B, 2018. Dermal exposure to phthalates in home environment: Handwipes, influencing factors and implications. Build. Environ 133, 1–7. doi: 10.1016/j.buildenv.2018.02.013 [DOI] [Google Scholar]
- Calafat AM, Ye X, Valentin-Blasini L, Li Z, Mortensen ME, Wong L-Y, 2017. Co-exposure to non-persistent organic chemicals among American pre-school aged children: A pilot study. Int. J. Hyg. Environ. Health 220, 55–63. doi: 10.1016/j.ijheh.2016.10.008 [DOI] [PMC free article] [PubMed] [Google Scholar]
- CDC, 2019. National Report on Human Exposure to Environmental Chemicals, Updated Tables- January 2019.
- CDC, 2016. Laboratory Procedure Manual: Metabolites of phthalates and phthalate alternatives (Method No. 6306.07).
- Colacino JA, Harris TR, Schecter A, 2010. Dietary Intake Is Associated with Phthalate Body Burden in a Nationally Representative Sample. Environ. Health Perspect 118, 998–1003. doi: 10.1289/ehp.0901712 [DOI] [PMC free article] [PubMed] [Google Scholar]
- Cousins I, Mackay D, 2000. Correlating the physical–chemical properties of phthalate esters using the `three solubility’ approach. Chemosphere 41, 1389–1399. doi: 10.1016/S0045-6535(00)00005-9 [DOI] [PubMed] [Google Scholar]
- Eastman Chemical Company, 2014. Why Eastman 168 is a non-phthalate plasticizer.
- Egeghy PP, Thomas KW, 2006. Estimates of Age-Specific Urinary Excretion Rates for Creatinine Among Children, in: ISEE/ISEA. [Google Scholar]
- European Chemicals Agency, 2019. Bis(2-ethylhexyl) terephthalate Registration Dossier.
- European Chemicals Agency, 2017. Restriction proposal on four phthalates and several authorisation applications agreed by RAC and SEAC [WWW Document]. URL https://echa.europa.eu/-/restriction-proposal-on-four-phthalates-and-several-authorisation-applications-agreed-by-rac-and-seac (accessed 3.21.19).
- Fromme H, Lahrz T, Kraft M, Fembacher L, Dietrich S, Sievering S, Burghardt R, Schuster R, Bolte G, Völkel W, 2013. Phthalates in German daycare centers: Occurrence in air and dust and the excretion of their metabolites by children (LUPE 3). Environ. Int 61, 64–72. doi: 10.1016/j.envint.2013.09.006 [DOI] [PubMed] [Google Scholar]
- Gong M, Weschler CJ, Liu L, Shen H, Huang L, Sundell J, Zhang Y, 2015. Phthalate metabolites in urine samples from Beijing children and correlations with phthalate levels in their handwipes. Indoor Air. doi: 10.1111/ina.12179 [DOI] [PubMed] [Google Scholar]
- Gong M, Zhang Y, Weschler CJ, 2014. Measurement of phthalates in skin wipes: Estimating exposure from dermal absorption. Environ. Sci. Technol 48, 7428–7435. doi: 10.1021/es501700u [DOI] [PubMed] [Google Scholar]
- Guo Y, Kannan K, 2011. Comparative assessment of human exposure to phthalate esters from house dust in China and the United States. Environ. Sci. Technol 45, 3788–94. doi: 10.1021/es2002106 [DOI] [PubMed] [Google Scholar]
- Hoffman K, Hammel SC, Phillips AL, Lorenzo AM, Chen A, Calafat AM, Ye X, Webster TF, Stapleton HM, 2018. Biomarkers of exposure to SVOCs in children and their demographic associations: The TESIE Study. Environ. Int 119, 26–36. doi: 10.1016/j.envint.2018.06.007 [DOI] [PMC free article] [PubMed] [Google Scholar]
- Hoyo C, Murtha AP, Schildkraut JM, Forman MR, Calingaert B, Demark-Wahnefried W, Kurtzberg J, Jirtle RL, Murphy SK, 2011. Folic acid supplementation before and during pregnancy in the Newborn Epigenetics STudy (NEST). BMC Public Health 11, 46. doi: 10.1186/1471-2458-11-46 [DOI] [PMC free article] [PubMed] [Google Scholar]
- Hsieh C-J, Chang Y-H, Hu A, Chen M-L, Sun C-W, Situmorang RF, Wu M-T, Wang S-L, 2019. Personal care products use and phthalate exposure levels among pregnant women. Sci. Total Environ 648, 135–143. doi: 10.1016/j.scitotenv.2018.08.149 [DOI] [PubMed] [Google Scholar]
- Ji K, Lim Kho Y, Park Y, Choi K, 2010. Influence of a five-day vegetarian diet on urinary levels of antibiotics and phthalate metabolites: A pilot study with “Temple Stay” participants. Environ. Res 110, 375–382. doi: 10.1016/j.envres.2010.02.008 [DOI] [PubMed] [Google Scholar]
- Just AC, Whyatt RM, Miller RL, Rundle AG, Chen Q, Calafat AM, Divjan A, Rosa MJ, Zhang H, Perera FP, Goldstein IF, Perzanowski MS, 2012. Children’s Urinary Phthalate Metabolites and Fractional Exhaled Nitric Oxide in an Urban Cohort. Am. J. Respir. Crit. Care Med 186, 830–837. doi: 10.1164/rccm.201203-0398OC [DOI] [PMC free article] [PubMed] [Google Scholar]
- Koch HM, Christensen KLY, Harth V, Lorber M, Brüning T, 2012. Di-n-butyl phthalate (DnBP) and diisobutyl phthalate (DiBP) metabolism in a human volunteer after single oral doses. Arch. Toxicol 86, 1829–1839. doi: 10.1007/s00204-012-0908-1 [DOI] [PubMed] [Google Scholar]
- Langer S, Bekö G, Weschler CJ, Brive LM, Toftum J, Callesen M, Clausen G, 2014. Phthalate metabolites in urine samples from Danish children and correlations with phthalates in dust samples from their homes and daycare centers. Int. J. Hyg. Environ. Health 217, 78–87. doi: 10.1016/j.ijheh.2013.03.014 [DOI] [PubMed] [Google Scholar]
- Larsson K, Lindh CH, Jönsson BA, Giovanoulis G, Bibi M, Bottai M, Bergström A, Berglund M, 2017. Phthalates, non-phthalate plasticizers and bisphenols in Swedish preschool dust in relation to children’s exposure. Environ. Int 102, 114–124. doi: 10.1016/j.envint.2017.02.006 [DOI] [PubMed] [Google Scholar]
- Luongo G, Östman C, 2016. Organophosphate and phthalate esters in settled dust from apartment buildings in Stockholm. Indoor Air 26, 414–425. doi: 10.1111/ina.12217 [DOI] [PubMed] [Google Scholar]
- Mercier F, Gilles E, Saramito G, Glorennec P, Le Bot B, 2014. A multi-residue method for the simultaneous analysis in indoor dust of several classes of semi-volatile organic compounds by pressurized liquid extraction and gas chromatography/tandem mass spectrometry. J. Chromatogr. A 1336, 101–111. doi: 10.1016/j.chroma.2014.02.004 [DOI] [PubMed] [Google Scholar]
- Mitro SD, Dodson RE, Singla V, Adamkiewicz G, Elmi AF, Tilly MK, Zota AR, 2016. Consumer Product Chemicals in Indoor Dust: A Quantitative Meta-analysis of U.S. Studies. Environ. Sci. Technol 50, 10661–10672. doi: 10.1021/acs.est.6b02023 [DOI] [PMC free article] [PubMed] [Google Scholar]
- Nagorka R, Conrad A, Scheller C, Süßenbach B, Moriske H-J, 2011. Diisononyl 1,2-cyclohexanedicarboxylic acid (DINCH) and Di(2-ethylhexyl) terephthalate (DEHT) in indoor dust samples: Concentration and analytical problems. Int. J. Hyg. Environ. Health 214, 26–35. doi: 10.1016/j.ijheh.2010.08.005 [DOI] [PubMed] [Google Scholar]
- Nayebare SR, Karthikraj R, Kannan K, 2018. Analysis of terephthalate metabolites in human urine by high-performance liquid chromatography-tandem mass spectrometry (HPLC-MS/MS). J. Chromatogr. B. Analyt. Technol. Biomed. Life Sci 1092, 473–479. doi: 10.1016/j.jchromb.2018.06.044 [DOI] [PMC free article] [PubMed] [Google Scholar]
- Pacyga DC, Sathyanarayana S, Strakovsky RS, 2019. Dietary Predictors of Phthalate and Bisphenol Exposures in Pregnant Women. Adv. Nutr doi: 10.1093/advances/nmz029 [DOI] [PMC free article] [PubMed] [Google Scholar]
- Parlett LE, Calafat AM, Swan SH, 2013. Women’s exposure to phthalates in relation to use of personal care products. J. Expo. Sci. Environ. Epidemiol 23, 197–206. doi: 10.1038/jes.2012.105 [DOI] [PMC free article] [PubMed] [Google Scholar]
- Philippat C, Bennett D, Calafat AM, Picciotto IH, 2015. Exposure to select phthalates and phenols through use of personal care products among Californian adults and their children. Environ. Res 140, 369–376. doi: 10.1016/j.envres.2015.04.009 [DOI] [PMC free article] [PubMed] [Google Scholar]
- Phillips AL, Hammel SC, Hoffman K, Lorenzo AM, Chen A, Webster TF, Stapleton HM, 2018. Children’s residential exposure to organophosphate ester flame retardants and plasticizers: Investigating exposure pathways in the TESIE study. Environ. Int 116, 176–185. doi: 10.1016/j.envint.2018.04.013 [DOI] [PMC free article] [PubMed] [Google Scholar]
- Rothman KJ, 1990. No adjustments are needed for multiple comparisons. Epidemiology 1, 43–6. [PubMed] [Google Scholar]
- Sakhi AK, Sabaredzovic A, Cequier E, Thomsen C, 2017. Phthalate metabolites in Norwegian mothers and children: Levels, diurnal variation and use of personal care products. Sci. Total Environ 599–600, 1984–1992. doi: 10.1016/j.scitotenv.2017.05.109 [DOI] [PubMed] [Google Scholar]
- Salaudeen T, Okoh O, Agunbiade F, Okoh A, 2018. Fate and impact of phthalates in activated sludge treated municipal wastewater on the water bodies in the Eastern Cape, South Africa. Chemosphere 203, 336–344. doi: 10.1016/j.chemosphere.2018.03.176 [DOI] [PubMed] [Google Scholar]
- Schettler T, 2006. Human exposure to phthalates via consumer products. Int. J. Androl 29, 134–139. doi: 10.1111/j.1365-2605.2005.00567.x [DOI] [PubMed] [Google Scholar]
- Serrano SE, Braun J, Trasande L, Dills R, Sathyanarayana S, 2014. Phthalates and diet: a review of the food monitoring and epidemiology data. Environ. Heal 13, 43. doi: 10.1186/1476-069X-13-43 [DOI] [PMC free article] [PubMed] [Google Scholar]
- Shu H, Jönsson BAG, Gennings C, Lindh CH, Nånberg E, Bornehag C-G, 2019. PVC flooring at home and uptake of phthalates in pregnant women. Indoor Air 29, 43–54. doi: 10.1111/ina.12508 [DOI] [PubMed] [Google Scholar]
- Sicińska P, 2018. Di-n-butyl phthalate, butylbenzyl phthalate and their metabolites induce haemolysis and eryptosis in human erythrocytes. Chemosphere 203, 44–53. doi: 10.1016/j.chemosphere.2018.03.161 [DOI] [PubMed] [Google Scholar]
- Silva MJ, Samandar E, Preau JL, Reidy JA, Needham LL, Calafat AM, 2007. Quantification of 22 phthalate metabolites in human urine. J. Chromatogr. B. Analyt. Technol. Biomed. Life Sci 860, 106–12. doi: 10.1016/j.jchromb.2007.10.023 [DOI] [PubMed] [Google Scholar]
- Silva MJ, Wong L-Y, Samandar E, Preau JL, Calafat AM, Ye X, 2017. Exposure to di-2-ethylhexyl terephthalate in a convenience sample of U.S. adults from 2000 to 2016. Arch. Toxicol 91, 3287–3291. doi: 10.1007/s00204-017-1956-3 [DOI] [PMC free article] [PubMed] [Google Scholar]
- Silva MJ, Wong L-Y, Samandar E, Preau JL, Jia LT, Calafat AM, 2019. Exposure to di-2-ethylhexyl terephthalate in the U.S. general population from the 2015–2016 National Health and Nutrition Examination Survey. Environ. Int 123, 141–147. doi: 10.1016/j.envint.2018.11.041 [DOI] [PMC free article] [PubMed] [Google Scholar]
- Stapleton HM, Eagle S, Sjödin A, Webster TF, 2012. Serum PBDEs in a North Carolina toddler cohort: Associations with handwipes, house dust, and socioeconomic variables. Environ. Health Perspect 120, 1049–1054. doi: 10.1289/ehp.1104802 [DOI] [PMC free article] [PubMed] [Google Scholar]
- Stapleton HM, Kelly SM, Allen JG, Mcclean MD, Webster TF, 2008. Measurement of polybrominated diphenyl ethers on hand wipes: Estimating exposure from hand-to-mouth contact. Environ. Sci. Technol 42, 3329–3334. doi: 10.1021/es7029625 [DOI] [PubMed] [Google Scholar]
- Subedi B, Sullivan KD, Dhungana B, 2017. Phthalate and non-phthalate plasticizers in indoor dust from childcare facilities, salons, and homes across the USA. Environ. Pollut 230, 701–708. doi: 10.1016/j.envpol.2017.07.028 [DOI] [PubMed] [Google Scholar]
- Taylor JK, 1987. Quality Assurance of Chemical Measurements. Lewis Publishers, Chelsea, MI. [Google Scholar]
- U.S. EPA IRIS, 1989a. Butyl benzyl phthalate: Integrated Risk Information System (IRIS) Chemical Assessment Summary.
- U.S. EPA IRIS, 1989b. Bis(2-ethylhexyl) phthalate: Integrated Risk Information Summary.
- United States Consumer Product Safety Commission, 2017. CPSC Prohibits Certain Phthalates in Children’s Toys and Child Care Products [WWW Document]. URL https://www.cpsc.gov/content/cpsc-prohibits-certain-phthalates-in-children’s-toys-and-child-care-products (accessed 3.21.19).
- Weschler CJ, Nazaroff WW, 2012. SVOC exposure indoors: fresh look at dermal pathways. Indoor Air 22, 356–377. doi: 10.1111/j.1600-0668.2012.00772.x [DOI] [PubMed] [Google Scholar]
- Xu Y, Cohen Hubal EA, Little JC, 2010. Predicting residential exposure to phthalate plasticizer emitted from vinyl flooring: Sensitivity, uncertainty, and implications for biomonitoring. Environ. Health Perspect 118, 253–258. doi: 10.1289/ehp.0900559 [DOI] [PMC free article] [PubMed] [Google Scholar]
- Xu Y, Hubal EAC, Clausen PA, Little JC, 2009. Predicting residential exposure to phthalate plasticizer emitted from vinyl flooring: a mechanistic analysis. Environ. Sci. Technol 43, 2374–80. [DOI] [PubMed] [Google Scholar]
Associated Data
This section collects any data citations, data availability statements, or supplementary materials included in this article.