

Graphical abstract

Keywords: Adsorption isotherm, Critical micelle concentration, HPLC, Computational chemistry, Modified extended Langmuir model, Harsh reservoir conditions
Highlights
-
•
The adsorption mechanism was analysed using a novel integrated workflow.
-
•
Monolayer and multilayer adsorption occurred simultaneously on the rock surface in a heterogeneous adsorption system.
-
•
A state-of-the-art computational chemistry simulation work has been employed.
-
•
The predicted APG and AEC adsorption behaviours within the mixture were contradictory to their experimental individual behaviour.
Abstract
Throughout the application of enhanced oil recovery (EOR), surfactant adsorption is considered the leading constraint on both the successful implementation and economic viability of the process. In this study, a comprehensive investigation on the adsorption behaviour of nonionic and anionic individual surfactants; namely, alkyl polyglucoside (APG) and alkyl ether carboxylate (AEC) was performed using static adsorption experiments, isotherm modelling using (Langmuir, Freundlich, Sips, and Temkin models), adsorption simulation using a state-of-the-art method, binary mixture prediction using the modified extended Langmuir (MEL) model, and artificial neural network (ANN) prediction. Static adsorption experiments revealed higher adsorption capacity of APG as compared to AEC, with sips being the most fitted model with R2 (0.9915 and 0.9926, for APG and AEC respectively). It was indicated that both monolayer and multilayer adsorption took place in a heterogeneous adsorption system with non-uniform surfactant molecules distribution, which was in remarkable agreement with the simulation results. The (APG/AEC) binary mixture prediction depicted contradictory results to the experimental individual behaviour, showing that AEC had more affinity to adsorb in competition with APG for the adsorption sites on the rock surface. The adopted ANN model showed good agreement with the experimental data and the simulated adsorption values for APG and AEC showed a decreasing trend as temperature increases. Simulating the impact of binary surfactant adsorption can provide a tremendous advantage of demonstrating the binary system behaviour with less experimental data. The utilization of ANN for such prediction procedure can minimize the experimental time, operating cost and give feasible predictions compared to other computational methods. The integrated workflow followed in this study is quite innovative as it has not been employed before for surfactant adsorption studies.
Nomenclature
- AEC
Alkyl ether carboxylate
- ANN
Artificial neural networks
- APG
Alkyl polyglucoside
- BET
Brunauer-Emmett-Teller
- CMC
Critical micelle concentration
- ELSD
Evaporative light scattering detector
- EOR
Enhanced oil recovery
- HPLC
High-performance liquid chromatography
- IFT
Interfacial tension
- MEL
Modified extended Langmuir model
- ppm
Parts per million
- ST
Surface tension
- wt.%
Weight percent
- XRD
X-ray powder diffraction
Temkin isotherm equilibrium binding constant (L/g)
Sips isotherm model constant (L/mg)
Tempkin isotherm constant (J/mol)
- C°
Concentrations of the surfactant before adsorption (mg/mL)
- C
Concentrations of the surfactant after adsorption (mg/mL)
Equilibrium aqueous concentration (mg/L).
Freundlich isotherm constant (L/mg)
Langmuir isotherm constant (L/mg)
Sips isotherm model constant (L/g)
- M
Mass of the crushed core (g)
Exponent in Freundlich isotherm
Amount of APG adsorbed on the rock surface
Amount of AEC adsorbed on the rock surface
Surfactant amount adsorbed (mg/g)
Maximum surfactant adsorbed amount (mg/g)
Universal gas constant (8.314 J/mol K)
- r1,r2
Principal radii of surface curvature
Equilibrium selectivity of APG and AEC within the mixture
Temperature (K)
- Vs
Volume of the surfactant solution (mL)
- and
Constants representing the loading fractions
Sips isotherm exponent
- σ
Surface tension (N/m)
- Γ
Surfactant adsorbed amount on the rock surface (mg/g)
- Δp
Laplace pressure difference (Pa)
1. Introduction
The economical oil recovery from known reservoirs initially takes place by primary and secondary recovery processes, which contribute to recovering one-third of the original oil in place (OOIP). Meanwhile, around 60% of the OOIP remains trapped in oil reservoirs [1], [2], [3], [4]. Despite the current dire economic situation due to the impact of COVID-19 on energy consumption, the future high demand for energy imposes the need of additional recovery from the remaining crude oil in mature fields, which is targeted by Enhanced Oil Recovery (EOR) techniques [5], [6], [7], [8], [9], [10]. The application of surfactants in EOR has been always considered an effective approach for increasing oil recovery. Surfactants are injected in order to reduce the interfacial tension (IFT) and achieve high displacement efficiency [11], [12]. Surfactants have an amphiphilic nature, in which they comprise of hydrophobic tail and hydrophilic head groups, where they play a significant role in modifying the surface behaviour [13], [14]. The accumulation of surfactant molecules at the water/oil interface is responsible for the reduction of IFT between the two phases and thus, enhances the oil displacement. The surfactant concentration limit that is required to initiate the formation of micelles is known as the critical micelle concentration (CMC). The CMC is an important aspect to study where at a concentration above the CMC’s value, the adsorption of the surfactant at the interface becomes insignificant. This indicates that the optimum reduction of surface or interfacial tension has been achieved [11], [15]. Therefore, the selected surfactant concentration should be always above the CMC to ensure that formation of micelles, demonstrating an adequate concentration has been attained to obtain maximum efficiency in reducing IFT [16].
Several oil reservoirs have been reported to have a relatively high temperature (above 100 °C) with high salinity conditions. However, most of the surfactant flooding research has been rarely conducted in such a high temperature and salinity environment. These harsh conditions affect pronouncedly the compatibility and thermal stability of surfactants and pose a challenge for surfactants to sustain ultralow IFT [17], [18], [19]. In a solid/liquid interface, surfactant molecules naturally tend to transfer from the bulk solution and distribute at the interface. The phenomenon of adsorption takes place due to the interactions that arise between the surfactant molecules and the rock surface during surfactant flooding [20], [21]. It involves electrostatic interactions, chemical interactions, hydrophobic bonding, and hydrogen bonding [22], [23]. Surfactant adsorption during the surfactant flooding process is the most critical problem that can influence the success or failure of this process [24]. Adsorption represents a loss of a chemical agent from solution, and consequently, a net reduction in the surfactant concentration which leads to an inefficient reduction of IFT. The efficiency of surfactant flooding in harsh reservoir conditions will be significantly diminished not only in technical aspects but also in terms of economics. The lower the surfactant adsorption is, the smaller the amount of required chemical agent is for injection, and the lower the cost is [25]. Surfactant adsorption has been continuously studied before the implementation of surfactant flooding at reservoir conditions. Many types of surfactants are evaluated using static and dynamic adsorption tests to assess their adsorption behaviour when mixed with the reservoir rock in practical reservoir conditions. Several adsorption studies were conducted on sand reservoir rocks with inconsistent outcomes [16], [22], [26], [27], [28], [29], [30], [31], [32], [33]. However, exploring the adsorption mechanism in harsh reservoir conditions has not been conducted comprehensively. Hence, the efforts of this study attempted to address the adsorption behaviour of two dissimilar surfactants onto a sand rock surface, where the outcomes of this work are expected to improve the understanding of the surfactant adsorption behaviour in harsh reservoir conditions.
The experimental adsorption data can be interpreted by generating the adsorption isotherm which can be obtained by plotting the adsorbed surfactant values versus surfactant concentration [21], [34]. The adsorption isotherm is commonly fitted to equilibrium adsorption models, which are mathematical expressions developed to describe the equilibrium relationships between the adsorbate and adsorbent. This provides an insight into the adsorption mechanism with its thermodynamic assumptions and physicochemical parameters [35], [36]. Numerous two- and three-parameter adsorption isotherm models are known in the literature; such as Langmuir, Freundlich, Sips, Temkin, and Toth, where they have been formulated to examine the surface properties and the degree of affinity of the adsorbents [37], [38], [39], [40]. For instance, Saxena et al [41] discussed the adsorption behaviour of an anionic surfactant on sandstone, carbonate, and bentonite. They analysed their laboratory data by mathematical fitting with adsorption isotherm models (Langmuir, Freundlich, Temkin, and Redlich-Peterson). They concluded that the adsorption pattern for the surfactant-rock system was best clarified by Langmuir adsorption isotherm along with the Redlich-Peterson model which supports the Langmuir isotherm model for the monolayer adsorption behaviour. The same conclusion was made by Bera et al [42]. Ahmadi et al [43] studied the adsorption behaviour for a natural nonionic surfactant using both static and dynamic tests on shale-sandstone samples. They concluded that the Langmuir and Temkin models were not suitable for predicting the surfactant adsorption behaviour. On the other hand, it has emerged that the Freundlich model has a more permissible fit for the adsorption equilibrium data, which indicated the heterogeneity of the sorbent surface. In the same context, Arabloo et al [22] and Barati-Harooni [44] used a variety of models to represent the adsorption behaviour of a natural nonionic surfactant on sandstone, where they found that the Jovanovic two-parameter and Brouers–Sotolongo three-parameter models were the best between the other models to describe the equilibrium adsorption data. Therefore, the exploitation of the equilibrium isotherm models is very essential, which can provide a comprehensive understanding of the adsorption mechanism and contribute to optimizing the adsorption of surfactants in the design of the surfactant slug.
In chemical enhanced oil recovery, the utilization of surfactant mixtures is commonly preferred in practical applications for their superior performance as it improves the single components system significantly [45], [46]. Typically, the measurement of adsorption equilibrium data is required before the design of the injected surfactant slug. This type of data is often available and can be obtained easily. However, the measurement of adsorption equilibrium data for a mixed surfactant system is not commonly available in the literature. Moreover, it’s also experimentally challenging in terms of laboratory measurements. Consequently, the use of the available theoretical models to predict the surfactant mixture’s adsorption behaviour is a recommended practice. Over the years, several theoretical models have been developed to provide the behaviour of predicted mixtures by the exploitation of the individual components’ adsorption data. Among these models are the Langmuir model, the ideal adsorbed solution theory (IAST), molecular simulations two-dimensional equations of state (2D EOS) and Discrete Fourier transform (DFT) [47]. The Langmuir adsorption isotherm has been utilised extensively to model the adsorption of individual surfactants. The extended Langmuir (EL) model was employed in most of the prediction studies of the mixture’s adsorption using the Langmuir parameters and from the individual components system [48], [49], [50]. However, this technique is not capable of providing precise predictions in a binary system, due to the fact that competitive adsorption between the adsorbate components is not represented, however, it may be considered an adsorption-controlling factor. Also, the Langmuir assumption of ideal mixing in the mixed surfactant monolayer doesn’t represent the nonideal synergistic behaviour of the mixed surfactant monolayer which is generally observed experimentally [51], [52]. In this study, the modified extended Langmuir (MEL) model which includes the fractional surface coverage was used to predict the adsorption behaviour of two individual surfactants in a mixed binary system.
On the other hand, reliable computational prediction methods have been widely applied such as an artificial neural network (ANN) which has gained much interest in providing fast prediction efficiency and reliability [53], [54]. ANN offers many advantages over traditional mathematical models such as; requiring less time for the model development, avoiding extensive experimental work to formulate a non-linear relationship and the ability to learning complex relationships regardless of requiring to understand the model structure [55]. In the past decades, ANN techniques have been extensively implemented for solving problems and for prediction tasks in the petroleum industry [56]. For instance, Jiyuan et al [57] studied the natural gas/water interfacial tension (IFT) using ANN. They acquired experimental data of pure methane and synthetic natural gas from the literature to develop their model. They trained the model with the Levenberg–Marquardt back-propagation algorithm in the MATLAB neural network. The efficiency of the developed ANN model was compared to previous empirical correlations and they concluded that the IFT estimation accuracy can be enhanced essentially using the ANN model. The prediction of reservoir oil production performance [58], the prediction of ultimate recovery factor by steam-assisted gravity drainage (SAGD) [59], the forecast of horizontal wells productivity [60], and the prediction of waterflooding performance in heavy oil reservoirs [61] are other examples of petroleum application studies conducted using this powerful tool. ANN has been also utilised in the chemical EOR studies such as; surfactant–polymer (SP) flooding performance [53], [62], curing of polymer flooding [63], and the formation and stability of oil/water emulsion [64]. ANN has been also used in different adsorption studies in general [65] and in the case of surfactants in particular. Özdemir et al [66] used the artificial neural network model to predict the adsorption behaviour of sodium dodecyl-benzene sulfonate (SDBS) onto Polyaniline (PANI) at different operating variables. A back-propagation feed-forward network with two hidden layers was developed using experimental data from batch experiments. It was concluded in their study that the ANN model was able to provide more sufficient efficiency for the prediction of the effects of experimental conditions on the adsorption of SDBS onto PANI. To sum up, it can be understood that ANN is a very useful tool and can provide a great advantage of prediction capability and accuracy. However, to the best of our knowledge, ANN was not used before for the prediction of surfactant adsorption for EOR application.
In the present work, a comprehensive study on the adsorption behaviour of two individual surfactants APG and AEC on the sand rock surface in harsh reservoir conditions was conducted. The adsorption behaviour of the studied surfactants was analysed using laboratory experiments (surface tension and static adsorption). The adsorption isotherms were after that fitted to four equilibrium adsorption models (Langmuir, Freundlich, Sips, and Temkin) to provide further understanding of the adsorption behaviour. In this context, the theoretical concentration of the surfactants required to cover the rock surface as a monolayer was measured through computational chemistry to support the modelling findings. Subsequently, the behaviour of APG and AEC in binary mixture systems has been investigated using the MEL model to explain the behaviour of the (APG/AEC) binary mixture at different mixing ratios. The final step of this work was to develop an ANN model for predicting the adsorption uptakes of APG and AEC at different temperatures. This study is significant as it presents an extensive understanding of the adsorption behaviour of surfactants in harsh reservoir conditions. The findings from the experimental work can provide valuable insights while the comprehensive modelling, simulation, and prediction analyses would reveal some interesting clarifications on the surfactant adsorption behaviour onto a sand rock. Such an integrated piece of work can provide crucial information for the design of surfactant flooding slug especially in harsh reservoir conditions. Findings elucidated in this paper offer a great contribution to the research community by minimizing the experimental time and operating cost of future studies in the area of surfactant flooding.
2. Materials
Two different surfactants were used in this work, the Alkyl polyglucoside (nonionic) (51.5% active content) and it abbreviated as APG, and Alkyl Ether Carboxylate (anionic) (45% active content) and it is referred in this study as AEC. Both surfactants APG and AEC were supplied by BASF Company. The general chemical structure of each surfactant is described in Fig. 1 APG and AEC were used directly as they were received, and all the samples were freshly prepared before the experiment. The study was chosen to be conducted for a Malaysian field with harsh reservoir conditions (106 ˚C as a reservoir temperature and 32,000 ppm as injection water salinity). Both surfactants were tested for their compatibility and thermal stability prior to conducting the experiment and they were proven to be compatible with brine and thermally stable at the test temperature during the experiment time. Synthetic rock samples were selected to be used in this study due to the rock composition matching with this Malaysian field. The samples were obtained from PETRONAS Research Sdn. Bhd. (PRSB).
Fig. 1.

The general chemical structure of (a) APG and (b) AEC. Grey: C; white: H; green: O; purple: Na. (For interpretation of the references to colour in this figure legend, the reader is referred to the Web version of this article.)
3. Rock characterization
The synthetic core samples were ground and sieved to obtain a homogeneous powder quantity. The size of the grains ranged from 300 to 500 μm. The crushed rock samples were analysed using X-Ray Diffractometer (XRD). XRD of the crushed rock was recorded using (X'Pert3 Powder, Malvern Panalytical) for a wide range of Bragg angle (5◦ ≤ 2θ ≤ 90◦). The X-ray diffractogram of the crushed rock powder sample is demonstrated in the supplementary material (Appendix I). The peaks were analysed to obtain the rock composition using the Joint Committee on Powder Diffraction Standards (JCPDS) database. Three main peaks were observed at 20.84°, 26.63°, and 50.12°, then they were compared to JCPDS record which indicated the high quartz presence in the sample. The other minor peaks indicated the low quantity presence of quartz, kaolinite, illite, and Illite-Smectite [67], [68]. A semi-quantitative mineral composition of the crushed rock is depicted in Table 1 . Specific surface area of the crushed rock was achieved by nitrogen physisorption using Micromentics ASAP 2020. The specific surface area was determined using the multipoint Brunauer-Emmet-Teller (BET) method and it indicated the value of 2.4 m2/g.
Table 1.
The semi-quantitative mineral composition determined by XRD for the crushed rock sample.
| Quartz | 90 wt.% |
| Kaolinite | 5 wt.% |
| Illite | 3 wt.% |
| Illite-Smectite | 2 wt.% |
4. Experimental section
4.1. Critical micelle concentration (CMC) measurement
Generally, there are several methods to measure CMC; in this work pendant drop tensiometry was selected. It is considered the simplest method and most versatile. The IFT 700 pendant drop tensiometer manufactured by Vinci Technologies is demonstrated in the supplementary material (Appendix I). It was used to evaluate the surface tension behaviour of APG and AEC at 106 °C. The solution samples were loaded in the equipment and the measurements were simply conducted by suspending a fluid droplet from a needle. A picture of the droplet was taken by a mounted camera and then analysed by the system software [69], [70]. The surface tension value was determined from the Laplace–Young equation (Eq.1) based on the complete shape of the droplet.
| (1) |
Where Δp is the Laplace pressure difference across the interface, r1 and r2 are the principal radii of surface curvature, σ is the surface tension [69]. The CMC value is obtained from a conventional plot of the surface tension versus the surfactant concentration. The CMC corresponds to the intersection that occurs between the two regression lines fitted on the upper and lower regions of surface tension values of the curve, as seen in Fig. 3. Each CMC measurement was repeated several times, with a reading taken 10 times for each sample and then an average value was reported. The error of the CMC measurements is less than 3% of measured CMC [71], [72].
Fig. 3.

Surface tension of APG and AEC as a function of the surfactant concentration at 106 °C. (For interpretation of the references to colour in this figure legend, the reader is referred to the Web version of this article.)
4.2. Static adsorption
Adsorption isotherm data of APG and AEC was obtained using a static surfactant adsorption experiment. The test was conducted to investigate the adsorption behaviour of APG and AEC on the crushed rock surface. Static adsorption experiments were carried out by allowing the surfactant solution in various concentrations (0.1 wt.%, 0.2 wt.%, 0.4 wt.%, 0.6 wt.%, 0.8 wt.%, 1 wt.%) to reach equilibrium with a precisely weighted amount of crushed rock. The crushed rock and the surfactant solution were mixed in a glass bottle in 1/5 solid/liquid ratio (4 g of crushed rock and 20 mL of surfactant solution) [43]. The samples were aged in the oven at 106 °C for 24 h, which is sufficient time to achieve adsorption equilibrium [21], [73], [74]. Static adsorption isotherms were obtained by measuring surfactant concentration before and after equilibrating with the crushed rock. When the equilibrium conditions were obtained, the surfactant solution was centrifuged in order to remove any remaining crushed rock. The samples were centrifuged for 30 min at 40000 rpm. The supernatant liquid was separated and then analysed using HPLC to determine the remaining surfactant concentration after the adsorption stage. Surfactant adsorption was determined using the following equation (Eq. (2)):
| (2) |
Where: is the amount of surfactant adsorbed on the rock surface (mg/g), C° and C are the concentrations of the surfactant before and after adsorption (mg/L), respectively. Vs is the volume of the surfactant solution tested (mL), and M is the mass of the used crushed core (g) [75], [76].
4.3. Surfactant concentration determination (HPLC)
The remaining surfactant concentration of APG and AEC in the aqueous phase after adsorption on the rock surface was determined using Agilent 1200 series high-performance liquid chromatography (HPLC). HPLC system was connected to the Evaporative Light Scattering Detector (ELSD) which is a universal detector that is used for the majority of surfactants [77], [78]. The Thermo Scientific acclaim surfactant plus column (Dionex bonded silica (3 μ, 3.0 × 150 nm)) was used for the analysis in this study with high sensitivity and high productivity [79], [80]. An example of the corresponding peaks of APG and AEC in the obtained chromatogram from HPLC are demonstrated in the supplementary material (Appendix I). Peaks with 16.343 and 24.968 min retention time were used to calculate the concentration of APG and AEC surfactants, respectively. The final concentration of APG and AEC in the aqueous phase after performing the adsorption experiments was measured using a predetermined calibration curve that has been set for each surfactant. The HPLC method provided good calibration curves for each surfactant which ensured obtaining accurate surfactant concentration determination. Each concentration measurement using HPLC was repeated twice to examine the repeatability of the results and no significant difference was observed between the values. The experimental uncertainty in the measurements using the HPLC method was approximately ± 0.01 wt.%. The method details, the process conditions, the detailed mobile phase gradients, and the calibration curves were explained in detail in our previous study [81].
5. Equilibrium adsorption models
Based on the obtained static adsorption data, the adsorption isotherm data were fitted to equilibrium adsorption models for further analysis. Over the years, different equilibrium isotherm models (two-parameter and three-parameter equilibrium isotherm models) are used to describe the adsorption behaviours of liquid solutions on solid surfaces [35], [82]. Langmuir and Freundlich’s models are considered the most common isotherms used to describe the adsorption of surfactants on the solid surfaces. Another two isotherms namely; Sips and Temkin models are considered in this study to describe the experimental adsorption data and discover the best-fitted model for APG and AEC adsorption. These models were selected to provide a further understanding of the adsorption behaviour of APG and AEC on the rock surface.
5.1. Langmuir model
Langmuir isotherm model is an empirical model which was proposed based on the kinetic principle, that adsorption and desorption rates are equal and maintained at zero rate of accumulation when equilibrium conditions are reached [51]. This model has been conventionally used to demonstrate the performance of different bio-sorbents [35]. The Langmuir adsorption isotherm assumes monolayer adsorption where adsorption takes place only at specific homogeneous sites with no lateral interaction between the adsorbed molecules. Graphically, it is characterized as an equilibrium saturation point where once a molecule occupies a site, no further adsorption can take place [82]. Langmuir isotherm relates the amount of the surfactant adsorbed on the rock surface to the equilibrium concentration and it’s applicable for monolayer adsorption due to assuming finite (fixed) identical sites (homogeneous surface) [83]. The mathematical expression of the Langmuir isotherm model was developed by Irving Langmuir [84] in 1916 and is expressed in this nonlinear form (Eq. (3)) as follows:
| (3) |
Where is the surfactant amount adsorbed (mg/g); is the maximum surfactant adsorbed amount (mg/g); is the Langmuir equilibrium constant (L/mg); is the equilibrium aqueous concentration (mg/L). This equation is rearranged into the following linearized form (Eq. (4)):
| (4) |
By plotting of versus , the intercept and the slope correspond to and , respectively. Hence, and are easily calculated from the intercept and the slope accordingly [82].
5.2. Freundlich model
Freundlich isotherm model is the earliest known relationship describing the non-ideal and reversible adsorption. Unlike the Langmuir isotherm model, the Freundlich isotherm model is not limited to the monolayer formation, it can be applied to multilayer adsorption, with the assumption of non-uniform distribution of adsorption heat and affinities on a heterogeneous surface [35]. In other words, the Freundlich isotherm assumes that adsorption occurs by multilayer sorption on a heterogeneous surface [83]. Freundlich isotherm model expression defines the heterogeneity of the surface as well as the exponential distribution of the active sites and the active sites energies and its mathematical expression can be presented as (Eq. (5)):
| (5) |
Where is the Freundlich adsorption constant (L/mg) which is related to the adsorption capacity and is an empirical constant which is related to the strength of the adsorption [85]. This equation is linearized into the equation (Eq. (6)) by taking logarithm:
| (6) |
From the plot against , the slope and the intercept are and , respectively. Therefore, and n can be readily determined [82].
5.3. Sips model
Sips isotherm model is a combined form of both Langmuir and Freundlich isotherm models which is deduced for predicting the heterogeneity of the adsorption system as well as for circumventing the limitation of the increase of the adsorbate concentration associated with Freundlich isotherm model [85]. The Sips isotherm model is obtained by introducing a power-law expression of the Freundlich isotherm into the Langmuir isotherm [35]. At low adsorbate concentrations, the sips isotherm doesn’t follow Henry’s law as it reduces to Freundlich isotherm; meanwhile when the concentration is high, it predicts a monolayer adsorption characteristic of the Langmuir isotherm. The model parameters are ruled by operating conditions such as the alteration of concentration, pH and temperature [42]. The Sips isotherm model can be given by the following expression (Eq. (7)):
| (7) |
Where is Sips isotherm model exponent; is Sips isotherm model constant (L/mg); is Sips isotherm model constant (L/g). This sips equation is set to a linear form (Eq. (8)):
| (8) |
When is plotted against , the slope and the intercept are and , respectively. Hence, the parameters and can be calculated [35].
5.4. Temkin model
Temkin isotherm model was used initially for the description of the chemisorption system of hydrogen adsorption onto platinum electrodes within the acidic solutions [85]. The isotherm model contains a factor that takes the interaction between the adsorbent and the adsorbate into account, where the extremely large and low concentration values are ignored. Temkin model assumes that heat of adsorption as a function of temperature, of all molecules that present in the layer is reduced linearly rather than logarithmic with the increase of surface coverage [35], [43], [86]. The nonlinear form of Temkin’s isotherm is expressed as follows (Eq. (9)):
| (9) |
Where is the Temkin constant which is related to the heat of adsorption (J/mol); is the Temkin isotherm equilibrium binding constant (L/g); is temperature (K); is the universal gas constant (8.314 J/mol K) [35]. This equation is rearranged into the following linearized form (Eq. (10)):
| (10) |
By plotting of versus , the intercept and the slope correspond to and , respectively. Therefore, and are readily calculated from the intercept and the slope accordingly [35]. The linear form fitting of the aforementioned equilibrium isotherm models is demonstrated in the supplementary material (Appendix II).
6. Simulating the theoretical concentration of the surfactant in the monolayer
Calculating the required theoretical concentration of the surfactant to cover the rock surface was performed using the “Adsorption Locator” module implemented in the Materials studio v8 simulation package (Biovia, San Diego, USA). To figure out the adsorption configurations, it utilises the Metropolis Monte Carlo (MMC) method, which studies only the orientations and positions of the adsorbate molecules. These adsorbate molecules are treated as rigid bodies, postulating that they do not possess a high degree of torsional flexibility and, also, ignoring any internal degree of freedom they might have on the substrate surface. Practically, the candidate substrate-adsorbate configurations, in this module, are studied from a canonical ensemble in which the temperature and the loading of all adsorbates on the substrate are fixed. Since XRD results proved that the synthetic rock has 90% of its components silica, silica was selected as a model to represent the rock in this simulation.
7. Binary modelling prediction
7.1. Modified extended Langmuir (MEL) model
The Modified extended Langmuir (MEL) model is one of the best theoretical models utilised to predict the binary system adsorption. In binary mixtures, competitive adsorption is a controlling factor that usually takes place between the adsorbate species on the solid surface. This phenomenon shows that the adsorption of both adsorbates on the solid surface occurs with certain fractional loadings [47]. A revisited mathematical equation was proposed by Kurniawan et al. [51] for and for binary adsorption predictions as shown in the following equations (Eqs. 11–13):
| (11) |
| (12) |
| (13) |
Where and are constants that represent the loading fractions of each adsorbate component. By following this method, it can be obviously understood that the adsorbent rock is covered by the two adsorbates with certain loadings. Therefore, this technique allows studying the binary mixture at different initial compositions as well as the intensity effect. Furthermore, the competitive adsorption that generally occurs between the adsorbate species when present in a mixture is included in this mathematic relationship. Hence, the adsorption affinity values for each adsorbate in the mixture are expected to be lower than when present individually. This is attributed to the weakening of the adsorption potential on the surface by the competition of each adsorbate for the adsorption sites. The Langmuir constants for the single components are used in (Eqs. (14), (15)) to predict the adsorbed amount for a mixture.
| (14) |
| (15) |
The Modified model was applied on the single adsorption data of APG and AEC to predict the mixture (APG/AEC) behaviour. The mixture’s behaviour was predicted at different mixing ratios (5/5, 4/6, 6/4, 3/7, 7/3, 2/8, 8/2, 1/9 and 9/1) at the same experimental condition used in the single surfactants. The results will explain the adsorption behaviour of each surfactant when present in a mixture.
8. Selectivity analysis
The selection of a suitable surfactant that provides low adsorption capacity is a challenging task, especially when dealing with surfactant mixtures. The most known criteria for evaluating the adsorption selection of different surfactants is the equilibrium selectivity. In order to determine the equilibrium selectivity, the equilibrium isotherms for all individual surfactants within the mixture in the experimental range of operation for the adsorption process must be taken into account [87]. The equilibrium selectivity is used in this study to evaluate the adsorption selectivity of APG and AEC within the mixture after mixing and it can be measured using the following equation (Eq. (16)):
| (16) |
Where and are the amounts of APG and AEC adsorbed on the rock surface, respectively, that are calculated directly from pure experimental data [47].
9. Artificial neural Networks (ANN)
Artificial Neural Network (ANN) is known as a computational technique that is created via imitation of learning skills and processing methods of the human brain and its biological cells. Essentially, the structure of ANN is composed of artificial neurons which are organized in a certain number of layers that are connected to each other by a linking system known as connections or nodes [88]. ANN structure also consists of biases allocated to the neurons, the weights associated with neuron links and the transfer function (activating) with the existence of a bias value in order to turn inputs into a unified output. The neurons can be trained in a way that they can perform a specific task by adjusting the values of the nodes, allowing the information path to be recognized [89], [90]. In a three-layer network, the neurons of the input layer are connected with the other neurons in the hidden layer via specific weights and that determines the contribution of each individual neuron in the input layer to the other neuron in the hidden layer [90]. The number (size) of these hidden layers and connecting nodes must be determined in order to optimize the capacities and abilities of the network for any set of data. Typically, connecting nodes have varying values, making certain nodes more important than the others. Therefore, if a certain node is connected to different inputs, the system is capable of deciding the node that is more important than the other according to the connection weights [47].
ANN consists of various architectures; such as the feed-forward network, feedback network, and multilayer feed-forward or (MFF) network. However, the most commonly used neural network is the multilayer feed-forward neural network where the information is transferred from the input layers to the output layers which does the final processing and outputs of the data via hidden layers [47], [88]. A three-layered MFF network containing an input layer, hidden layer and output layer has demonstrated the ability to approximate all types of functions, regardless of their complexities. The standard transfer function used between the neurons is the S-shaped differentiable function known as the sigmoid function, which has similarities to the step function. One of the advantages of the sigmoid function is the ease of finding its derivative. In a feed-forward ANN, the inputs are nonlinear functions that can be represented by neurons which are connected in a manner that allows for only a forward flow (from inputs to outputs) [47], [57]. ANN modelling adheres to a three-step system; starting with the collection of the inputs (independent variables) and the outputs (dependent variables). Followed by selecting the neural network design or architecture. The last step includes separating the data into three subsets: training, validation, and testing, in addition to choosing the number of hidden layers as well as the number of neurons selected in them [59].
The training step is used for updating the network weights and biases. The use of some experimental data is essential to adjust the weight of the nodes as well as the biases of every node. This will contribute in generating the demanded output activation based on each set of inputs [66]. The ANN error is calculated by the comparison of the outputs determined from the network with the desired outputs. In the beginning, the calculated error reflects a significant difference between the two calculated outputs. The system then minimizes the error by making node weight adjustments. This process is performed by the use of the back-propagation method which adjusts the node weights based on the information given from the output nodes to the hidden layers [47], [91]. The validation step is applied to optimize network performance by controlling the number of epochs (one training cycle). Epochs demonstrate the iteration process used during the training process, where this validation step ensures obtaining minimal errors of the system [90]. Lastly, the testing set of data is utilised to guarantee the high accuracy of the trained neural network on predicting the unavailable data [60]. ANN training approaches can follow either a supervised or unsupervised pattern recognition process. Supervised training is the most common learning algorithm. This type of ANN is excellent in prediction and classification tasks. Within this training method, a correct output is given for each input model externally, and these correct outputs are assigned as targets for the ANN. Then the algorithm utilises a gradient descent method that attempts to obtain the global lowest error which is created by inputs, weights, biases and transfer functions [89]. However, the network in the unsupervised training process is provided with correct outputs whereas desired targets do not exist. The process is known as the self-adaptation system which the system itself must decide which features can be used to group the input data [88], [92]. In this study, the supervised training process was applied. The purpose of the network training is minimizing the error or the sum of squares associated with the produced model that was generated for a set of experimental data.
The feed-forward ANN architecture was selected for this study with two hidden layers which consist of 4 neurons for surfactant adsorption prediction. Initial concentrations of APG and AEC and temperature were the input variables, while the adsorption uptakes of APG and AEC at different temperature scenarios are the output variables. In this work, the MATLAB program has been used for the prediction of adsorption uptake values and the neural network function followed in this study is described in Fig. 2 . The experimental data were divided into three sets, where about 70% of this data was used is the training step. TrainLm was used as a training function in this step. Trainlm is a commonly used training function as it updates the results according to the Levenberg–Marquardt optimization method which is popularly used in the least-squares curve-fitting problem. The learning process of the network converging to the targeted error for APG and AEC, and the regression plot showing the regression coefficient of the experimental data and ANN are demonstrated in the supplementary material (Appendix III). The MATLAB code used is illustrated in the supplementary material (Appendix IV).
Fig. 2.
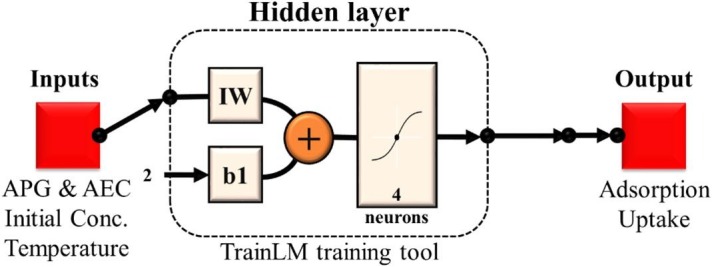
ANN feed-forward function design generated from MATLAB. (For interpretation of the references to colour in this figure legend, the reader is referred to the Web version of this article.)
10. Results and discussion
10.1. Critical micelle concentration (CMC)
The CMC values of APG and AEC at 106 °C were determined in order to investigate the surfactant concentration region containing optimum surface activity. In order to obtain the CMC value, the surface tension data were drawn against the surfactant concentration and the value of CMC was determined from the breakpoint of the curves as shown in Fig. 3 . When the surfactant concentration decreased sharply to a certain value, an approximately constant trend of surface tension was observed when the surfactant concentration was further increased. The turning point indicates the formation of micelles as observed from the discontinuity of the curve [93]. The CMC values of APG and AEC were found to be approximately 0.17 wt.% and 0.11 wt.%, respectively. The surfactant concentration of APG and AEC used in the adsorption experiment was selected above CMC, where the increasing of surfactant concentration above the CMC results only in more formation of micelles [94], [95].
10.2. Adsorption isotherm
The investigation of surfactant adsorption equilibrium data is very essential for evaluating the possibility of implementing surfactant flooding technically and economically. The analysis of the adsorption data can provide the maximum surfactant adsorbed per unit area or mass of the rock as well as the adsorption isotherm. The adsorption isotherm is known as a graphical representation of the relationship between the surfactant adsorbed amount per unit mass or area of the rock and the amount of the remaining surfactant concentration at equilibrium [43], [86]. The experimental adsorption data were plotted for APG and AEC showing the adsorption density variations against the increase of surfactant concentration as demonstrated in Fig. 4 . It can be seen that the adsorption of APG and AEC was increasing gradually as concentration increases. However, it was clearly observed that the adsorption capacity of APG was significantly high as compared with the adsorption capacity of AEC. The highest adsorption capacity of AEC was around 2 mg/g at 1 wt.%, meanwhile, it was greater in the case of APG, specifically 5.6 mg/g at 1 wt.%. This interesting experimental finding can be attributed to the fact that anionic surfactants generally have lower adsorption on sand surfaces than nonionic surfactants, as previously speculated. The adsorption of surfactants on sand surfaces is strongly influenced by the surface charges. Both sand surface and anionic surfactants carry similar electrostatic surface charges (negative charge), hence, weak interactions take place due to a reduction in the electrostatic repulsive forces between anionic surfactants and the sand surface. Consequently, AEC adsorption capacity on the sand surface was not significantly high. Meanwhile, the adsorption of nonionic surfactants occurs on the sand surface due to weak hydrophobic and hydrogen bond interactions between the surfactant and the sand surface. Since nonionic surfactants carry no charge on their head group, they exhibit higher adsorption on the rock surface as compared with anionic surfactants. Therefore, the adsorption capacity of APG was considerably high [11], [20], [42]. The issue of electrostatic surface charge of sand or other types of rocks is not a fixed matter. Experience showed that these charges might be turned to the opposite or weakened close to neutral by surfactant exposure time. This issue has not been investigated in this study but might be the subject of futuristic investigation.
Fig. 4.

Adsorption isotherms of APG and AEC at 106 °C. (For interpretation of the references to colour in this figure legend, the reader is referred to the Web version of this article.)
10.3. Equilibrium adsorption models
The experimental adsorption data in this study for both surfactants APG and AEC were analysed by curve-fitting using Langmuir, Freundlich, Sips, and Temkin isotherm adsorption models that were discussed, previously, in this paper. The fitting of the isotherm models of APG and AEC adsorption experimental data at 106 °C is shown in Fig. 5 . The results showed a good agreement with most of the isotherm models. Table 2 summarizes the computed values of the corresponding parameters and correlation coefficients for each isotherm model. The values of the regression coefficient (R2) were used to select the best-fitting model to the experimental data. The Langmuir and Freundlich models, in general, showed good fitting for APG and AEC adsorption data on the sand rock surface. The Langmuir model showed better fitting for AEC than APG where the R2 of the model fitted to the adsorption isotherm was found to be 0.9931 and 0.9556, respectively. This observation indicates the formation of monolayer for both surfactants, but clearer in the case of AEC. This behaviour agrees with previous studies [85]. The separation factor for the Langmuir model (RL) was found to be 0.8091 and 0.4571 for APG and AEC, respectively. When RL is less than 1, it indicates that the adsorption is favourable for both surfactants. On the other hand, the Freundlich model showed lower R2 for APG (0.9302) as compared to AEC (0.9728) indicating the formation of multilayer adsorption as well and it’s more dominate for AEC. Freundlich model also indicated that the adsorption is heterogeneous with non-uniform surfactant molecules distribution on the rock surface [21]. Due to having heterogeneous adsorption, it’s believed that there is agglomeration coverage of the molecules at multilayer coverage/geometry sand surface. It can be also indicated that the constant n value in the Freundlich model is higher than 1.0, which supports physical adsorption on the rock surface, and it’s slightly higher for AEC as compared with APG. The sips model has a good fitting for APG and AEC with the adsorption isotherm as shown in Table 2, and the n value is higher than 1.0, which supports the adsorption heterogeneity verdict. Taking into consideration the overall value of R2, it can be observed clearly that the best model that can present the surfactant adsorption is sips model where it can be ascribed to that surfactants are adsorbed heterogeneously on the rock surface [85]. These results are in line with Langmuir and Freundlich models where they both indicated monolayer and multilayer adsorption, respectively, occur. In addition, the Temkin model displayed good R2 for both APG and AEC supporting the pore filling effect. It also indicates that the adsorption process is exothermic, where the heat of adsorption of the surfactants molecules decreases linearly with the increase of adsorption [35]. A schematic diagram of monolayer and multilayer adsorption for APG and AEC surfactant molecules is described in Fig. 6 .
Fig. 5.

The adsorption equilibrium isotherm models for a) APG and b) AEC onto the crushed rock at 106 °C. (For interpretation of the references to colour in this figure legend, the reader is referred to the Web version of this article.)
Table 2.
Isotherm constants and parameters measures of the equilibrium adsorption models for APG and AEC.
| Surfactant |
APG |
AEC |
||||||
|---|---|---|---|---|---|---|---|---|
| Isotherm model | Parameters | Parameters | ||||||
| Langmuir | R2 | Qm | K | RL | R2 | Qm | K | RL |
| 0.9556 | 7.6628 | 3.0278 | 0.8091 | 0.9931 | 0.2812 | 13.4595 | 0.4571 | |
| Freundlich | R2 | n | K | R2 | n | K | ||
| 0.9302 | 1.5941 | 2.2766 | 0.9728 | 3.1446 | 1.6211 | |||
| Sips | R2 | Qm | K | n | R2 | Qm | K | n |
| 0.9915 | 15.4321 | 0.6353 | 0.6 | 0.9926 | 27.9329 | 0.0728 | 0.8 | |
| Temkin | R2 | Qm | A | B | R2 | Qm | A | B |
| 0.9847 | 1.2024 | 24.9518 | 17.2099 | 0.9936 | 0.5868 | 32.5891 | 56.0174 | |
Fig. 6.

Schematic diagram representing (a) monolayer, (b) multilayer and (c) mixture of monolayer and multilayer adsorption of the surfactant molecules on the rock surface. (For interpretation of the references to colour in this figure legend, the reader is referred to the Web version of this article.)
10.4. Simulating the adsorbed surfactants as monolayer at rock surface
Thanks to the computational chemistry that opened the horizon to justify and describe the adsorption phenomenon which is beyond our observation and offer us a deeper understanding of the adsorption route. The required concentration of the utilised surfactants in this work; namely APG and AEC, that needed to cover the surface rock (Fig. 7 ) as a monolayer was simulated and calculated using Adsorption Locator module (check Appendix V in the supplementary information for the calculation method). It was found experimentally that the APG and AEC adsorption was increasing with the increase of surfactant concentration in the aqueous phase, where the adsorption of APG and AEC surfactants at the lowest studied concentrations was found 0.46 and 0.25 mg/m2 (check Appendix V in supplementary information for the calculation method) and kept increasing with the increase of surfactant concentration in the aqueous solution. Whereas theoretically, it was found that the surfactant adsorption should reach the saturation point when APG and AEC concentrations in the aqueous phase are 0.057 and 0.044 mg/m2, respectively. The significant difference between the experimental and theoretical values for APG and AEC can be attributed to the adsorption of surfactants as a multilayer, which is in remarkable agreement with the modelling findings in this study.
Fig. 7.

(a) upper and (b) side view of the simulated rock surface. Yellow: Si; red: O. (For interpretation of the references to colour in this figure legend, the reader is referred to the Web version of this article.)
10.5. Modified extended Langmuir (MEL) model
The modified extended Langmuir (MEL) model was used in this section to demonstrate the behaviour of a binary mixture at different mixing ratios. The model was used to predict the adsorption behaviour of APG and AEC when mixed in a mixture (APG/AEC). The results of the APG/AEC mixture’s adsorption behaviour at a wide range of mixing ratios (5/5, 4/6, 6/4, 3/7, 7/3, 2/8, 8/2, 1/9 and 9/1) at 106 °C are described in Fig. 8 . The MEL model showed that at high concentration of APG in the mixture (90% APG and 10% AEC), there’s no adsorption potential of AEC and only APG contributes in the total adsorption of the mixture. As the AEC concentration increases in the mixture it shows affinity to adsorb and this can be clearly observed in the APG/AEC mixture (8/2 and 7/3). Whereas, at the ratio 6/4 of the APG/AEC mixture, the adsorbed amount of AEC on the rock surface was higher as compared to APG even though the concentration of APG was higher in the mixture. On the other hand, the adsorption of APG doesn’t visibly exist in the mixing ratios (1/9, 2/8 and 3/7) of the APG/AEC mixture. However, the APG surfactant begins to adsorb in the 4/6 APG/AEC mixture, but it’s less than the adsorption range of 0.3 mg/g. The 5/5 mixing ratio of APG/AEC shows that AEC contributes in around 80% of the total adsorption of the mixture, whereas, APG exhibited approximately 20% of coverage in the mixture when mixed with AEC in equal concentration. Even though the experimental adsorption data showed that APG adsorbs much greater than AEC when introduced individually, AEC has more affinity to adsorb in competition with APG to occupy the rock surface when they were applied in a mixture.
Fig. 8.


Binary APG/AEC mixtures predicted by using the MEL model at 106 °C. (For interpretation of the references to colour in this figure legend, the reader is referred to the Web version of this article.)
These observations show that the adsorption behaviour of APG (nonionic) and AEC (anionic) in the mixture is different from their behaviour when they were introduced individually. These findings are in good agreement with a reported study by Gao et al [96] on the adsorption of anionic-nonionic surfactant mixture, where they examined the adsorption behaviour of individual surfactants within a mixture on negatively charged silica gel. They observed that in a mixture of anionic-nonionic surfactants, the adsorption of the nonionic surfactant decreases gradually with the increase of the anionic surfactant concentration. They also highlighted that even in the case of having the same concentration of the two surfactants, the anionic surfactant’s adsorption was higher. These outcomes were ascribed to the interactions between nonionic and anionic surfactants on the silica/solution interface and the competitive adsorption. This explanation is also in line with our previous partitioning study [81] where it was found that there are interactions between APG and AEC in the APG/AEC mixture. Therefore, this clarifies that the presence of AEC in a mixture contributes in reducing the adsorption of APG and the predicted results from MEL model are in line with the experimental results in the literature.
10.6. Selectivity analysis
The ideal selectivity for the APG/AEC system as a function of surfactant concentration at 106 °C is described in Fig. 9 . The results indicated that the selectivity of APG/AEC increases with the increase inconcentration. The selectivity increases from below 2 initially to the range of 3 as surfactant concentration increases. The results of the selectivity analysis reflect that the individual surfactant APG can deliberate higher adsorption compared to AEC surfactant. However, this is demonstrated according to the individual experimental uptakes and not based on the practical configuration of the investigated surfactants. From what been said, and in terms of binary mixtures the situation can follow another trend, as reflected in the modified extended Langmuir (MEL) and the ANN modelling. The AEC bonding can infer a stronger bond if mixed with the APG surfactant at various concentrations. The presence of AEC in the mixture can block the active functional cations responsible for higher APG adsorption in the individual adsorption measurements [97], [98]. Furthermore, the mineralogical content of the investigated rock sample can play a dominant role in terms of active bonds and trap approach when the surfactants mixture was utilised. The existence of Smectite clay with its well-known three-layer crystalline structure (one alumina and two silica layers) [99] can illustrate better bonding with AEC as compared to the APG in case of mixture injection. On the other hand, the Illite clay, (K,H3O)(Al,Mg,Fe)2(Si,Al)4O10[(OH)2,(H2O)] with its layered alumino-silicate structure [100] can interfere the adsorption of APG effectively with the existence of AEC at considerable composition. This can be supported by practical and experimental mixtures adsorption measurements in future studies, which is not in the scope of the current work. However, it is in the planned way forward investigation.
Fig. 9.

Selectivity analysis of APG and AEC on crushed rock at 106 °C. (For interpretation of the references to colour in this figure legend, the reader is referred to the Web version of this article.)
10.7. ANN model
The Efficiency of the ANN model was tested for modelling the adsorption behaviours of APG and AEC onto the crushed rock. The coefficient of determination R2 values were compared between the experimental adsorption data and the ANN predictive model to ensure that the ANN model represents the adsorption isotherm data. The values of R2 for the fitted data between the experimental adsorption and ANN model for APG and AEC are illustrated in Fig. 10 . It can be observed from the R2 values that the predicted data by the ANN model fits well the experimental data and the ANN model is efficient for explaining the adsorption behaviours of APG and AEC onto the crushed rock. R2 for APG and AEC were 0.9999 and 0.9953, respectively, indicating that the ANN model gives reliable predictions for estimating the adsorption behaviours of APG and AEC. Fig. 11 shows the matching between the experimental adsorption isotherms and ANN model predictions for APG and AEC on the crushed rock at 106 °C. It can be concluded that the ANN model is very accurate and therefore can be used for further simulation targets.
Fig. 10.

Comparison between experimental and ANN model predicted adsorption data for APG and AEC. (For interpretation of the references to colour in this figure legend, the reader is referred to the Web version of this article.)
Fig. 11.

Experimental adsorption isotherms with ANN model predictions for APG and AEC on the crushed rock at 106 °C. (For interpretation of the references to colour in this figure legend, the reader is referred to the Web version of this article.)
Most of the surfactant application in EOR was conducted at relatively low temperature conditions where high temperature conditions are not generally suitable for the surfactant flooding implementation. Sheng [101] explained that most of the surfactants flooding studies were performed under the limit of 93.3 °C. However, many oil reservoirs have relatively high temperature conditions (above 100 °C), meanwhile, with the evolution of surfactant application in EOR, surfactants are still considered suitable candidates to provide good performance in high temperature conditions [19]. ANN can provide a great advantage to predict the adsorption behaviour of APG and AEC at different temperatures. The adsorption behaviour of APG and AEC was predicted in a range of temperatures (25 °C up to 150 °C) at the same surfactant concentration range used in the experimental work (0.1 wt.% up to 1 wt.%). This range was selected based on the temperature ranges of most of the oil reservoirs in the world [101], [102]. Fig. 12 shows the ANN prediction for the adsorption behaviour of APG and AEC at different temperatures. It can be observed that the increase in temperature leads to a considerable decrease in the adsorption values for both APG and AEC. The increase of temperature generally causes a considerable decrease in the adsorption values due to an increase in the kinetic energy of the species. Consequently, the entropy of the system increases, which leads to a decrease in the aggregate organization on the rock surface [20], [103], [104].
Fig. 12.

Predicted adsorption uptakes at different temperatures simulated by using the ANN model for a) APG and b) AEC on the crushed rock. (For interpretation of the references to colour in this figure legend, the reader is referred to the Web version of this article.)
Several researches explained the effect of temperature on surfactant adsorption. Zhong et al [29] studied the adsorption of different surfactant classifications and explained that adsorption is an exothermic process, showing that adsorption density at higher temperatures is reduced. Another reason is valid to explain this phenomenon, which is related to the adsorbent itself since the crushed rock used in this study is quartz dominated. Mehraban et al [105] reported the increase of the negative charges on the quartz surface at high temperature conditions. The increase of the negative charges causes a rise in the repulsive forces between the surfactant and the rock surface and it’s more obvious in the case of AEC (negatively charged), thus, leads to a reduction in the adsorption values. Bera et al [42] explained two reasons for the decrease of adsorption with respect to temperature increase. The first reason is attributed to the decrease in the diffusion rate of the surfactant across the external boundary layer and the rock interior pores which occurred from the decrease of the surfactant solution’s viscosity. The second reason is related to the equilibrium adsorption capacity of the sand particles which was influenced by temperature increase depending on the adsorption process which in this case exothermic. It can be concluded that the surfactant losses due to adsorption are less when surfactant flooding is applied at higher temperature conditions. This outcome encourages the implementation of surfactants at harsh reservoir conditions taking into account their compatibility and thermal stability to operate under these conditions.
11. Conclusion
This work provides an integrated study on the adsorption behaviour of two individual surfactants APG and AEC on the sand rock surface in harsh reservoir conditions. The experimental outcomes of this study had shown that the CMC values of APG and AEC were approximately 0.17 wt.% and 0.11 wt.%, respectively. The static adsorption experiments clearly showed that the adsorption capacity of APG was higher than the adsorption capacity of AEC. For the sake of comparison, the adsorption capacity of APG and AEC was around 5.6 mg/g and 2 mg/g, respectively at 1 wt.%. The experimental adsorption data for APG and AEC showed good fitting with Langmuir, Freundlich, Sips, and Temkin models, stating that the best model presenting the surfactant adsorption is the sips model with R2 (0.9915 and 0.9926, for APG and AEC respectively). It was specified that monolayer and multilayer adsorption occurred simultaneously on the rock surface. Moreover, indicated a heterogeneous adsorption system with non-uniform surfactant molecules distribution on the rock surface. To support these outcomes, the required theoretical concentration of APG and AEC to cover the rock surface as a monolayer indicated that the simulated adsorption values were significantly less than their values at the lowest experimentally studied concentrations. It was suggested that the difference between the simulation and experimental findings was attributed to the adsorption of APG and AEC as a multilayer which is in line with the modelling findings.
The adsorption behaviours of APG and AEC in a binary mixture were contradictory to their experimental individual behaviour. The MEL model predictions showed that AEC has more affinity to adsorb in competition with APG to occupy the rock surface when they were applied in a mixture. The presence of AEC in the mixture can block the active functional cations responsible for higher APG adsorption in the individual adsorption measurements. The developed ANN model was found quite accurate, where the predicted adsorption data showed a good fit with the individual experimental data of APG and AEC. The increase of temperature has led to a considerable decrease in the adsorption values for both APG and AEC due to an increase in the kinetic energy of the species causing a reduction in the aggregate spreading on the rock surface. The ANN model findings were in line with the reported experimental studies that addressed the effect of temperature on adsorption. The predicted adsorption trend at different temperatures raises the success potential of the implementation of surfactant flooding in harsh reservoir conditions.
The findings from the experimental work provided valuable insights while the comprehensive modelling, simulation, and prediction analyses revealed some interesting clarifications on the surfactant adsorption behaviour onto the sand rock. The uniquely integrated workflow pursued in this study can provide a useful contribution in examining, designing, and predicting the surfactant adsorption behaviour individually and in a binary mixture system, which can lead to proper designing of surfactant flooding at harsh reservoir conditions. Future investigation may cover a wider range of operating conditions, as well as checking the dynamic adsorption envelope.
Declaration of Competing Interest
The authors declare that they have no known competing financial interests or personal relationships that could have appeared to influence the work reported in this paper.
Acknowledgments
Authors would like to acknowledge Universiti Teknologi PETRONAS (UTP) for funding this work under Grant No. (015LC0-137). Special thanks and appreciation go to the Centre of Research in Enhanced Oil Recovery (COR-EOR) in UTP, for providing laboratory facilities and technical support.
Footnotes
Supplementary data to this article can be found online at https://doi.org/10.1016/j.cej.2020.127081.
Appendix A. Supplementary data
The following are the Supplementary data to this article:
References
- 1.Jeon P.R., Lee C.H. Effect of surfactants on CO2 solubility and reaction in CO2-brine-clay mineral systems during CO2-enhanced fossil fuel recovery. Chem. Eng. J. 2020;382 doi: 10.1016/j.cej.2019.123014. [DOI] [Google Scholar]
- 2.Bera A., Belhaj H. Application of nanotechnology by means of nanoparticles and nanodispersions in oil recovery - A comprehensive review. J. Nat. Gas Sci. Eng. 2016;34:1284–1309. doi: 10.1016/j.jngse.2016.08.023. [DOI] [Google Scholar]
- 3.Adil M., Lee K., Zaid H.M., Latiff N.R.A., Alnarabiji M.S. Experimental study on electromagnetic-assisted ZnO nanofluid flooding for enhanced oil recovery (EOR) PLoS One. 2018;13:1–18. doi: 10.1371/journal.pone.0193518. [DOI] [PMC free article] [PubMed] [Google Scholar]
- 4.Alnarabiji M.S., Yahya N., Nadeem S., Adil M., Baig M.K., Ben Ghanem O., Azizi K., Ahmed S., Maulianda B., Klemeš J.J., Elraies K.A. Nanofluid enhanced oil recovery using induced ZnO nanocrystals by electromagnetic energy: Viscosity increment. Fuel. 2018;233:632–643. doi: 10.1016/j.fuel.2018.06.068. [DOI] [Google Scholar]
- 5.Belhaj A.F., Elraies K.A., Janjuhah H.T., Tasfy S.F.H., Yahya N., Abdullah B., Umar A.A., Ben Ghanem O., Alnarabiji M.S. Electromagnetic waves-induced hydrophobic multiwalled carbon nanotubes for enhanced oil recovery. J. Pet. Explor. Prod. Technol. 2019;9:2667–2670. doi: 10.1007/s13202-019-0653-6. [DOI] [Google Scholar]
- 6.Wei B., Zhang X., Liu J., Xu X., Pu W., Bai M. Adsorptive behaviors of supercritical CO2 in tight porous media and triggered chemical reactions with rock minerals during CO2-EOR and -sequestration. Chem. Eng. J. 2020;381 doi: 10.1016/j.cej.2019.122577. [DOI] [Google Scholar]
- 7.Kingsly K., Henri K. COVID-19 and oil prices. SSRN. 2020 doi: 10.2139/ssrn.3555880. [DOI] [Google Scholar]
- 8.Belhaj H., Abukhalifeh H., Javid K. Miscible oil recovery utilizing N2 and/or HC gases in CO2 injection. J. Pet. Sci. Eng. 2013;111:144–152. doi: 10.1016/j.petrol.2013.08.030. [DOI] [Google Scholar]
- 9.Alnarabiji M.S., Yahya N., Shafie A., Solemani H., Chandran K., Bee S., Hamid A., Azizi K. The Influence of Hydrophobic Multiwall Carbon Nanotubes Concentration on Enhanced Oil Recovery. Procedia Eng. 2016;148:1137–1140. doi: 10.1016/j.proeng.2016.06.564. [DOI] [Google Scholar]
- 10.M.S. Alnarabiji, N. Yahya, S. Bee Abd Hamid, K. Azizi, A. Shafie, H. Solemani, Microwave Synthesis of ZnO Nanoparticles for Enhanced Oil Recovery, Adv. Mater. Res. 1024 (2014) 83–86. doi:10.4028/www.scientific.net/amr.1024.83.
- 11.Belhaj A.F., Elraies K.A., Mahmood S.M., Zulkifli N.N., Akbari S., Hussien O.S. The effect of surfactant concentration, salinity, temperature, and pH on surfactant adsorption for chemical enhanced oil recovery: a review. J. Pet. Explor. Prod. Technol. 2020;10:125–137. doi: 10.1007/s13202-019-0685-y. [DOI] [Google Scholar]
- 12.Shafie A., Yahya N., Kashif M., Zaid H.M., Soleimani H., Alnarabiji M.S. The Band Structures of Single-Walled Carbon Nanotubes and ZnO Nanoparticles Used for Oil Recovery in Water Flooding System. J. Nano Res. 2013;26:101–110. doi: 10.4028/www.scientific.net/jnanor.26.101. [DOI] [Google Scholar]
- 13.Bera A., Belhaj H. Ionic liquids as alternatives of surfactants in enhanced oil recovery—A state-of-the-art review. J. Mol. Liq. 2016;224:177–188. doi: 10.1016/j.molliq.2016.09.105. [DOI] [Google Scholar]
- 14.Shen T., Gao M. Gemini surfactant modified organo-clays for removal of organic pollutants from water: A review. Chem. Eng. J. 2019;375 doi: 10.1016/j.cej.2019.121910. [DOI] [Google Scholar]
- 15.Bera A., Mandal A., Belhaj H., Kumar T. Enhanced oil recovery by nonionic surfactants considering micellization, surface, and foaming properties. Pet. Sci. 2017;14:362–371. doi: 10.1007/s12182-017-0156-3. [DOI] [Google Scholar]
- 16.Curbelo F.D.S., Santanna V.C., Neto E.L.B., Dutra T.V., Dantas T.N.C., Neto A.A.D., Garnica A.I.C. Adsorption of nonionic surfactants in sandstones. Colloids Surfaces A Physicochem. Eng. Asp. 2007;293:1–4. doi: 10.1016/j.colsurfa.2006.06.038. [DOI] [Google Scholar]
- 17.Alnarabiji M.S., Husein M.M. Application of bare nanoparticle-based nanofluids in enhanced oil recovery. Fuel. 2020;267 doi: 10.1016/j.fuel.2020.117262. [DOI] [Google Scholar]
- 18.Yuan C.D., Pu W.F., Wang X.C., Sun L., Zhang Y.C., Cheng S. Effects of Interfacial Tension, Emulsification, and Surfactant Concentration on Oil Recovery in Surfactant Flooding Process for High Temperature and High Salinity Reservoirs. Energy and Fuels. 2015;29:6165–6176. doi: 10.1021/acs.energyfuels.5b01393. [DOI] [Google Scholar]
- 19.Puerto M., Hirasaki G.J., Miller C.A., Barnes J.R. Surfactant Systems for EOR in High-Temperature High-Salinity Environments. SPE J. 2010;17:11–19. doi: 10.2118/129675-PA. [DOI] [Google Scholar]
- 20.Paria S., Khilar K.C. A review on experimental studies of surfactant adsorption at the hydrophilic solid-water interface. Adv. Colloid Interface Sci. 2004;110:75–95. doi: 10.1016/j.cis.2004.03.001. [DOI] [PubMed] [Google Scholar]
- 21.Hanamertani A.S., Pilus R.M., Idris A.K., Irawan S., Tan I.M. Ionic liquids as a potential additive for reducing surfactant adsorption onto crushed Berea sandstone. J. Pet. Sci. Eng. 2017;162:480–490. doi: 10.1016/j.petrol.2017.09.077. [DOI] [Google Scholar]
- 22.Arabloo M., Ghazanfari M.H., Rashtchian D. Spotlight on kinetic and equilibrium adsorption of a new surfactant onto sandstone minerals: A comparative study. J. Taiwan Inst. Chem. Eng. 2015;50:12–23. doi: 10.1016/j.jtice.2014.12.012. [DOI] [Google Scholar]
- 23.Abdulkareem F.A., Radman A., Faugere G., Sathiavelu S., Irfan S.A., Padmanabhan E. Petro-physical properties of Marcellus shale samples and their impact on CO2 adsorption: Equilibrium, kinetics, and empirical modeling study. J. Nat. Gas Sci. Eng. 2020;81 doi: 10.1016/j.jngse.2020.103423. [DOI] [Google Scholar]
- 24.Azam M.R., Tan I.M., Ismail L., Mushtaq M., Nadeem M., Sagir M. Kinetics and Equilibria of Synthesized Anionic Surfactant onto Berea Sandstone. J. Dispers. Sci. Technol. 2014;35:223–230. doi: 10.1080/01932691.2013.783491. [DOI] [Google Scholar]
- 25.C.T.Q. Dang, Z. Chen, Ngoc T. B. Nguyen, Wisup Bae, Thuoc H. Phung, Development of Isotherm Polymer/Surfactant Adsorption Models in Chemical Flooding, SPE Asia Pacific Oil Gas Conf. Exhib. Held Jakarta, Indones. “SPE 147872.” (2011). doi:10.1145/3069593.3069611.
- 26.Azam M.R., Tan I.M., Ismail L., Mushtaq M., Nadeem M., Sagir M. Static adsorption of anionic surfactant onto crushed Berea sandstone. J. Pet. Explor. Prod. Technol. 2013;3:195–201. doi: 10.1007/s13202-013-0057-y. [DOI] [Google Scholar]
- 27.R.B. Grigg, B. Baojun, L. Yi, Competitive Adsorption of a Hybrid Surfactant System onto Five Minerals, Berea Sandstone, and Limestone, Present. SPE Annu. Tech. Conf. Exhib. Houston, Texas. 26-29 Sept. (2004). SPE-90612-MS. (2004). doi:10.2118/90612-MS.
- 28.Kwok W., Nasr-El-Din H.A., Hayes R.E., Sethi D. Static and dynamic adsorption on Berea sandstone of a non-ionic surfactant. Coll. Surf. A Physicochem. Eng. Asp. 1993;78:193–209. [Google Scholar]
- 29.Zhong X., Pu H., Zhou Y., Zhao J.X. Comparative Study on the Static Adsorption Behavior of Zwitterionic Surfactants on Minerals in Middle Bakken Formation. Energy & Fuels. 2019;33:1007–1015. doi: 10.1021/acs.energyfuels.8b04013. [DOI] [Google Scholar]
- 30.Li N., Zhang G., Ge J., Luchao J., Jianqiang Z., Baodong D., Pei H. Adsorption behavior of betaine-type surfactant on quartz sand. Energy and Fuels. 2011;25:4430–4437. doi: 10.1021/ef200616b. [DOI] [Google Scholar]
- 31.Lv W., Bazin B., Ma D., Liu Q., Han D., Wu K. Static and dynamic adsorption of anionic and amphoteric surfactants with and without the presence of alkali. J. Pet. Sci. Eng. 2011;77:209–218. doi: 10.1016/j.petrol.2011.03.006. [DOI] [Google Scholar]
- 32.Trogus F.J., Sophany T., Schechter R.S., Wade W.H. Static and Dynamic Adsorption of Anionic and Nonionic Surfactants. Soc. Pet. Eng. J. 1977;17:337–344. doi: 10.2118/6004-PA. [DOI] [Google Scholar]
- 33.Abdulkareem F.A., Shariff A.M., Ullah S., See T.L., Keong L.K., Mellon N. Adsorption performance of 5A molecular sieve zeolite in water vapor – binary gas environment : Experimental and modeling evaluation. J. Ind. Eng. Chem. 2018;64:173–187. doi: 10.1016/j.jiec.2018.03.014. [DOI] [Google Scholar]
- 34.Azari A., Gharibi H., Kakavandi B., Ghanizadeh G., Javid A., Mahvi A., Sharaf K., Khosravia T. Magnetic adsorption separation process: an alternative method of mercury extracting from aqueous solution using modified chitosan coated Fe3O4 nanocomposites. J. Chem. Technol. Biotechnol. 2016;92:188–200. doi: 10.1002/jctb.4990. [DOI] [Google Scholar]
- 35.Foo K.Y., Hameed B.H. Insights into the modeling of adsorption isotherm systems. Chem. Eng. J. 2010;156:2–10. doi: 10.1016/j.cej.2009.09.013. [DOI] [Google Scholar]
- 36.Azari A., Kalantary R., Kakavandi B., Farzadkia M., Ahmadi E., Ghanizadeh G. Iron-silver oxide nanoadsorbent synthesized by co-precipitation process for Fluoride removal from aqueous solution and its adsorption mechanism. RSC Adv. 2015;5:87377–87391. doi: 10.1039/C5RA17595J. [DOI] [Google Scholar]
- 37.Azari A., Nabizadeh R., Nasseri S., Mahvi A., Mesdaghinia A. Comprehensive systematic review and meta-analysis of dyes adsorption by carbon-based adsorbent materials: Classification and analysis of last decade studies. Chemosphere. 2020;250 doi: 10.1016/j.chemosphere.2020.126238. [DOI] [PubMed] [Google Scholar]
- 38.Salari M., Dehghani M., Azari A., Motevalli M., Shabanloo A., Ali I. High performance removal of phenol from aqueous solution by magnetic chitosan based on response surface methodology and genetic algorithm. J. Mol. Liq. 2019;285:146–157. doi: 10.1016/j.molliq.2019.04.065. [DOI] [Google Scholar]
- 39.F.A. Abdul kareem, A.M. Shariff, S. Ullah, N. Mellon, L.K. Keong, Adsorption of pure and predicted binary (CO2:CH4) mixtures on 13X-Zeolite: Equilibrium and kinetic properties at offshore conditions, Microporous Mesoporous Mater. 267 (2018) 221–234. doi:10.1016/j.micromeso.2018.04.007.
- 40.Azari A., Noorisepehr M., Dehghanifard E., Karimyan K., Hashemi S., Kalhori E., Norouzi R., Agarwal S., Gupta V. Experimental design, modeling and mechanism of cationic dyes biosorption on to magnetic chitosan-lutaraldehyde composite. Int. J. Biol. Macromol. 2019;131:633–645. doi: 10.1016/j.ijbiomac.2019.03.058. [DOI] [PubMed] [Google Scholar]
- 41.Saxena N., Kumar A., Mandal A. Adsorption analysis of natural anionic surfactant for enhanced oil recovery: The role of mineralogy, salinity, alkalinity and nanoparticles. J. Pet. Sci. Eng. 2018;173:1264–1283. doi: 10.1016/j.petrol.2018.11.002. [DOI] [Google Scholar]
- 42.Bera A., Kumar T., Ojha K., Mandal A. Adsorption of surfactants on sand surface in enhanced oil recovery: Isotherms, kinetics and thermodynamic studies. Appl. Surf. Sci. 2013;284:87–99. doi: 10.1016/j.apsusc.2013.07.029. [DOI] [Google Scholar]
- 43.Ahmadi M.A., Shadizadeh S.R. Experimental investigation of a natural surfactant adsorption on shale-sandstone reservoir rocks: Static and dynamic conditions. Fuel. 2015;159:15–26. doi: 10.1016/j.fuel.2015.06.035. [DOI] [Google Scholar]
- 44.Barati-Harooni A., Najafi-Marghmaleki A., Tatar A., Mohammadi A.H. Experimental and modeling studies on adsorption of a nonionic surfactant on sandstone minerals in enhanced oil recovery process with surfactant flooding. J. Mol. Liq. 2016;220:1022–1032. doi: 10.1016/j.molliq.2016.04.090. [DOI] [Google Scholar]
- 45.Shiloach A., Blankschtein D. Prediction of Critical Micelle Concentrations and Synergism of Binary Surfactant Mixtures Containing Zwitterionic Surfactants. Langmuir. 1997;13:3968–3981. doi: 10.1021/la970160x. [DOI] [Google Scholar]
- 46.Somasundaran P., Huang L. Adsorption Behavior of Surfactant Mixtures at Solid-Liquid. Interface. 1997;582 [Google Scholar]
- 47.Abdul Kareem F.A., Shariff A.M., Ullah S., Garg S., Dreisbach F., Keong L.K., Mellon N. Experimental and Neural Network Modeling of Partial Uptake for a Carbon Dioxide/Methane/Water Ternary Mixture on 13X Zeolite. Energy Technol. 2017;5:1–20. doi: 10.1002/ente.201600688. [DOI] [Google Scholar]
- 48.Abdul Kareem F.A., Shariff A.M., Ullah S., Dreisbach F., Keong L.K., Mellon N., Garg S. Experimental measurements and modeling of supercritical CO2 adsorption on 13X and 5A zeolites. J. Nat. Gas Sci. Eng. 2018;50:115–127. doi: 10.1016/j.jngse.2017.11.016. [DOI] [Google Scholar]
- 49.Padilla-Ortega E., Leyva-Ramos R., Flores-Cano J.V. Binary adsorption of heavy metals from aqueous solution onto natural clays. Chem. Eng. J. 2013;225:535–546. doi: 10.1016/j.cej.2013.04.011. [DOI] [Google Scholar]
- 50.Mobarak M., Mohamed E.A., Selim A.Q., Ben A., Erto A., Bonilla-petriciolet A., Seliem M.K. Surfactant – modified serpentine for fluoride and Cr(VI) adsorption in single and binary systems: Experimental studies and theoretical modeling. Chem. Eng. J. 2019;369:333–343. doi: 10.1016/j.cej.2019.03.086. [DOI] [Google Scholar]
- 51.Kurniawan A., Sutiono H., Indraswati N., Ismadji S. Removal of basic dyes in binary system by adsorption using rarasaponin–bentonite: Revisited of extended Langmuir model. Chem. Eng. J. 2012;189–190:264–274. doi: 10.1016/j.cej.2012.02.070. [DOI] [Google Scholar]
- 52.Mulqueen M., Blankschtein D. Prediction of Equilibrium Surface Tension and Surface Adsorption of Aqueous Surfactant Mixtures Containing Ionic Surfactants. Langmuir. 1999;15:8832–8848. [Google Scholar]
- 53.Kamari A., Gharagheizi F., Shokrollahi A., Arabloo M. Integrating a robust model for predicting surfactant – polymer flooding performance. J. Pet. Sci. Eng. 2016;137:87–96. doi: 10.1016/j.petrol.2015.10.034. [DOI] [Google Scholar]
- 54.Abdul Kareem F.A., Shariff A.M., Ullah S., Keong L.K., Mellon N. Total and partial uptakes of multicomponent vapor-gas mixtures on 13X zeolite at 343K: Experimental and modeling study. Microporous Mesoporous Mater. 2018;258:95–113. doi: 10.1016/j.micromeso.2017.09.004. [DOI] [Google Scholar]
- 55.H. Sun, H. Belhaj, Incorporated Artificial Intelligence and Digital Imaging System for Unconventional Reservoirs Characterization, in: SPE Annu. Tech. Conf. Exhib. Held Calgary, Alberta, Canada, 30 Sep - 2 October. “SPE-195834-MS,” 2019.
- 56.Rahmanifard H., Plaksina T. Application of artificial intelligence techniques in the petroleum industry: a review. Artif. Intell. Rev. 2019;52:2295–2318. doi: 10.1007/s10462-018-9612-8. [DOI] [Google Scholar]
- 57.Zhang J., Feng Q., Zhang X., Zhang X., Yuan N., Wen S. The use of an artificial neural network to estimate natural gas/water interfacial tension. Fuel. 2015;157:28–36. doi: 10.1016/j.fuel.2015.04.057. [DOI] [Google Scholar]
- 58.Elmabrouk S., Shirif E., Mayorga R. Artificial Neural Network Modeling for the Prediction of Oil Production. Pet. Sci. Technol. 2015;32:1123–1130. doi: 10.1080/10916466.2011.605093. [DOI] [Google Scholar]
- 59.Ansari A., Heras M., Nones J., Mohammadpoor M., Torabi F. Predicting the performance of steam assisted gravity drainage (SAGD) method utilizing artificial neural network (ANN) Petroleum. 2019 doi: 10.1016/j.petlm.2019.04.001. [DOI] [Google Scholar]
- 60.Ahmadi M.A., Soleimani R., Lee M., Kashiwao T., Bahadori A. Determination of oil well production performance using artificial neural network (ANN) linked to the particle swarm optimization (PSO) tool. Petroleum. 2015;1:118–132. doi: 10.1016/j.petlm.2015.06.004. [DOI] [Google Scholar]
- 61.Ahmadloo F., Asghari K., Renouf G. Performance Prediction of Waterflooding in Western Canadian Heavy Oil Reservoirs Using Artificial Neural Network. Energy & Fuels. 2010:2520–2526. doi: 10.1021/ef9013218. [DOI] [Google Scholar]
- 62.Al-dousari M.M., Garrouch A.A. An artificial neural network model for predicting the recovery performance of surfactant polymer floods. J. Pet. Sci. Eng. 2013;109:51–62. doi: 10.1016/j.petrol.2013.08.012. [DOI] [Google Scholar]
- 63.Jiang B., Zhang F., Sun Y., Zhou X., Dong J., Zhang L. Modeling and optimization for curing of polymer flooding using an artificial neural network and a genetic algorithm. J. Taiwan Inst. Chem. Eng. 2014;45:2217–2224. doi: 10.1016/j.jtice.2014.03.020. [DOI] [Google Scholar]
- 64.Kundu P., Paul V., Kumar V., Mishra I.M. Formulation development, modeling and optimization of emulsification process using evolving RSM coupled hybrid ANN-GA framework. Chem. Eng. Res. Des. 2015;104:773–790. doi: 10.1016/j.cherd.2015.10.025. [DOI] [Google Scholar]
- 65.Azari A., Mahmoudian M., Niari M., Eş I., Dehganifard E., Kiani A., Javid A., Azari H., Fakhri Y., Khaneghah A. Rapid and efficient ultrasonic assisted adsorption of diethyl phthalate onto FeII Fe2IIIO4 @GO: ANN-GA and RSM-DF modeling, isotherm, kinetic and mechanism study. Microchem. J. 2019;150 doi: 10.1016/j.microc.2019.104144. [DOI] [Google Scholar]
- 66.Özdemir U., Özbay B., Veli S., Zor S. Modeling adsorption of sodium dodecyl benzene sulfonate (SDBS) onto polyaniline (PANI) by using multi linear regression and artificial neural networks. Chem. Eng. J. 2011;178:183–190. doi: 10.1016/j.cej.2011.10.046. [DOI] [Google Scholar]
- 67.Xue G., Gu C., Fang X., Wei T. A Case Study on Large Deformation Failure Mechanism and Control Techniques for Soft Rock Roadways in Tectonic Stress Areas. Sustainability. 2019;11:3510. doi: 10.3390/su11133510. [DOI] [Google Scholar]
- 68.Gao X., Wang P., Li D., Peng Q., Wang C., Ma H. Petrologic characteristics and genesis of dolostone from the Campanian of the SK-I Well Core in the Songliao Basin, China. Geosci. Front. 2012;3:669–680. doi: 10.1016/j.gsf.2011.12.014. [DOI] [Google Scholar]
- 69.Berry J.D., Neeson M.J., Dagastine R.R., Chan D.Y.C., Tabor R.F. Measurement of surface and interfacial tension using pendant drop tensiometry. J. Colloid Interface Sci. 2015;454:226–237. doi: 10.1016/j.jcis.2015.05.012. [DOI] [PubMed] [Google Scholar]
- 70.Yunfei H., Yazhuo S., Honglai L., Dominique L., Anniina S. Surfactant adsorption onto interfaces: Measuring the surface excess in time. Langmuir. 2012;28:3146–3151. doi: 10.1021/la2047454. [DOI] [PubMed] [Google Scholar]
- 71.Hussien O., Elraies K., Almansour A., Husin H., Belhaj A., Ern L. Experimental study on the use of surfactant as a fracking fluid additive for improving shale gas productivity. J. Pet. Sci. Eng. 2019;183 doi: 10.1016/j.petrol.2019.106426. [DOI] [Google Scholar]
- 72.Rosen M.J., Kunjappu J.T. Surfactants and Interfacial Phenomena. Fourth Edition, John Wiley & Sons. 2012 doi: 10.1002/9781118228920. [DOI] [Google Scholar]
- 73.Song B., Hu X., Shui X., Cui Z., Wang Z. A new type of renewable surfactants for enhanced oil recovery: Dialkylpolyoxyethylene ether methyl carboxyl betaines. Colloids Surfaces A Physicochem. Eng. Asp. 2016;489:433–440. doi: 10.1016/j.colsurfa.2015.11.018. [DOI] [Google Scholar]
- 74.Rabiu A.M., Elias S., Oyekola O. Evaluation of Surfactant Synthesized from Waste Vegetable Oil to Enhance Oil Recovery from Petroleum Reservoirs. Energy Procedia. 2016;100:188–192. doi: 10.1016/j.egypro.2016.10.163. [DOI] [Google Scholar]
- 75.Mushtaq M., Tan I.M., Rashid U., Sagir M., Mumtaz M. Effect of pH on the static adsorption of foaming surfactants on Malaysian sandstone. Arab. J. Geosci. 2015;8:8539–8548. doi: 10.1007/s12517-014-1765-4. [DOI] [Google Scholar]
- 76.Li Y., Hu X., Liu X., Zhang Y., Zhao Q., Ning P., Tian S. Adsorption behavior of phenol by reversible surfactant-modified montmorillonite: Mechanism, thermodynamics, and regeneration. Chem. Eng. J. 2018;334:1214–1221. doi: 10.1016/j.cej.2017.09.140. [DOI] [Google Scholar]
- 77.S. Hocine, B. Pousset, T. Courtaud, G. Degré, Long Term Thermal Stability of Chemical EOR Surfactants, Present. SPE EOR Conf. Oil Gas West Asia; Muscat, Oman, 26-28 March. SPE-190361-MS. (2018). doi:10.2118/190361-MS.
- 78.Bear G.R. Universal detection and quantitation of surfactants by high-performance liquid chromatography by means of the evaporative light-scattering detector. J. Chromatogr. A. 1988;459:91–107. doi: 10.1016/S0021-9673(01)82019-7. [DOI] [Google Scholar]
- 79.Nourafkan E., Hu Z., Wen D. Controlled delivery and release of surfactant for enhanced oil recovery by nanodroplets. Fuel. 2018;218:396–405. doi: 10.1016/j.fuel.2018.01.013. [DOI] [Google Scholar]
- 80.Adriana G., Emmanuelle V. Development of a multiple-class analytical method based on the use of synthetic matrices for the simultaneous determination of commonly used commercial surfactants in wastewater by liquid chromatography-tandem mass spectrometry. J. Chromatogr. A. 2016;1450:64–75. doi: 10.1016/j.chroma.2016.04.078. [DOI] [PubMed] [Google Scholar]
- 81.Belhaj A.F., Shuhli J.A.B., Elraies K.A., Mahmood S.M., Maulianda B., Alnarabiji M.S. Partitioning behaviour of novel surfactant mixture for high reservoir temperature and high salinity conditions. Energy. 2020;198 doi: 10.1016/j.energy.2020.117319. [DOI] [Google Scholar]
- 82.Park S., Lee E.S., Sulaiman W.R.W. Adsorption behaviors of surfactants for chemical flooding in enhanced oil recovery. J. Ind. Eng. Chem. 2015;21:1239–1245. doi: 10.1016/j.jiec.2014.05.040. [DOI] [Google Scholar]
- 83.Chen X. Modeling of Experimental Adsorption Isotherm Data. Information. 2015;6:14–22. doi: 10.3390/info6010014. [DOI] [Google Scholar]
- 84.Langmuir I. The constitution and fundamental properties of solids and liquids. Part I. Solids. J. Am. Chem. Soc. 1916;38:2221–2295. [Google Scholar]
- 85.Al-ghouti M.A., Da D.A. Guidelines for the use and interpretation of adsorption isotherm models: A review. J. Hazard. Mater. 2020;393 doi: 10.1016/j.jhazmat.2020.122383. [DOI] [PubMed] [Google Scholar]
- 86.Ahmadi M.A., Shadizadeh S. Experimental and Theoretical Study of a New Plant Derived Surfactant Adsorption on Quartz Surface: Kinetic and Isotherm Methods Experimental and Theoretical Study of a New Plant Derived Surfactant Adsorption on Quartz Surface : Kinetic and Isotherm Method. J. Dispers. Sci. Technol. 2015;36:441–452. doi: 10.1080/01932691.2013.860035. [DOI] [Google Scholar]
- 87.Mofarahi M., Gholipour F. Gas adsorption separation of CO2/CH4 system using zeolite 5A. MICROPOROUS MESOPOROUS Mater. 2014;200:1–10. doi: 10.1016/j.micromeso.2014.08.022. [DOI] [Google Scholar]
- 88.Al-Bulishi N.I., King P.R., Blunt M.J., Kraaijveld M. Artificial neural networks workflow and its application in the petroleum industry. Neural Comput. Appl. 2012;21:409–421. doi: 10.1007/s00521-010-0501-6. [DOI] [Google Scholar]
- 89.Alizadeh M., Mahdi M., Reza M. Mathematical and neural network prediction model of three-phase immiscible recovery process in porous media. J. Nat. Gas Sci. Eng. 2014;20:292–311. doi: 10.1016/j.jngse.2014.07.016. [DOI] [Google Scholar]
- 90.Le Van S., Chon B.H. Artificial Neural Network Model for Alkali-Surfactant-Polymer Flooding in Viscous Oil Reservoirs: Generation and Application. Energies. 2016;9:1081. doi: 10.3390/en9121081. [DOI] [Google Scholar]
- 91.Turan N.G., Mesci B., Ozgonenel O. The use of artificial neural networks (ANN) for modeling of adsorption of Cu(II) from industrial leachate by pumice. Chem. Eng. J. 2011;171:1091–1097. doi: 10.1016/j.cej.2011.05.005. [DOI] [Google Scholar]
- 92.Agatonovic-Kustrin S., Beresford R. Basic concepts of artificial neural network (ANN) modeling and its application in pharmaceutical research. J. Pharm. Biomed. Anal. 2000;22:717–727. doi: 10.1016/S0731-7085(99)00272-1. [DOI] [PubMed] [Google Scholar]
- 93.Liang X., Zhang M., Guo C., Abel S., Yi X., Lu G., Yang C., Dang Z. Competitive solubilization of low-molecular-weight polycyclic aromatic hydrocarbons mixtures in single and binary surfactant micelles. Chem. Eng. J. 2014;244:522–530. doi: 10.1016/j.cej.2014.01.097. [DOI] [Google Scholar]
- 94.Belhaj A.F., Elraies K.A., Alnarabiji M.S., Shuhli J.A.B., Mahmood S.M., Ern L.W. Experimental Investigation of Surfactant Partitioning in Pre-CMC and Post-CMC Regimes for Enhanced Oil Recovery Application. Energies. 2019;12:2319. doi: 10.3390/en12122319. [DOI] [Google Scholar]
- 95.Kyu Ahn C., Han Woo S., J. Moon Park, Selective adsorption of phenanthrene in nonionic–anionic surfactant mixtures using activated carbon. Chem. Eng. J. 2010;158:115–119. doi: 10.1016/j.cej.2009.12.014. [DOI] [Google Scholar]
- 96.Gao Y., Yue C., Lu S., Gu W., Gu T. Adsorption from Mixed Solutions of Triton X-100 and Sodium n-Alkyl Sulfates on Silica Gel. J. Colloid Interface Sci. 1984;100:581–583. doi: 10.1016/0021-9797(84)90463-6. [DOI] [Google Scholar]
- 97.Xu Q.U.N., Vasudevan T.V., Somasundaran P. Adsorption of Anionic-Nonionic and Cationic-Nonionic Surfactant Mixtures on Kaolinite. J. Colloid Interface Sci. 1991;142:528–534. doi: 10.1016/0021-9797(91)90083-K. [DOI] [Google Scholar]
- 98.Rao P., He M. Adsorption of anionic and nonionic surfactant mixtures from synthetic detergents on soils. Chemosphere. 2006;63:1214–1221. doi: 10.1016/j.chemosphere.2005.08.067. [DOI] [PubMed] [Google Scholar]
- 99.Lal R. Encyclopedia of Soil Science. Taylor & Francis Group. 2017 doi: 10.1081/e-ess3. [DOI] [Google Scholar]
- 100.Huq F., Blum P., Marks M.A.W., Nowak M., Haderlein S.B., Grathwohl P. Chemical changes in fluid composition due to CO2 injection in the Altmark gas field: preliminary results from batch experiments. Environ. Earth Sci. 2012;67:385–394. doi: 10.1007/s12665-012-1687-y. [DOI] [Google Scholar]
- 101.Sheng J.J. Status of surfactant EOR technology. Petroleum. 2015;1:97–105. doi: 10.1016/j.petlm.2015.07.003. [DOI] [Google Scholar]
- 102.Ahmed S., Elraies K.A., Hashmet M.R., Alnarabiji M.S. Empirical modeling of the viscosity of supercritical carbon dioxide foam fracturing fluid under different downhole conditions. Energies. 2018;11 doi: 10.3390/en11040782. [DOI] [Google Scholar]
- 103.Fava A., H. EYRIN, EQUILIBRIUM AND KINETICS OF DETERGENT ADSORPTION- A GENERALIZED EQUILIBRATION THEORY. J. Phys. Chem. A. 1955;60:890–898. doi: 10.1021/j150541a013. [DOI] [Google Scholar]
- 104.Ziegler V.M., Handy L.L. Effect of Temperature on Surfactant Adsorption in Porous Media. SPE J. 1981:218–228. doi: 10.2118/8264-PA. [DOI] [Google Scholar]
- 105.Mehraban M.F., Ayatollahi S., Shari M. Role of divalent ions, temperature, and crude oil during water injection into dolomitic carbonate oil reservoirs, Oil Gas Sci. Technol. - Rev. IFP Energies Nouv. 2019;74 doi: 10.2516/ogst/2019003. [DOI] [Google Scholar]
Associated Data
This section collects any data citations, data availability statements, or supplementary materials included in this article.