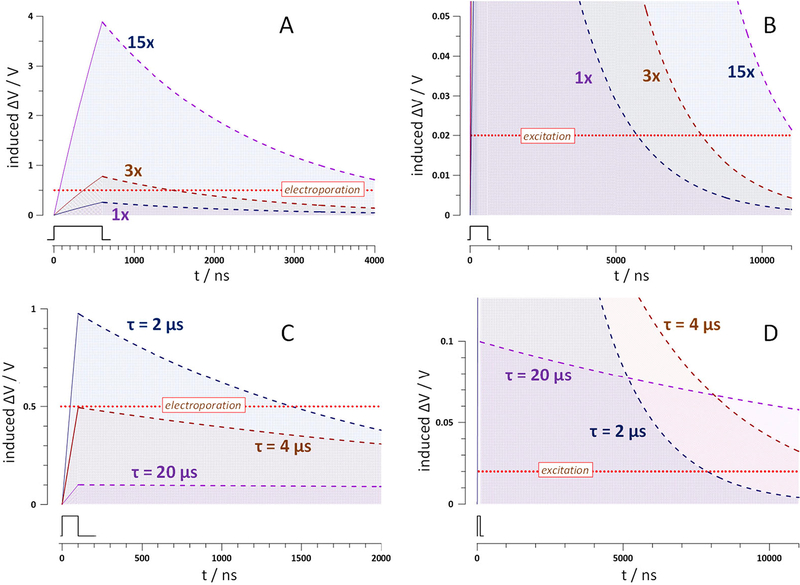
Fig. 1.
The effect of pulse amplitude (A,B) and charging time constant τ (C,D) on the calculated time course of the induced membrane potential ΔV during and after nsEP. Panels B and D present the same curves as A and C, respectively, but on different time and amplitude scales. Dotted horizontal lines designate the assumed 20-mV excitation and 0.5-V electroporation thresholds, as labeled; excitation would only occur if its threshold is exceeded for 11 μs (see text). In A and B, charging and discharging curves were obtained with Eqs. 1 and 2 for t=2 μs and a 600-ns pulse (inset) at 1x, 3x, and 15x amplitude. In B and C, same calculations were performed for a 100-ns pulse (inset) of a fixed 1x amplitude, for t of 2, 4, and 20 μs. Note that excitation without electroporation is prohibited at τ=2 μs regardless of the pulse amplitude (A,B) whereas a larger t may enable it even for a shorter pulse (C,D).

