

Abstract
Activation of the nuclear factor (erythroid-derived 2)-like 2 (NFE2L2 or NRF2) transcription factor is a critical and evolutionarily conserved cellular response to oxidative stress, metabolic stress, and xenobiotic insult. Deficiency of NRF2 results in hypersensitivity to a variety of stressors, whereas its aberrant activation contributes to several cancer types, most commonly squamous cell carcinomas of the esophagus, oral cavity, bladder, and lung. Between 10 and 35% of patients with squamous cell carcinomas display hyperactive NRF2 signaling, harboring activating mutations and copy number amplifications of the NFE2L2 oncogene or inactivating mutations or deletions of KEAP1 or CUL3, the proteins of which co-complex to ubiquitylate and degrade NRF2 protein. To better understand the role of NRF2 in tumorigenesis and more broadly in development, we engineered the endogenous Nfe2l2 genomic locus to create a conditional mutant LSL-Nrf2E79Q mouse model. The E79Q mutation, one of the most commonly observed NRF2-activating mutations in human squamous cancers, codes for a mutant protein that does not undergo KEAP1/CUL3-dependent degradation, resulting in its constitutive activity. Expression of NRF2 E79Q protein in keratin 14 (KRT14)-positive murine tissues resulted in hyperplasia of squamous cell tissues of the tongue, forestomach, and esophagus, a stunted body axis, decreased weight, and decreased visceral adipose depots. RNAseq profiling and follow-up validation studies of cultured NRF2E79Q murine esophageal epithelial cells revealed known and novel NRF2-regulated transcriptional programs, including genes associated with squamous cell carcinoma (e.g. Myc), lipid and cellular metabolism (Hk2, Ppard), and growth factors (Areg, Bmp6, Vegfa). These data suggest that in addition to decreasing adipogenesis, KRT14-restricted NRF2 activation drives hyperplasia of the esophagus, forestomach, and tongue, but not formation of squamous cell carcinoma.
Keywords: Nfe2l2, NRF2, KEAP1, Esophagus, Mouse, Adipose, ESCC, GEMM, E79Q
Introduction
It is imperative for healthy cells to maintain homeostasis by monitoring and regulating cellular insults. The transcription factor nuclear factor (erythroid-derived 2)-like 2 (NFE2L2 or NRF2) is a frontline effector in regulating cellular response to oxidative stress, metabolic stress, and xenobiotic insult. Under normal cellular homeostasis, NRF2 is negatively regulated at the protein level by the CUL3 E3 ligase and the adaptor protein KEAP1, which together ubiquitylate NRF2 and target it to the proteasome for degradation [1–4]. One molecule of NRF2 binds a dimer of KEAP1 through ETGE and DLG motifs in NRF2. Cancer mutations in NRF2 fall exclusively within these two motifs [5]. KEAP1 functions both as the substrate-specific adaptor and as a sensor of stress. ROS, xenobiotics and numerous metabolic electrophiles conformationally alter the KEAP1 structure, resulting in NRF2 stabilization and expression of downstream target genes. This wave of new transcription collectively functions to restore the reduction-oxidation balance, detoxify xenobiotics, reprogram metabolism, and suppress inflammation [6–8]. Specifically, NRF2 and Musculoapoeneuorotic Factor G (MAFG) proteins heterodimerize on antioxidant response elements (ARE) within the promoters of response genes [9].
Large sequencing efforts, including The Cancer Genome Atlas (TCGA) have catalogued recurrent activating mutations in NRF2 and loss-of-function mutations in KEAP1. In non-small cell lung squamous cell carcinoma (NSCLC) patients, NFE2L2, KEAP1, and CUL3 mutations account for 30% of alterations [10,11]. The NFE2L2 gene is altered in 14% of Esophageal Squamous Cell Carcinoma (ESCC) [10–14]. Additionally, 4% of ESCC cancers contain mutations in KEAP1 [10–12,15]. In HPV negative head and neck squamous cell carcinoma (HPV– HNSCC), up to 25% of TCGA cases have genomic alterations in NFE2L2, KEAP1, and CUL3 [16]. Beyond mutation, a myriad of non-genomic mechanisms have also been reported to drive NRF2 activity in cancer [5]. Though NRF2 activation is both frequently observed in human cancer and is an early event in cancer progression, existing data indicate that active NRF2 alone is not sufficient for oncogenesis [17]. Certainly, decades of research describe NRF2 as an effector of many chemopreventative agents. Depending on context, duration of activity and other undefined factors, NRF2 functions to both suppress oncogenesis and support tumor expansion and dissemination [17,18].
Genetically engineered mouse models (GEMMs) provide important tools for determining the roles of proteins in driving tumor development in vivo [19]. Early work studying the NRF2 pathway in mice explored functions for NRF2 and KEAP1 through genetic deletion [9,20]. Nfe2l2-null mice are viable but display robust hypersensitization to a number of chemical and environmental stressors [21–26]. Keap1-null mice show increased NRF2 protein abundance, hyper-keratinization of the esophagus and subsequent death around postnatal days 7 to 14 [9,20]. This phenotype is NRF2-dependent as concurrent loss of Nfe2l2 in the Keap1-null mice reversed the esophageal phenotype allowing increased survival [20]. Tissue restricted deletion of Keap1 from keratin 5 expressing tissues results in hyper-keratinization of the esophagus, consistent with the Keap1-null mouse [27]. Expression of a constitutively active NRF2 lacking the Neh2 protein domain (caNRF2) resulted in increased thickening of the cornified layer of skin in younger mice [28,29]. Esophageal deletion of Nfe2l2 in a Keap1-null background rescued the post-natal death and revealed a role for NRF2 in renal homeostasis [30]. While these studies have greatly expanded our knowledge of the roles of KEAP1 and NRF2 in physiology, studies of cancer-derived mutations in NRF2 are lacking. Here, we developed and characterized a conditional mouse expressing a constitutively active Nfe2l2 (E79Q) mutant frequently found in cancer patients.
Materials and methods
Mice
All mouse work was performed in accordance with the University of North Carolina Chapel Hill protocol 16–304. Animals were housed in specific pathogen–free facilities of the University of North Carolina at Chapel Hill Genetic Medicine Building. For generating LSL-Nfe2l2E79Q mice, a donor vector comprised of a 2.3 kb segment of the mouse Nfe2l2 gene encompassing exons 2 and 3, including the E79Q mutation in exon 2, several silent mutations to remove PAM sites, and a LoxP-flanked stop cassette. This cassette was microinjected with CRISPR/Cas9 reagents into C57BL/6J (The Jackson Laboratory stock no. 000664) embryos where homologous recombination with the donor vector occurring in the endogenous Nfe2l2 gene. Positive founders were mated to wild-type (C57BL/6J) animals for germline transmission of the knock-in allele. The LSL-Nfe2l2E79Q mice were crossed with homozygous KRT14-CRE mice (The Jackson Laboratory, stock no. 018964 a C57BL/6NJ background) to create mutant NRF2 heterozygous knock-in (ki) mice (LSL-Nfe2l2E79Q ki/+; KRT14-CRE (herein referred to NRF2E79Q or HET)). KRT14-CRE littermate mice without the LSL-Nfe2l2E79Q allele were considered NRF2 wild-type controls (WT). The genotyping PCR is described in detail in Supplementary materials and methods.
Mouse body weight and body composition
Female animals were housed together, while male mice were separated and both groups ate chow ad libitum from a hanging basket. Animals were weighed once weekly. Mice were maintained on Envigo Autoclavable chow (2020SX, Teklad Diets, Envigo, Indianapolis, IN, USA). Adult mice were imaged using magnetic resonance imaging once at 50 weeks of age (EchoMRI™, Houston, TX) [31,32]. For gross tissue weights, liver, epididymal/gonadal white adipose fat pads, and inguinal fat pads were weighed immediately after approved euthanasia at 52 weeks of age.
Histology and Immunohistochemistry
Tissue samples were immediately placed into 10% neutral buffered formalin after harvesting and submersion fixed at room temperature for a minimum of 24 h and maximum of 1 week before being embedded in paraffin wax. Sections of 4–5 μm thickness were used for all stains. Routine H&E staining was performed on all tissues. Antibodies used for immunohistochemical (IHC) analysis are listed in supplementary materials, Table S2). IHC analysis for NRF2 and Ki67 were performed on paraffin slide specimens as detailed in Supplementary materials and methods. Stained slides were imaged on an Olympus BX61 microscope using cellSens Dimension software (Olympus Life Science, Shinjuku City, Tokyo, Japan). Control tissues provided by Xiaoxin L. Chen, used for validating specificity of the NRF2 antibody, were Keap1-null esophagus (positive control) or Nfe2l2-null esophagus (negative control) [33].
Esophagus H&E scoring
A board-certified veterinary pathologist (Stephanie Montgomery, PhD, DVM) first analyzed esophagus slides in a blinded manner. After determining the range of severity, scoring was performed in an unblinded manner. Score was based on thickness of keratin layer, supra-basal layers, and order/disorder of basal layer using ImageJ software. A score of 0 was defined by a normal phenotype with average keratin layer of 0.5–1 μm, the supra-basal layer of 1–2 μm, and the basal layer having 1–3 cells. A score of 1 was defined by keratin layer between 1–7 μm, a supra-basal layer of 2–7 μm, and a basal layer with more than 3 to 5 jumbled or piled nuclei. Finally, score 2 samples were defined by a keratin layer of >7–14 μm, supra-basal layers above 7–10 μm, and a basal layer with more disorder, with more than 5 jumbled cells.
Plasmids, dual-luciferase assays, and immunoprecipitation
HEK 293T/17 cells (ATCC, CRL-11268) were cultured in DMEM Complete medium (supplementary material, Table S3) and maintained in 5% CO2 at 37 °C. Detailed experimental details are provided in Supplemental materials and methods for dual-luciferase assays, immunoprecipitation, and the plasmids used.
Western blotting, RT-qPCR, Esophageal epithelial cell isolation, and RNAseq
These are described in detail in Supplemental materials methods.
Correlations of mRNA in NRF2 mutant vs NRF2 wild type cancers
Raw counts per gene mRNA sequencing data were downloaded from the Broad Genome Data Analysis Center (GDAC) Firehose portal [34]. Clinical annotations were downloaded for the TCGA-OSCA (Esophageal Carcinoma) dataset using TCGAbiolinks Bioconductor to allow exclusion of adenocarcinoma of the esophagus cancers [35]. Clinical annotations for HNSCC were downloaded through the Broad Firehose portal and used to exclude patients with HPV positive (HPV+) HNSCC. Mutation Annotation Format (MAF) variant files for the Varscan (v2.2.3) caller were used [36–38]. Human NRF2 mutations in residues 77–82 and 17–51 were considered to be activating irrespective of the specific alteration. Tumors with mutations in NRF2 outside these regions or any mutation in KEAP1 or CUL3 were removed. GISTIC2 copy number calls based on microarray data were downloaded from the Broad Firehose portal. Tumors without activating NRF2 mutations were excluded if copy number (CN) changes of (−2 or +2, indicating deep deletion or focal amplification, respectively) were identified in KEAP1, CUL3, or NRF2. The remaining curated data were stratified by activating NRF2 mutation status as outlined above. Raw counts were converted to counts per million (cpm) and log2 transformed. Significance of expression differences were assayed with Kolmogorov–Smirnov and Wilcoxon test using the R-Project [39]. Data was visualized using the ggplot2 R-package [40].
Adipose tissue analysis
Analysis of epididymal and gonadal adipose histology is detailed in Supplementary materials and methods.
Results
Molecular characterization of the patient-derived NRF2 E79Q mutation
Squamous cell carcinomas of the lung (LUSC), head and neck (HNSCC), and esophagus (ESCC) contain focally enriched NRF2 mutations around residues 29–31 and 79–81, which correspond to the DLG and ETGE-binding motifs [5,41,42]. Analysis of 413 ESCC patients identified 28 patients harboring NRF2 mutations; the most frequently observed mutation in NRF2 was E79Q (n=5), a mutation which occurs in the ETGE-binding motif (Figure 1A) [10,11,14,41]. Other groups have analyzed several NRF2 mutations mechanistically, but the E79Q mutation has not been specifically studied [28,43]. We expressed FLAG-fusion proteins for wild type (WT) NRF2 and NRF2 E79Q in HEK293T cells before immunoprecipitation and western blotting analysis. Both WT NRF2 and NRF2 E79Q co-immunoprecipitated with the transcription factor MAFG, whereas only WT NRF2 co-complexed with KEAP1 (Figure 1B) [9]. Using a transcriptional reporter for NRF2 in HEK293T cells, we next found that NRF2 E79Q activated a NRF2-dependent luciferase reporter comparably to WT NRF2, compared to HcRED (control) and KEAP1 (Figure 1C). Employing the same reporter, co-expression of KEAP1 repressed the reporter in the HcRED and in WT NRF2 expressing cells, but not in the NRF2 E79Q cells. Overexpression of MAFG, acts as a dominant negative inhibitor of NRF2 repressing the reporter (Figure 1D). As expected, NRF2 E79Q activated NRF2-dependent transcription and could not associate with KEAP1.
Figure 1. Active NRF2 mutant does not interact with KEAP1.
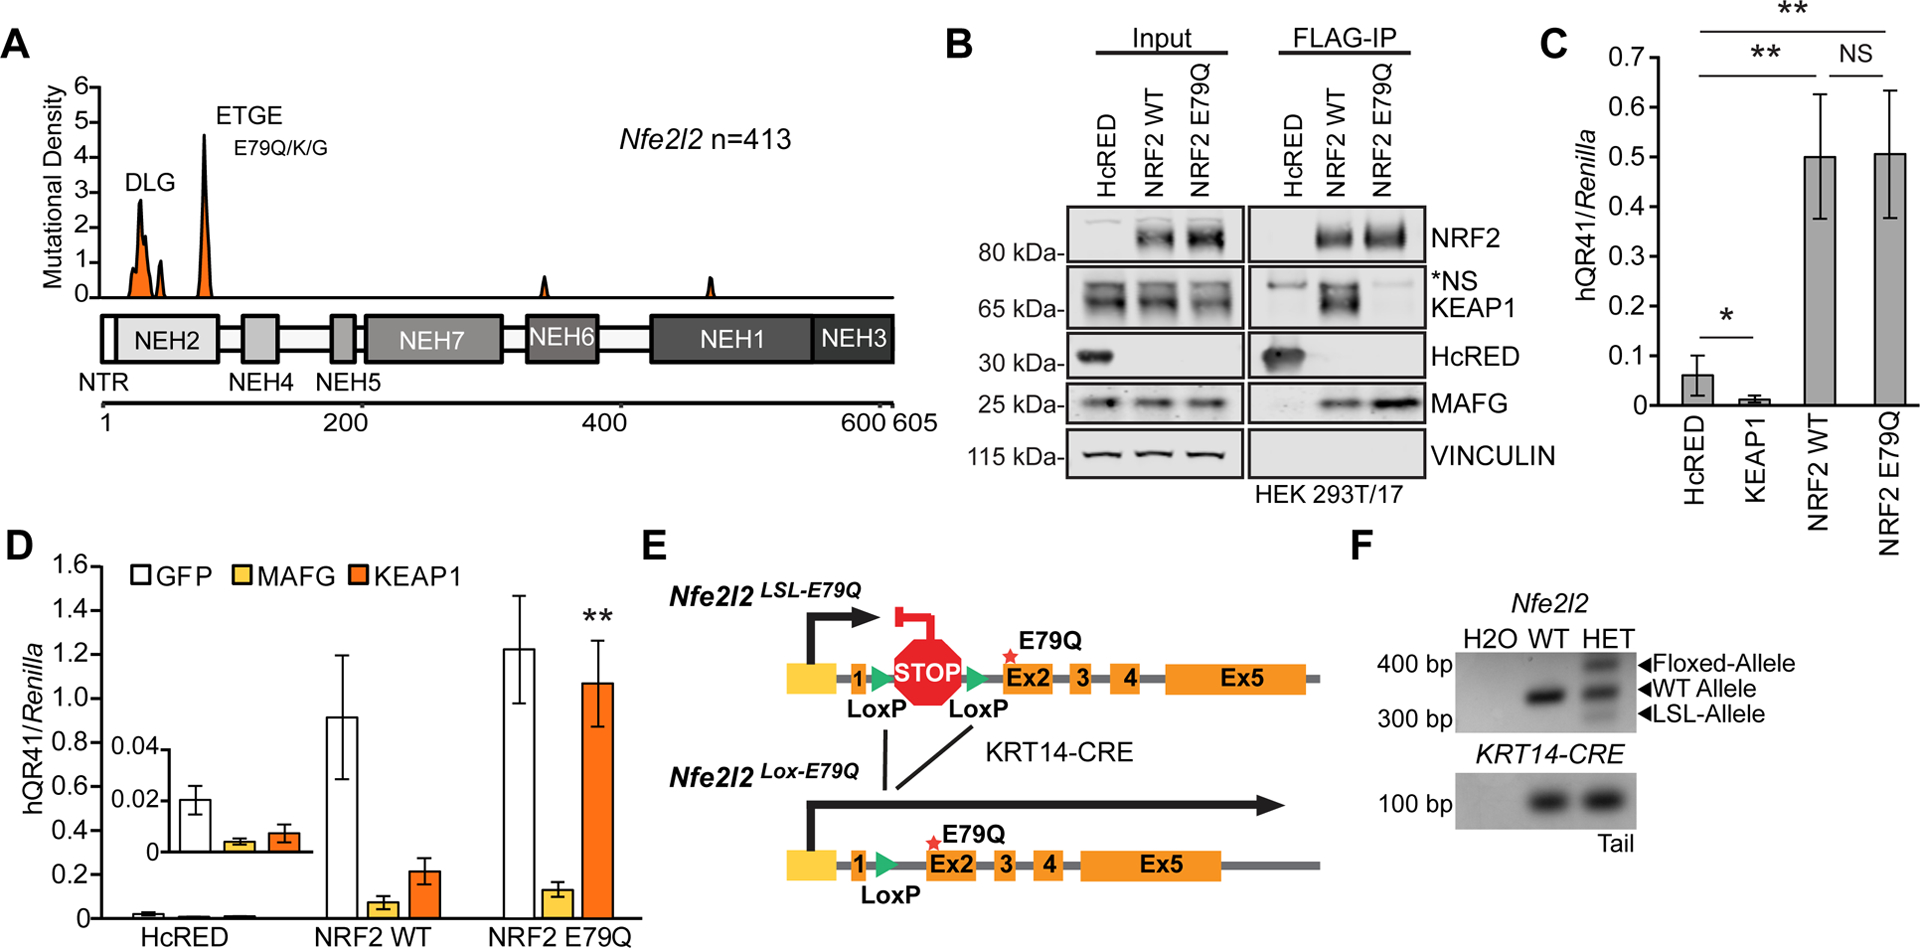
(A) Kernel density estimation (KDE) plot of missense NFE2L2 mutations from esophageal carcinoma patients, illustrating an enrichment of KEAP1 binding mutations in the DLG and ETGE motifs. Data was downloaded from cBioPortal and represents 413 ESCC patients [10,11]. (B) FLAG-immunoprecipitation (IP) of overexpressed NRF2 WT or NRF2 E79Q in HEK 293T/17 cells n=3. (C) Graph of 4 combined dual luciferase antioxidant response element (ARE) reporter assays of overexpression of HcRED (a fluorescent protein control), KEAP1, NRF2 WT and mutant E79Q in HEK 293T/17 cells. (D) Graph of three combined dual-luciferase ARE reporter assays of co-overexpression of GFP, MAFG, or KEAP1 in cells also expressing HcRED, WT NRF2, or NRF2 E79Q. Error bars are SD of biological quadruplicate or triplicate experiments. Asterisks refer to p-values: * p-value <0.05 and ** p-value <0.005. (E) Schematic figure of the altered endogenous Nfe2l2 gene with CRE-driven expression of E79Q mutant Nfe2l2. (F) Representative image of a Nfe2l2 and KRT14-CRE genotyping PCR of tail DNA showing Nfe2l2LSL-E79Q recombination of allele in the heterozygous mice (HET) compared to a wild-type mouse (WT).
Generation and characterization of a novel conditional NRF2 E79Q mutant mouse
To determine the effects of constitutively active NRF2 signaling in KRT14-positive tissues, we engineered a conditional activating mutant NRF2E79Q mouse, using CRISPR technology, whereby a donor vector in which a LOX-STOP-LOX (LSL) cassette replaced the first intron 180bp upstream of a modified Nfe2l2 Exon2, which included the E79Q mutation (Figure 1E). To control mutant NRF2 expression in a tissue-dependent manner, we crossed this mouse to a KRT14-CRE-recombinase mouse wherein tissues expressing Krt14 would express the NRF2 E79Q protein [44] . PCR analysis of extracted tail DNA verified recombination of the knock-in cassette as the skin expresses Krt14. As expected, only heterozygous (HET) animals had expression and recombination of the LSL allele (Figure 1F).
Mutant NRF2E79Q expression recapitulates the Keap1-null mouse phenotype in esophagus, forestomach, and tongue
Given the pronounced esophageal phenotype in Keap1-null mice, we analyzed the esophagus in our mouse. HET mice exhibited excess keratin accumulation and supra-basal layers (Figure 2A,B). To quantify these morphological differences, we developed a scoring system (see Materials and methods) of increasing severity rated from 0–2. All but one WT mouse scored as 0; the single WT mouse exception had a score of 1 due to a thick supra-basal layer. Of the HET mice, 68.4% were assigned a score of 1, and 26.3% were scored as 2 (Figure 2A,B, Table 1). Immunohistochemistry staining for NRF2 confirmed increased protein expression in the esophageal layers, specifically in nuclear NRF2 staining in the supra-basal layer as compared to WT mice (Figure 2B and supplementary material, Figure S1A). NRF2E79Q esophageal tissues also expressed increased Ki67, a common marker of proliferation, though the staining was highly variable (Figure 2B). We next investigated if expression of NRF2 E79Q affected organs known to be affected by KEAP1 loss, such as the upper gastrointestinal tract. H&E analysis of the forestomach and the tongue indicated irregularities, most notably increased thickness of the keratin and supra-basal layers (Figure 2C,D). As expected, recombination of the mutant allele was observed in the tongue (supplementary material, Figure S1B). Interestingly, while KRT14 is abundantly expressed in the skin we did not see a phenotype in this tissue in adult mice (Figure 2E). We also examined major organs which do not express KRT14 and did not observe any abnormalities in histological sections of the adrenal gland, heart, lung, kidney, or spleen, in both sexes (Figure 2F, and data not shown).
Figure 2. Mutant NRF2 E79Q expression recapitulates Keap1-null mice in several tissues.
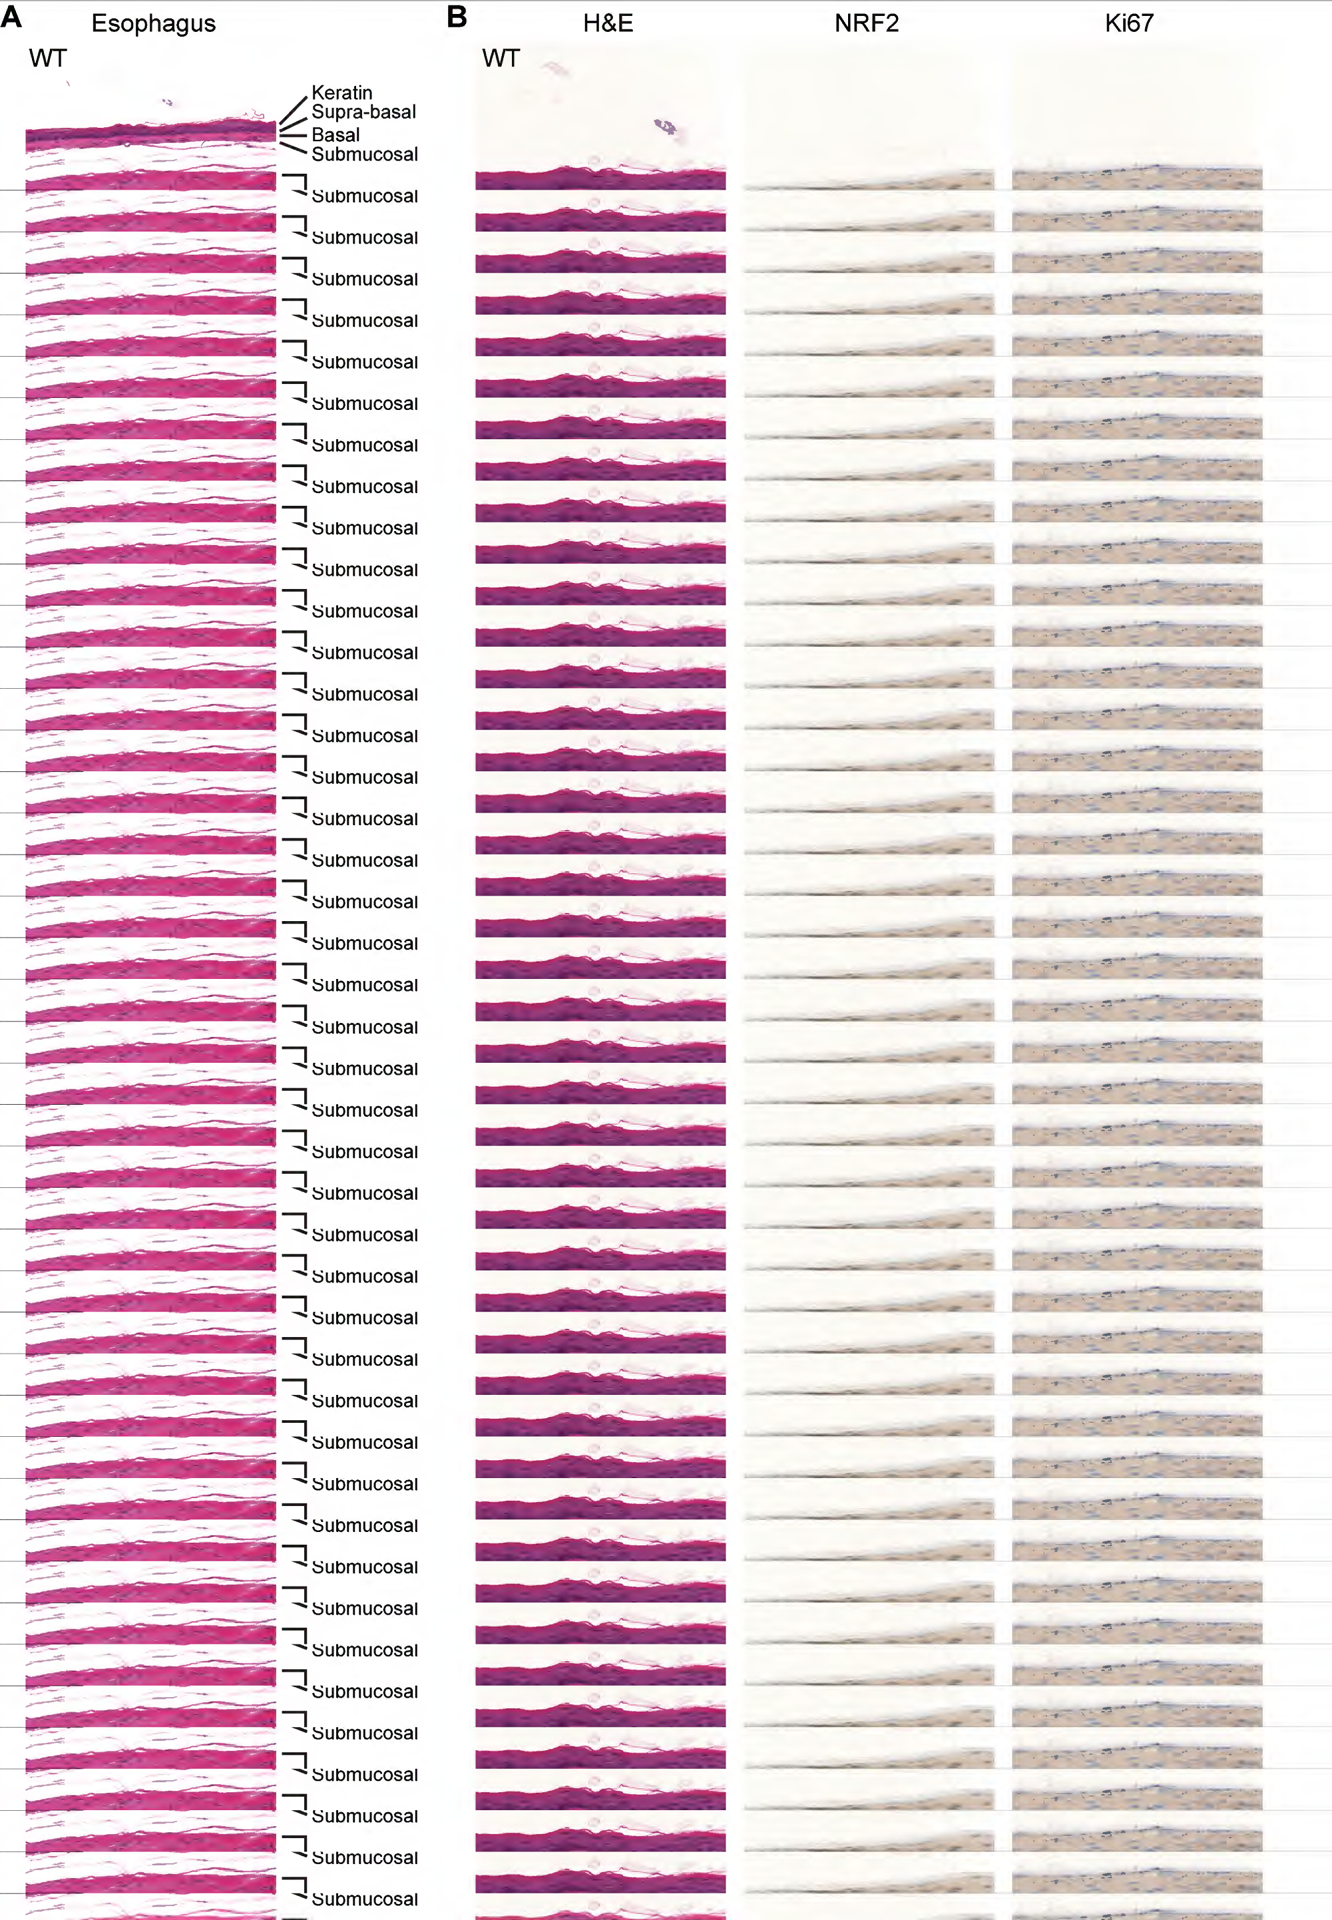
(A–D) Representative images of H&E stained tissues taken at 52 weeks of age. Krt14-expressing tissues with noticeable hyperplasia and hyper-keratinization (A) Representative H&E images demonstrating severity of phenotype in esophagus of the keratin and supra-basal layers of one WT animal and two different HET animals. Keratin label refers to both the stratum corneum and stratum lucidum. The Supra-basal label refers to both the stratum granulosum and stratum spinosum. Lastly, the Basal label refers to the stratum basale. Images were taken at 200 x original magnification and the scale bar is 200 μm. (B) Panel of representative H&E, IHC for NRF2, and Ki67 staining of esophagus from one WT and two HET mice. Images were taken at 400x and the scale bar is 100 μm. (C,D) First set of images were taken at 100 x and have a 500 μm scale bar. The second set of images were taken at 200 x and have a 200 μm scale bar. (C) Forestomach, arrows point to enlarged image in the right side of the panel. (D) Tongue, arrows point to enlarged image on the right side of panel. Image taken at transition in tongue above gland. (E,F). Major organs do not have any noticeable morphology changes. (E) Skin taken at 400 x with a 100 μm scale bar. (F) Other KRT14 positive tissues. The adrenal gland was imaged at 200x with a 200 μm scale bar, while the rest of the tissues were imaged at 100x and have a 500 μm scale bar.
Table 1.
Esophageal histology scores.
| Histological score levels | WT | HET |
|---|---|---|
| Score 0 | 17/18 (94.4%) | 1/19 (5.3%) |
| Score 1 | 1/18 (5.6%) | 13/19 (68.4%) |
| Score 2 | 0/18 (0%) | 5/19 (26.3%) |
Esophageal epithelial cells reveal activated NRF2 signaling
To begin to understand how NRF2 regulates esophageal morphology and biology, we cultured esophageal epithelial cells from young WT and HET mice using the Conditional Reprogramming Cell (CRC) method [45]. WT and HET cell morphology were similarly cobblestone in pattern and the HET cells had complete recombination of the mutant allele (Figure 3A, supplementary material, Figure S2A). RNAseq analysis of these esophageal epithelial cells revealed NRF2 E79Q driven differentially expressed genes (DEG). We found 1468 DEGs with a p-value<0.05, with 798 upregulated DEGs and 670 downregulated DEGs (Figure 3B, supplementary material, Table S4). Many upregulated genes were known NRF2 target genes, such as NAD(P)H Quinone Dehydrogenase 1 (Nqo1) and Slc7a11. DEG analysis also identified genes associated with metabolism (Hk2), growth factor signaling (Vegfa), and transcriptional regulation (Myc) (Figure 3B, supplementary material, Figure S2B). Many of the negatively DEGs were involved in the extracellular matrix (Tnc) (Figure 3B, supplementary material, Figure S2B). Kyoto Encyclopedia of Genes and Genomes (KEGG) and Gene-ontology (GO) analysis of the 798-upregulated DEGs revealed genes involved in oxidative stress, xenobiotic regulation, and growth factor signaling (Figure 3C,D, supplementary material, Table S5). Similar analysis of the 670-downregulated genes exposed extracellular matrix components, cytoskeleton organization, fatty acid metabolism, and signaling pathways (Figure 3E,F, supplementary material, Table S5).
Figure 3. RNAseq analysis of NRF2E79Q murine esophageal epithelial cells.
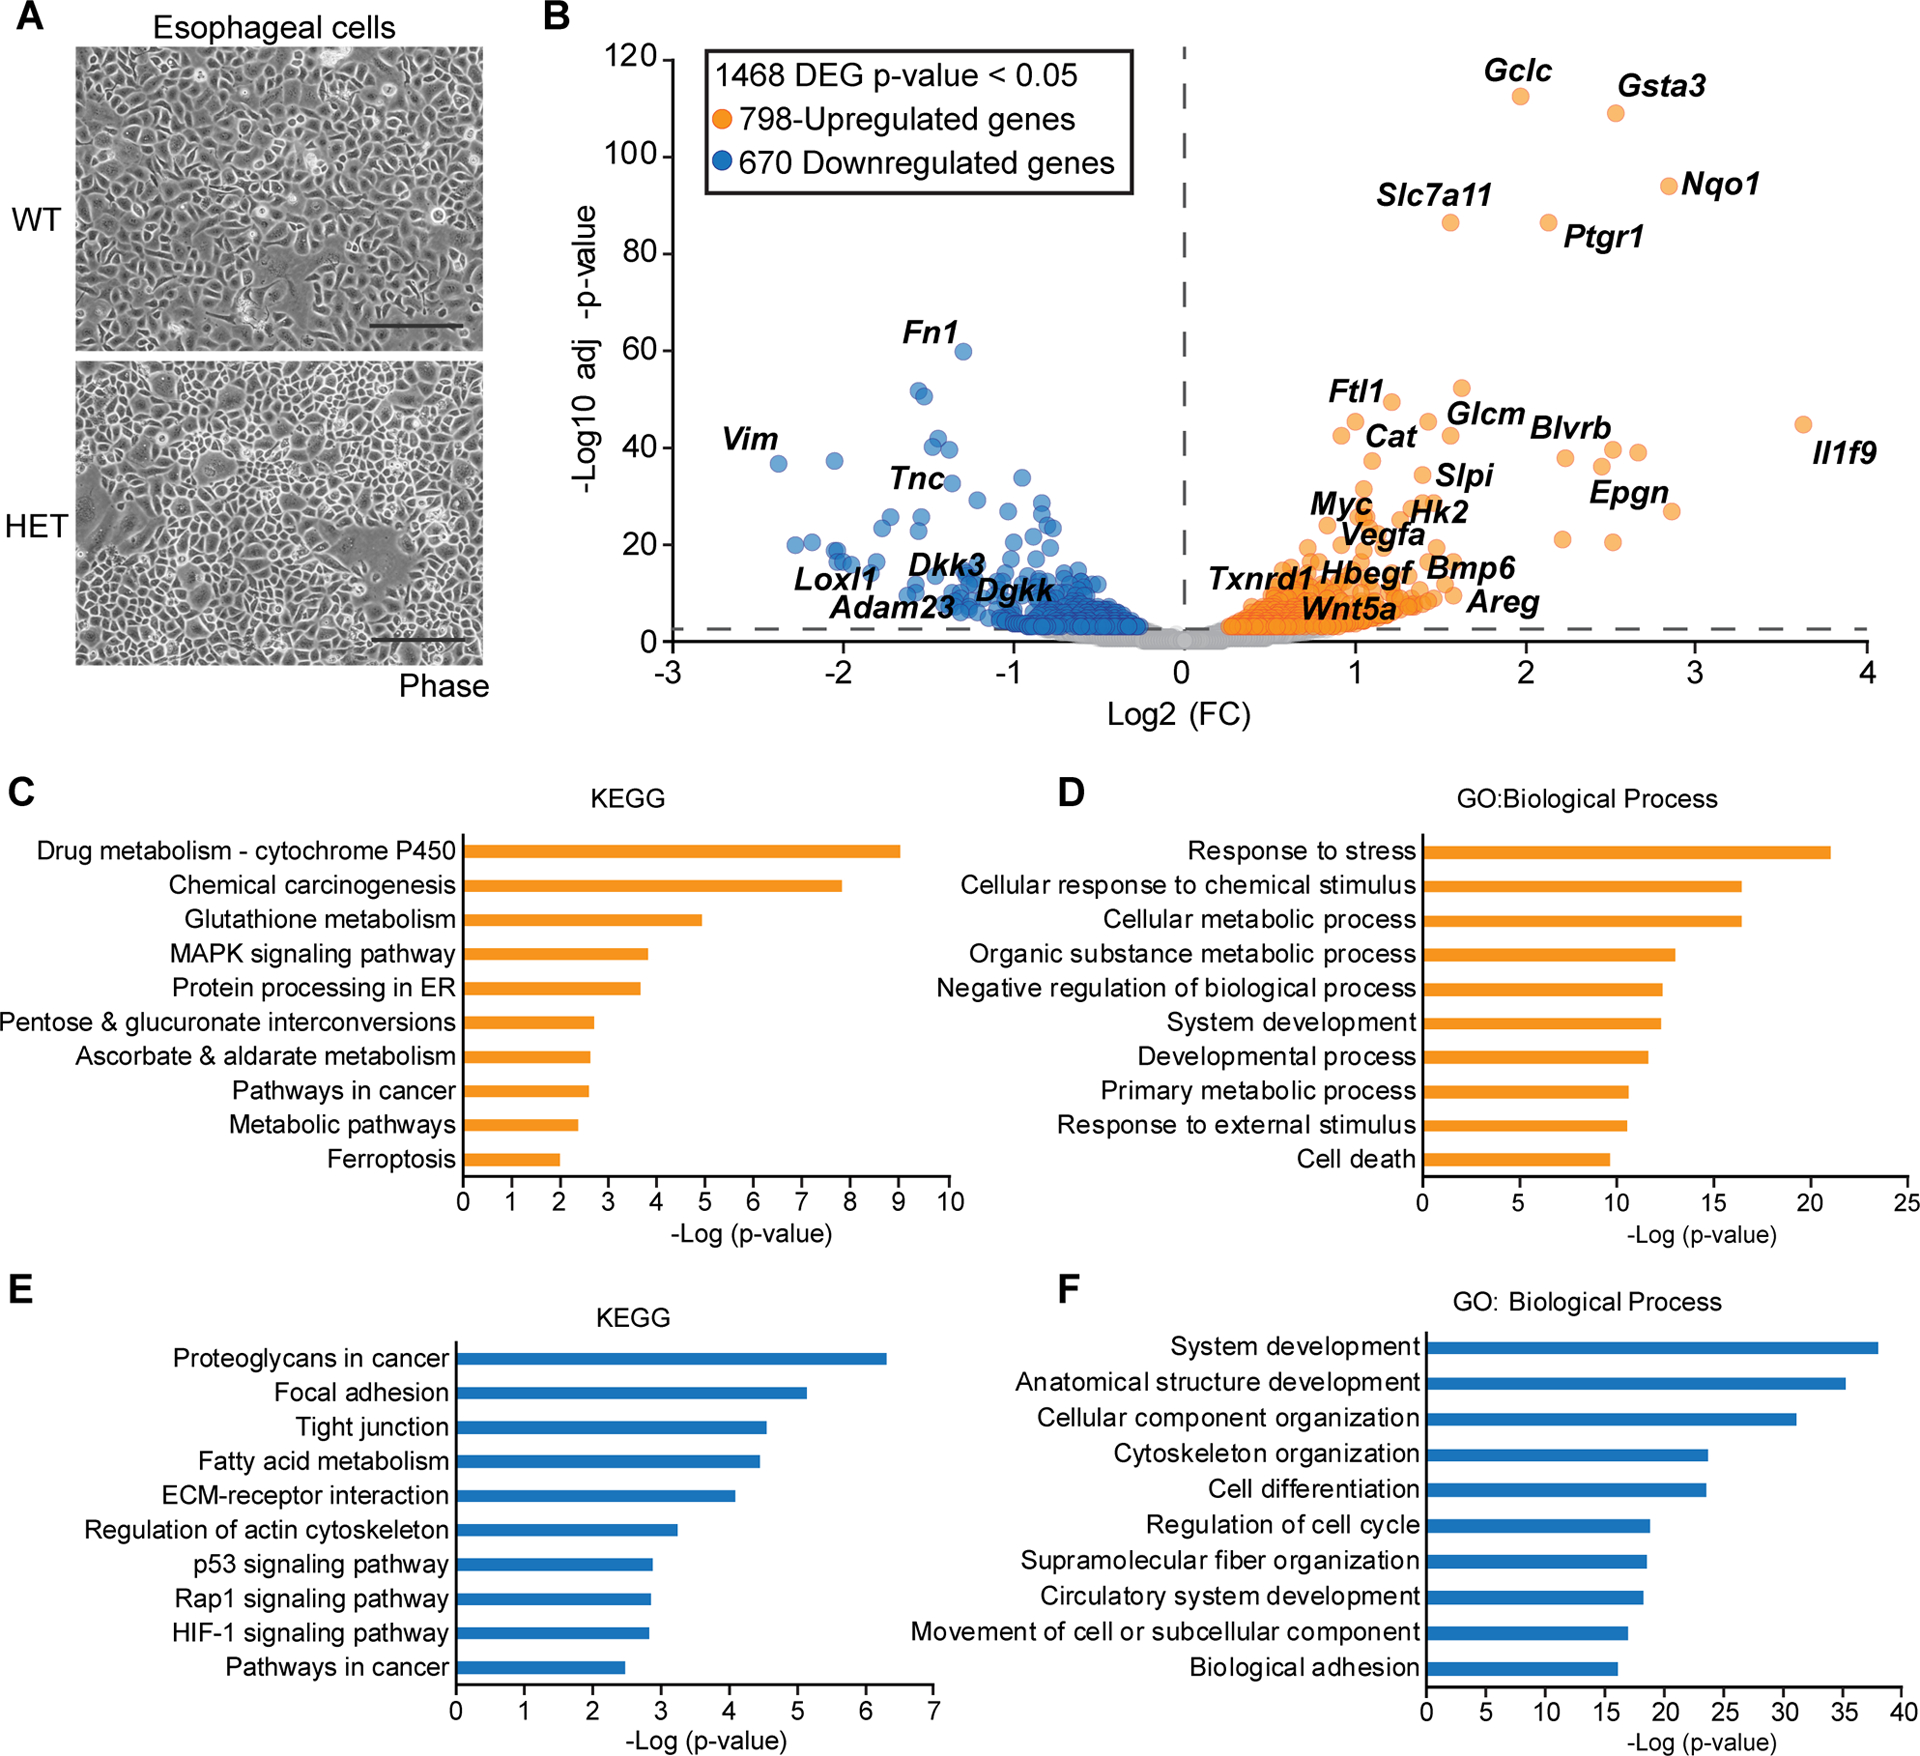
(A) Representative image of isolated mouse NRF2E79Q HET and WT esophageal cells taken at 100 x and has a 500 μm scale bar. (B) Volcano plot of RNAseq data. Cutoff of a p-value <0.05 were used. (N=2). (C–F) Gene ontology (GO) and Kyoto Encyclopedia of Genes and Genomes (KEGG) analysis of RNAseq data. A p-value <0.05 was considered significant, top ten terms are shown for each. (C) KEGG analysis of the 798-upregulated genes from B. (D) GO: Biological Process of the 798-upregulated genes. (D) KEGG analysis of the 670-downregulated genes. (F) GO: Biological Process of the 670-downregulated genes. See full lists in supplementary material, Table S5.
To validate the RNAseq data, RT-qPCR was performed on the esophageal epithelial cells and RNA isolated from tongues. NRF2 E79Q expression induced Bbiliverdin reductase B (Blvrb), catalase (Cat), glutamate-cysteine ligase catalytic subunit (Gclc), and Nqo1. Levels of Nfe2l2 and Keap1 mRNA did not change (Figure 4A and supplementary material, Figure S3A). The increased NRF2 target mRNA levels were also validated at the protein level by western blotting in both esophageal cells and isolated tongue tissue (Figure 4B and supplementary material, Figure S3B). Interestingly, KEAP1 protein but not mRNA abundance was elevated in the HET cells. As mentioned above, NRF2 activation negatively regulated many genes, three of which, Dgkk, Lox1l, and Tnc, were validated using RT-qPCR (Figure 4C). Active NRF2 led to an increase in growth related factors and EGF-like growth factors such as Areg, Bmp6, Epgn, Ereg, Hbegf, Myc, Vegfa, and Wnt5a (Figure 4D) [28,29]. Metabolic factors such as Hk2, Slc7a11, Lpl, Slpi, Ptgr1, and Ppard were also upregulated in mutant NRF2E79Q cells compared to WT cells (Figure 4E).
Figure 4. RT-qPCR analysis of esophageal epithelial cells.
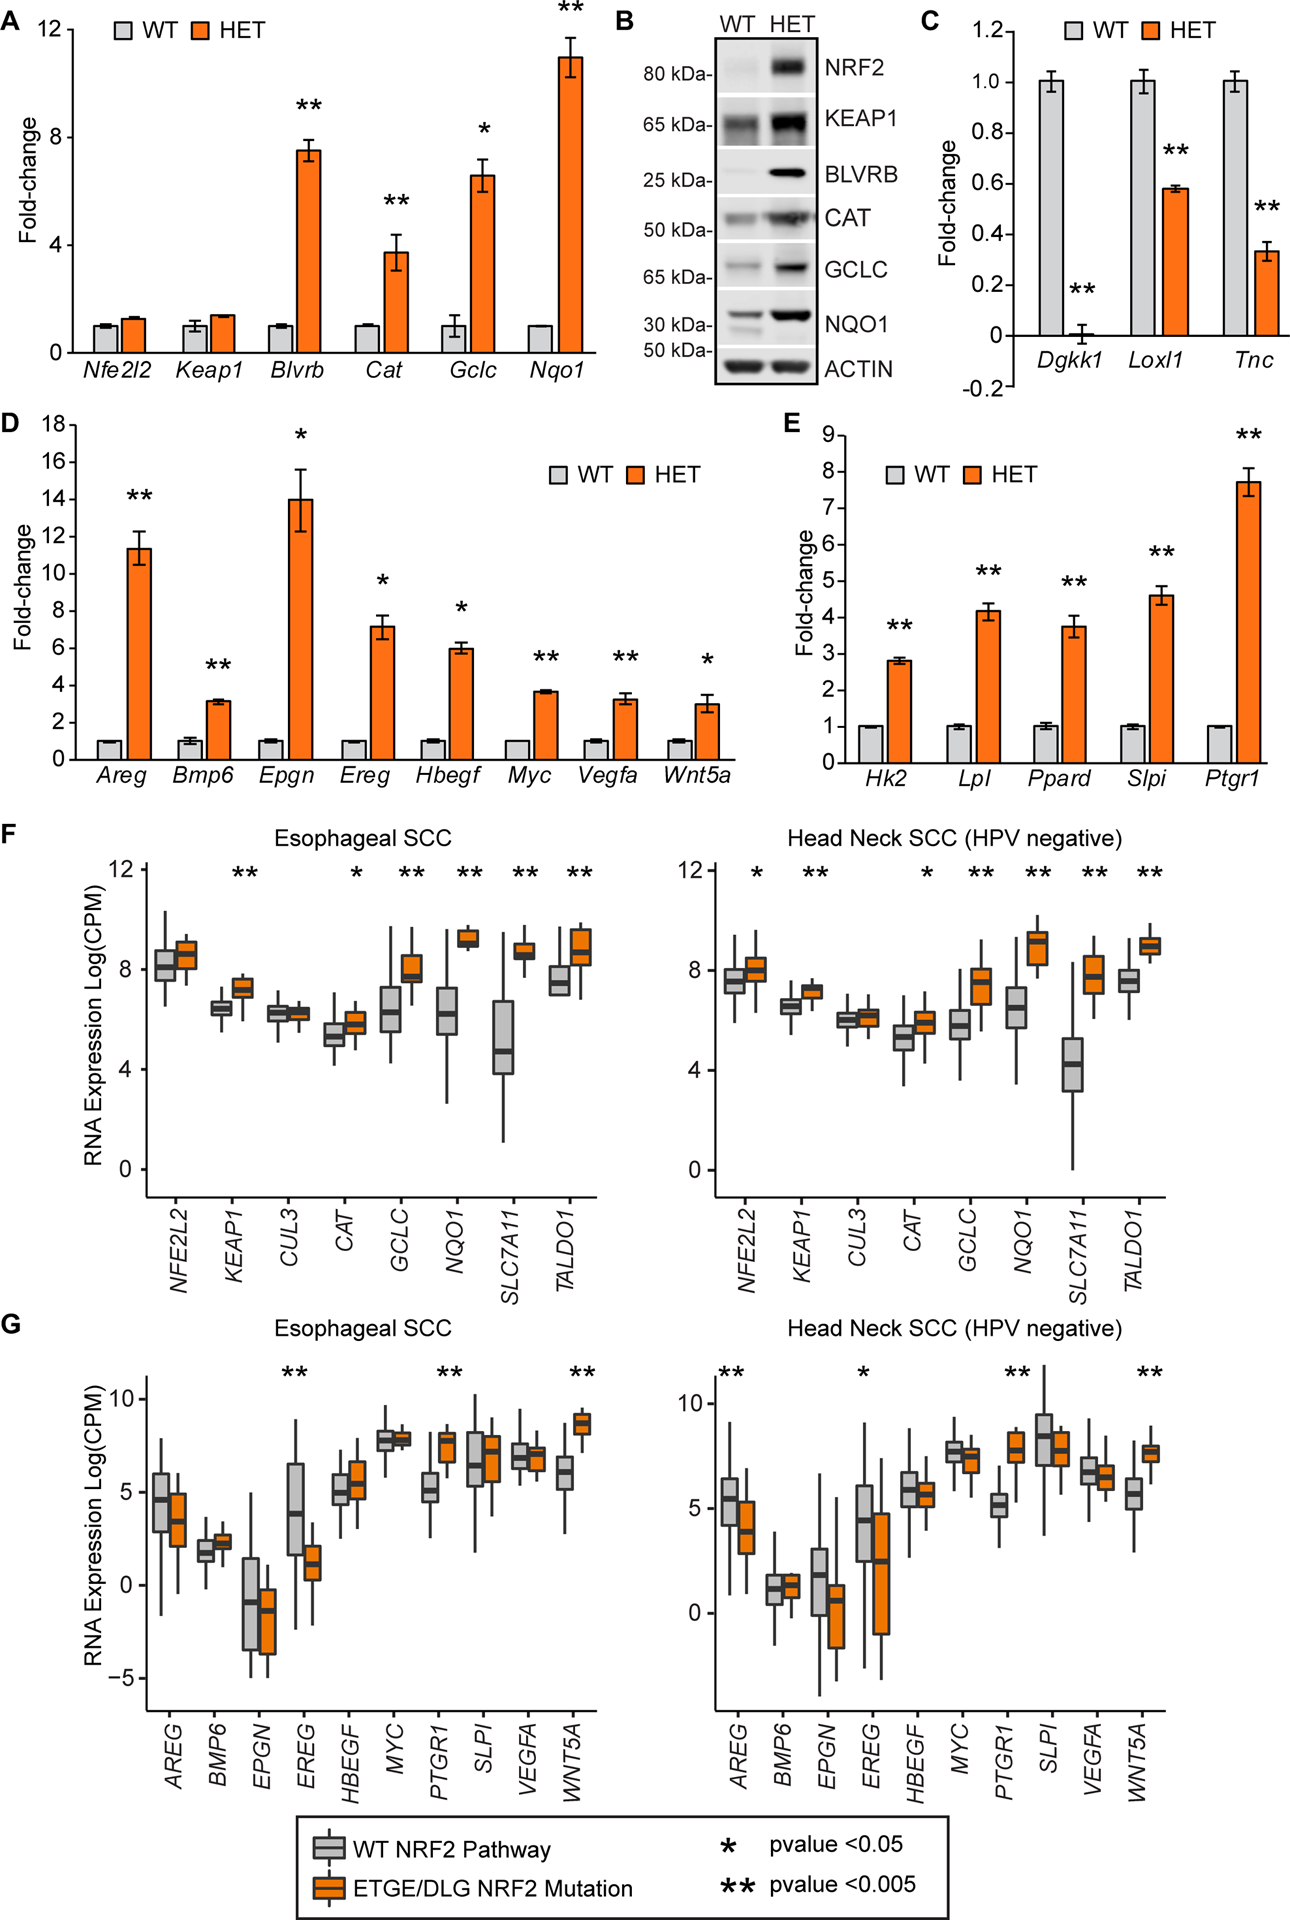
(A–E). RT-qPCR or western blotting analysis of esophageal epithelial cells. (A) Representative plots for NRF2 target genes. All samples were normalized to Actb. Mean ± SD (n=3). (B) Representative western blot of isolated esophageal epithelial cells (n=3). (C–E) RT-qPCR analysis of RNAseq candidates, normalized to Actb. Mean ± SD (n=3). (C) Downregulated genes (D) Secreted ligands (Bmp6, Wnt5a), Myc, and EGF-like growth factors. (E) Metabolism related genes. (F,G) mRNA correlation analysis between WT NRF2 and Mutant NRF2 (mutations in DLG or ETGE residues) in ESCC and HNSCC HPV negative cancers from n=413 and n=279 respectively [14,16]. (F) Correlation analysis of mRNA levels of the NRF2 signaling pathway. (G) Correlation analysis of mRNA levels of potential downstream NRF2 target genes. Mean ± SD. Asterisks refer to p-values: * p-value <0.05 and ** p-value <0.005.
Lastly, to determine if expression of NRF2 targets found in our RNAseq data co-occur with NRF2 mutation status in human cancers, we analyzed TCGA datasets of ESCC and HPV– HNSCC cancers [10,11]. These cancers showed increased mRNA expression of many canonical NRF2 target genes, such as GCLC, NQO1, SLC7A11, and TALDO1 in both NRF2 activating mutant ESCC and HNSCC cancers (Figure 4F, supplementary material, Table S6). We compared many of the growth-related factors validated from the RNAseq data in Figures 5 and 6, and found that PTGR1 and WNT5a were significantly increased with mutant NRF2 cancers, while BMP6 and SLPI trended upwards only in ESCC. Many of the other growth-related factors were unchanged or trended lower, such as EREG and AREG (Figure 4G, supplementary material, Table S6).
Figure 5. Expression of NRF2 E79Q results in stunted animals and decreased eWAT.
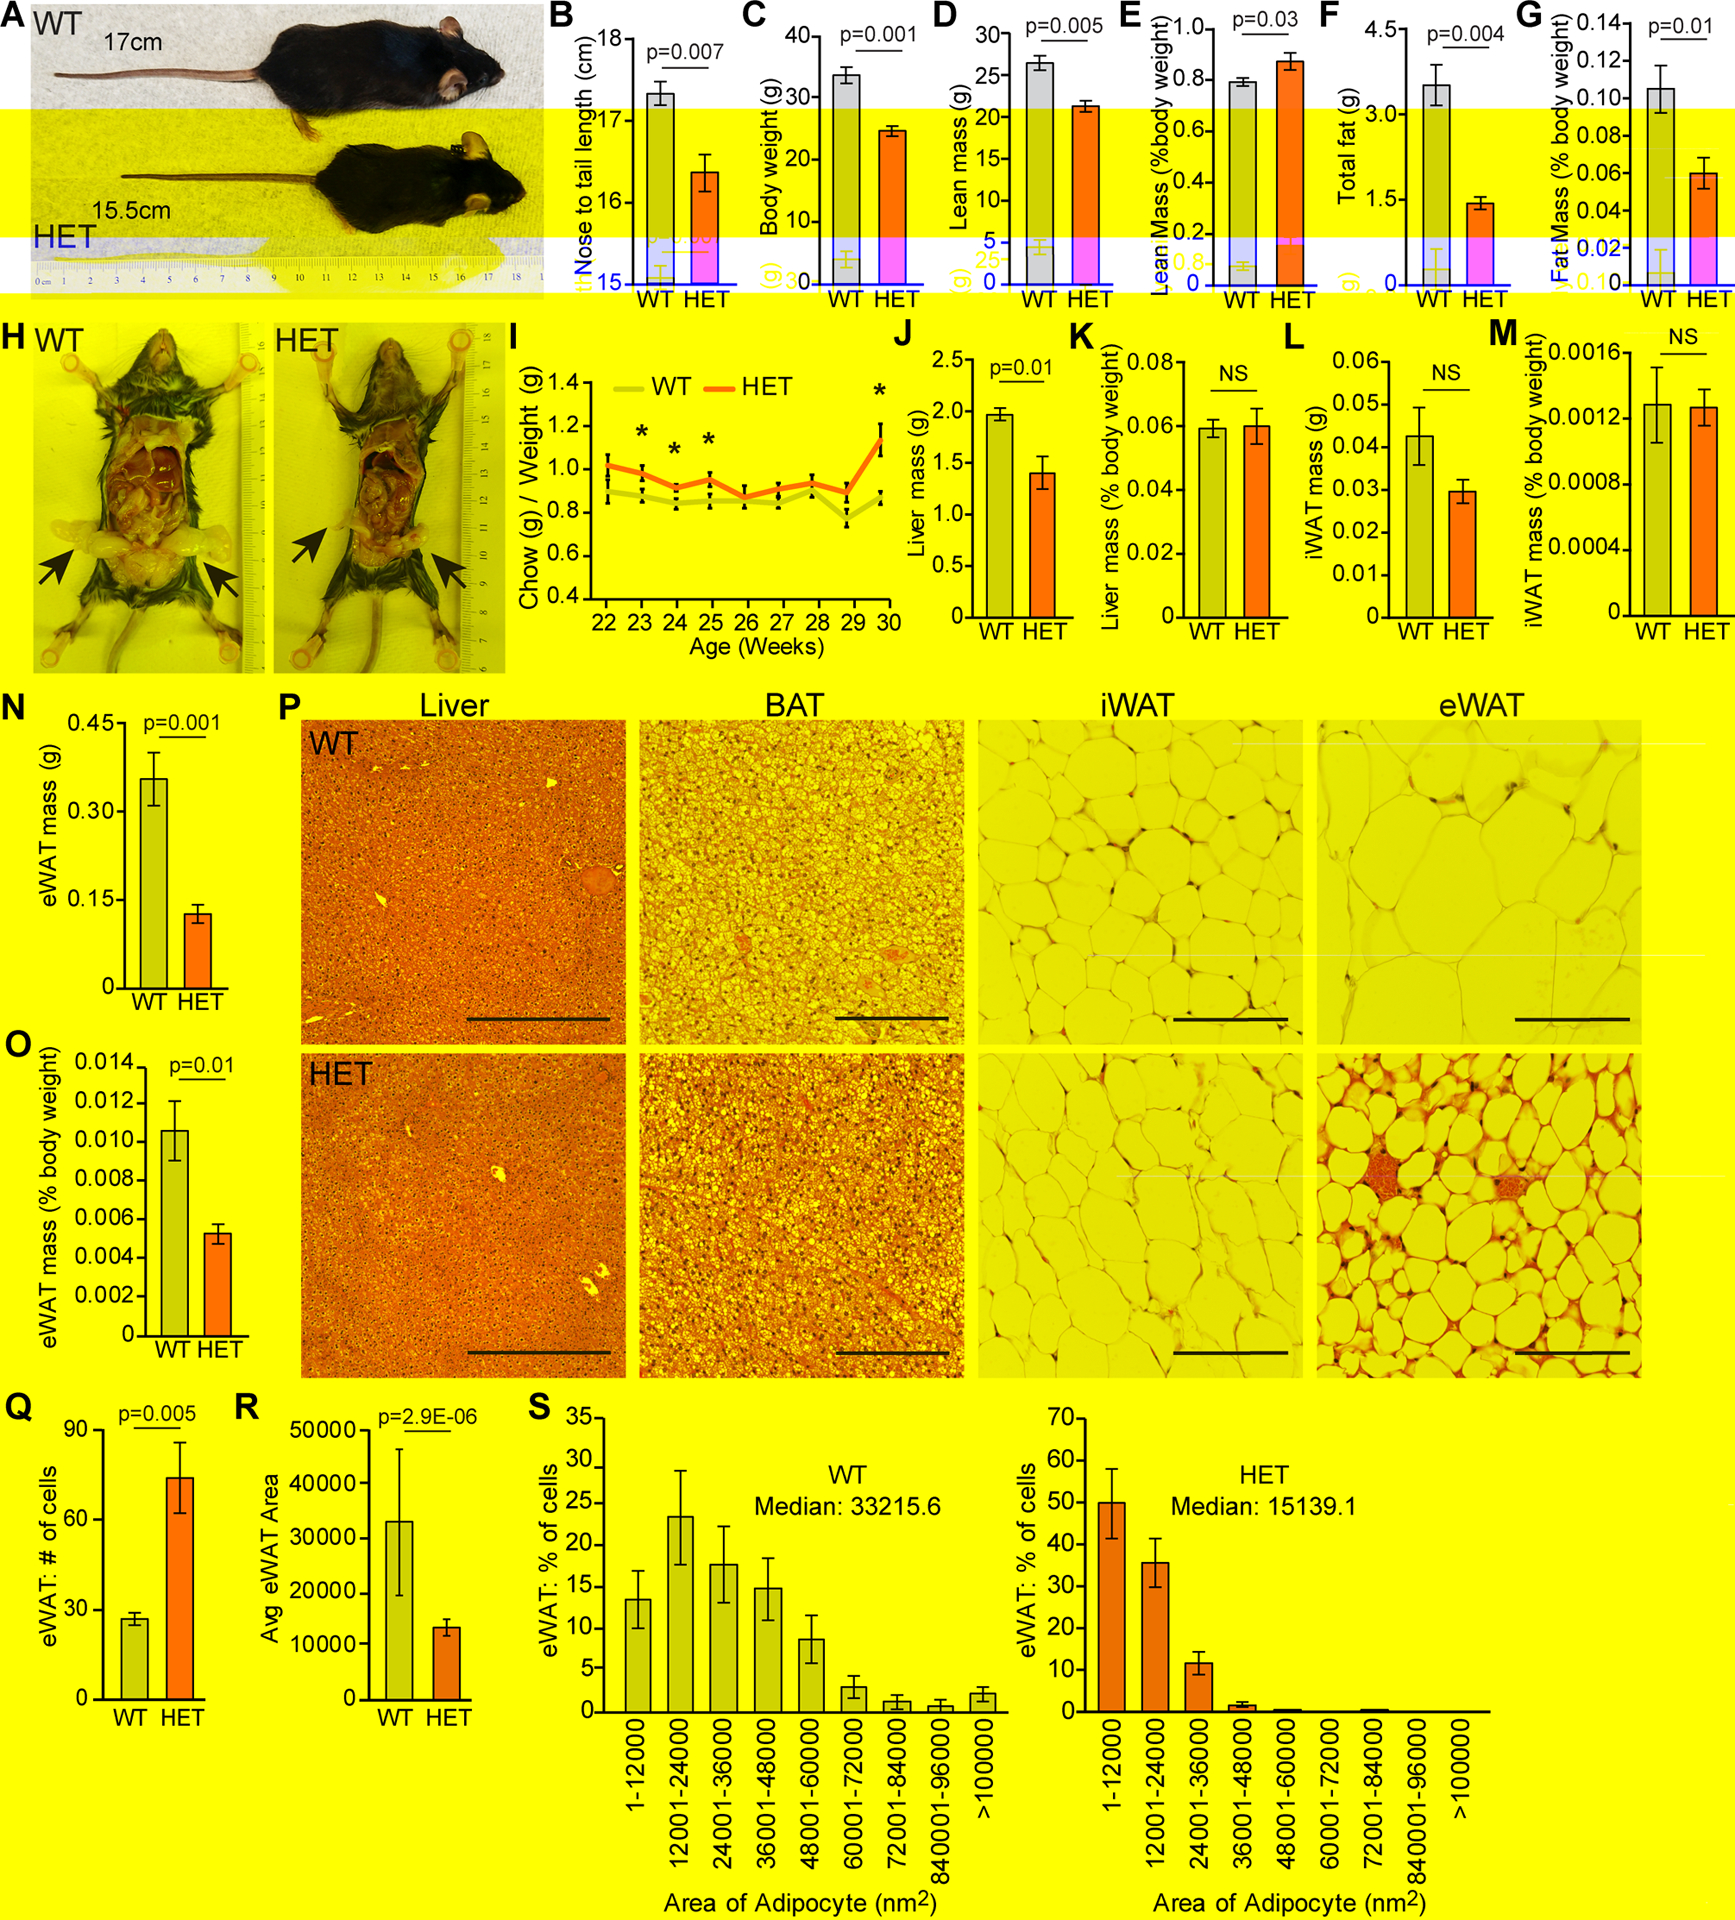
(A–S). All data from male mice. (A) Representative image of size difference between WT and HET male mice at 20 weeks of age. Nose to tail length for each animal is labeled. (B) Nose-to-tail lengths of male (n=5) for WT and HET mice at 52 weeks of age. (C–G) EchoMRI imaging of WT(n=10) and HET (n=10) mice of 50 weeks of age were measured for. (C) Body weight. (D) Lean mass weight. (E) Lean mass normalized to body weight. (F) Total fat mass. (G) Total fat mass normalized to body weight. (H) Representative image of visceral fat pad sizes between WT and HET mice at 20 weeks of age. (I) Weekly chow consumed normalized to weekly body weight for WT (n=11) and HET (n=10) mice. * p-values <0.05. (J–O) Harvested at 52 weeks of age from WT (n=10) and HET (n=10) male mice gross weights of (J) liver weight. (K) liver weight normalized to body weight. (L) inguinal fat pad (iWAT) weight. (M) iWAT weight normalized to body weight. (N) Epididymal fat pad (eWAT) weight. (O) eWAT normalized to body weight. (P) Organs involved in fat storage. Representative images of liver, brown adipose tissue (BAT), iWAT, and eWAT from respective genotypes. Liver imaged at 100 x, 500 μm scale bar, BAT imaged at 200 x, 200 μm scale bar, both iWAT and eWAT imaged at 400 x, 100 μm scale bar. (Q–S) eWAT adipose quantification of 200 x H&E for WT (n=6) and HET (n=8). (Q) Average number of adipocytes per field of view. (R) Average adipose area nM2. (S) Percentage of cells by adipocyte area with median shown. P-values were calculated using an unpaired Student’s t-test, error bars are SEM.
Mutant NRF2E79Q mice are stunted
During our studies of the KRT-14 driven NRF2E79Q mouse we observed that despite being born at Mendelian ratios and being healthy at one year of age (data not shown), all HET animals, were visibly smaller and shorter in nose-to-tail lengths (Figure 5A,B and supplementary material, Figure S4A,B). NRF2E79Q mice without KRT14-CRE were of similar weights and sizes to the WT mice (data not shown). Using EchoMRI to determine the differences in body composition, HET mice had decreased body weight (BW) compared to WT mice (Figure 5C and supplementary material, Figure S4C). HET mice had slightly less lean mass, but normalization to BW demonstrated a slight increase in lean mass over WT mice (Figure 5D,E and supplementary material, Figure S4D,E). Interestingly, HET mice also had meaningfully decreased total fat and BW-normalized fat (Figure 5F,G and supplementary material, Figure S4F,G). Gross phenotypic examination confirmed that both male and female HET mice had smaller visceral fat pads than WT mice respectively (Figure 5H and supplementary material, Figure S4H). This size difference was not attributable to alterations in caloric intake as measured by chow consumption normalized to BW (Figure 5I and supplementary material, Figure S4I).
HET mice have decreased adipocyte area in visceral fat tissues
Since EchoMRI revealed decreased adipose, we next examined the liver, inguinal (iWAT), epididymal (eWAT) and gonadal (gWAT) white adipose tissues weights (Figure 5J–O and supplementary material, Figure S4J–O). While the gross liver weights were lower in HET mice (Figure 5J), this difference was insignificant when normalized to BW (Figure 5K). Although we did not observe differences in iWAT weight between HET and WT mice (Fiure 5L,M and supplementary material, Figure S4L,M), we found a significant decrease in adipocyte size and eWAT weight and with a similar trend in gWAT (Figure 5N–P and supplementary material, Figure S4N–P). Histologically the HET liver, brown adipose tissue (BAT), and iWAT were comparable to WT (Figure 5P and supplementary material, Figure S4P). Quantification of the eWAT histologic samples confirmed this observation (Figure 5Q–S); the HET mice contained more eWAT adipocytes in each field of view with smaller average area (Figure 5Q,R). The median adipocyte area was only 15139 nm2 for the HET mice as compared to the larger 33215 nm2 area of the WT mice (Figure 5S). Although the gross weight of the gWAT was not significantly decreased, the same phenotype was observed at the histological level in the female HET mice (supplementary material, Figure S3Q–S).
Discussion
A number of mouse models have been developed to study the KEAP1/NRF2 signaling pathway. Beyond the KEAP1 and NRF2 knock-out mice, KEAP1 hypomorphic and amino-terminally truncated and active NRF2 mouse models have emerged for cancer studies. The new GEMM described in this study carries the most common NRF2 activating mutation in ESCC. We show that expression of mutant NRF2 E79Q results in excess keratin accumulation and hyperplasia of the esophagus, forestomach, and tongue. Unexpectedly, this mouse also displays a reduction in white adipose tissue. Esophageal epithelial cells isolated from these mice revealed robust NRF2 signaling and an increase in growth, metabolic, and transcription factor expression. Though frequently mutated in cancer, expression of constitutive active NRF2 in mouse epithelium did not result in carcinoma within one year. This mouse model offers a new powerful tool to explore the KEAP1/NRF2 signaling pathway in tissue homeostasis, cancer development, and progression.
The significance of GEMMs which distinguish KEAP1 loss from NRF2 activation is high because KEAP1 mutation in cancer is often and erroneously interpreted synonymously with activating mutations in NRF2. Precisely how KEAP1 mutation and NRF2 mutation similarly or differentially impacts cell biology, cell fate, and cancer progression remains largely unknown. Comparative analysis of our NRF2E79Q mouse with established GEMMs offers some insight. NRF2E79Q mice demonstrated strong hyper-keratinization and hyperplasia of the esophagus, tongue, and forestomach as compared to controls. Earlier work in the Keap1-null mouse with elevated NRF2 levels similarly demonstrated hyper-keratinization of the esophagus, squamous stomach, skin, and tongue and an early death [20]. The HET mouse recapitulated many of these phenotypes, except for the absence of hyper-keratinization in the skin and death. Intriguingly, the more recently developed Keap1fl/fl:KRT5-CRE mouse was not reported to have a skin phenotype [27]. A mouse model with a truncated activating Nfe2l2 transgene (caNrf2) displayed hyper-keratinization of the skin without an esophageal phenotype [28]. The differences in findings between our NRF2E79Q herein and the caNrf2 mouse likely is due in part to the CRE drivers used (KRT14-Cre vs. KRT5-Cre), the age that the mice were analyzed, or the mouse genetic background (C57BL6/J versus FVB) [20,28]. Future studies which combine NRF2E79Q and KEAP1−/− genotypes or conversely, KEAP1 mutation in a NRF2−/− background will be telling, particularly given the many molecular effectors of KEAP1 and disparities of mutation rates in KEAP1 and NRF2 across cancer.
Although esophageal hyperplasia was obvious, NRF2 E79Q expression in KRT14 positive tissues did not result in tumorigenesis. Several possibilities exist. First, we aged the mice one year before sacrifice. It is possible that with increased age, ESCC would be observed, albeit with a predicted low penetrance. Second, we support a model wherein NRF2 activation alone is not sufficient for oncogenesis; rather, NRF2 activation acts early in tumor formation to enable growth and progression [46]. Studies are ongoing which combine NRF2E79Q with frequently altered tumor suppressor and oncogenes (eg. P53, P16, PTEN, PIK3CA) [12–14]. And lastly, though homozygosity of NRF2 mutations are not observed in human cancer, it is also possible that a homozygous NRF2E79Q mouse may develop ESCC.
Beyond histological characterization of this mouse model, we also analyzed NRF2 responsive transcriptional programs in cultured esophageal cells. Gene expression profiling of NRF2E79Q murine esophageal epithelial cells revealed a complex transcriptional program, including increases in metabolic enzymes, decreases in extracellular matrix genes and alterations in a myriad of growth factor signaling pathways. Microarray analyses of gene expression in skin from the caNRF2 mouse discovered many of the same genes found in our RNAseq dataset, such as upregulated EGF-like growth factors like Epgn [28,29]. However, the expression of EGF-like growth factors regulated by NRF2 activation was not upregulated in skin, ESCC, or HNSCC cancers [29]. WNT signaling related factor WNT5A and to a lesser extent BMP6 are upregulated in NRF2 mutant ESCC or HNSCC cancers, supporting some tantalizing studies showing NRF2/WNT crossover [47,48]. If NRF2 signaling modulates WNT signaling, a pathway heavily involved in many processes such as differentiation and proliferation, it may explain some of the phenotypes seen in this study. Future studies that functionally tether these NRF2 target genes to biology are needed, including the NRF2-suppressed transcriptional targets.
The most striking discovery in this mouse was that KRT14-CRE driven expression of NRF2E79Q in the epithelium resulted in smaller body length and with overall significantly reduced body weight. HET mice displayed semi-lipoatrophy, which could account for some of the differences in BW since there was not a difference in lean body mass when normalized to total BW. HET mice visually lacked substantial visceral fat depots as compared to WT mice, in which histological analysis demonstrated HET mice fat deposits had smaller adipocytes. Decreased adipocyte size suggests either a lack of triglyceride accumulation, or increased lipolysis and loss of stored lipids. Of note, only the visceral fat pads were affected; the subcutaneous fat pads were normal. These fat pads arise from different progenitors, differentially regulate nutrients and rely on shared and unique signaling pathways [49,50]. The underlying mechanism remains an important and exciting topic of research.
Similar to the NRF2E79Q mouse, the Keap1-null mouse had smaller body sizes compared to WT littermates [20]. This size difference was attributed to the inability to eat due to the constriction of the esophagus. [20]. As such, we did not observe a difference in caloric intake in the NRF2E79Q mouse, suggesting a yet-to-be-determined mechanism underlying the adipocyte phenotype. The caNRF2 mouse was also reported to be smaller in size without any upper gastrointestinal tract abnormalities; adipose tissue was not characterized [28]. Similarly, the Nfe2l2fl/fl; Keap-null; KRT5-CRE mouse (NEKO) was developed to eliminate the detrimental esophageal phenotype. These mice were stunted with decreased adipose tissue, suggesting elevated NRF2 outside of the esophagus decreases adipose tissue [30]. It is possible that KRT14-driven NRF2 E79Q expression directly impacts adipocyte differentiation and/or growth, which would support a number of recent studies connecting NRF2 with regulation of adipogenesis [51]. Although not classically viewed as a gene expressed in adipose tissue or progenitor pools, a recent single cell RNAseq study of mouse fat pads revealed KRT14 expression in a subset of the stromal vascular fraction [52]. Another potential reason for this decrease in adipose tissue may be due to malabsorption from hyperplasia in the gastrointestinal tract. However, we did not observe morphological alterations in gut histology in this mouse. Future experiments including fecal bomb calorimetry and systemic metabolic assays will help answer these important questions [53].
Supplementary Material
Acknowledgments
We thank Major lab members for critical reading of the manuscript, especially Erica Cloer and Kyle LaPak. The LSL-Nfe2l2E79Q mouse was generated in the UNC Lineberger Animal Models Core Facility. Animal Studies were performed within the UNC Lineberger Animal Studies Core Facility at the University of North Carolina at Chapel Hill and we thank Charlene Santos, Silmara Camargo, and Alain Valdivia. Animal histopathology was performed by the Animal Histopathology & Laboratory Medicine Core at the University of North Carolina at Chapel Hill and we thank Dawud Hilliard. EchoMRI scans of the mice were performed by Animal Metabolism Phenotype core with the UNC Lineberger Animal Studies Core Facility. Lastly, we thank Herbert Thibodeaux for maintaining all of the common equipment used for this study. The results published here, are in whole or part based upon data generated by the TCGA research network: https://www.cancer.gov/tcga.
BMB acknowledges funding from the NIH (5F32CA225040-02). TPS was supported by T32 (T32CA009156) and an AHNS/AAO-HNSF Translational Innovator Combined Award. RMM is supported by a NIH/NCI NRSA (1F31DE028749-01) and a NIH/NIGMS T32 MiBio Training Program (5T32GM119999-03). KMM is supported by a NIH fellowship (5F32CA232543-02).The UNC Lineberger Animal Models Core, the Animal Studies Core, the Animal Histopathology & Laboratory Medicine Core, and the Microscopy Services Laboratory, at the University of North Carolina, are supported in part by an NCI Center Core Support Grant (NIH 5P30CA016086-41) to the UNC Lineberger Comprehensive Cancer Center. The Animal Metabolism Phenotype core is supported by the NIH (DK056350). MBM and XLC are supported by funding from the NIH (U54CA156735). LM is supported by the Methodist Mission Support Fund. DNH is supported by several NIH grants (R01CA211939, R01CA215075, U24CA210988, UG1CA233333). LM is supported by Methodist Mission Support Fund. This work was supported by a NIH/NCI grant to BEW and MBM (RO1CA216051).
Footnotes
Conflict of Interest statement: The authors declare no conflict of interest.
Data availability statement
RNAseq raw data have been deposited to GEO under accession GSE141311 https://www.ncbi.nlm.nih.gov/geo/query/acc.cgi?acc=GSE141311.
References 54–68 are cited only in the supplementary material.
References
- 1.Furukawa M, Xiong Y. BTB protein Keap1 targets antioxidant transcription factor Nrf2 for ubiquitination by the Cullin 3-Roc1 ligase. Mol Cell Biol 2005; 25: 162–171. [DOI] [PMC free article] [PubMed] [Google Scholar]
- 2.Kobayashi A, Kang MI, Okawa H, et al. Oxidative stress sensor Keap1 functions as an adaptor for Cul3-based E3 ligase to regulate proteasomal degradation of Nrf2. Mol Cell Biol 2004; 24: 7130–7139. [DOI] [PMC free article] [PubMed] [Google Scholar]
- 3.Cullinan SB, Gordan JD, Jin J, et al. The Keap1-BTB protein is an adaptor that bridges Nrf2 to a Cul3-based E3 ligase: oxidative stress sensing by a Cul3-Keap1 ligase. Mol Cell Biol 2004; 24: 8477–8486. [DOI] [PMC free article] [PubMed] [Google Scholar]
- 4.Zhang DD, Lo SC, Cross JV, et al. Keap1 is a redox-regulated substrate adaptor protein for a Cul3-dependent ubiquitin ligase complex. Mol Cell Biol 2004; 24: 10941–10953. [DOI] [PMC free article] [PubMed] [Google Scholar]
- 5.Cloer EW, Goldfarb D, Schrank TP, et al. NRF2 Activation in Cancer: From DNA to Protein. Cancer Res 2019; 79: 889–898. [DOI] [PMC free article] [PubMed] [Google Scholar]
- 6.Yamamoto T, Suzuki T, Kobayashi A, et al. Physiological significance of reactive cysteine residues of Keap1 in determining Nrf2 activity. Mol Cell Biol 2008; 28: 2758–2770. [DOI] [PMC free article] [PubMed] [Google Scholar]
- 7.McMahon M, Itoh K, Yamamoto M, et al. Keap1-dependent proteasomal degradation of transcription factor Nrf2 contributes to the negative regulation of antioxidant response element-driven gene expression. J Biol Chem 2003; 278: 21592–21600. [DOI] [PubMed] [Google Scholar]
- 8.Zhang DD, Hannink M. Distinct cysteine residues in Keap1 are required for Keap1-dependent ubiquitination of Nrf2 and for stabilization of Nrf2 by chemopreventive agents and oxidative stress. Mol Cell Biol 2003; 23: 8137–8151. [DOI] [PMC free article] [PubMed] [Google Scholar]
- 9.Itoh K, Chiba T, Takahashi S, et al. An Nrf2/small Maf heterodimer mediates the induction of phase II detoxifying enzyme genes through antioxidant response elements. Biochem Biophys Res Commun 1997; 236: 313–322. [DOI] [PubMed] [Google Scholar]
- 10.Gao J, Aksoy BA, Dogrusoz U, et al. Integrative analysis of complex cancer genomics and clinical profiles using the cBioPortal. Sci Signal 2013; 6: pl1. [DOI] [PMC free article] [PubMed] [Google Scholar]
- 11.Cerami E, Gao J, Dogrusoz U, et al. The cBio cancer genomics portal: an open platform for exploring multidimensional cancer genomics data. Cancer Discov 2012; 2: 401–404. [DOI] [PMC free article] [PubMed] [Google Scholar]
- 12.Du P, Huang P, Huang X, et al. Comprehensive genomic analysis of Oesophageal Squamous Cell Carcinoma reveals clinical relevance. Sci Rep 2017; 7: 15324. [DOI] [PMC free article] [PubMed] [Google Scholar]
- 13.Song Y, Li L, Ou Y, et al. Identification of genomic alterations in oesophageal squamous cell cancer. Nature 2014; 509: 91–95. [DOI] [PubMed] [Google Scholar]
- 14.Network CGAR, University AWGA, Agency BC, et al. Integrated genomic characterization of oesophageal carcinoma. Nature 2017; 541: 169–175. [DOI] [PMC free article] [PubMed] [Google Scholar]
- 15.Kim YR, Oh JE, Kim MS, et al. Oncogenic NRF2 mutations in squamous cell carcinomas of oesophagus and skin. J Pathol 2010; 220: 446–451. [DOI] [PubMed] [Google Scholar]
- 16.Network CGA. Comprehensive genomic characterization of head and neck squamous cell carcinomas. Nature 2015; 517: 576–582. [DOI] [PMC free article] [PubMed] [Google Scholar]
- 17.Rojo de la Vega M, Chapman E, Zhang DD. NRF2 and the Hallmarks of Cancer. Cancer Cell 2018; 34: 21–43. [DOI] [PMC free article] [PubMed] [Google Scholar]
- 18.DeNicola GM, Karreth FA, Humpton TJ, et al. Oncogene-induced Nrf2 transcription promotes ROS detoxification and tumorigenesis. Nature 2011; 475: 106–109. [DOI] [PMC free article] [PubMed] [Google Scholar]
- 19.Cheon DJ, Orsulic S. Mouse models of cancer. Annu Rev Pathol 2011; 6: 95–119. [DOI] [PubMed] [Google Scholar]
- 20.Wakabayashi N, Itoh K, Wakabayashi J, et al. Keap1-null mutation leads to postnatal lethality due to constitutive Nrf2 activation. Nat Genet 2003; 35: 238–245. [DOI] [PubMed] [Google Scholar]
- 21.Ramos-Gomez M, Kwak MK, Dolan PM, et al. Sensitivity to carcinogenesis is increased and chemoprotective efficacy of enzyme inducers is lost in nrf2 transcription factor-deficient mice. Proc Natl Acad Sci U S A 2001; 98: 3410–3415. [DOI] [PMC free article] [PubMed] [Google Scholar]
- 22.Fahey JW, Haristoy X, Dolan PM, et al. Sulforaphane inhibits extracellular, intracellular, and antibiotic-resistant strains of Helicobacter pylori and prevents benzo[a]pyrene-induced stomach tumors. Proc Natl Acad Sci U S A 2002; 99: 7610–7615. [DOI] [PMC free article] [PubMed] [Google Scholar]
- 23.Xu C, Huang MT, Shen G, et al. Inhibition of 7,12-dimethylbenz(a)anthracene-induced skin tumorigenesis in C57BL/6 mice by sulforaphane is mediated by nuclear factor E2-related factor 2. Cancer Res 2006; 66: 8293–8296. [DOI] [PubMed] [Google Scholar]
- 24.Osburn WO, Karim B, Dolan PM, et al. Increased colonic inflammatory injury and formation of aberrant crypt foci in Nrf2-deficient mice upon dextran sulfate treatment. Int J Cancer 2007; 121: 1883–1891. [DOI] [PubMed] [Google Scholar]
- 25.Khor TO, Huang MT, Prawan A, et al. Increased susceptibility of Nrf2 knockout mice to colitis-associated colorectal cancer. Cancer Prev Res (Phila) 2008; 1: 187–191. [DOI] [PMC free article] [PubMed] [Google Scholar]
- 26.Ohkoshi A, Suzuki T, Ono M, et al. Roles of Keap1-Nrf2 system in upper aerodigestive tract carcinogenesis. Cancer Prev Res (Phila) 2013; 6: 149–159. [DOI] [PubMed] [Google Scholar]
- 27.Taguchi K, Maher JM, Suzuki T, et al. Genetic analysis of cytoprotective functions supported by graded expression of Keap1. Mol Cell Biol 2010; 30: 3016–3026. [DOI] [PMC free article] [PubMed] [Google Scholar]
- 28.Schäfer M, Dütsch S, auf dem Keller U, et al. Nrf2 establishes a glutathione-mediated gradient of UVB cytoprotection in the epidermis. Genes Dev 2010; 24: 1045–1058. [DOI] [PMC free article] [PubMed] [Google Scholar]
- 29.Schäfer M, Farwanah H, Willrodt AH, et al. Nrf2 links epidermal barrier function with antioxidant defense. EMBO Mol Med 2012; 4: 364–379. [DOI] [PMC free article] [PubMed] [Google Scholar]
- 30.Suzuki T, Seki S, Hiramoto K, et al. Hyperactivation of Nrf2 in early tubular development induces nephrogenic diabetes insipidus. Nat Commun 2017; 8: 14577. [DOI] [PMC free article] [PubMed] [Google Scholar]
- 31.Taicher GZ, Tinsley FC, Reiderman A, et al. Quantitative magnetic resonance (QMR) method for bone and whole-body-composition analysis. Anal Bioanal Chem 2003; 377: 990–1002. [DOI] [PubMed] [Google Scholar]
- 32.Freemerman AJ, Zhao L, Pingili AK, et al. Myeloid. J Immunol 2019; 202: 1265–1286. [DOI] [PMC free article] [PubMed] [Google Scholar]
- 33.Fu J, Xiong Z, Huang C, et al. Hyperactivity of the transcription factor Nrf2 causes metabolic reprogramming in mouse esophagus. J Biol Chem 2019; 294: 327–340. [DOI] [PMC free article] [PubMed] [Google Scholar]
- 34. https://gdac.broadinstitute.org/. Available from: https://gdac.broadinstitute.org/
- 35.Colaprico A, Silva TC, Olsen C, et al. TCGAbiolinks: an R/Bioconductor package for integrative analysis of TCGA data. Nucleic Acids Res 2016; 44: e71. [DOI] [PMC free article] [PubMed] [Google Scholar]
- 36.Koboldt DC, Chen K, Wylie T, et al. VarScan: variant detection in massively parallel sequencing of individual and pooled samples. Bioinformatics 2009; 25: 2283–2285. [DOI] [PMC free article] [PubMed] [Google Scholar]
- 37.Koboldt DC, Zhang Q, Larson DE, et al. VarScan 2: somatic mutation and copy number alteration discovery in cancer by exome sequencing. Genome Res 2012; 22: 568–576. [DOI] [PMC free article] [PubMed] [Google Scholar]
- 38. [26/07/2019]. http://varscan.sourceforge.net. Available from: http://varscan.sourceforge.net Last accessed.
- 39.R Core Team. R: A Language and Environment for Statistical Computing. (Version 3.5. 2) Foundation for Statistical Computing, Vienna, Austria, 2018. [Google Scholar]
- 40.Wickham H ggplot2: Elegant Graphics for Data Analysis. (2nd edn). Springer-Verlag; New York, 2016; 1–260. [Google Scholar]
- 41.Tong KI, Katoh Y, Kusunoki H, et al. Keap1 recruits Neh2 through binding to ETGE and DLG motifs: characterization of the two-site molecular recognition model. Mol Cell Biol 2006; 26: 2887–2900. [DOI] [PMC free article] [PubMed] [Google Scholar]
- 42.Campbell JD, Yau C, Bowlby R, et al. Genomic, pathway network, and immunologic features distinguishing squamous carcinomas. Cell Rep 2018; 23: 194–212.e196. [DOI] [PMC free article] [PubMed] [Google Scholar]
- 43.Shibata T, Ohta T, Tong KI, et al. Cancer related mutations in NRF2 impair its recognition by Keap1-Cul3 E3 ligase and promote malignancy. Proc Natl Acad Sci U S A 2008; 105: 13568–13573. [DOI] [PMC free article] [PubMed] [Google Scholar]
- 44.Wang X, Zinkel S, Polonsky K, et al. Transgenic studies with a keratin promoter-driven growth hormone transgene: prospects for gene therapy. Proc Natl Acad Sci U S A 1997; 94: 219–226. [DOI] [PMC free article] [PubMed] [Google Scholar]
- 45.Liu X, Krawczyk E, Suprynowicz FA, et al. Conditional reprogramming and long-term expansion of normal and tumor cells from human biospecimens. Nat Protoc 2017; 12: 439–451. [DOI] [PMC free article] [PubMed] [Google Scholar]
- 46.Jamal-Hanjani M, Wilson GA, McGranahan N, et al. Tracking the Evolution of Non-Small-Cell Lung Cancer. N Engl J Med 2017; 376: 2109–2121. [DOI] [PubMed] [Google Scholar]
- 47.Rada P, Rojo AI, Offergeld A, et al. WNT-3A regulates an Axin1/NRF2 complex that regulates antioxidant metabolism in hepatocytes. Antioxid Redox Signal 2015; 22: 555–571. [DOI] [PMC free article] [PubMed] [Google Scholar]
- 48.Brigelius-Flohé R, Kipp AP. Selenium in the redox regulation of the Nrf2 and the Wnt pathway. Methods Enzymol 2013; 527: 65–86. [DOI] [PubMed] [Google Scholar]
- 49.Chau YY, Bandiera R, Serrels A, et al. Visceral and subcutaneous fat have different origins and evidence supports a mesothelial source. Nat Cell Biol 2014; 16: 367–375. [DOI] [PMC free article] [PubMed] [Google Scholar]
- 50.Einstein FH, Atzmon G, Yang XM, et al. Differential responses of visceral and subcutaneous fat depots to nutrients. Diabetes 2005; 54: 672–678. [DOI] [PubMed] [Google Scholar]
- 51.Schneider KS, Chan JY. Emerging role of Nrf2 in adipocytes and adipose biology. Adv Nutr 2013; 4: 62–66. [DOI] [PMC free article] [PubMed] [Google Scholar]
- 52.Hepler C, Shan B, Zhang Q, et al. Identification of functionally distinct fibro-inflammatory and adipogenic stromal subpopulations in visceral adipose tissue of adult mice. Elife 2018; 7. [DOI] [PMC free article] [PubMed] [Google Scholar]
- 53.Moir L, Bentley L, Cox RD. Comprehensive Energy Balance Measurements in Mice. Curr Protoc Mouse Biol 2016; 6: 211–222. [DOI] [PubMed] [Google Scholar]
Associated Data
This section collects any data citations, data availability statements, or supplementary materials included in this article.