Abstract
Nude mice are important in vivo model for characterization of cell malignancy behavior; however, many cancer cells fail to form tumors in it. Understanding this defective mechanism may provide novel insights into tumorigenesis and how tumor cells escape innate immunity. Whole-genome sequencing was conducted on two gastric cancer (GC) cells, BGC823 and AGS, which do and do not form tumors in nude mice, to identify their genomic differences relevant to natural killer (NK) cells. We found that the tumorigenic capacity of human GC cell lines was dependent on the recruitment and activation of NK cells in xenograft tumors. We used whole-genome sequence (WGS) on GC cell lines to identify potential genes controlling susceptibility to NK-mediated killing. The tumorigenic cell line BGC823 expressed high levels of HLA-I because of copy gain and was resistant to NK cell killing. In contrast, another cell line AGS expressing low levels of HLA-I with activated NKp30/MAPK/IL-12 (interleukin-12) or IL-2 (interleukin-2) pathway was susceptible to NK lysis. Treatment of tumor bearing mice with systemic administration of IL-12 in combination with intratumor injection of anti-HLA-I antibody significantly increased NK cell recruitment into xenograft tumors, which became sensitive to NK killing, resulting in reduced tumor progression. In human GC specimens, decreased HLA-I expression and increased NK cells surrounding tumor cells were correlated with decreased metastasis potential and better prognosis of patients. Our results provide a mechanistic basis for GC cells to escape NK lysis and a promising prospect of NK immunotherapy for GC cells.
INTRODUCTION
Nude mice are common in vivo models for investigating human cancer cell lines with regard to functions such as cell growth, metastasis and the expressed genes involved. Many human cancer cell lines are able to form tumors in this murine model because nude mice, absent thymus, result in a defective adaptive immune system. However, portions of cancer cell lines are not able to form tumors; we hypothesize that this effect might result from the innate immune system in nude mice. The innate immune system, including NK cells, is the first line of defense against infection and tumors by mediating immediate immune responses.
NK cells constitute the first line of host defense against tumors and NK immunotherapy has been used in the clinic.1–5 Metastasis and recurrence are the primary causes of mortality and key challenges for gastric cancer (GC) therapy. Compared with other organs, stomach has a very rich network of lymph vessels and draining lymph nodes. Patients with advanced GC suffer from distant metastasis mainly through the lymph system. As immune cells in lymph nodes, their effective responses may decrease the potential of GC metastasis. However, many tumor cells evade NK cell killing with poorly known mechanisms. It has been reported that a high level of HLA by tumor cells mask their recognition by NK cells by interacting with inhibitory receptors expressed by NK cells.6 However, the mechanism that regulates the expression of HLA by tumor cells is not clear. Effects have been made to improve the effect of NK immunotherapy using allogeneic NK cells or silencing inhibitory receptors expressed by NK cells with the potential to induce autoimmune diseases.7,8 Therefore, remodeling of tumor cells may maximize the efficiency of immune therapy and minimize the undesirable side effect.
Malignant transformation of the cells is associated with many genetic and epigenetic changes in the cells. Increased copy number variations (CNVs) have been shown to promote the tumorigenicity of transformed cells.9,10 In individual lung cancer patients, CNVs were more consistent and reproducible than point mutations in the malignant cells.11 We therefore conducted whole-genome sequence (WGS) to compare the differences in GC cell lines linked to their susceptibility to NK cell lysis. We found that the tumorigenecity of human GC cell lines in nude mice was dependent on the sensitivity to cytotoxicity of NK cells. We further attempt to clarify the mechanisms of human GC cell escape from NK immunoresponse in nude mice and observed an increased HLA-I copy number in human GC cells in association with resistance to NK cell killing. Reduction of HLA-I levels and activation of NKp30/MAPK/IL-12 (IL-2) pathway in xenograft tumors markedly inhibited tumor progression with enhanced NK cell recruitment into the tumor. Our study thus demonstrates the possibility to remodel GC cells to improve the efficiency of NK immune therapy.
RESULTS
Different sensitivity of BGC823 and AGS cells to NK cell cytotoxicity Following the injection of 0.25 × 10⁶ and 1 × 10⁶ of BGC823 cells, tumors formed in nude mice after 11 and 3 days, respectively. However, injection of another GC cell line AGS did not result in the formation tumors in nude mice (Supplementary Figure S1 and Supplementary Table S1).
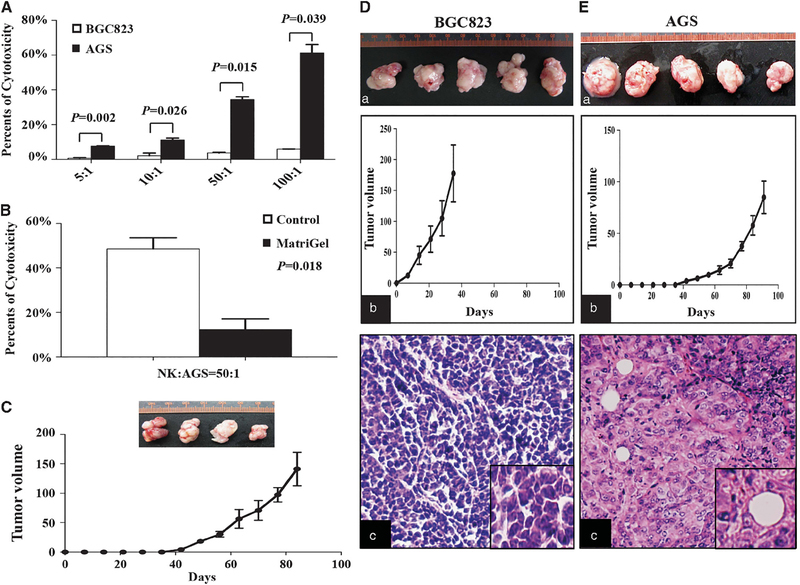
We then measured the lytic potential of NK cells, extracted from nude mice, to BGC823 and AGS cells. NK cells did not lyse BGC823 cells but lysed AGS cells as they were dependent on the number of NK cells (Figure 1A).
Figure 1.
Cytotoxicity of NK cells towards BGC823 and AGS cells. (A) NK cell cytotoxicity assays for BGC823 and AGS cells treated with different numbers of NK cells. Data are means±s.d. (B) Cytotoxicity assays of AGS cells coated with or without Matrigel. Data are means ±s.d. (C) Tumors of AGS cells coated with Matrigel in nude mice (upper) and tumor growth curves (lower). (D and E) Tumorigenicity of BGC823 (D) and AGS cells (E) in NOD-SCID mice. (a) The photograph of tumors. (b) Tumor growth curves. (c) HE staining of xenograft tumor tissues.
To confirm that the cytotoxicity of NK cells was the cause of the failure of AGS cells to form tumors in nude mice, we coated AGS cells with Matrigel to avoid contact with NK cells and found a significantly reduced sensitivity to NK cell lysis (Figure 1B). When AGS cells coated with Matrigel were injected into nude mice, tumors were formed in 80% of the mice (Figure 1C). Both BGC823 and AGS cells formed tumors in 100% NOD-SCID (nonobese diabetic/severe-combined immunodeficiency) mice that lacked adaptive immunity and NK cells (Figures 1D–a and E–a). The growth ability of AGS cells was relatively lower compared with BGC823 cells (Figures 1D–b and E–b). The hematoxylin–eosin (HE) staining showed that the morphology feature of the xenograft tumor from those two cell lines was different from each other (Figures 1D–c and E–c). These results demonstrate the fact that the cytotoxicity of NK cells prevented AGS cells from forming tumors in nude mice.
CNVs of HLA based on WGS profiling of BGC823 and AGS cells
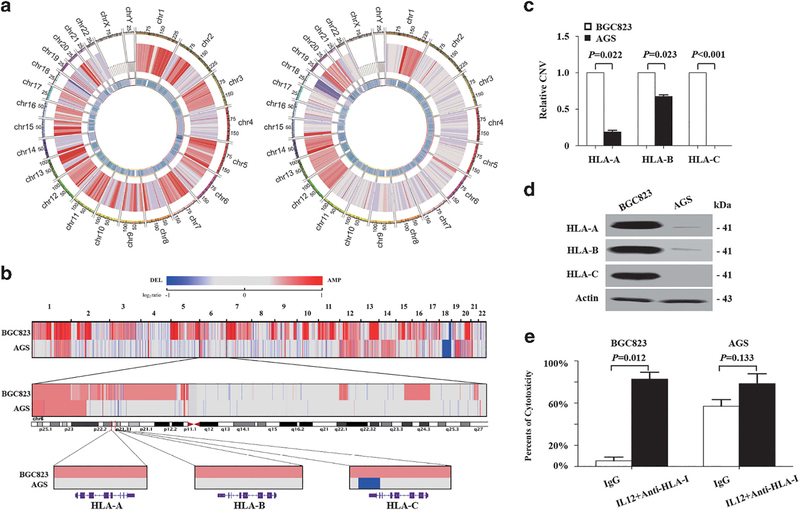
To compare the differences in GC cell lines linked to their susceptibility to NK cell lysis, we performed WGS on BGC823 and AGS cells with 42.70- and 41.49-fold haploid coverage and analyzed CNVs. Both cell lines gained at 1q, 12q, 13p, 14p, 15p, 20q and 21p but lost at 18q. However, two cell lines were different from each other in some regions, such as HLA-I located 6p21.32 region (Figure 2a and Supplementary Table S2).
Figure 2.
Characterization of HLA-I genes in BGC823 and AGS cells based on whole-genome sequencing data. (a) CNV of BGC823 (left) and AGS cells (right). From the outer to the inner ring: coordinate of chromosome, CNVs and regional depth. (b) Upper, CNV of BGC823 and AGS cells. Gains are indicated by red and losses in blue (see also Supplementary Table S2); middle, CNV of chromosome 6; lower, CNV of HLA-I in BGC823 and AGS cells. (c) qPCR assays of HLA-I in BGC823 and AGS cells. Data are means±s.d. (d) Western blot analysis of HLA-I in BGC823 and AGS cells. (e) NK cell cytotoxicity assays of BGC823 and AGS cells treated with IL-12 and a mixture of specific antibodies against HLA-I or IgG.
As HLA was related to tumor cell sensitivity to NK cells, the copy number of classic HLA-I, including HLA-A, -B and -C, was analyzed in GC cell lines. HLA-I was amplified in BGC823 cells. However, in AGS cells, HLA-C had a 1-kb deletion in exon 8, whereas copy numbers of HLA-A and -B were unchanged (Figure 2b). The results were validated by quantitative PCR (qPCR) (Figure 2c) and HLA-I protein was increased in BGC823 cells as compared with AGS cells (Figure 2d).
High expression levels of classic HLA-I in BGC823 cells allowed for evasion from NK cell cytotoxicity
We blocked HLA-A, -B and -C proteins expressed by tumor cells with mix-specific antibodies. In this condition, NK cell still did not lyse BGC823 cells. However, NK cells lysed BGC823 cells when interleukin-12 (IL-12), which can activate NK cells, and HLA-I antibodies were present in the culture media (Figure 2e). For AGS cells, there was no difference in sensitivity to NK lysis between the control and treatment groups. These data indicated that AGS cell could activate NK cells, and this activation is necessary for the cytotoxicity of NK cells.
The expression of proteins encoded by CNVs with NK cell cytotoxicity-related genes
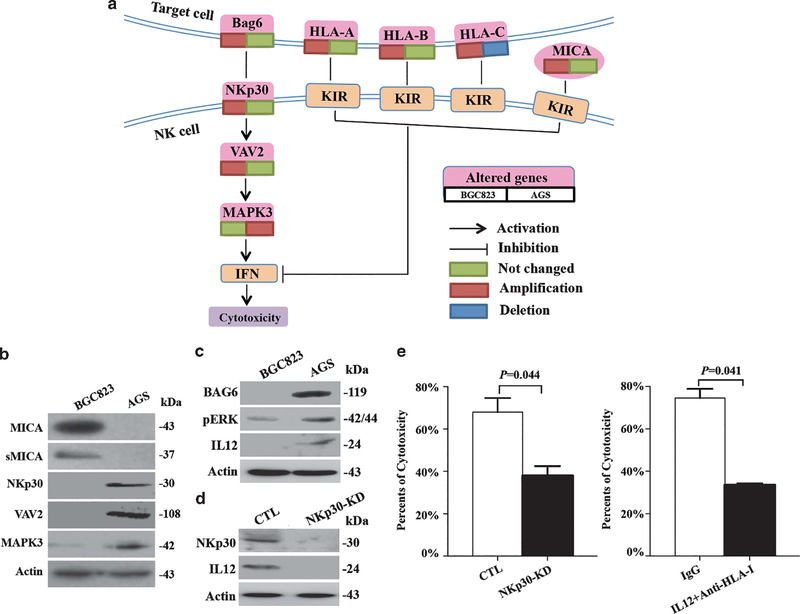
To identify the mechanism that AGS cells activate NK cells, other CNVs in NK cell cytotoxicity-related genes were analyzed by Kyoto Encyclopedia of Genes and Genomes (KEGG) pathway, and MICA, NKp30 (also known as NCR3), VAV2 and MAPK3 were identified (Figure 3a). The expression levels of MICA protein and its secreted form, which acted as HLA-I, were higher in BGC823 cells compared with AGS cells (Figure 3b). The expression of NKp30 was detected in AGS but not in BGC823 cells. NKp30 downstream genes VAV2 and MAPK3 were also expressed at higher levels in AGS cells compared with BGC823 cells (Figure 3b).
Figure 3.
Characterization of NK cell cytotoxicity-related genes in BGC823 and AGS cells. (a) The signaling pathway of NK cell-mediated cytotoxicity. (b) Western blot analysis of NK cell cytotoxicity-related proteins in BGC823 and AGS cells. (c) Western blot analysis of pERK, Bag6 and IL-12 in BGC823 and AGS cells. (d) Western blot analysis of NKp30 and IL-12 when NKp30 was knocked down in AGS cells. (e) Cytotoxicity assay monitoring for NK cell lysis of AGS cells when NKp30 was knocked down (left) or when IL-12 was blocked by a specific antibody (right).
These results show that classic HLA-I and MICA, which inhibit NK cell recognition, were overexpressed in tumorigenic BGC823 cells. In contrast, the levels of NKp30 and its downstream molecular were absent in BGC823 cells.
Active NKp30/VAV2/MAPK3/IL-12 pathway promotes the cytotoxicity of NK cells to AGS cells
We identified that both NKp30 and its ligand Bag6 are expressed by AGS cells but not by BGC823 cells (Figure 3c). The activation status of MAPK pathway, the downstream signaling of NKp30, was then examined. We found that the expression of pERK was significantly higher in AGS cells compared with that in BGC823 cells (Figure 3c). Consistent with this observation, IL-12 was also overexpressed in AGS cells, which was decreased when NKp30 was depleted by short hairpin RNA interference (Figure 3d).
It appears that ‘NKp30/VAV2/MAPK3/IL-12’ pathway exists in GC cells and may regulate the activation of NK cells, as cytotoxicity assay showed that NK cells lysed less AGS cells when NKp30 or IL-12 was inhibited (Figure 3e). Thus, AGS cells are able to express IL-12 by the activation of NKp30/VAV2/MAPK3 pathway, which increases the cytotoxicity of NK cells by activating NK cells.
Combination of classic HLA-I and NKp30/MAPK3/IL-12 predicts progression and metastatic potential in GC cells and specimens
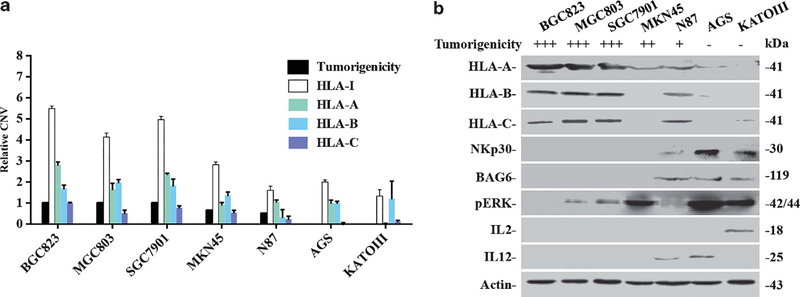
To detect the effect of HLA-I and NKp30/MAPK3/IL-12 on predicting progression and metastatic potential in GC, we first examined CNVs of classic HLA-I in five additional GC cell lines with different tumorigenic capacities in nude mice. The GC cell lines MGC803, SGC7901 and MKN45 exhibited high tumorigenicity, whereas N87 and KATOIII cell lines exhibited lower tumorigenicity. As shown in Figure 4a, HLA-A, -B and -C (or a sum as HLA-I) were amplified in cell lines with higher tumorigenicity as compared with low tumorigenicity cell lines. Consistent with CNVs, higher protein expression of HLA-I was seen in cell lines with higher tumorigenicity. On the contrary, higher protein expression of Bag6, NKp30, pERK and IL-12/IL-2 appeared in cell lines having low tumorigenicities (Figure 4b).
Figure 4.
Expression patterns of HLA-I and the NKp30/VAV2/MAPK3/IL-12 pathway in GC cell lines. (a) qPCR detected relative CNV of HLA-A, B and C in GC cell lines. The value of HLA-I is the sum value of HLA-A, -B and -C. Owing to the copy number of HLA-A, -B was not changed in AGS cells, the relative copy number of HLA-A, -B was compared with AGS cells; for HLA-C, as it was lost in AGS cells, the relative copy number of HLA-C was compared with BGC823 cells. (b) Western blot analysis of NK cell cytotoxicity-related proteins in GC cell lines with high and low tumorigenic capacities.
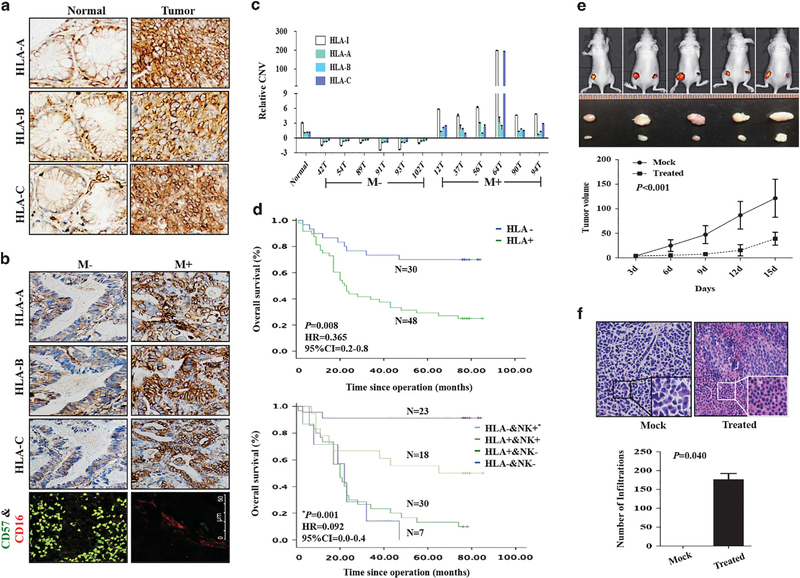
We further conducted immunohistochemical analysis of 100 human GC specimens to assess the clinical relevance of HLA-I to tumor progression. We found that HLA-I was more highly expressed in tumor tissues compared with adjacent normal tissues (Figure 5a and Table 1). Further, in tumor specimen, low expression of classic HLA-I was associated with non-metastatic tumors (including lymph node and distant metastasis) (Figure 5b and Table 2). Because CNVs of HLA-I are consistent with their protein expression level, we examined the link of CNVs of classic HLA-I to GC metastasis in patients. We found that HLA-A, -B and -C (or a sum as HLA-I) were lost in tumor tissues without metastasis, in contrast to amplification in tumor tissues with metastasis (Figure 5c).
Figure 5.
Expression patterns of HLA-I in GC-matched tissues. (a) Immunohistochemistry of HLA-I in GC-matched tissues. (b) Immunohistochemistry of HLA-I and NK cells in GC tissues with or without metastasis. (c) qPCR detected relative CNV of HLA-A, -B and -C in GC-matched tissues from patients with or without metastasis. CNVs in tumors was normalized by matched adjacent normal tissues. The value of HLA-I is the sum value of HLA-A, -B and -C. (d, upper) Survival analysis of HLA-I. P-value, hazard ratio (HR) and 95% confidence interval (CI) were obtained from the multivariate analysis (Supplementary Table S3). (Lower) Survival analysis of HLA-I combined with NK cells. P-value, HR and 95% CI were obtained from the multivariate analysis (Supplementary Table S4). (e, upper) Nude mice of subcutaneous injection with BGC823 treated with IL-12 and antibody against HLA-I (right) or IgG (left). (Lower) Tumor growth curves. (f, upper left) HE staining of xenograft tumor tissues from mock group. Inner, the enlargement of tumor cells; upper right, HE staining of xenograft tumor tissues from treated group. Inner, the enlargement of NK cells around the tumor cells; (f, lower), the number of NK cells around the tumor cells in mock and treated groups.
Table 1.
Expression of HLA-I protein detected in GC tissues by IHC analysis
| Histology |
HLA-I expression |
Total cases | P-value | |
|---|---|---|---|---|
| Negative | Positive | |||
| Normal | 62 (62.0%) | 38 (38.0%) | 100 | 0.001 |
| Tumor | 38 (38.0%) | 62 (62.0%) | 100 | |
Abbreviations: GC, gastric cancer; IHC, immunohistochemistry.
Table 2.
Relationship between metastasis and molecular signature in GC patients
| Signature |
Metastasis |
Total cases | P-value | |
|---|---|---|---|---|
| − | + | |||
| HLA-I expressions | ||||
| Positive | 9 (14.5%) | 53 (85.5%) | 62 | 0.005 |
| Negative | 15 (39.5%) | 23 (60.5%) | 38 | |
| Low expression of HLA-I and accumulation of NK cell | ||||
| Yes | 14 (50.0%) | 14 (50.0%) | 28 | < 0.001 |
| No | 10 (13.9%) | 62 (86.1%) | 72 | |
Abbreviations: GC, gastric cancer; NK, natural killer.
Analysis of patients’ survival showed that lowly expressed classic HLA-I was an independent factor to predict better prognosis (Figure 5d, upper and Supplementary Table S3). We examined the levels of NK cell infiltration and HLA expression in tumor cells. We found that accumulation of NK cells and lower level expression of classic HLA-I in tumors was strongly associated with non-metastatic tumors (Figure 5b and Table 2). Combining these two signatures together in GC specimens is an independent factor to predict better prognostic factors (Figure 5d lower and Supplementary Table S4).
Targeting HLA-I enhances the effect of NK immunotherapy
The above observations suggest that targeting classic HLA-I may enhance the effect of NK therapy on GC cells. We treated the tumor bearing mice with IL-12 and treated xenograft GC tumor with antibodies against HLA-I to mimic NK immunotherapy. There was a marked inhibition of tumor growth in tumor bearing mice treated systemically with IL-12 and antibodies against HLA-I in xenograft GC tumor (Figure 5e). HE staining showed NK cells (inner) surrounding tumor cells in tumor bearing mice treated systemically with IL-12 and antibodies against HLA-I in xenograft GC tumor (Figure 5f upper), and the number of infiltration was shown in Figure 5f (lower). These results indicate that a combination of IL-12 with antibody against HLA-I enhance the effect of NK cell-mediated GC immunotherapy.
DISCUSSION
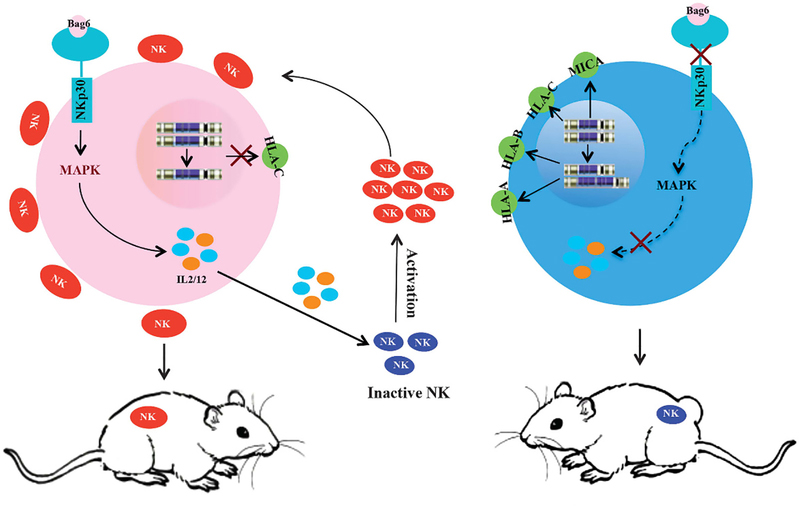
In this study, the mechanism that tumor cells escape the lysis of NK cells was studied by WGS on two GC cell lines with different tumorigenicity. In cancer cell sensitivity to the NK cells, two factors are necessary for the lysis of NK cells: one is the low expression of HLA-I in tumor cells, which results from CNV, and the other is activation of NKp30/VAV2/MAPK3/IL-12 (IL-2) pathway in tumors cells to activate NK cells (Figure 6).
Figure 6.
Schematic representation of the proposed mechanism of NK cell lysis for cancer cells. Two human GC cell lines, AGS and BGC823, were used in this study. As left shown, AGS cells did not express HLA-C due to the loss of DNA copy, and NK cells were activated because of active NKp30/VAV2/MAPK3/IL-12 pathway in AGS cells. As right shown, BGC823 cells highly expressed HLA-I, an inhibitor of NK cell recognition, due to gene amplification, and NK cells were not activated because of lacking NKp30 in BGC823 cells.
HLA-A, -B and -C are located in 6p21.32, which are significantly amplified in BGC823 but absent in AGS cells. In many cancers, gains in 6p21 were associated with advanced disease and poorer patient prognosis.12 Therefore, HLA-I genes, expressed by tumor cell, may have a role on this process, through regulating the tolerance to NK cells lysis.
Not all the target cells with low level of HLA-I are lysed by NK cells; it suggests that there is another active pathway for NK cells. A number of studies have reported that the functions of NK cells are regulated through KIR (killer Ig-like receptor) and activating receptors.13,14 KIR interacts with HLA-I; activating receptors is the NCRs (natural cytotoxicity receptors), which includes NKp30, NKp44 and NKp46.15 Stimulation of NKp30 on NK cells leads to interferon-γ production through the downstream VAV2/MAPK pathways.16 Stimulation of NKp30 on dendritic cells leads to IL-12 production to stimulate NK cells. Although all these previous studies reported that NKp30 was only expressed in immune cells, our results revealed that this gene is also expressed in GC cell lines of the epithelial cell origin, such as AGS and KATOIII. Other researchers also detected NKp30 mRNA in MCF7 breast cancer cells, which lack tumorigenicity in nude mice.17,18 Our present study identified NKp30/VAV2/MAPK3/IL-12 (IL-2) as a novel pathway in GC cells to activate NK cells.
In conclusion, we used WGS to identify copy gains of HLA-I to predict the progression of GC by regulating the tolerance of tumor cells to NK lysis. Our novel findings of NKp30/VAV2/MAPK3/IL-12 (IL-2) pathway in carcinoma cells indicate that tumor cells possess the potential to activate NK cells. More importantly, once the barrier established by HLA-I were dismantled, the effect of the immunotherapy will be improved.
MATERIALS AND METHODS
Cell lines and transfection
BGC823 cells were obtained from Peking University Cancer Hospital/Institute (Beijing, China), AGS cells were purchased from American Type Culture Collection (Manassas, VA, USA) and mycoplasma contamination was tested as negative. BGC823 and AGS cells were cultured in Dulbecco’s modified Eagle’s medium (Gibco-BRL, Grand Island, NY, USA) with 5% or 10% fetal bovine serum, 100 U/ml penicillin and 100 μg/ml streptomycin (Macgene, Beijing, China). Cells were maintained at 37 °C/5% CO2. The sequences of the human NKp30-specific small interfering RNA were, 5′-GGUGGUGGAGAAAGAACAUTT-3′; scrambled short hairpin was transfected into cells as a control.
Tumorigenicity assays
Cells coated with/without Matrigel (BD, San Jose, CA, USA) were subcutaneously injected into the armpit of five nude (BALB/c, 4 weeks old, female) or five NOD-SCID (4 weeks old, female) mice. IgG or mixtures of antibody against HLA-A, -B and -C were injected around the tumor every 3 days. IL-12 was injected from tail vein. Animals were randomized and the experimenter was aware that the animals were divided into two groups but was blinded to the outcome of each group. Animal experiments were performed in accordance with the National Institutes of Health Guide for the Care and Use of Laboratory Animals with protocols approved by the Animal Care and Use Committee at Peking University Cancer Hospital/Institute.
Whole-genome sequence
Paired-ends WGS data were generated. Burrows-Wheeler Aligner was used to align reads to the reference genome (National Center for Biotechnology Information Build 37). CNVs were predicted by ReadDepth,19 with chromosome 4 having two copies in both cells lines, as determined by chromosome karyotyping and sequencing depth distribution. The ratio of each segment was normalized to chromosome 4. CNVs were identified as gain and loss when the log2 ratio was >0.45 and < − 0.45.
Quantitative PCR
DNA was isolated and quantitation of HLA-I was conducted with an ABI PRISM 7300 System (Applied Biosystems, Foster City, CA, USA). CNV of HLA-I was calculated and transformed using the ΔΔCt formula and normalized to LINE-1. The qPCR primer sequence is listed in Supplementary Table S5. Each experiment was repeated three times.
Western immunoblotting
Sodium dodecyl sulfate–polyacrylamide gel electrophoresis and western blots were performed using standard protocols. Antibody binding was detected using smartchemi image analysis system (Sagecreation, Beijing, China). We used antibodies against HLA-A (1913–1; Epitomics, Burlingame, CA, USA), HLA-B (2389–1; Epitomics), HLA-C (5472–1; Epitomics), MICA (T3305; Epitomics), VAV2 (B1241; Anbo, San Francisco, CA, USA), MAPK3 (C11133; Anbo), NKp30 (BS3888; Bioworld, St Louis Park, MN, USA), and pERK (Tyr204) (sc-7383; Santa Cruz Biotechnology, Santa Cruz, CA, USA), Bag6 (6763–1; Epitomics) and actin (A5441; Sigma, St Louis, MO, USA). Each experiment was repeated three times.
NK cell cytotoxicity assays
NK cells were extracted from the spleens of 4-week-old nude mice and purified using a MagCellect Mouse NK Cell Isolation Kit (Magm210; R&D, Minneapolis, MN, USA). NK cell cytotoxicity was analyzed according to the protocol (G1780; Promega, Madison, WI, USA). Each experiment was repeated three times.
Immunofluorescence assays
This experiment was constructed as described previously.20 In brief, the tissue was blocked by 1% bovine serum albumin overnight at 4 °C. Antibody against CD57 (IR647; Dako, Carpinteria, CA, USA) was incubated for 2 h. After washing with phosphate-buffered saline, cells were incubated with fluorescein isothiocyanate-conjugated secondary antibody for 1 h, and then washed in phosphate-buffered saline. Antibody against CD16 (3170; Epitomics) was incubated for 2 h. After washing with phosphate-buffered saline, cells were incubated with tetramethylrhodamine-conjugated secondary antibody for 1 h, and then washed in phosphate-buffered saline. DAPI (4’,6-diamidino-2-phenylindole) was stained for 5 min. The fluorescent image was acquired using a confocal laser-scanning microscope (LSM510; Zeiss, Toronto, ON, Canada) and analyzed with the LSM5 Image Browser program (Carl Zeiss Micro-Imaging, Toronto, ON, Canada).
Immunohistochemistry
Tissue microarrays were obtained from the Beijing Cancer Hospital/Institute and Shanghai Outdo Biotech Co. (Shanghai, China). The sample size was dependent on the positive rate of HLA-I in our preliminary experiment and then calculated by using the PASS software (NCSS, East Kaysville, UT, USA). Our study was conducted in accordance with the Declaration of Helsinki, and was approved by the Institutional Ethical Standards Committee with informed consent from patients. The pathologist who was blinded for the purpose of this study read the microarray and gave the report.
Statistical analysis
The t-test or one-way analysis of variance was used to determine significant differences between groups. Two-way analysis of variance was used to determine significant differences between different treatments. Using the SPSS 13.0 software (SPSS Inc., Chicago, IL, USA), the significance of immunohistochemistry images was evaluated with the X2 test. Survival was analyzed using the Kaplan–Meier method. Cox proportional hazard regression model was also used. P < 0.05 was considered to be significant.
Supplementary Material
ACKNOWLEDGEMENTS
We thank Dr Richard Ascione (Department of Biochemistry and Molecular Biology, Medical School of Georgetown University USA) and Dr Laurie Goodman for critical reviewing and editing of the manuscript. This work was supported by the Ministry of Science and Technology of China (863 program, grants 2012AA02A203, 2012AA02A504) and Beijing Nova program (XXJH2015037, No.Z151100000315069).
Footnotes
CONFLICT OF INTEREST
The authors declare no conflict of interest.
REFERENCES
- 1.Cheng M, Chen Y, Xiao W, Sun R, Tian Z. NK cell-based immunotherapy for malignant diseases. Cell Mol Immunol 2013; 10: 230–252. [DOI] [PMC free article] [PubMed] [Google Scholar]
- 2.Farhan S, Lee DA, Champlin RE, Ciurea SO. NK cell therapy: targeting disease relapse after hematopoietic stem cell transplantation. Immunotherapy 2012; 4: 305–313. [DOI] [PMC free article] [PubMed] [Google Scholar]
- 3.Langers I, Renoux VM, Thiry M, Delvenne P, Jacobs N. Natural killer cells: role in local tumor growth and metastasis. Biologics 2012; 6: 73–82. [DOI] [PMC free article] [PubMed] [Google Scholar]
- 4.Mogensen TH. Pathogen recognition and inflammatory signaling in innate immune defenses. Clin Microbiol Rev 2009; 22: 240–273; table of contents. [DOI] [PMC free article] [PubMed] [Google Scholar]
- 5.Sun JC, Lanier LL. NK cell development, homeostasis and function: parallels with CD8(+) T cells. Nat Rev Immunol 2011; 11: 645–657. [DOI] [PMC free article] [PubMed] [Google Scholar]
- 6.Smyth MJ, Hayakawa Y, Takeda K, Yagita H. New aspects of natural-killer-cell surveillance and therapy of cancer. Nat Rev Cancer 2002; 2: 850–861. [DOI] [PubMed] [Google Scholar]
- 7.Iliopoulou EG, Kountourakis P, Karamouzis MV, Doufexis D, Ardavanis A, Baxevanis CN et al. A phase I trial of adoptive transfer of allogeneic natural killer cells in patients with advanced non-small cell lung cancer. Cancer Immunol Immunother 2010; 59: 1781–1789. [DOI] [PMC free article] [PubMed] [Google Scholar]
- 8.Imai C, Iwamoto S, Campana D. Genetic modification of primary natural killer cells overcomes inhibitory signals and induces specific killing of leukemic cells. Blood 2005; 106: 376–383. [DOI] [PMC free article] [PubMed] [Google Scholar]
- 9.Haraksingh RR, Snyder MP. Impacts of variation in the human genome on gene regulation. J Mol Biol 2013; 425: 3970–3977. [DOI] [PubMed] [Google Scholar]
- 10.Cappuzzo F, Hirsch FR, Rossi E, Bartolini S, Ceresoli GL, Bemis L et al. Epidermal growth factor receptor gene and protein and gefitinib sensitivity in non-small-cell lung cancer. J Natl Cancer Inst 2005; 97: 643–655. [DOI] [PubMed] [Google Scholar]
- 11.Ni X, Zhuo M, Su Z, Duan J, Gao Y, Wang Z et al. Reproducible copy number variation patterns among single circulating tumor cells of lung cancer patients. Proc Natl Acad Sci USA 2013; 110: 21083–21088. [DOI] [PMC free article] [PubMed] [Google Scholar]
- 12.Santos GC, Zielenska M, Prasad M, Squire JA. Chromosome 6p amplification and cancer progression. J Clin Pathol 2007; 60: 1–7. [DOI] [PMC free article] [PubMed] [Google Scholar]
- 13.Lanier LL. On guard—activating NK cell receptors. Nat Immunol 2001; 2: 23–27. [DOI] [PubMed] [Google Scholar]
- 14.Liu Y, Mullbacher A. Astrocytes are not susceptible to lysis by natural killer cells. J Neuroimmunol 1988; 19: 101–110. [DOI] [PubMed] [Google Scholar]
- 15.Hecht ML, Rosental B, Horlacher T, Hershkovitz O, De Paz JL, Noti C et al. Natural cytotoxicity receptors NKp30, NKp44 and NKp46 bind to different heparan sulfate/heparin sequences. J Proteome Res 2009; 8: 712–720. [DOI] [PubMed] [Google Scholar]
- 16.Hsieh CL, Nagasaki K, Martinez OM, Krams SM. NKp30 is a functional activation receptor on a subset of rat natural killer cells. Eur J Immunol 2006; 36: 2170–2180. [DOI] [PMC free article] [PubMed] [Google Scholar]
- 17.Ponnampalam AP, Gargett CE, Rogers PA. Identification and hormonal regulation of a novel form of NKp30 in human endometrial epithelium. Eur J Immunol 2008; 38: 216–226. [DOI] [PubMed] [Google Scholar]
- 18.Srivastava BI, Srivastava MD. Expression of natural cytotoxicity receptors NKp30, NKp44, and NKp46 mRNAs and proteins by human hematopoietic and nonhematopoietic cells. Leuk Res 2006; 30: 37–46. [DOI] [PubMed] [Google Scholar]
- 19.Miller CA, Hampton O, Coarfa C, Milosavljevic A. ReadDepth: a parallel R package for detecting copy number alterations from short sequencing reads. PLoS One 2011; 6: e16327. [DOI] [PMC free article] [PubMed] [Google Scholar]
- 20.Xing R, Li W, Cui J, Zhang J, Kang B, Wang Y et al. Gastrokine 1 induces senescence through p16/Rb pathway activation in gastric cancer cells. Gut 2012; 61: 43–52. [DOI] [PubMed] [Google Scholar]
Associated Data
This section collects any data citations, data availability statements, or supplementary materials included in this article.


