

Abstract
Retinal ganglion cells (RGCs) drive diverse, light-evoked behaviors from conscious visual perception to subconscious, non-image forming behaviors. It is thought that RGCs primarily drive these functions through the release of the excitatory neurotransmitter glutamate. We identified a subset of melanopsin-expressing, intrinsically photosensitive RGCs (ipRGCs) in mice that release the inhibitory neurotransmitter GABA at non-image forming brain targets. GABA release from ipRGCs dampened the sensitivity of both the pupillary light reflex and circadian photoentrainment, shifting the dynamic range of these behaviors to higher light levels. Our results identify an inhibitory RGC population in the retina and provide a circuit-level mechanism that contributes to the relative insensitivity of non-image forming behaviors at low light.
One Sentence Summary:
Here we identify a GABAergic circuit from the eye to the brain that dampens the sensitivity of non-image forming visual behaviors.
Retinal ganglion cells (RGCs) relay light information to over 40 brain areas (1–3), giving rise to both conscious visual perception (image forming vision) as well as subconscious “non-image forming” functions such as circadian photoentrainment and the pupillary light reflex (PLR) (4, 5). Currently, RGCs are thought to mediate these functions by synaptic release of the excitatory neurotransmitter glutamate onto their postsynaptic targets. Previous immunohistochemical evidence has suggested the presence of inhibitory, GABAergic RGCs in several mammalian species (6–9). However, the identity of GABAergic RGCs and their function in visual behavior has remained elusive.
To label GABAergic projections from the retina to the brain, we utilized a mouse line, Gad2-IRES-Cre, in which Cre recombinase is co-expressed with the GABA synthesis enzyme Gad2 (10). We then made unilateral eye injections of an adeno-associated virus (AAV) that drives Cre-dependent expression of the fluorescent reporter tdTomato (AAV2/hSyn-FLEX-Chrimson-tdTomato) (Fig. 1A). Because RGCs are the only retinal neurons that project to the brain, any labeled tdTomato+ axons in the brain indicate the presence of Gad2-expressing RGCs. We observed tdTomato+ axons that were largely confined to non-image forming brain areas including the suprachiasmatic nucleus (SCN), intergeniculate leaflet (IGL) and the ventral lateral geniculate nucleus (vLGN), which are involved in circadian entrainment, as well as the ipsilateral shell of the olivary pretectal nucleus (OPN), which is involved in the PLR (14/14 animals; Fig. 1B–D) (11–15). No labeling was observed in the brains of WT animals injected with the same Cre-dependent virus (Fig. S1). We observed less-frequent labeling in image forming structures such as medial, posterior superior colliculus (10/14 animals) and projections to the shell of the contralateral dLGN (9/14 animals) (Fig. S2).
Fig. 1. ipRGCs are a potential source of inhibitory input to non-image forming visual brain areas.
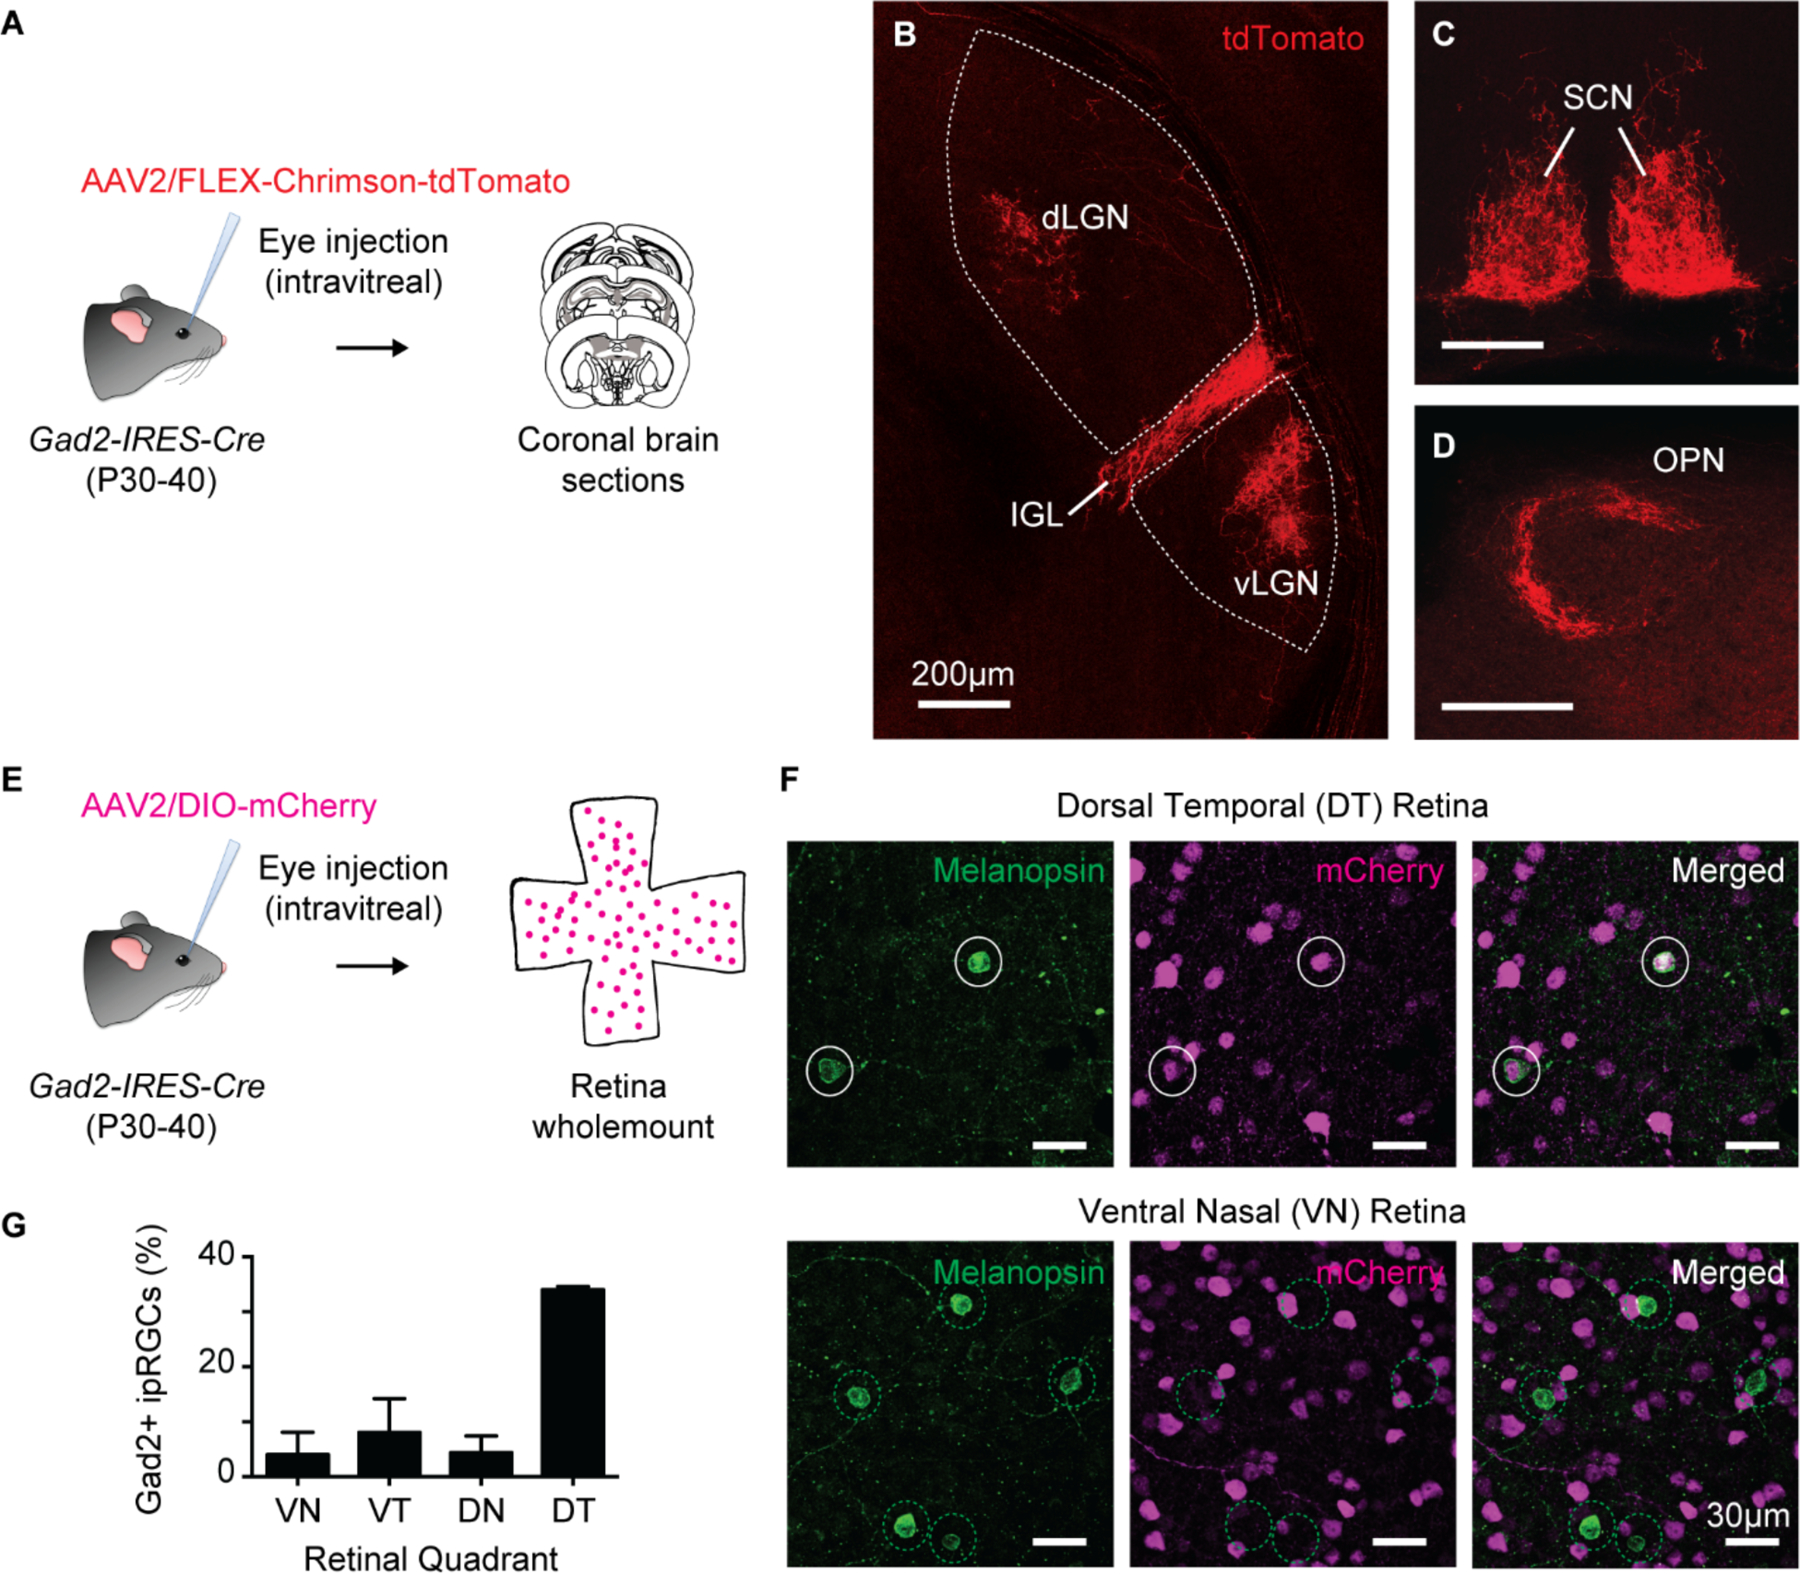
(A) Intravitreal injections of AAV2/hSyn-FLEX-Chrimson-tdTomato in Gad2-IRES-Cre mice to label GABAergic cells in the retina. Coronal brain sections were made 1–2 months post infection.
(B-D) tdTomato+ axons were consistently observed (14/14 animals) in the IGL (B), vLGN (B) SCN (C), and OPN (D). Scale bar 200 μm.
(E) Intravitreal injections of AAV2/hSyn-DIO-mCherry in Gad2-IRES-Cre mice to label GABAergic cells in the retina. Retinas were immunostained for melanopsin to label ipRGCs.
(F) Melanopsin and mCherry labeling in Dorsal-temporal (top) and ventral-nasal (bottom) quadrants of retinas in (E) . Solid white circles: Gad2+ ipRGCs and dotted green circles: Gad2− negative ipRGCs.
(G) Percentage of melanopsin immunoreactive cells that were Gad2+. n = 7−8 retinas/quadrant.
Data are mean ± SD.
The melanopsin-expressing, intrinsically photosensitive retinal ganglion cells (ipRGCs) are the major RGC type innervating non-image forming structures like the SCN, IGL, vLGN and OPN shell, and are required for circadian photoentrainment and the PLR (11, 16, 17). To test whether Gad2+ RGCs are ipRGCs, we intravitreally injected Gad2-IRES-Cre mice with an AAV expressing a Cre-dependent mCherry reporter (AAV2/hSyn-DIO-mCherry) and immunolabeled these retinas for melanopsin (Fig. 1E). 12% of melanopsin immunoreactive cells were mCherry+ (167/1437 cells from 7 retinas) and the proportion of mCherry+ ipRGCs was highest (31%) in the dorsal-temporal quadrant of the retina (Fig. 1F–G). The individual densities of Gad2+ cells or of melanopsin immunopositive cells alone were not higher in the dorsal-temporal retina compared to other quadrants (Fig. S3). Additionally, Gad2 labeling was enriched in ipRGCs relative to the total RGC population because only 1% of total RGCs and only 0.6% of Brn3a+ (a marker of non-ipRGCs) RGCs were mCherry+ (Fig. S4).
We performed RNA fluorescence in situ hybridization (FISH) for Gad2 mRNA in ipRGCs to determine whether we could detect it in ipRGCs. We identified ipRGCs in retinal sections by probing for Opn4 mRNA (Fig. 2A–B) and counting the number of Gad2 puncta in that region of interest (ROI) (Fig. S5–S7 and see methods). We did not observe any labeling in retinas of Opn4 knockout animals (Fig. S6). To establish a threshold for Gad2+ ipRGCs, we performed the same experiment in animals lacking Gad2 in ipRGCs (Opn4Cre/+; Gad2fx/fx). We estimate that Gad2 mRNA is detectable above background in 26% of ipRGCs (Fig. S7). We next immunolabeled ipRGC terminals in the SCN for Gad65 protein, which is encoded by the Gad2 gene, in ipRGCs. 12% of ipRGC nerve terminals in the SCN were Gad65 immunoreactive (Fig. 2C–E). Less than 2% of ipRGC nerve terminals were Gad65 immunoreactive when we rotated the Gad65 channel (Fig. 2E), indicating that colocalization levels were better than chance. Likewise, less than 2% of ipRGC nerve terminals in Opn4Cre/+; Gad2fx/fx animals were Gad65 immunoreactive.
Fig. 2. ipRGCs express Gad2.
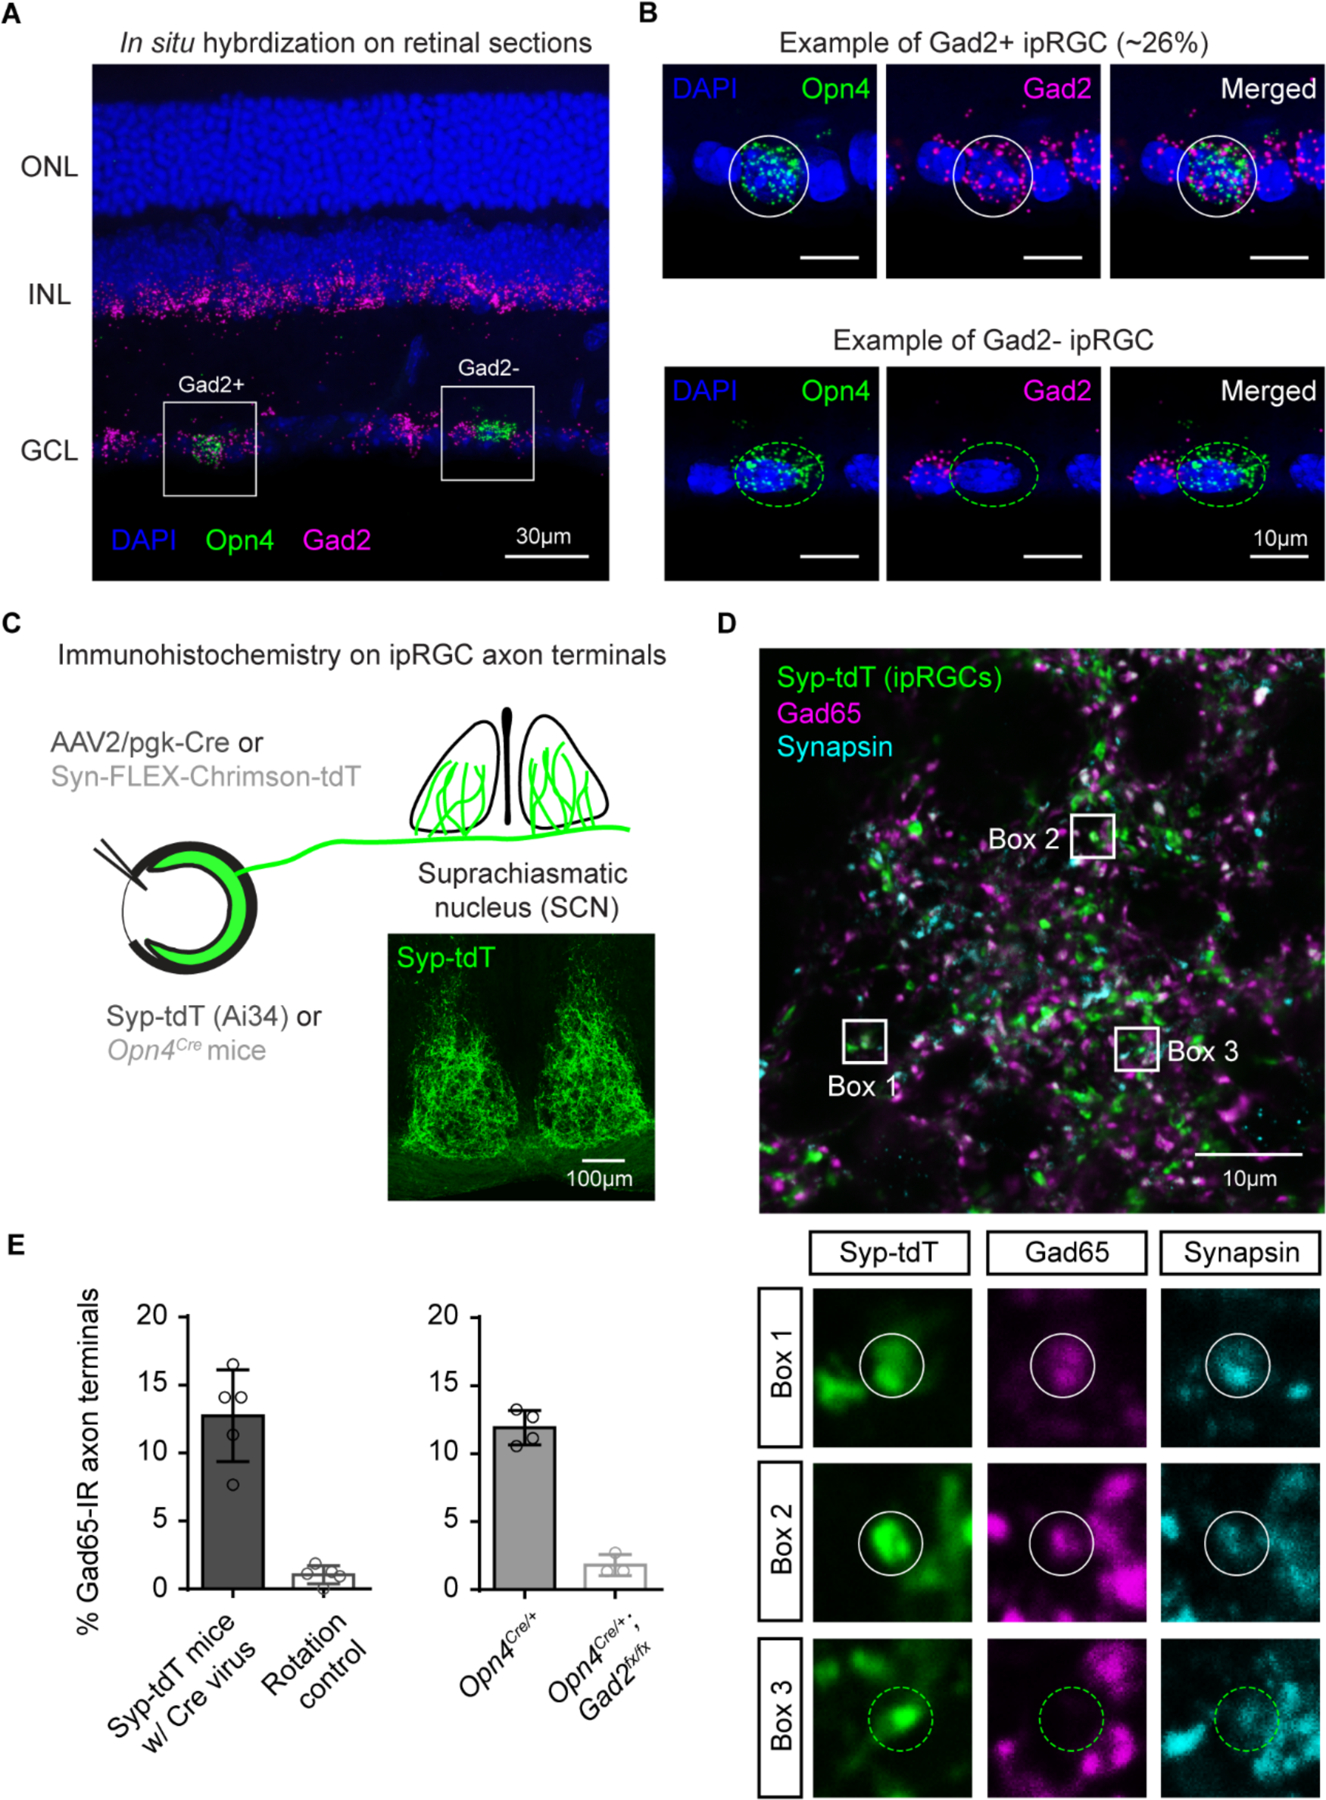
(A) In situ hybridization for Opn4 (green) and Gad2 (magenta). ONL (outer nuclear later), INL (inner nuclear layer), GCL (ganglion cell layer).
(B) Gad2+ (top) and Gad2− (bottom) ipRGCs from panel A.
(C) Strategies for labeling ipRGC axons in the SCN. Black text: reporter mice in which the synaptophysin-tdT fusion protein was expressed in the presence of Cre recombinase (Syp-tdT or Ai34) were intravitreally injected with the pgk-Cre virus. Gray text: Opn4Cre/+ animals were intravitreally injected with a virus driving Cre-dependent expression of Chrimson-tdT.
(D) ipRGC terminals in SCN terminal of Syp-tdt mice intravitreally injected with pgk-Cre virus (top) and immunolabeled for Gad65 (magenta) and synapsin to label axon terminals (cyan). Bottom panels show zoomed in images of ipRGC axon terminals that were Gad65 immunoreactive (boxes 1 and 2) and Gad65 negative (box 3).
(E) Percentage of ipRGC terminals that were Gad65 immunoreactive (IR).
We next asked if ipRGCs functionally release GABA. We expressed channel channelrhodopsin-2 (ChR2) in RGCs by delivering AAVs that drive Cre expression (AAV2/pgk-Cre) to the eyes of Ai32 mice (which drive Cre-dependent expression of ChR2) (19). We made acute brain slices containing the SCN, which receives retinal input exclusively from ipRGCs in mice (11, 17). We photoactivated ipRGC axons (Fig. 3A) and voltage-clamped SCN neurons at −60mV (ECl) to isolate excitatory postsynaptic currents (EPSCs) and then at 0mV (Ecation) to isolate inhibitory postsynaptic currents (IPSCs). Tetrodotoxin (TTX) and 4-aminopyridine (4-AP) were included in the extracellular solution to ensure that elicited postsynaptic currents were monosynaptic (20). ipRGC photoactivation evoked synaptic currents in 32/79 (40%) SCN neurons including EPSCs only (18/32 cells), IPSCs but no EPSCs (3/32 cells), and both IPSCs and EPSCs (11/32 cells). Therefore, just over 43% of SCN neurons receiving direct input from ipRGCs receive inhibitory ipRGC input (Fig. 3D). The synaptic latency of EPSCs and IPSCs elicited in SCN neurons was not significantly different, suggesting that both types of postsynaptic currents arise from monosynaptic input from ipRGCs (Fig. 3E). When possible, we mapped the location of recorded SCN neurons (Fig. S8) and immunolabeled recorded cells for vasoactive intestinal peptide (VIP) (Fig. 3B–C). A higher proportion of VIP+ neurons in the SCN received monosynaptic ipRGC input (59%) compared to VIP− neurons (33%) (Fig. 3F). A larger percentage of VIP+ neurons received purely excitatory ipRGC input (41%) compared to VIP− neurons (15%) and a similar proportion of VIP+ and VIP− neurons received inhibitory ipRGC input (Fig. 3F).
Fig. 3. Functional GABA release by ipRGCs.
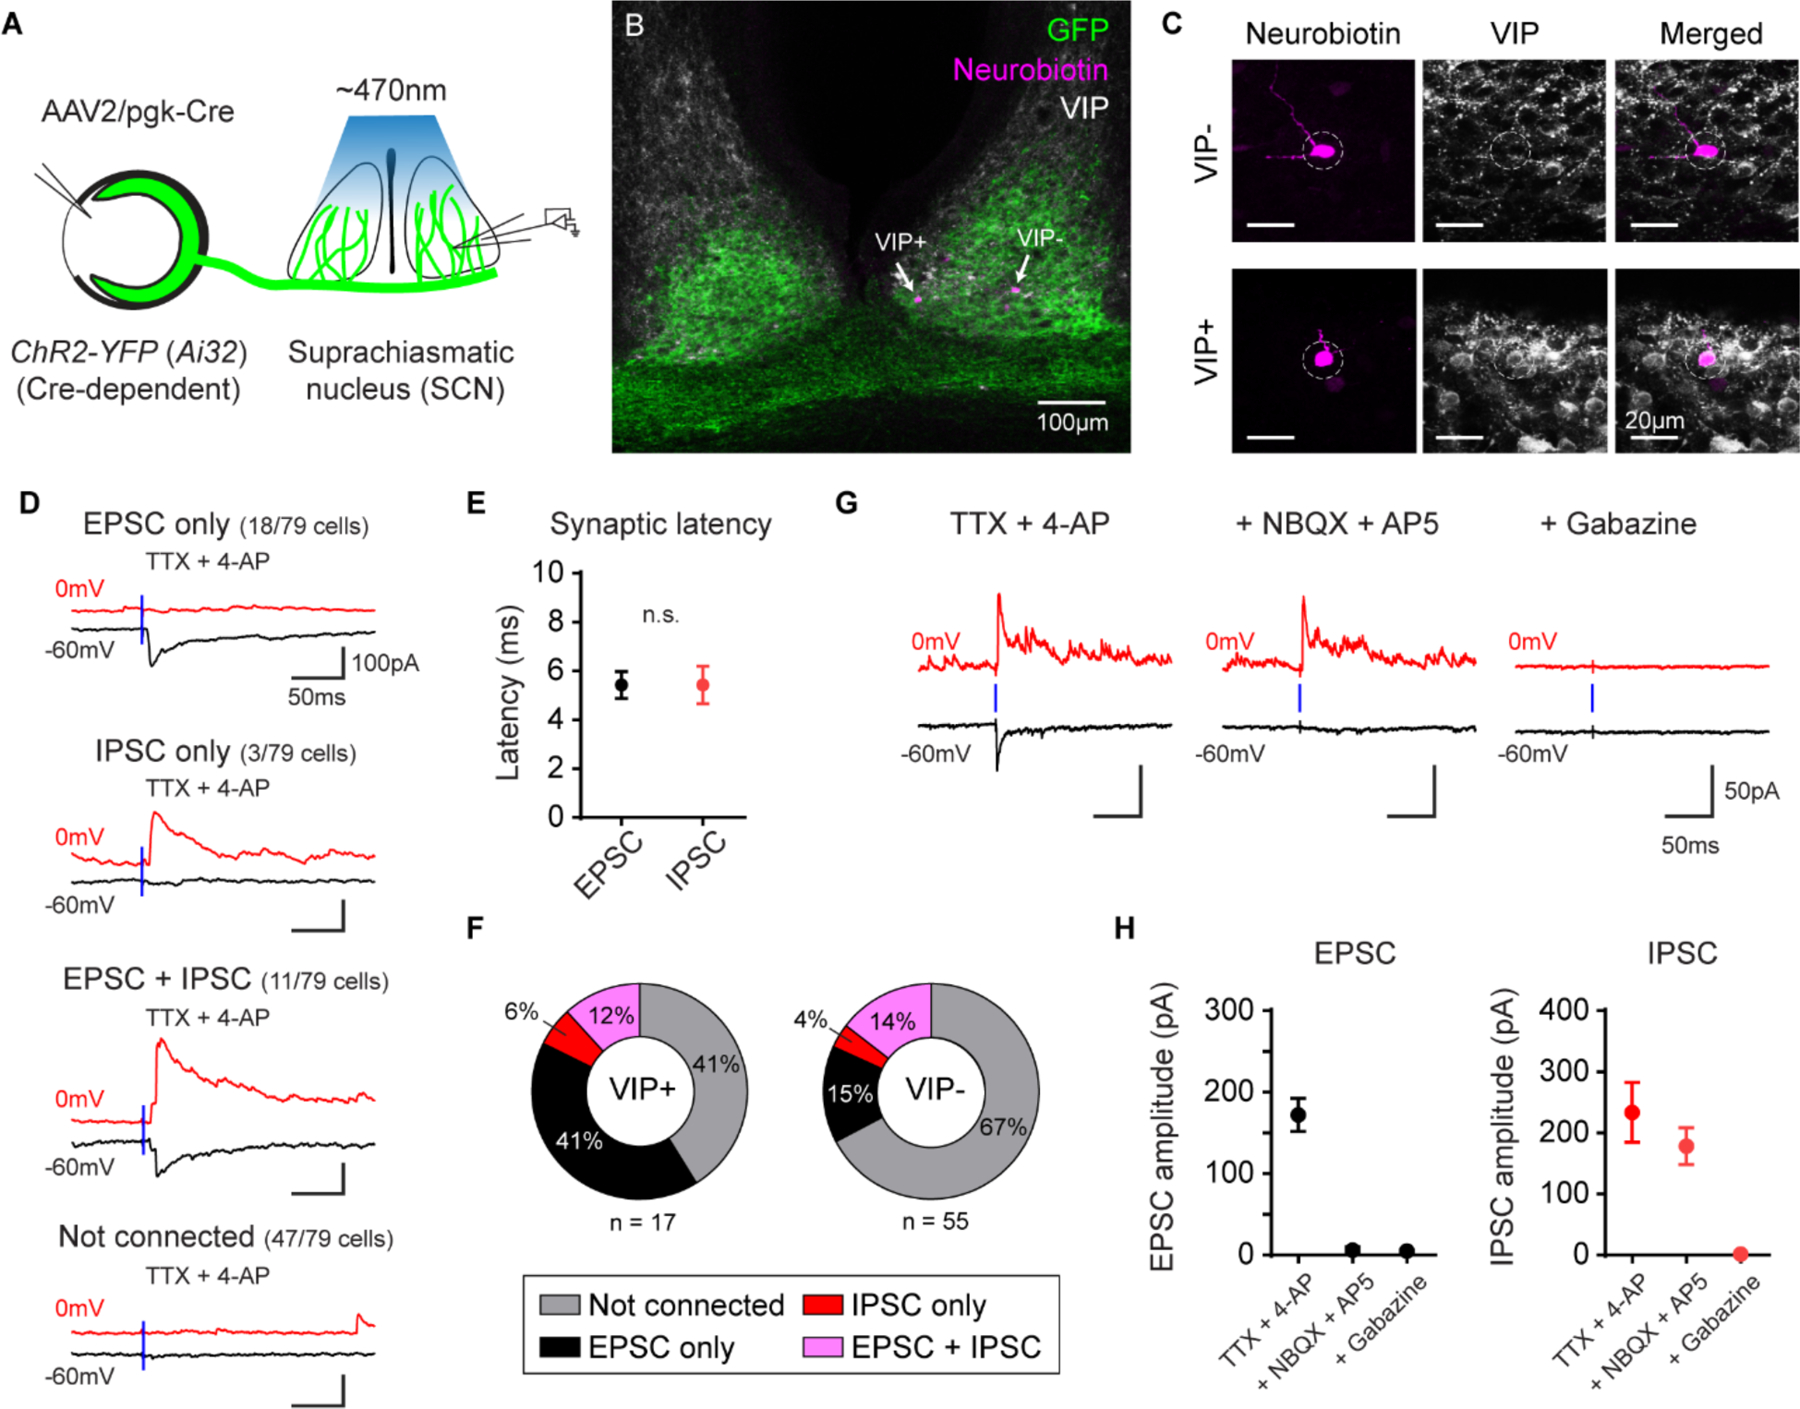
(A) SCN acute brain slices were prepared from ChR2-YFP (Ai32) mice eye injected with pgk-Cre virus. Full field 470nm light flashes were used to photo-activate ipRGC axons.
(B) Neurobiotin-filled SCN neurons (magenta, indicated by arrows) in SCN slices labeled for VIP. ipRGC axons are labeled in green.
(C) Zoomed in images of the VIP− (top panels) and VIP+ (bottom) neurons in B.
(D) EPSCs (black) and IPSCs (red) elicited in SCN neurons after photoactivating ipRGC axons in the presence of TTX and 4-AP. The blue line indicates delivery of a 1ms light stimulus. TTX (tetrodotoxin), 4-AP (4-aminopyridine).
(E) Synaptic latency of EPSCs and IPSCs following photoactivation of ipRGC axons. n.s. (not significant).
(F) Proportion of VIP+ (left) and VIP− (right) SCN neurons that receive excitatory and/or inhibitory input from ipRGCs.
(G) Example recording from an SCN neuron that receives both excitatory and inhibitory ipRGC input. Bath application of NBQX and D-APV abolished the EPSC, but did not affect the IPSC. Subsequent application of gabazine abolished the IPSC.
(H) EPSC (black, left) and IPSC (red, right) amplitude in SCN neurons receiving both excitatory and inhibitory input from ipRGCs before and following application of NBQX/D-APV and then gabazine. n = 6 cells. All data are mean ± SD.
Bath application of NBQX and D-APV abolished evoked EPSCs (Fig. 3G–H) in SCN neurons receiving excitatory and inhibitory ipRGC input, but did not affect IPSC amplitudes. This further confirms that elicited IPSCs were not likely a result of a disynaptic inhibition arising from evoked glutamatergic ipRGC inputs onto a GABAergic interneuron. Subsequent bath application of gabazine (SR-95531) abolished the remaining light-evoked IPSCs in SCN neurons (Fig. 3G–H).
To assess how GABA release by ipRGCs influences non-image forming visual behavior, we crossed Opn4Cre mice (21) to Gad2fx/fx mice (22) to knock out Gad2 specifically in ipRGCs (Opn4Cre/+; Gad2fx/fx, referred to as Gad2 cKO). These animals showed normal ipRGC projections and visual acuity, indicating that this manipulation does not affect visual system development (Fig. S9 and S10). We measured the PLR of Gad2 cKO animals compared to littermate controls (Opn4+/+; Gad2fx/fx) across a range of light intensities and measured the irradiance-response relationship (Fig. 4A–C). PLR amplitude and kinetics were both unaffected at bright light intensities in Gad2 cKO animals (Fig. 4C and Fig. S11). Baseline pupil size in darkness was also unchanged (Fig. 4A–B). However, at low light levels, Gad2 cKO mice showed significantly stronger pupil constriction (Fig. 4C) than littermate controls, though the kinetics were not significantly different (Fig. S11).
Fig. 4. GABA release by ipRGCs influences non-image forming behaviors.
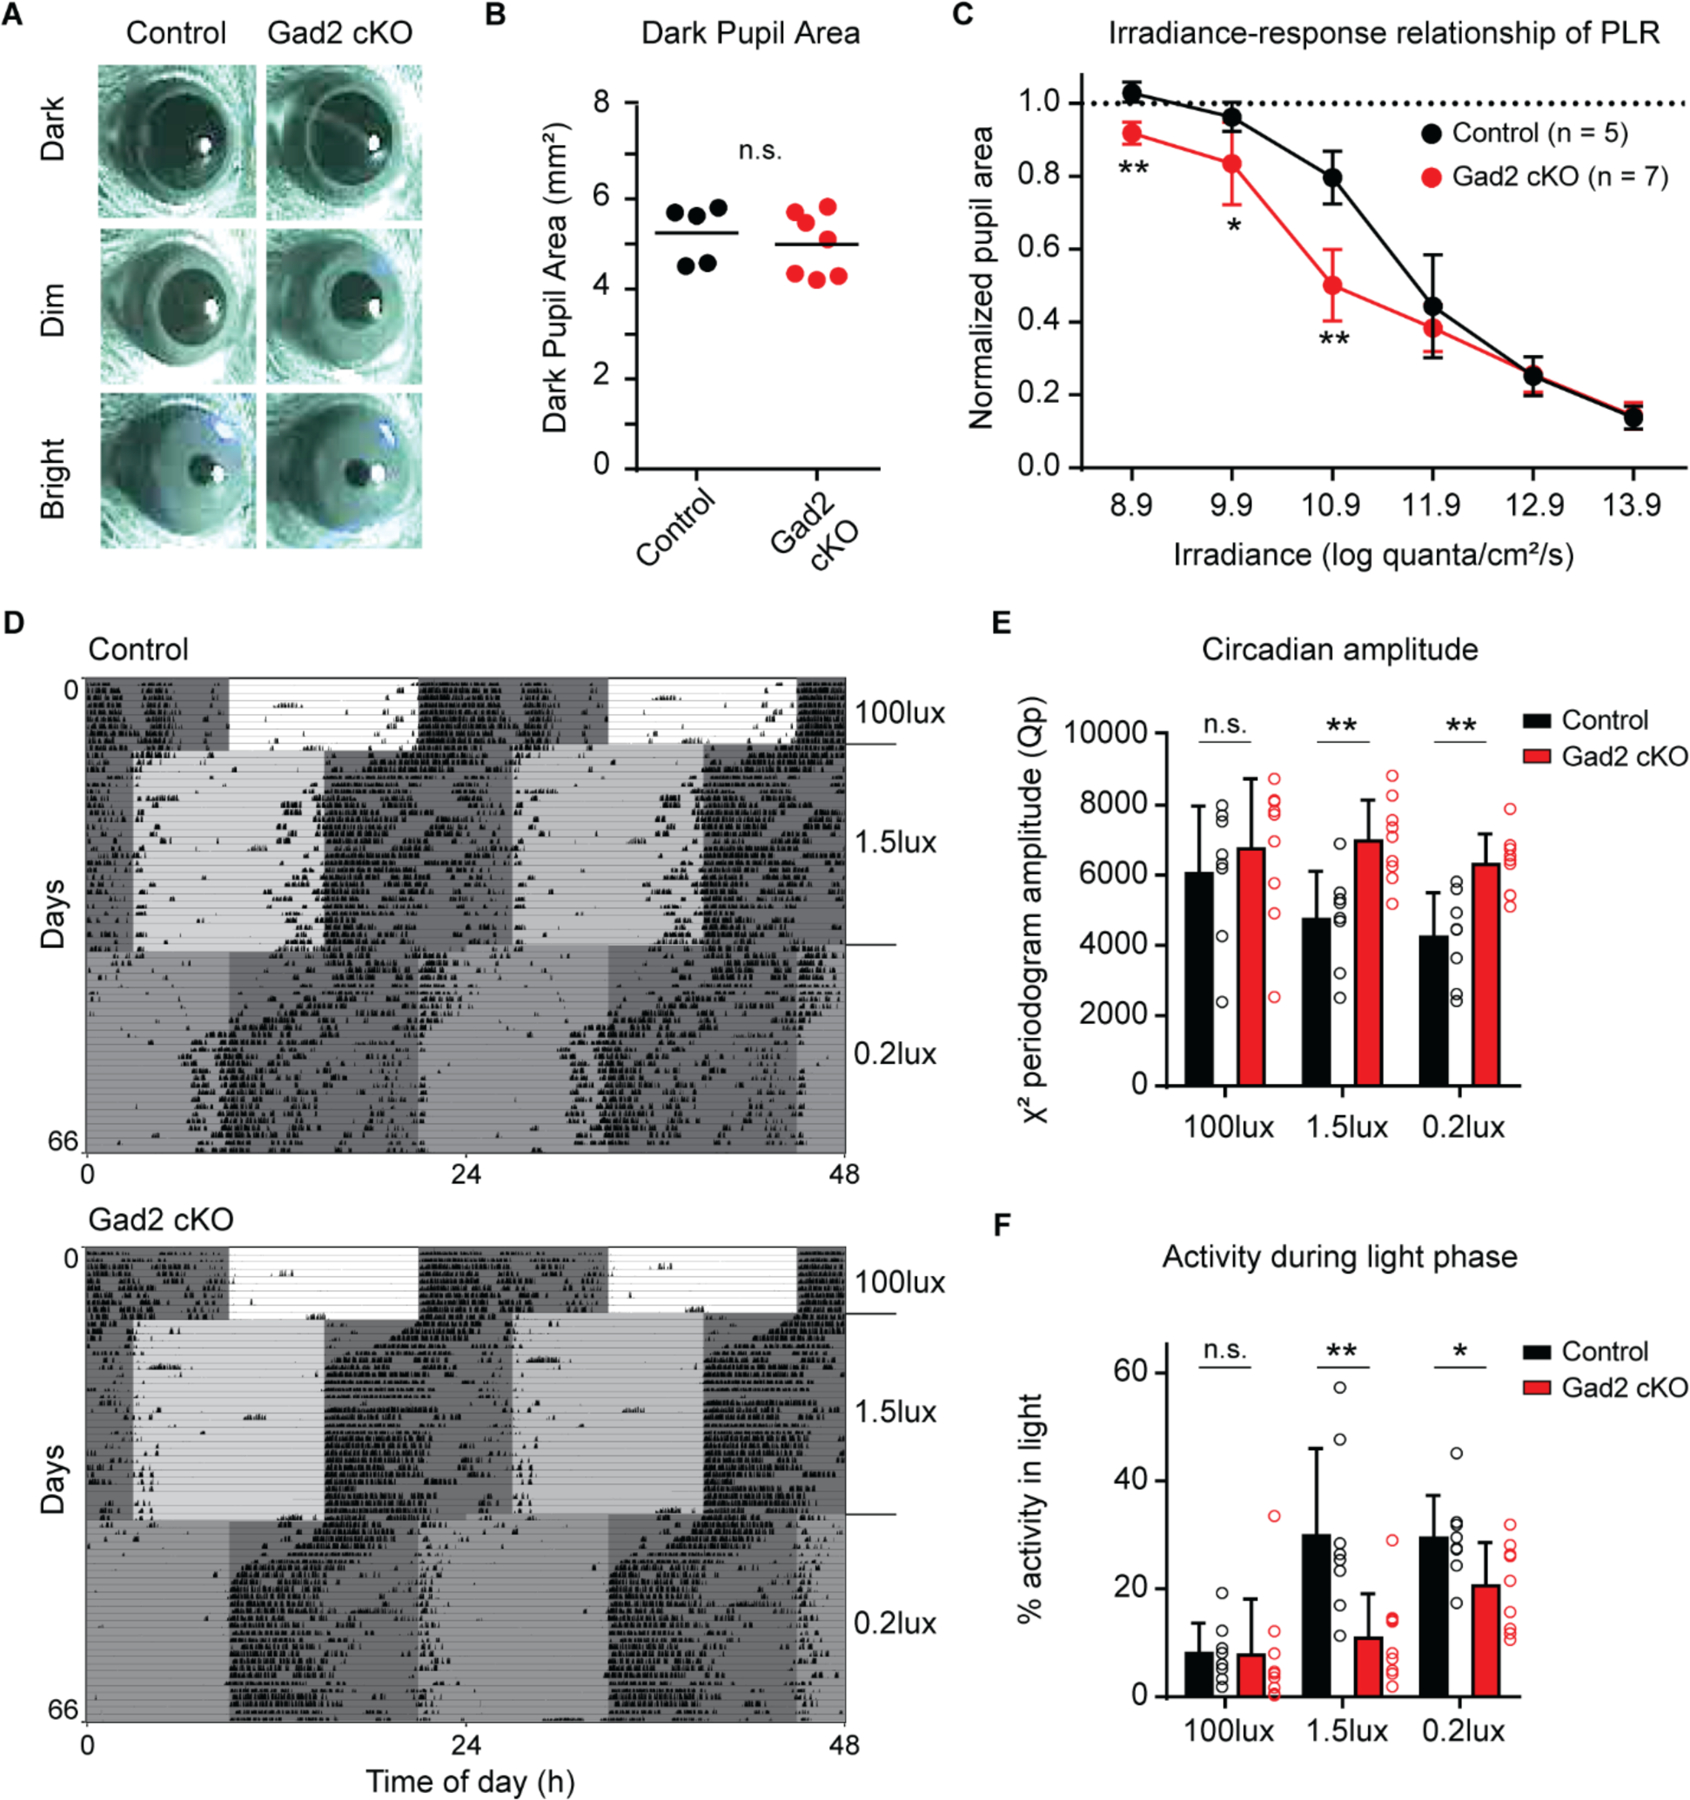
(A) Representative PLR images from control (left panels, Opn4+/+; Gad2fx/fx) and Gad2 cKO (right panels, Opn4Cre/+; Gad2fx/fx) mice in darkness (top), dim light (middle, 10.9 log quanta/cm2/s) and bright light (bottom, 13.9 log quanta/cm2/s).
(B) Control and Gad2cKO pupil area in the dark.
(C) Irradiance-response relationship of PLR in control and Gad2 cKO mice.
(D) Representative double-plotted actograms from control (top) and Gad2 cKO (bottom) mice. Mice were initially exposed to a 12:12 light dark cycle with 100 lux light during the light phase. The light level was subsequently lowered to 1.5 lux and 0.2 lux. The mice were exposed to a 6-hour phase advance each time the light level was lowered.
(E-F) Circadian amplitude measured using the peak amplitude of the X2 periodogram (E) and percent activity during the light phase (F) in control (black, n = 8) and Gad2 cKO (red, n = 9) mice. All data are mean ± SD. n.s. (not significant). * P < 0.05, ** P < 0.01 (Mann-Whitney U test).
We next tested whether these changes in PLR were due to lack of Gad2 in ipRGCs or potentially due to developmental effects of Gad2 excision early in development. We knocked out the Gad2 gene specifically in RGCs of adult Gad2fx/fx mice via intravitreal delivery of an AAV that drives Cre expression under an RGC-specific promoter (AAV2/SNCG-Cre-HA) (23) (Fig. S12 and see Methods). Less than 5% of amacrine cells were labeled in well-infected areas (Fig. S12B). We then measured the PLR in response to dim (10.4 log photons/cm2/s) and bright (13.4 log photons/cm2/s) light stimuli. Mice in which Gad2 was knocked out in RGCs exhibited significantly more sensitive PLR in response to dim light, but not bright light (Fig. S12C–D) compared to control animals. These results suggest that these changes in PLR are not due to developmental defects from Gad2 gene excision.
To determine whether GABA release by ipRGCs also influences circadian photoentrainment, we tracked voluntary wheel running activity of littermate control and Gad2 cKO mice across multiple light levels. Mice were first exposed to a 12 hour:12 hour light-dark (LD) cycle with bright, 100 lux light during the light phase. We then performed a 6-hour phase advance of the LD cycle at 4 week intervals and simultaneously lowered the light intensity at each shift, first to 1.5 lux and then to 0.2 lux (Fig. 4D and Fig. S13). The rate of re-entrainment in response to both 6-hour phase advances was the same in Gad2 cKO compared to control animals (Fig. S14). However, Gad2 cKO animals had significantly higher circadian amplitudes in LD cycles at low (1.5 lux and 0.2 lux), but not high (100 lux) light levels (Fig. 4E). This indicates that the circadian photoentrainment of Gad2 cKO animals remains more robust at lower light levels and is relatively insensitive to decreases in environmental light levels. There were no significant differences between Gad2 cKO and control animals in total daily activity, activity onset time, and activity onset variability (Fig. S15). Instead, Gad2 cKO animals exhibited significantly less activity in the light phase at 1.5 lux and 0.2 lux, which likely accounts for their increased circadian amplitude at low light levels relative to controls (Fig. 4F).
Our results reveal a GABAergic circuit originating in the retina that decreases the sensitivity of the non-image forming visual system at low light levels. Recent reports have shown that the ipRGCs providing input to non-image forming brain regions are highly sensitive to dim light (24–26), and yet the non-image forming behaviors driven by these inputs are relatively insensitive to light compared to image forming vision (27, 28). The mechanisms underlying this discrepancy between sensitive cellular inputs to non-image forming brain regions, but relatively insensitive behavioral outputs had remained a mystery. Our results suggest that a subpopulation of ipRGCs may serve to actively dampen the sensitivity of the non-image forming visual behaviors by releasing the inhibitory neurotransmitter GABA, providing a circuit mechanism for this discrepancy. For the PLR, these inputs serve to maximize light entry into the eye at low light levels. For circadian behaviors, these inputs likely prevent unnecessary adjustments of the body’s master clock to relatively minor perturbations in environmental light.
Supplementary Material
Acknowledgments:
We would like to thank Dr. Thomas Bozza, Dr. Ravi Allada, and Dr. Marco Gallio for helpful comments on the manuscript. We would also like to thank Dr. Samer Hattar for the gift of Opn4Cre mice and Dr. Qi Wu for the gift of Gad2fx mice.
Funding: This work was funded by a Klingenstein-Simons Fellowship in the Neurosciences to T.M.S., a Sloan Research Fellowship to T.M.S., NIH grant 1DP2EY022584 to T.M.S, NIH T32 EY025202 to support T.S and NIH F31 EY030360-01 to T.S.
Footnotes
Competing interests: The authors declare no competing interests.
Data and materials availability: All data are available in the manuscript or the supplementary materials.
References and Notes:
- 1.Sanes JR, Masland RH, The types of retinal ganglion cells: current status and implications for neuronal classification. Annu Rev Neurosci 38, 221–246 (2015). [DOI] [PubMed] [Google Scholar]
- 2.Morin LP, Studholme KM, Retinofugal projections in the mouse. J Comp Neurol 522, 3733–3753 (2014). [DOI] [PMC free article] [PubMed] [Google Scholar]
- 3.Martersteck EM et al. , Diverse Central Projection Patterns of Retinal Ganglion Cells. Cell Rep 18, 2058–2072 (2017). [DOI] [PMC free article] [PubMed] [Google Scholar]
- 4.Schmidt TM, Chen SK, Hattar S, Intrinsically photosensitive retinal ganglion cells: many subtypes, diverse functions. Trends Neurosci 34, 572–580 (2011). [DOI] [PMC free article] [PubMed] [Google Scholar]
- 5.Seabrook TA, Burbridge TJ, Crair MC, Huberman AD, Architecture, Function, and Assembly of the Mouse Visual System. Annu Rev Neurosci 40, 499–538 (2017). [DOI] [PubMed] [Google Scholar]
- 6.Rogers PC, Pow DV, Immunocytochemical evidence for an axonal localization of GABA in the optic nerves of rabbits, rats, and cats. Visual Neuroscience 12, 1143–1149 (1995). [DOI] [PubMed] [Google Scholar]
- 7.Davanger S, Ottersen OP, Storm-Mathisen J, Glutamate GABA, and glycine in the human retina: an immunocytochemical investigation. The Journal of comparative neurology 311, 483–494 (1991). [DOI] [PubMed] [Google Scholar]
- 8.Lugo-García N, Blanco RE, Localization of GAD- and GABA-like immunoreactivity in ground squirrel retina: retrograde labeling demonstrates GAD-positive ganglion cells. Brain Research 564, 19–26 (1991). [DOI] [PubMed] [Google Scholar]
- 9.Andrade da Costa BLS, Hokoç JN, Pinaud RR, Gattass R, GABAergic retinocollicular projection in the new world monkey Cebus apella. NeuroReport 8, 1797–1802 (1997). [DOI] [PubMed] [Google Scholar]
- 10.Taniguchi H et al. , A resource of Cre driver lines for genetic targeting of GABAergic neurons in cerebral cortex. Neuron 71, 995–1013 (2011). [DOI] [PMC free article] [PubMed] [Google Scholar]
- 11.Guler AD et al. , Melanopsin cells are the principal conduits for rod-cone input to non-image-forming vision. Nature 453, 102–105 (2008). [DOI] [PMC free article] [PubMed] [Google Scholar]
- 12.Moore RY, Eichler VB, Loss of a circadian adrenal corticosterone rhythm following suprachiasmatic lesions in the rat. Brain Research 42, 201–206 (1972). [DOI] [PubMed] [Google Scholar]
- 13.Stephan FK, Zucker I, Circadian rhythms in drinking behavior and locomotor activity of rats are eliminated by hypothalamic lesions. Proceedings of the National Academy of Sciences of the United States of America 69, 1583–1586 (1972). [DOI] [PMC free article] [PubMed] [Google Scholar]
- 14.Pickard GE, Ralph MR, Menaker M, The Intergeniculate Leaflet Partially Mediates Effects of Light on Circadian Rhythms. Journal of Biological Rhythms 2, 35–56 (1987). [DOI] [PubMed] [Google Scholar]
- 15.Trejo LJ, Cicerone CM, Cells in the pretectal olivary nucleus are in the pathway for the direct light reflex of the pupil in the rat. Brain Research 300, 49–62 (1984). [DOI] [PubMed] [Google Scholar]
- 16.Hattar S et al. , Central projections of melanopsin-expressing retinal ganglion cells in the mouse. The Journal of Comparative Neurology 497, 326–349 (2006). [DOI] [PMC free article] [PubMed] [Google Scholar]
- 17.Baver SB, Pickard GE, Sollars PJ, Pickard GE, Two types of melanopsin retinal ganglion cell differentially innervate the hypothalamic suprachiasmatic nucleus and the olivary pretectal nucleus. Eur J Neurosci 27, 1763–1770 (2008). [DOI] [PubMed] [Google Scholar]
- 18.Kaufman DL, Houser CR, Tobin AJ, Two Forms of the γ-Aminobutyric Acid Synthetic Enzyme Glutamate Decarboxylase Have Distinct Intraneuronal Distributions and Cofactor Interactions. Journal of Neurochemistry 56, 720–723 (1991). [DOI] [PMC free article] [PubMed] [Google Scholar]
- 19.Madisen L et al. , A toolbox of Cre-dependent optogenetic transgenic mice for light-induced activation and silencing. Nat Neurosci 15, 793–802 (2012). [DOI] [PMC free article] [PubMed] [Google Scholar]
- 20.Petreanu L, Mao T, Sternson SM, Svoboda K, The subcellular organization of neocortical excitatory connections. Nature 457, 1142–1145 (2009). [DOI] [PMC free article] [PubMed] [Google Scholar]
- 21.Ecker JL et al. , Melanopsin-expressing retinal ganglion-cell photoreceptors: cellular diversity and role in pattern vision. Neuron 67, 49–60 (2010). [DOI] [PMC free article] [PubMed] [Google Scholar]
- 22.Meng F et al. , New inducible genetic method reveals critical roles of GABA in the control of feeding and metabolism. Proc Natl Acad Sci U S A 113, 3645–3650 (2016). [DOI] [PMC free article] [PubMed] [Google Scholar]
- 23.Chaffiol A et al. , A New Promoter Allows Optogenetic Vision Restoration with Enhanced Sensitivity in Macaque Retina. Mol Ther 25, 2546–2560 (2017). [DOI] [PMC free article] [PubMed] [Google Scholar]
- 24.Weng S, Estevez ME, Berson DM, Mouse ganglion-cell photoreceptors are driven by the most sensitive rod pathway and by both types of cones. PLoS One 8, e66480 (2013). [DOI] [PMC free article] [PubMed] [Google Scholar]
- 25.Zhao X, Stafford BK, Godin AL, King WM, Wong KY, Photoresponse diversity among the five types of intrinsically photosensitive retinal ganglion cells. J Physiol 592, 1619–1636 (2014). [DOI] [PMC free article] [PubMed] [Google Scholar]
- 26.Lee SK, Sonoda T, Schmidt TM, M1 Intrinsically Photosensitive Retinal Ganglion Cells Integrate Rod and Melanopsin Inputs to Signal in Low Light. Cell Rep 29, 3349–3355 e3342 (2019). [DOI] [PMC free article] [PubMed] [Google Scholar]
- 27.Nelson DE, Takahashi JS, Comparison of visual sensitivity for suppression of pineal melatonin and circadian phase-shifting in the golden hamster. Brain Research 554, 272–277 (1991). [DOI] [PubMed] [Google Scholar]
- 28.Butler MP, Silver R, Divergent photic thresholds in the non-image-forming visual system: entrainment, masking and pupillary light reflex. Proc Biol Sci 278, 745–750 (2011). [DOI] [PMC free article] [PubMed] [Google Scholar]
Associated Data
This section collects any data citations, data availability statements, or supplementary materials included in this article.