Abstract
Background
Circulating tumor cells (CTCs) play a key role in cancer progression, especially metastasis, due to the rarity and heterogeneity of CTCs, fewer researches have been conducted on them at the molecular level. However, through the Gene Expression Omnibus (GEO) database, this kind of minority researches can be well integrated, the gene expression differences between CTCs and primary tumors can be identified, and molecular targets for CTCs can be found.
Methods
We analyzed 7 sets of gene chips (GSE82198, GSE99394, GSE31023, GSE65505, GSE67982, GSE76250, GSE50746) obtained by GEO. Analysis of differentially expressed genes (DEGs) between CTCs and corresponding primary tumors by NetworkAnalyst. Metascape tool for Gene Ontology (GO) / Kyoto Encyclopedia of Genes and Genomes (KEGG) enrichment analysis of differential genes and visual display. Cytoscape performs protein-protein interaction (PPI) analysis and obtains the hub genes. Renal cancer patients’ clinical specimens to verify the correctness of enrichment results. Prognostic analysis of hub genes in kidney cancer patients using the Kaplan–Meier plotter survival analysis tool.
Results
We obtained a total of 589 DEGs. The GO / KEGG enrichment results indicate that the DEGs are mainly concentrated in cell adhesion, epithelial-mesenchymal transition (EMT), and apoptosis. Renal cancer clinical specimens suggest that CTCs have epithelial and mesenchymal types. At the same time, PSMC2 can be used as a poor prognostic indicator for renal cancer patients.
Conclusions
In summary, our study suggests that compared with primary tumors, CTCs mainly change cell adhesion, EMT, and apoptosis. PSMC2 can be used as a poor prognostic factor.
Keywords: Hub genes, Expression profiling data, Cancer, PSMC2, EMT
Background
Circulating tumor cells, as cells detached from solid tumors and entering the circulating blood are a new type of tumor biomarker with real-time detection and minimally invasive characteristics [1]. At the same time, CTCs play an important role in tumor progression, especially in the formation of metastases [2]. CTCs have the characteristics of rarity and heterogeneity, which once restricted the researches of CTCs [3]. Nowadays, with the development of technology, not only can CTCs be captured and enriched, but also they can be identified at the molecular level, which greatly improves the clinical application value of CTCs, and provides potential possible for the prognosis of tumor patients and personalized treatment [4]. In this article, we analyze the differentially expressed genes (DEGs) between CTCs and primary tumors through the Gene Expression Omnibus (GEO) database and use Gene Ontology (GO) / Kyoto Encyclopedia of Genes and Genomes (KEGG) enrichment tools, protein-protein interaction (PPI) analysis tools, and Kaplan–Meier plotter tools to analyze cell biological process, cellular component, molecular function, biological pathways, protein interactions, and clinical prognosis. Identify the differences between CTCs and primary tumors, and provide potential targets for tumor prognosis and treatment.
Methods
Data sources
In this study, gene expression data were obtained from the GEO database (https://www.ncbi.nlm.nih.gov/geo/). After careful screening, a total of GSE82198, GSE99394, and GSE31023 were included in the analysis, GSE65505, GSE67982, GSE76250, GSE50746 were also used as primary tumor controls. GSE31023 and GSE50746 are based on the Agilent-026652 Whole Human Genome Microarray 4x44K v2 (Probe Name version) platform. GSE82198 is based on the [HG-U133_Plus_2] Affymetrix Human Genome U133 Plus 2.0 Array platform. GSE99394, GSE65505, GSE67982, GSE76250 are based on the [HTA-2_0] Affymetrix Human Transcriptome Array 2.0 [transcript (gene) version] platform. Free access to all data.
Acquisition of DEGs
The NetworkAnalyst tool (https://www.networkanalyst.ca/) was used to analyze the expression of CTCs and corresponding primary tumor genes in the above data set, and then genes with adjusted P < 0.05 and | logFC | > 1 were marked as DEGs [5]. The NetworkAnalyst tool includes steps such as data filtering, normalization, and difference analysis. Through the above steps and the removal of the batch effect function of the limma package in the difference analysis, it can reduce the influence of batch effect on experimental results. After obtaining the DEGs of the three tumors, the DGEs co-expressed in different cancers were obtained through the Wayne Diagram tool (http://bioinformatics.psb.ugent.be/webtools/Venn/).
GO / KEGG pathway analysis of DEGs
The metascape tool (https://metascape.org/gp/index.html#/main/step1) was used to perform GO biological processes (BP), cell components (CC), molecular functions (MF), and KEGG pathway enrichment analysis of 589 DEGs [6]. Screening for enrichment information with statistical significance at P < 0.05.
PPI network construction and hub gene identification
The STRING tool (https://string-db.org/cgi/input.pl) was used to analyze the obtained 589 DEGs, set the confidence greater than 0.7 as the screening condition, and obtain the PPI network [7]. Use the Cytoscape tool (https://cytoscape.org/) to visualize the PPI network, and use the Cytohubba plugin CytoHubba to calculate the protein score and obtain the top 10 hub genes with the highest score [8].
Patient CTCs analysis and hub gene survival analysis
With the approval of the ethics review committee of the Second Affiliated Hospital of Xi’an Jiaotong University, we obtained CTCs test data of renal cancer patients who had undergone surgical treatment in our hospital from September 2015 to January 2019. The studies using clinical samples were approved by the institutional review boards of the Second Affiliated Hospital of Xi’an Jiaotong University, and written-informed consents were obtained from all participants. Peripheral blood samples (5 ml, anticoagulated with EDTA) were drawn from all participants before each time point. Mononuclear cells (MNC) were isolated by adding erythrocyte lysis buffer (154 mM NH4Cl, 10 mM KHCO3 and 0.1 mM EDTA, Sigma, St. Louis, USA). After centrifugation (1500 rpm, 5 min), the blood samples were resuspended in PBS buffer. CTCs were separated by using CanPatrol CTC enrichment technique (SurExam, Guangzhou, China). CTCs were divided into epithelial, mesenchymal and mixed phenotype based on the morphological and biological biomarkers. Epithelial CTCs were detected with labeling epithelia markers, such as EpCAM, CK8, CK18 and CK19. Mesenchymal CTCs were tested by labeling mesenchymal markers, including Vimentin and Twist. The expression levels of EpCAM, CK8, CK18, CK19, Vimentin and Twist were detected by RNA in situ hybridization technique. The detailed procedures were described as following. White blood cells were loaded into 24 wells cell culture plates. All cells were treated with proteinase. Subsequently, targeted gene genomic DNA sequences were detected with capture probes including preamplifier sequence, the amplifier sequence and the labeled probe17. Epithelial markers EpCAM, CK8, CK18 and CK19 were labeled with Alexa Fluor 594. Mesenchymal markers Vimentin and Twist were labeled with Alexa Fluor 488. White blood cells were stained by Alexa Fluor 750 conjugated anti-CD45. Meanwhile, the Kaplan–Meier plotter tool was used to analyze the OS and RFS prognosis of hub genes in renal clear cell carcinoma. P < 0.05 was considered statistically significant.
Expression of PSMC2 in kidney cancer cell lines and tissues
Access the RNAseq data of PSMC2 in common kidney cancer cell lines through the Cancer Cell Line Encyclopedia (CCLE) database (https://portals.broadinstitute.org/ccle/about) [9]. Statistics of expression data through Prism software. Immunohistochemical pictures of PSMC2 in normal kidney tissues and kidney cancer tissues were obtained from the human protein atlas (HPA) database (https://www.proteinatlas.org/) [10]. Both tissues were treated with the same antibody Antibody HPA019238. Quantitative analysis of immunohistochemical results through imageJ.
Results
Identification of DEGs
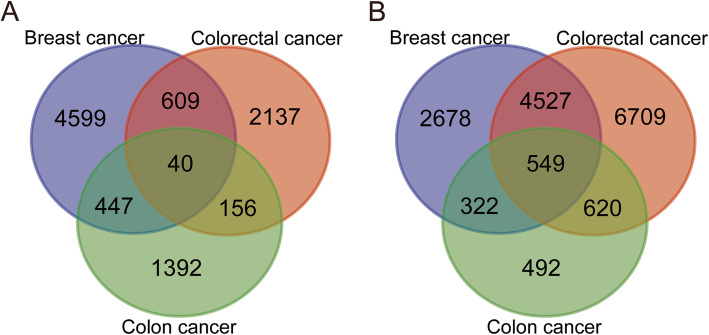
In this study, a total of 3 cancer species and 7 groups of gene expression were included (Table 1), of which 3 were CTCs samples of colon cancer, 3 were primary tumor samples (GSE82198), 10 were CTCs samples from breast cancer, and 9 were primary samples tumor samples (GSE99394, GSE65505, GSE67982, GSE76250), 6 CTCs samples from colorectal cancer, 7 primary tumor samples (GSE31023, GSE50746). Detailed sample information is shown in Table S3. With adjusted P < 0.05 and | logFC | > 1 as the screening conditions, a total of 5695 genes were up-regulated and 8076 genes were down-regulated in breast cancer. A total of 2942 genes were up-regulated and 12,405 genes were down-regulated in colorectal cancer. In colon cancer, a total of 2035 genes were up-regulated and 1983 genes were down-regulated. These DEGs were obtained by comparing the CTCs with the primary tumor. Subsequently, the links between the differential genes in the three cancers were analyzed using a Wayne diagram (Fig. 1). In the end, a total of 589 genes were differentially expressed in all three cancers, of which 40 were up-regulated and 549 were down-regulated.
Table 1.
Statistics of the seven microarray databases derived from the GEO database
| Cancer | Dataset ID | CTCs | Primary tumor | Total number |
|---|---|---|---|---|
| Colon cancer | GSE82198 | 3 | 3 | 6 |
| Breast cancer | GSE99394 | 10 | 0 | 19 |
| GSE65505 | 0 | 3 | ||
| GSE67982 | 0 | 3 | ||
| GSE76250 | 0 | 3 | ||
| Colorectal cancer | GSE31023 | 6 | 0 | 13 |
| GSE50746 | 0 | 7 |
Abbreviations: GEO Gene Expression Omnibus, CTCs Circulating tumor cells
Fig. 1.
Venn diagram of three cancers with common DEGs. a Upregulated genes. b Downregulated genes
Functional enrichment analyses of DEGs
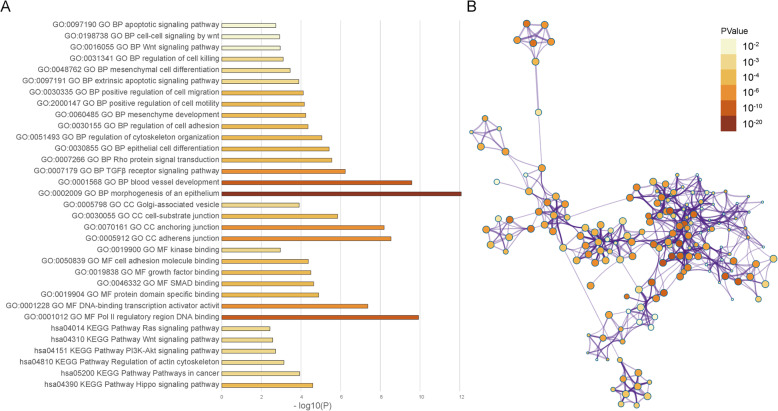
The GO and KEGG pathway enrichment analysis of differential genes was performed by Metascape (Fig. 2). The enriched results are divided into 4 parts, BP, CC, MF, and KEGG analysis. In BP, DEGs are mainly concentrated in epithelial and mesenchymal differentiation, cytoskeleton, invasiveness, and changes in apoptosis. In CC, DEGs are mainly concentrated in the links between cells, and Golgi-related vesicles. In MF, DEGs are mainly concentrated in the activation of the binding of transcription factors to DNA, the binding of protein domains, the binding of growth factors, adhesion molecules, and kinases, etc. In the KEGG pathway, DEGs are mainly concentrated in signaling pathways such as Hippo, cancer, PI3K-Akt, and Wnt.
Fig. 2.
DEGs enrichment results. a Significantly enriched GO terms and KEGG pathways of DEGs. b Network contact of GO terms and KEGG pathways
PPI network construction and hub gene identification
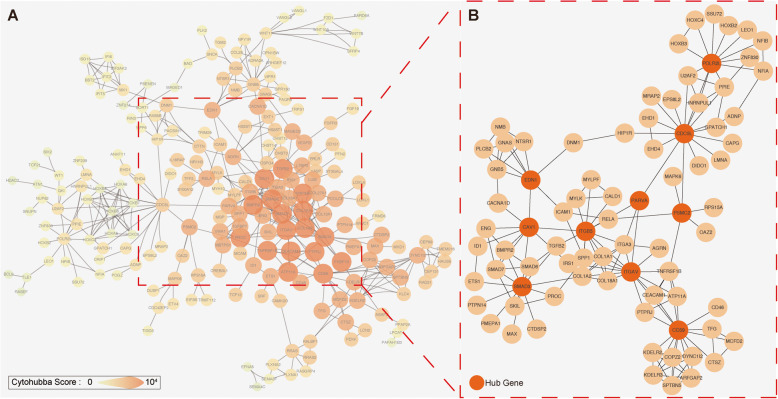
A protein interaction analysis was performed on the DEGs through STRING to obtain a PPI network, which contains 589 nodes and 440 edges. Highly connected nodes are critical to maintaining the stability of the entire protein network. Obtain the top 10 hub genes (Table 2) and their PPI network by Cytoscape algorithm (Fig. 3). These genes are Cell division cycle 5-like protein (CDC5L), Integrin alpha-V (ITGAV), CD59 glycoprotein (CD59), Endothelin-1 (EDN1), Caveolin-1 (CAV1), Alpha-parvin (PARVA), Integrin beta-5 (ITGB5), DNA-directed RNA polymerases I, II (POLR2L), Mothers against decapentaplegic homolog 3 (SMAD3), 26S proteasome regulatory subunit 7 (PSMC2). Hub genes were enriched and PPI again by STRING (Fig. 4). After enrichment, BP mainly focuses on cell adhesion and immune response, MF mainly includes protein kinase binding, CC includes cell surface and cytoplasmic vesicles, and pathway focuses on adhesion pathways and fluid shear forces.
Table 2.
Top ten hub genes with higher score of connectivity
| node_name | MCC | DMNC | MNC | Degree | EPC | BottleNeck | EcCentricity | Closeness | Radiality | Betweenness | Stress | ClusteringCoefficient | Total score |
|---|---|---|---|---|---|---|---|---|---|---|---|---|---|
| CDC5L | 37 | 0.45 | 5 | 16 | 82.59 | 77 | 0.08 | 70.57 | 9.12 | 15,833 | 47,326 | 0.07 | 63,457.23 |
| ITGAV | 251 | 0.41 | 8 | 14 | 100.09 | 39 | 0.10 | 72.76 | 9.30 | 9450 | 37,160 | 0.26 | 47,105.29 |
| CD59 | 847 | 0.71 | 6 | 15 | 97.09 | 32 | 0.10 | 64.82 | 8.82 | 8631 | 33,426 | 0.27 | 43,128.32 |
| EDN1 | 29 | 0.45 | 5 | 8 | 85.45 | 48 | 0.09 | 63.64 | 8.94 | 8840 | 27,448 | 0.25 | 36,536.83 |
| CAV1 | 17 | 0.47 | 4 | 9 | 94.12 | 37 | 0.10 | 65.29 | 9.05 | 6750 | 29,122 | 0.14 | 36,108.54 |
| PARVA | 7 | 0.46 | 3 | 4 | 90.13 | 13 | 0.09 | 64.87 | 9.17 | 6641 | 27,730 | 0.50 | 34,563.54 |
| ITGB5 | 135 | 0.48 | 7 | 11 | 99.76 | 30 | 0.09 | 69.54 | 9.24 | 5305 | 23,774 | 0.29 | 29,441.69 |
| POLR2L | 33 | 0.45 | 5 | 12 | 74.03 | 18 | 0.07 | 59.69 | 8.49 | 6286 | 19,930 | 0.14 | 26,426.87 |
| SMAD3 | 28 | 0.33 | 7 | 13 | 95.36 | 23 | 0.10 | 65.82 | 8.90 | 5886 | 19,698 | 0.12 | 25,825.54 |
| PSMC2 | 6 | 0.00 | 1 | 6 | 75.37 | 98 | 0.09 | 64.25 | 9.09 | 7343 | 17,592 | 0.00 | 25,194.97 |
Fig. 3.
Protein–protein interaction network constructed with the differentially expressed genes. a PPI networks with confidence> 0.7. b PPI networks with hub genes
Fig. 4.
Hub genes enrichment results. a Significantly enriched GO terms and KEGG pathways of Hub genes. b Protein–protein interaction network of Hub genes
Phenotypic identification of CTCs and prognostic value of hub gene
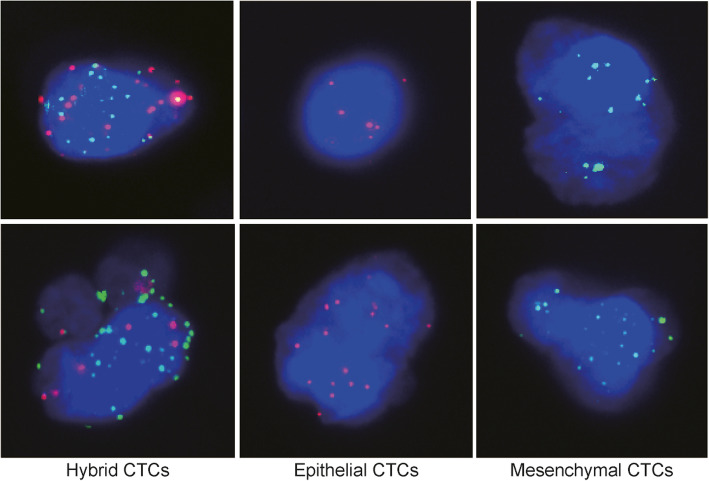
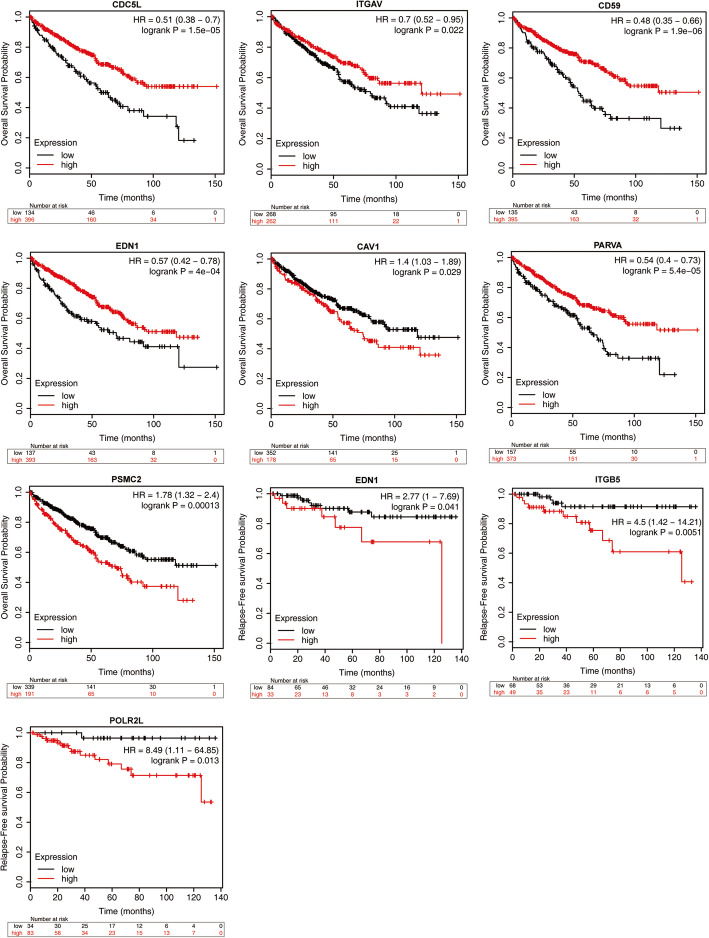
Using the RNA in situ hybridization technique, CTCs obtained from the blood of kidney cancer patients can be divided into epithelial, interstitial, and mixed types (Fig. 5). At the same time, to determine the prognostic value of the top 10 hub genes, Kaplan–Meier plotter bioinformatics analysis was used to analyze overall survival and relapse-free survival of patients with renal clear cell carcinoma. Pan-cancer RNA-seq was used to measure expression of the top 10 hub genes in 530 kidney renal clear cell carcinoma samples. (Fig. 6). Among them, CDC5L, ITGAV, CD59, EDN1, CAV1, PARVA, and PSMC2 have statistical significance in the prognosis of OS, and EDN1, ITGB5, POLR2L have statistical significance in the prognosis of RFS.
Fig. 5.
Different types of CTCs. CTCs were identified by the RNA in situ hybridization technique. Epithelial CTCs presented only Alexa Fluor 594 (Red color) labeled epithelial markers (EpCAM and CK8/18/19), mesenchymal CTCs exhibited only Alexa Fluor 488 (Green color) labeled mesenchymal markers (Vimentin and Twist), hybrid CTCs having both epithelial and mesenchymal markers were stained with both green and red immunofluorescent dyes
Fig. 6.
Kaplan–Meier overall survival analyses and relapse-free survival for the top ten hub genes expressed in renal clear cell carcinoma patients. P < 0.05 was considered statistically significant
Expression of PSMC2 in kidney cancer cell lines and tissues
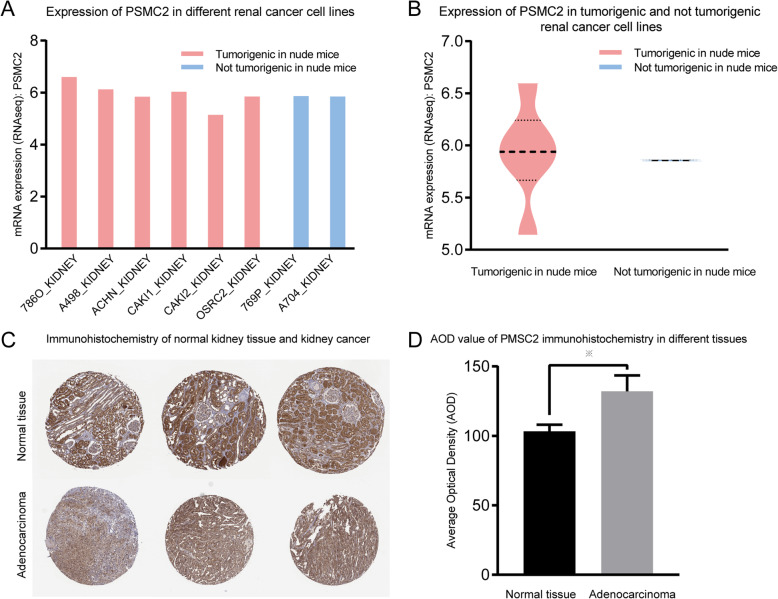
A total of 1019 cell lines related to PSMC2 RNAseq were obtained from the CCLE database, including 32 kidney cancer cell lines (Table S1). Klaudia conducted a systematic review of kidney cancer cell lines in 2016 [11], in the supplementary materials, the tumorigenicity of common kidney cancer cell lines in nude mice was summarized by Klaudia(Table S2). By combining PSMC2 RNA expression data of common renal cancer cell lines and tumor formation data of nude mice, the correlation between PSMC2 and invasiveness can be clarified, at the same time, the expression of PSMC2 in kidney cancer tissue was higher than that in normal kidney tissue. (Fig. 7).
Fig. 7.
A Expression levels of PSMC2 in different renal cancer cell lines. B Comparison of the expression levels of PSMC2 between tumorigenic and non-tumorigenic renal cancer cell lines. C Immunohistochemistry of PSMC2 in normal kidney tissue and kidney cancer tissue. D Quantitative analysis of PSMC2 immunohistochemistry in normal kidney tissue and kidney cancer tissue(P<0.05)
Discussion
CTCs play a key role in the metastasis of cancer, with the development of new detection technologies in recent years, the enrichment and detection of CTCs have been improved, making CTCs a key object in tumor research [4, 12]. In this study, the genetic chip results of CTCs from different cancer sources were obtained through the GEO database, and gene expression and PPI networks were analyzed through bioinformatics tools. At the same time, clinical samples and prognostic results were verified, to identify potential genes and proteins closely related to CTCs.
In the process of CTCs leaving the primary focus and entering the blood circulation, there are mainly two ways: tumor cells leave the primary tumor and enter the blood circulation after epithelial-mesenchymal transition (EMT), and tumor cells enter the blood circulation through the gap between neovascular endothelial cells [13, 14]. EMT plays a key role in changes in cell polarity loss and decreased intercellular adhesion, leading the tumor cells to gain invasive [15]. As tumor cells develop EMT, the cell-to-cell bridge is lost, the expression of epithelial markers such as keratin, E-cadherin, and Epcam decreases, and the expression of mesenchymal marker vimentin increases, and its morphology changes, get rid of the primary tumor and obtain aggressive [16]. This is similar to our findings. Whether it is GO enrichment analysis of DEGs or hub genes (Fig. 2, Fig. 4), they all contain BP related to EMT. However, in Fig. 2, log10 (P) is partly used as the judgment result to be statistically significant, and the strength of the argument is poor. The original GO enrichment analysis table (Table S4) generated by metascape tool contains the log10(q) related information of GO enrichment. “Log10(P)” is the p-value in log base 10. “Log10(q)” is the multi-test adjusted p-value in log base 10. A total of 234 enriched results of Log10(q) are statistically significant, and a large number of them contain GO results related to epithelial-mesenchymal transition. Such as epithelial differentiation, mesenchymal differentiation, cytoskeleton, cell adhesion, etc., and also includes biological processes related to downstream effects of EMT such as cell migration, invasion, etc. We also confirmed from clinical samples that CTCs do have EMT-related changes (Fig. 5).
When CTCs enter the blood circulation, they are affected by blood flow shear force, anoikis, and immune cell recognition and killing [17], which causes CTCs to have a shorter half-life in the blood, about 1–2 h [18]. The shear force will cause a large number of death of circulating tumor cells. Some studies have shown that mesenchymal tumor cells undergoing EMT are more resistant to shear force than epithelial circulating tumor cells [19]. CTCs inhibit caspase-related apoptosis by activating tropomyosin-associated kinase B (TrkB), thereby combating anoikis [20]. The selective expression of CD47 and other proteins by CTCs can reduce the killing of CTCs by immune cells and improve the viability of CTCs in the bloodstream [21]. This is also in line with our findings. In our enrichment of DEGs and hub genes, included signal pathways of fluid shear forces, molecular functions of protein kinases, immune responses, and biological processes of apoptosis (Fig. 2, Fig. 4).
Proteasome 26S subunit ATPase 2 (PSMC2) is a basic member encoding the 19S proteasome and plays a key role in the assembly of the 19 s and 26 s proteasomes, further regulating the protein degradation of eukaryotic cells [22–24]. Studies have shown that in ovarian cancer cells, inhibiting PSMC2 expression can inhibit cell proliferation [25]. In osteosarcoma samples, PSMC2 was highly expressed, and after silencing PSMC2, osteosarcoma cell lines (SaoS-2 and MG-63) showed cell proliferation inhibition, cell cycle arrest, and increased apoptosis, these changes were further confirmed in nude mice [26]. Similar findings have been confirmed in colorectal cancer cells, pancreatic cancer, and acute promyelocytic leukemia cells [27–29]. Further research suggests that miR-630 can act on PSMC2 and regulate cell growth, colony formation, migration and invasion, and EMT processes, at the same time, high PSMC2 expression is associated with poor prognosis [30]. Besides, proteasome inhibitor bortezomib is used as a first-line treatment in multiple myeloma [31]. This is similar to our findings. In renal cell carcinoma patients, PSMC2 is a poor prognostic factor for OS (HR = 1.78, 95% CI = 1.32–2.4, P < 0.001). At the same time, the average RNA expression of PSMC2 in renal cancer cells with tumorigenicity was higher than that of non-tumorigenic kidney cancer cells, but the data were too few to judge statistical significance. At the tissue level, the expression of PSMC2 in kidney cancer tissue was significantly higher than that in normal kidney tissue. Indirect evidence at the cellular and tissue level suggests to a certain extent that PSMC2 plays a role in promoting tumors in renal cell carcinoma. Therefore, PSMC2 is expected to become a prognostic factor and therapeutic target for renal cancer.
Although we obtain different genes by combining different data sets, and the existing research has adopted the similar merging method [32]. However, it is undeniable that such a treatment method needs to consider the impact of batch effects on the results. Batch effects, which occur because measurements are affected by laboratory conditions, reagent lots and personnel differences [33]. Combining or merging data from different microarray gene expression experiments for integrative analysis suffers from batch effects and it still is a challenging and difficult problem to be solved in computational biology [34]. In high-throughput data, if not handled properly, batch effects may lead to erroneous biological conclusions [35]. When we analyze the data, we normalized the data. Including a normalization step is now standard in data analysis of gene expression experiments [36]. However, normalization does not remove batch effects, which affect specific subsets of genes and may affect different genes in different ways [33]. Therefore, in the subsequent analysis, we introduced the R limma package, Law mentioned this differential expression methods for RNA-seq experiments of arbitrary complexity, for example experiments with multiple treatment factors, batch effects or numerical covariates [37]. However, since our experiment cannot change the high-throughput experimental design that has been included in the data set, which is high-throughput experiments should be designed to distribute batches and other potential sources of experimental variation across biological group [38]. Therefore, this limma package cannot effectively remove the batch effect of this research. Real biological effects genes and technical artifacts genes may exist in the DEG of each cancer type, and technical artifacts account for the majority. It is inevitable, Jeffrey T. Leek performs batch analysis on 9 high-throughput data (such as microarray, sequencing and mass spectrometry) from public databases. It was discovered that batch effects for all of these data sets, and substantial percentages (32.1–99.5%) of measured features showed statistically significant associations with processing date, irrespective of biological phenotype, this suggests that technical variability was more influential than biological variability across a range of experimental conditions and technologies [33]. Similarly, Margus Lukk constructed a global gene expression map by integrating microarray data from 5372 human samples representing 369 different cell and tissue types, disease states and cell lines. However, the authors did not explicitly address the batch effect problem, which turns to be a critical obstacle for genomic data integration [39]. Therefore, in the subsequent analysis, we adopted methods such as taking the intersect between the three lists and running network analysis to define the top 10 most important to reduce the possible impact of the batch effect. The key gene is then verified at the tissue level and clinical samples.
In our study, it was clarified that the functional enrichment of DEGs between CTCs and primary tumors focused on the acquisition of invasiveness and the biological processes of survival in the blood. At the same time, the clinical data were used to corroborate the results of the bioinformatics analysis, and the possibility of PSMC2 as a prognostic factor and treatment target was discussed. However, this study has the disadvantages of a small number of included specimens and insufficient types of tumors. In subsequent experiments, on the one hand, data from multiple centers and multiple cancer species can be collected to overcome the shortcomings of this experiment. On the other hand, the obtained hub gene can be verified by cell and molecule experiments, thereby laying a foundation for clarifying key molecular targets of CTCs.
Conclusion
Based on the bioinformatics analysis of three cancers in the GEO database, we obtained 589 common genes with different expressions between the CTCs and the primary tumor. Among these genes, GO / KEGG enrichment analysis suggests that the DEGs are mainly concentrated in CTCs that gain invasiveness through EMT, and fight against shear forces, apoptosis and immune responses in the blood circulation, and are verified by clinical samples from renal cancer patients. We also analyzed the PSMC2 in the hub gene and found that overexpression of PSMC2 in various cancers is associated with poor prognosis, clarified its value as a prognostic factor and therapeutic target for renal cancer.
Supplementary information
Acknowledgements
Not applicable.
Declarations
Not applicable.
Abbreviations
- CTCs
Circulating tumor cells
- GEO
Gene Expression Omnibus
- DEGs
Differentially expressed genes
- GO
Gene Ontology
- KEGG
Kyoto Encyclopedia of Genes and Genomes
- PPI
Protein-protein interaction
- EMT
Epithelial-mesenchymal transition
- BP
Biological processes
- CC
Cell components
- MF
Molecular functions
- PSMC2
Proteasome 26S subunit ATPase 2
Authors’ contributions
TC, ZLW designed the study and revised the article. YBG, FSX, YYW performed the statistical analyses, interpreted the data, and was a major contributor in writing the manuscript. JHT, ZYW performed the statistical analyses and supported the collection of the phenotypic data. All authors have read and approved the manuscript.
Funding
This work was supported by the Xi ‘an science and technology planning project, 201805096YX4SF30. The funder Zhenlong Wang designed the study and revised the article. The funding body provides support in data analysis.
Availability of data and materials
The datasets analyzed during the current study are available in the GEO database through GEO accession numbers GSE82198, GSE99394, GSE31023, GSE65505, GSE67982, GSE76250, GSE50746.
Ethics approval and consent to participate
The studies using clinical samples were approved by the institutional review boards of the Second Affiliated Hospital of Xi’an Jiaotong University, and written-informed consents were obtained from all participants.
Consent for publication
Not applicable.
Competing interests
The authors declare that they have no competing interests, and all authors should confirm its accuracy.
Footnotes
Publisher’s Note
Springer Nature remains neutral with regard to jurisdictional claims in published maps and institutional affiliations.
Yibing Guan, Fangshi Xu and Yiyuan Wang contributed equally to this work.
Supplementary information
Supplementary information accompanies this paper at 10.1186/s12920-020-00795-w.
References
- 1.Pantel K, Alix-Panabieres C. Circulating tumour cells in cancer patients: challenges and perspectives. Trends Mol Med. 2010;16(9):398–406. doi: 10.1016/j.molmed.2010.07.001. [DOI] [PubMed] [Google Scholar]
- 2.Aceto N, Toner M, Maheswaran S, Haber DA. En route to metastasis: circulating tumor cell clusters and epithelial-to-Mesenchymal transition. Trends Cancer. 2015;1(1):44–52. doi: 10.1016/j.trecan.2015.07.006. [DOI] [PubMed] [Google Scholar]
- 3.Rossi E, Fabbri F. CTCs 2020: Great expectations or unreasonable dreams. Cells. 2019;8(9). [DOI] [PMC free article] [PubMed]
- 4.Guan Y, Xu F, Tian J, Chen H, Yang C, Huang S, Gao K, Wan Z, Li M, He M, et al. Pathology of circulating tumor cells and the available capture tools (review) Oncol Rep. 2020;43(5):1355–1364. doi: 10.3892/or.2020.7533. [DOI] [PubMed] [Google Scholar]
- 5.Zhou G, Soufan O, Ewald J, Hancock REW, Basu N, Xia J. NetworkAnalyst 3.0: a visual analytics platform for comprehensive gene expression profiling and meta-analysis. Nucleic Acids Res. 2019;47(W1):W234–W241. doi: 10.1093/nar/gkz240. [DOI] [PMC free article] [PubMed] [Google Scholar]
- 6.Zhou Y, Zhou B, Pache L, Chang M, Khodabakhshi AH, Tanaseichuk O, Benner C, Chanda SK. Metascape provides a biologist-oriented resource for the analysis of systems-level datasets. Nat Commun. 2019;10(1):1523. doi: 10.1038/s41467-019-09234-6. [DOI] [PMC free article] [PubMed] [Google Scholar]
- 7.Szklarczyk D, Gable AL, Lyon D, Junge A, Wyder S, Huerta-Cepas J, Simonovic M, Doncheva NT, Morris JH, Bork P, et al. STRING v11: protein-protein association networks with increased coverage, supporting functional discovery in genome-wide experimental datasets. Nucleic Acids Res. 2019;47(D1):D607–D613. doi: 10.1093/nar/gky1131. [DOI] [PMC free article] [PubMed] [Google Scholar]
- 8.Shannon P, Markiel A, Ozier O, Baliga NS, Wang JT, Ramage D, Amin N, Schwikowski B, Ideker T. Cytoscape: a software environment for integrated models of biomolecular interaction networks. Genome Res. 2003;13(11):2498–2504. doi: 10.1101/gr.1239303. [DOI] [PMC free article] [PubMed] [Google Scholar]
- 9.Ghandi M, Huang FW, Jane-Valbuena J, Kryukov GV, Lo CC, McDonald ER, 3rd, Barretina J, Gelfand ET, Bielski CM, Li H, et al. Next-generation characterization of the Cancer cell line encyclopedia. Nature. 2019;569(7757):503–508. doi: 10.1038/s41586-019-1186-3. [DOI] [PMC free article] [PubMed] [Google Scholar]
- 10.Uhlen M, Zhang C, Lee S, Sjostedt E, Fagerberg L, Bidkhori G, Benfeitas R, Arif M, Liu Z, Edfors F, et al. A pathology atlas of the human cancer transcriptome. Science. 2017;357(6352). [DOI] [PubMed]
- 11.Brodaczewska KK, Szczylik C, Fiedorowicz M, Porta C, Czarnecka AM. Choosing the right cell line for renal cell cancer research. Mol Cancer. 2016;15(1):83. doi: 10.1186/s12943-016-0565-8. [DOI] [PMC free article] [PubMed] [Google Scholar]
- 12.Joosse SA, Gorges TM, Pantel K. Biology, detection, and clinical implications of circulating tumor cells. EMBO Mol Med. 2015;7(1):1–11. doi: 10.15252/emmm.201303698. [DOI] [PMC free article] [PubMed] [Google Scholar]
- 13.Pantel K, Speicher MR. The biology of circulating tumor cells. Oncogene. 2016;35(10):1216–1224. doi: 10.1038/onc.2015.192. [DOI] [PubMed] [Google Scholar]
- 14.El-Kenawi A, Hanggi K, Ruffell B. The immune microenvironment and Cancer metastasis. Cold Spring Harb Perspect Med. 2019. [DOI] [PMC free article] [PubMed]
- 15.Thiery JP, Acloque H, Huang RY, Nieto MA. Epithelial-mesenchymal transitions in development and disease. Cell. 2009;139(5):871–890. doi: 10.1016/j.cell.2009.11.007. [DOI] [PubMed] [Google Scholar]
- 16.Dongre A, Weinberg RA. New insights into the mechanisms of epithelial-mesenchymal transition and implications for cancer. Nat Rev Mol Cell Biol. 2019;20(2):69–84. doi: 10.1038/s41580-018-0080-4. [DOI] [PubMed] [Google Scholar]
- 17.Mohme M, Riethdorf S, Pantel K. Circulating and disseminated tumour cells - mechanisms of immune surveillance and escape. Nat Rev Clin Oncol. 2017;14(3):155–167. doi: 10.1038/nrclinonc.2016.144. [DOI] [PubMed] [Google Scholar]
- 18.Meng S, Tripathy D, Frenkel EP, Shete S, Naftalis EZ, Huth JF, Beitsch PD, Leitch M, Hoover S, Euhus D, et al. Circulating tumor cells in patients with breast cancer dormancy. Clin Cancer Res. 2004;10(24):8152–8162. doi: 10.1158/1078-0432.CCR-04-1110. [DOI] [PubMed] [Google Scholar]
- 19.Mitchell MJ, King MR. Computational and experimental models of cancer cell response to fluid shear stress. Front Oncol. 2013;3:44. doi: 10.3389/fonc.2013.00044. [DOI] [PMC free article] [PubMed] [Google Scholar]
- 20.Douma S, Van Laar T, Zevenhoven J, Meuwissen R, Van Garderen E, Peeper DS. Suppression of anoikis and induction of metastasis by the neurotrophic receptor TrkB. Nature. 2004;430(7003):1034–1039. doi: 10.1038/nature02765. [DOI] [PubMed] [Google Scholar]
- 21.Baccelli I, Schneeweiss A, Riethdorf S, Stenzinger A, Schillert A, Vogel V, Klein C, Saini M, Bauerle T, Wallwiener M, et al. Identification of a population of blood circulating tumor cells from breast cancer patients that initiates metastasis in a xenograft assay. Nat Biotechnol. 2013;31(6):539–544. doi: 10.1038/nbt.2576. [DOI] [PubMed] [Google Scholar]
- 22.Smith DM, Fraga H, Reis C, Kafri G, Goldberg AL. ATP binds to proteasomal ATPases in pairs with distinct functional effects, implying an ordered reaction cycle. Cell. 2011;144(4):526–538. doi: 10.1016/j.cell.2011.02.005. [DOI] [PMC free article] [PubMed] [Google Scholar]
- 23.da Fonseca PC, He J, Morris EP. Molecular model of the human 26S proteasome. Mol Cell. 2012;46(1):54–66. doi: 10.1016/j.molcel.2012.03.026. [DOI] [PubMed] [Google Scholar]
- 24.Kaneko T, Hamazaki J, Iemura S, Sasaki K, Furuyama K, Natsume T, Tanaka K, Murata S. Assembly pathway of the mammalian proteasome base subcomplex is mediated by multiple specific chaperones. Cell. 2009;137(5):914–925. doi: 10.1016/j.cell.2009.05.008. [DOI] [PubMed] [Google Scholar]
- 25.Nijhawan D, Zack TI, Ren Y, Strickland MR, Lamothe R, Schumacher SE, Tsherniak A, Besche HC, Rosenbluh J, Shehata S, et al. Cancer vulnerabilities unveiled by genomic loss. Cell. 2012;150(4):842–854. doi: 10.1016/j.cell.2012.07.023. [DOI] [PMC free article] [PubMed] [Google Scholar]
- 26.Song M, Wang Y, Zhang Z, Wang S. PSMC2 is up-regulated in osteosarcoma and regulates osteosarcoma cell proliferation, apoptosis and migration. Oncotarget. 2017;8(1):933–953. doi: 10.18632/oncotarget.13511. [DOI] [PMC free article] [PubMed] [Google Scholar]
- 27.He J, Xing J, Yang X, Zhang C, Zhang Y, Wang H, Xu X, Wang H, Cao Y, Xu H, et al. Silencing of proteasome 26S subunit ATPase 2 regulates colorectal Cancer cell proliferation, apoptosis, and migration. Chemotherapy. 2019;64(3):146–154. doi: 10.1159/000502224. [DOI] [PubMed] [Google Scholar]
- 28.Wang H, Liu S, Lu X, Zhao X, Chen S, Li X. Gene expression profile changes in NB4 cells induced by realgar. Chin Med J. 2003;116(7):1074–1077. [PubMed] [Google Scholar]
- 29.Qin J, Wang W, An F, Huang W, Ding J. PSMC2 is up-regulated in pancreatic Cancer and promotes Cancer cell proliferation and inhibits apoptosis. J Cancer. 2019;10(20):4939–4946. doi: 10.7150/jca.27616. [DOI] [PMC free article] [PubMed] [Google Scholar]
- 30.Li GW, Yan X. Lower miR-630 expression predicts poor prognosis of osteosarcoma and promotes cell proliferation, migration and invasion by targeting PSMC2. Eur Rev Med Pharmacol Sci. 2019;23(5):1915–1925. doi: 10.26355/eurrev_201903_17229. [DOI] [PubMed] [Google Scholar]
- 31.Richardson PG, Sonneveld P, Schuster MW, Irwin D, Stadtmauer EA, Facon T, Harousseau JL, Ben-Yehuda D, Lonial S, Goldschmidt H, et al. Bortezomib or high-dose dexamethasone for relapsed multiple myeloma. N Engl J Med. 2005;352(24):2487–2498. doi: 10.1056/NEJMoa043445. [DOI] [PubMed] [Google Scholar]
- 32.Boral D, Vishnoi M, Liu HN, Yin W, Sprouse ML, Scamardo A, Hong DS, Tan TZ, Thiery JP, Chang JC, et al. Molecular characterization of breast cancer CTCs associated with brain metastasis. Nat Commun. 2017;8(1):196. doi: 10.1038/s41467-017-00196-1. [DOI] [PMC free article] [PubMed] [Google Scholar]
- 33.Leek JT, Scharpf RB, Bravo HC, Simcha D, Langmead B, Johnson WE, Geman D, Baggerly K, Irizarry RA. Tackling the widespread and critical impact of batch effects in high-throughput data. Nat Rev Genet. 2010;11(10):733–739. doi: 10.1038/nrg2825. [DOI] [PMC free article] [PubMed] [Google Scholar]
- 34.Lazar C, Meganck S, Taminau J, Steenhoff D, Coletta A, Molter C, Weiss-Solis DY, Duque R, Bersini H, Nowe A. Batch effect removal methods for microarray gene expression data integration: a survey. Brief Bioinform. 2013;14(4):469–490. doi: 10.1093/bib/bbs037. [DOI] [PubMed] [Google Scholar]
- 35.Akey JM, Biswas S, Leek JT, Storey JD. On the design and analysis of gene expression studies in human populations. Nat Genet. 2007;39(7):807–808. doi: 10.1038/ng0707-807. [DOI] [PubMed] [Google Scholar]
- 36.Allison DB, Cui X, Page GP, Sabripour M. Microarray data analysis: from disarray to consolidation and consensus. Nat Rev Genet. 2006;7(1):55–65. doi: 10.1038/nrg1749. [DOI] [PubMed] [Google Scholar]
- 37.Law CW, Chen Y, Shi W, Smyth GK. voom: precision weights unlock linear model analysis tools for RNA-seq read counts. Genome Biol. 2014;15(2):R29. doi: 10.1186/gb-2014-15-2-r29. [DOI] [PMC free article] [PubMed] [Google Scholar]
- 38.Johnson WE, Li C, Rabinovic A. Adjusting batch effects in microarray expression data using empirical Bayes methods. Biostatistics. 2007;8(1):118–127. doi: 10.1093/biostatistics/kxj037. [DOI] [PubMed] [Google Scholar]
- 39.Lukk M, Kapushesky M, Nikkila J, Parkinson H, Goncalves A, Huber W, Ukkonen E, Brazma A. A global map of human gene expression. Nat Biotechnol. 2010;28(4):322–324. doi: 10.1038/nbt0410-322. [DOI] [PMC free article] [PubMed] [Google Scholar]
Associated Data
This section collects any data citations, data availability statements, or supplementary materials included in this article.
Supplementary Materials
Data Availability Statement
The datasets analyzed during the current study are available in the GEO database through GEO accession numbers GSE82198, GSE99394, GSE31023, GSE65505, GSE67982, GSE76250, GSE50746.


