Abstract
A new type of absorbent with high efficiency was synthesized by KOH-activated slag-based geopolymer microspheres (K-SGM), which exhibited higher adsorption capacities for recycling Co(II) (Qe,K-SGM = 192.31 mg/g, Qe,Na-SGM = 91.21 mg/g) than NaOH-activated ones (Na-SGM). During the Co(II) adsorption process, these two kinds of geopolymeric adsorbents could be combined with heavy metal ions to optimize each other and form heavy metal-grown aid adsorbents. The morphology of Na-SGM and K-SGM was different which varied from coarse pores to nanonetwork or nanosheets after Co(II) adsorption, and the Brunauer–Emmett–Teller (BET) surface areas of Na-SGM (10.46 m2/g) and K-SGM (22.96 m2/g) increased to 117.38 and 228.73 m2/g after Co(II) adsorption, respectively. The BET surface area of K-SGM is twice that of Na-SGM whether before or after Co(II) ion adsorption. The hydrated ionic radius of K and Na, the alkalinity degree of K+ and Na+, the electronegativity of Na-SGM and K-SGM surface, the BET surface area and Fourier transform infrared changes of CO32– and OH before and after Co(II) adsorption, and X-ray photoelectron spectroscopy analysis like the relative content of geopolymer gel and bridging oxygen bonds in the Na-SGM and K-SGM are the fundamental reasons for the obvious differences in Co(II) adsorption between Na-SGM and K-SGM.
1. Introduction
Cobalt, a heavy metal, is a trace element strongly affecting human health.1 However, excess amounts of the metal can cause various pathological effects, such as gastrointestinal dysfunction, pneumonia, myocarditis, and goiter.2 Cobalt isotopes (Co60, Co57, and Co58) are also highly active radioactive elements that may lead to hair loss and diseases of the blood system (including anemia and leukemia) and even death.3 Currently, the degree of the cobalt ion pollution from industrial and nuclear wastewaters is increasing because of industrialization and modernization. Adsorption is one of the most commonly used methods to treat Co(II)-containing effluents4 because of its high efficiency, simplicity of operation, low cost, environmental friendliness, and reusability of adsorbents. Common adsorbents contained activated carbon,5 metallic,6 or nonmetallic oxides such as graphene oxide,7 alumina,8 zeolite,9 mineral,10 and so forth. Thus far, the reported adsorption materials generally have the following disadvantages.11 The adsorption capacity of the adsorbent is easily saturated. Heavy metal ions or products of chemical adsorption are enriched on the surface of the adsorbent to occupy most of the adsorption active sites, thereby sealing the active adsorption sites of the adsorbent. Then, the adsorption rate slows down to adsorption equilibrium which prevents the adsorption from continuing. Moreover, after the regeneration of the adsorbent, the adsorption efficiency and adsorption capacity decreased because of the decline of the Brunauer–Emmett–Teller (BET) surface areas of the adsorbent. In order to improve the adsorption efficiency and increase the adsorption capacity, most of the adsorbents are launched in the form of powder; these would result in increased sludge, difficult recovery, and more serious secondary pollution. Hence, it is significant that a kind of adsorbent is easy to recycle and continue adsorbing because their BET surface areas are increasing during heavy metal adsorption.
Geopolymer12 is an environment-friendly inorganic gel material with a three-dimensional network bonding structure which connected the silicon–oxygen tetrahedron with aluminum–oxygen tetrahedron. Its microspheres are commonly used to be the heavy-metal adsorbents13 because of low cost, high efficiency, simple post treatment,13b and easy recycling. Very few studies of the geopolymer reported adsorption for cobalt ions14 which was adsorbed by geopolymer powder. To the best of our knowledge, there was no report about geopolymer microspheres used for Co(II) adsorption.
There are three main steps in the formation process of alkali-activated aluminosilicate geopolymers: (1) raw materials (slag in this work) and alkali activator solution are dissolved to provide Al-containing components or Si-containing components. (2) When the surface of slag begins to dissolve, (−Si–O–Al−) and (−Si–O–Si−) will break to form aluminum salt monomers and silicon salt monomers. Alkaline activator solutions with different pH values will cause differences of the aluminum salt monomer and the silicon salt monomer after dissolution. (3) After the dissolution, a complex is formed between the aluminum salt monomer and the silicon salt monomer, and the polymerization–condensation reaction occurs; the H2O molecule is finally removed, and an inorganic geopolymer network structure is formed. Therefore, the adsorption capacity of different activator solutions of the geopolymer might be obviously different.
In the present work, KOH-activated and NaOH-activated slag-based geopolymer microspheres [M-SGM (M = Na, K)] were synthesized. The optimum geopolymer formulation was determined by the maximum adsorption capacities of Co(II). During the Co(II) adsorption process, these kinds of geopolymeric adsorbents could combine with heavy metal ions [Co(II) in this work] and optimize each other to form heavy metal-grown aid adsorbent which could make up for deficiencies mentioned above. Moreover, there are significant differences on Co(II) adsorption capacity between KOH-activated and NaOH-activated slag-based geopolymers. Because of this difference, it also brought a significant change in morphology, BET surface area, average pore diameter, and pore volume after Co(II) adsorption. The root causes of these great differences have also been discussed in depth. The derived findings in this study could provide significant information for the evaluation of adsorption behaviors between K-SGM and Na-SGS geopolymer microspheres.
2. Experimental Section
2.1. Materials and Characterization
The element composition of slag was measured by X-ray fluorescence (XRF-1800), and the results are listed in Table 1. Hydrochloric acid (AR) was gained from Chengdu Kelong Chemicals Co., Ltd. Sodium hydroxide (AR), potassium hydroxide (AR), and cobalt chloride hexahydrate (AR) were supplied from Guangdong Guanghua Sci-Tech Co., Ltd. The kinematic viscosity of industrial grade dimethyl silicone oil was 2000 mm2/s.
Table 1. Content of Chemical Element of Slag.
| element | content (wt %) |
|---|---|
| Ca | 26.55 |
| Na | 0.29 |
| Si | 15.99 |
| Fe | 0.44 |
| K | 0.34 |
| Mg | 5.63 |
| Mn | 0.46 |
| Ti | 0.48 |
| Al | 8.11 |
| S | 0.73 |
X-ray diffraction (XRD) was recorded on a diffractometer (Rigaku MiniFlex 600) instrument. The BET surface area, the pore size distributions, and N2 adsorption–desorption isotherms of M-SGM and M-SGM after Co(II) adsorption (M-SGM-Co, M = K or Na) were performed by an automatic specific surface area analyzer (TriStar II 3020). Fourier transform infrared (FT-IR, IRTracer-100) spectra were analyzed in the range of 400–4000 cm–1. The morphology of M-SGM and M-SGM-Co after Co(II) adsorption was observed by field emission scanning electron microscopy (FE-SEM, Hitachi SU8220), and their chemical components were determined by energy dispersive X-ray spectroscopy (EDX, Bruker). The surface composition and elemental valence configuration of M-SGM-Co were determined by X-ray photoelectron spectroscopy (XPS, ESCALAB 250XI+). The pH of the Co(II) solution was tested by a pH meter (INESA PHS-3C). Zeta potentials of M-SGM at different pH were obtained by a Malvern Zetasizer (NANO ZS90). The Co(II) concentration was tested by inductively coupled plasma (ICP) atomic emission spectroscopy (Thermo Fisher ICAP 6300). The external environment for Co(II) adsorption on M-SGM was controlled by a shaker (QYC-200). The degree of sphericity of M-SGM was observed by an optical microscope (Olympus SZ2-ILST). The amounts of gaseous products including CH4 and CO were measured by an on-line gas chromatograph (Agilent 4890D) equipped with a thermal conductivity detector.
2.2. Synthesis of K-SGM and Na-SGM Adsorbent
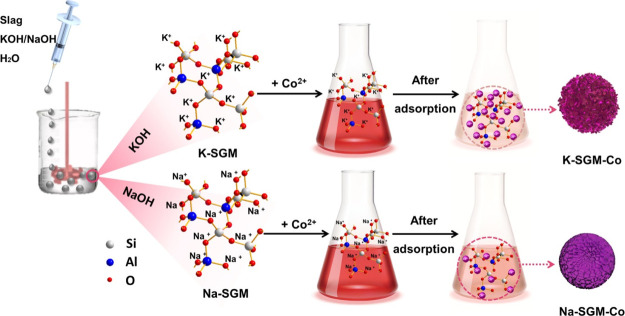
K-SGM and Na-SGM were prepared by the suspension dispersion solidification method15 by mixing KOH or NaOH solution with the slag, respectively (Figure 1). The geopolymer slurry was fully dispersed for a minute with a constant speed of 1000 rpm at different formulations [A = n(M2O)/n(Al2O3) = 1, 1.5 and 2, B = n(H2O)/n(MOH) = 17–20 (M = K, Na)] and then injected into the 60 °C silicone oil drop by drop. The silicone oil was stirred by a high-speed dispersion machine at 600 rpm at the same time. After caring at 60 °C for 10 h, the prepared microspheres were collected and initially washed with hot water to removal the silicone oil, then dried for night, and finally calcined at 450 °C for 6 h to remove residual silicone oil.15,16 K-SGM and Na-SGM with diameters of 98–125 μm were selected as adsorbents through screening, and the sample was labeled as M-A-B-SGS. Before Co(II) adsorption, the M-A-B-SGS were rinsed with hot deionized water to remove the residual KOH or NaOH until their pH value became 7.
Figure 1.
Schematic diagram of the preparation of K-SGM and Na-SGM and their Co2+ adsorption process.
2.3. Response Surface Methodology17 for Co(II) Adsorption on K-SGM and Na-SGM
Based on the results of K-SGM and Na-SGM, zeta potential analysis and various Co(II) existence forms in solution were determined at different pH by Visual Minteq software; the Co(II) adsorption capacities on K-SGM and Na-SGM were used as a response value to establish a proper response surface methodology (RSM)18 and optimize the following three response variables: pH (3–7) corresponding to A, initial concentration (100–300 mg/L) corresponding to B, and dosage (0.02–0.10 g) corresponding to C. The reaction was conducted in a temperature-controlled shaker with a constant speed of 250 rpm for 24 h at a temperature of 25 °C. The solution pH was carefully adjusted in the range of 3–7 by adding a small amount of HCl or KOH/NaOH solution (both 0.1 mol/L) and then measured with a pH meter. The concentrations were analyzed by ICP. The adsorption capacity of K-SGM or Na-SGM (Qe, mg/g) was calculated by the following equation19
| 1 |
where C0 and Ce (mg/L) are the Co(II) initial and equilibrium concentrations, respectively; V (L) is the volume of the solution; and m (g) is the mass of K-SGM or Na-SGM.
3. Results and Discussion
3.1. Formulation Studies of M-SGM
Starting with recipe research, Co(II) adsorption performance of the synthesized geopolymer at n(M2O)/n(Al2O3) = 1, 1.5, 2, and n(H2O)/n(M2O) = 17–20 was discussed to obtain the optimal formula.
To confirm whether the synthesized materials are microspheres, the SEM tests were performed as depicted in Figure 2. As can be seen in Figure 2, all the M-SGM of different formulations are spheres with a diameter of approximately 100 μm (see the insets of Figure 2). Na-SGM and K-SGM both exhibit gel-like coarse pores. With the increase of the mole ratios of n(M2O) to n(Al2O3) (also called the liquid–solid ratio), the pore structure on the microspheres surface becomes looser. It is mainly due to the fact that M2O came from MOH solution and Al2O3 came from slag in the preparation of the geopolymer. The lower the liquid–solid ratio is, the more compact the geopolymer structure is.19 In addition, the larger the mole ratios of n(H2O) to n(M2O) are, the looser the pore structure on the surface is. It is chiefly because that H2O not only provides places and medium for the dissolution of silicon and aluminum resources but also is used as a pore-making agent in the preparation process. When too little water was used in the preparation, silicon and aluminum cannot be completely dissolved, resulting in inadequate condensation polymerization.20 Excessive water in the preparation would lead to larger pore structure and lower material strength. Some of the excessive water remains in the geopolymer gel and will evaporate to form certain pores in the high-temperature curing process. The other part precipitates on the surface and does not participate in the reaction.
Figure 2.
SEM of surface microspheres activated by NaOH (a) and KOH (b) geopolymer with the mole ratios n(M2O)/n(Al2O3) = 1, 1.5, or 2, and n(H2O)/n(M2O) = 17–20.
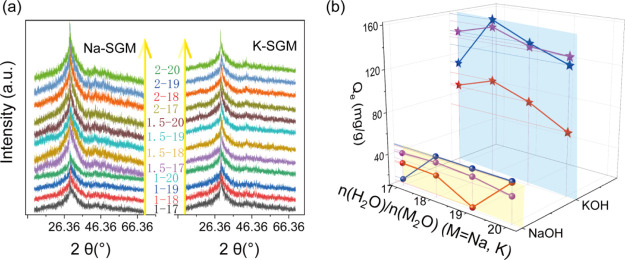
To confirm whether the synthesized microspheres activated by MOH are geopolymers, XRD was determined, as shown in Figure 3a. All the obtained XRD results indicate that the geopolymer was successfully synthesized from the MOH-activated slag with different formula, which was confirmed by the wide hump detected near 30°.13a When the mole ratio of n(M2O) to n(Al2O3) is 1, the XRD peak parameters of Na-SGM and K-SGM are the same. However, when the mole ratio of n(M2O) to n(Al2O3) is greater than 1, the full width at half-maximum of the NaOH-activated geopolymer are all broader and their peak heights are higher than that of the KOH-activated geopolymer, indicating that Na-SGM exhibits amorphous structures with smaller grains than K-SGM.
Figure 3.
XRD (a) of microspheres and Co2+ adsorption capacity of different formulations (b) (adsorption condition: t = 24 h, T = 25 °C, pH = 6.4, dosage = 0.04 g; the red, blue, and purple marked n(M2O)/n(Al2O3) = 1, 1.5, and 2, respectively).
To better compare the Co(II) adsorption capacities between Na-SGM and K-SGM, all the geopolymer formulations were tested for Co(II) adsorption under the same adsorption condition. As illustrated in Figure 3b, all the Co(II) adsorption capacities of K-SGM in different formulations are much higher than that of Na-SGM. Moreover, the formulation that the ratios of n(M2O) to n(Al2O3) and n(H2O) to n(M2O) are 1.5 and 18, respectively, exhibits the maximum adsorption capacity no matter in the KOH- or NaOH-activated geopolymer systems. The possible reasons are as follows. First, increasing the ratio of n(M2O) to n(Al2O3) is beneficial to form a loose structure and then could reduce the Co(II) diffusion resistance and promote the adsorption process. However, excessive proportion would lead to insufficient interaction of the slurry before dropping the silicone oil and the slurry solidification. Second, increasing the water content could help the materials dissolve completely and form pores. However, excessive water causes a too large pore structure which would reduce adsorption performance.
3.2. RSM Studies
In order to confirm optimum adsorption conditions, RSM21 was conducted. The geopolymer with the ratio of n(M2O) to n(Al2O3) of 1.5 and n(H2O) to n(M2O) of 18 was chosen to use in the following RSM studies and all the characterizations. Before the RSM experiments, the range of pH was selected to ensure adsorption rather than chemical precipitation. As shown in Figure 4a, the stable forms of Co2+ ions in the pH range from 1 to 14 simulated by Visual Minteq include Co(OH)−, Co4(OH)4–, Co(OH)3–, Co(OH)2, and Co2+ ions. In order to keep Co2+ ions in the solution, a solution pH below 7 was selected. Furthermore, to determine the isoelectric points of Na-SGM and K-SGM, their zeta potentials were studied as well (Figure 4b). Both Na-SGM and K-SGM remained negatively charged in the pH range from 4 to 10, indicating the absence of zero-charge points, which might be because of the abundance of Al(OH)4–, AlO(OH)32–, SiO2(OH)22–, and Si(OH)4– species in Na-SGM and K-SGM. Obviously, the zeta potential of K-SGM is more negative than that of Na-SGM. This was also one of the reasons for the relatively large Co(II) adsorption capacity of K-SGM.
Figure 4.
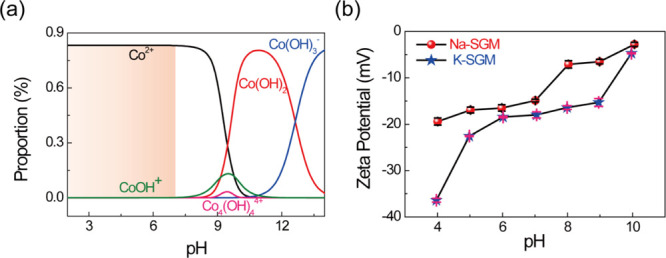
Existential form of Co2+ at different pH simulated by Visual Minteq (a) and zeta potentials of Na-SGM and K-SGM (b).
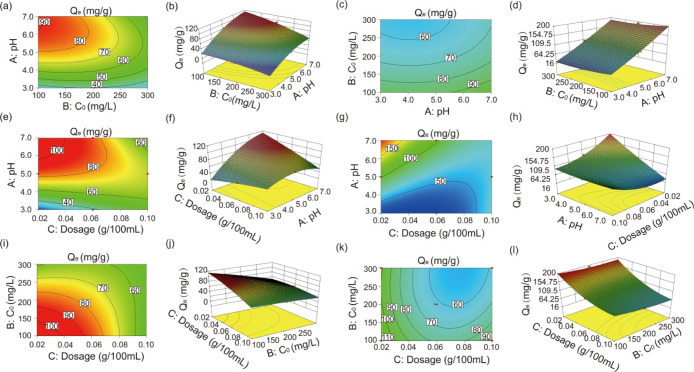
In this work, Box–Behnken designs combined with RSM17b were employed to optimize the Co(II) adsorption capacity. Effects of various factors on each response and the accuracy of the models were studied by performing ANOVA analysis (see Table 2). The p-values obtained for the interaction models were below 0.0001, indicating that the considered model could predict the Co(II) adsorption capacity well. Here, A, B, and C represented the pH, initial concentration, and dosage, respectively. In the Na-SGM sample, the p-values of A and B were both less than 0.0001 which is smaller than that of C (0.0003). In the K-SGM sample, the p-values of A and C were both less than 0.0001 which is smaller than that of B (0.0005). It could be suggested that the effects of A and B were stronger than that of C in the Na-SGM sample, while the effects of A and C were stronger than that of B in the K-SGM sample. To further compare the effects of A and B in the Na-SGM sample, A and C in the K-SGM sample, the obtained equations for the models (eqs 2 and 3) corresponding to RSM models of Na-SGM and K-SGM, respectively, were employed. The larger the absolute value of the given coefficient in eqs 2 and 3 was, the stronger the effect of the corresponding factor or interaction would be.22 Thus, it was found that the influence of A was stronger than B in the Na-SGM sample, while the influence of A was greater than that of C in the K-SGM sample because the absolute value of the A coefficient (13.90) was larger than that of the B coefficient (8.87) in the Na-SGM-Co sample, and the absolute value of the A coefficient (40.31) was larger than that of the C coefficient (15.07) in the K-SGM-Co sample. All effects could be ranked as A > B > C in the Na-SGM sample and A > C > B in the K-SGM sample. In other words, the adsorption capacity is most affected by pH, followed by the initial concentration, dosage in the Na-SGM sample, and finally, the initial concentration in the K-SGM sample.
| 2 |
| 3 |
Table 2. ANOVA Analysis for Response Surface Quadratic Model.
| source | sum of the squares | df | mean square | F value | P value | |
|---|---|---|---|---|---|---|
| modelNa-SGM | 6904.92 | 9 | 767.21 | 211.75 | <0.0001 | significant |
| modelK-SGM | 25373.76 | 9 | 2819.31 | 112.08 | <0.0001 | significant |
| A—pHNa-SGM | 1371.57 | 1 | 1371.57 | 378.55 | <0.0001 | |
| A—pHK-SGM | 13001.59 | 1 | 13001.59 | 516.86 | <0.0001 | |
| B—C0,Na-SGM | 628.88 | 1 | 628.88 | 173.57 | <0.0001 | |
| B—C0,K-SGM | 908.45 | 1 | 908.45 | 36.11 | 0.0005 | |
| C—dosageNa-SGM | 161.46 | 1 | 161.46 | 44.56 | 0.0003 | |
| C—dosageK-SGM | 1816.24 | 1 | 1816.24 | 72.20 | <0.0001 | |
| ABNa-SGM | 393.23 | 1 | 393.23 | 108.53 | <0.0001 | |
| ABK-SGM | 0.40 | 1 | 0.40 | 0.016 | 0.9036 | |
| ACNa-SGM | 2276.72 | 1 | 2276.72 | 628.37 | <0.0001 | |
| ACK-SGM | 6555.33 | 1 | 6555.33 | 260.60 | <0.0001 | |
| BCNa-SGM | 644.40 | 1 | 644.40 | 177.85 | <0.0001 | |
| BCK-SGM | 101.71 | 1 | 101.71 | 4.04 | 0.0843 | |
| A2Na-SGM | 1188.03 | 1 | 1188.03 | 327.89 | <0.0001 | |
| A2K-SGM | 135.72 | 1 | 135.72 | 5.40 | 0.0532 | |
| B2Na-SGM | 148.69 | 1 | 148.69 | 41.04 | 0.0004 | |
| B2K-SGM | 170.45 | 1 | 170.45 | 6.78 | 0.0353 | |
| C2Na-SGM | 16.09 | 1 | 16.09 | 4.44 | 0.0731 | |
| C2K-SGM | 2511.92 | 1 | 2511.92 | 99.86 | <0.0001 |
In addition, the regression model equations (eqs 2 and 3) had the R-squared values of 99.63% (Na-SGM) and 99.31% (K-SGM), proving that the utilized RSM was accurate and suitable for the condition optimization of the Co(II) adsorption capacity in the M-SGM.22 The interaction between any two factors is significant when the p-value is less than 0.05.23 The AB, AC, and BC interaction in the Na-SGM sample all met the abovementioned condition, suggesting their interactivity cannot be compared by this method. However, only the AC interaction (p-value < 0.0001) met this standard, while BC (p-value = 0.0843) and AB (p-value = 0.9036) interactions showed low interactivity in the K-SGM-Co sample. Therefore, the interaction between A and C was more significant than that between B and C or between A and B. By utilizing Design-Expert V8.0.6.1 software, the three-dimensional (3D) surface and contours for each factor and Co(II) adsorption capacity was generated (see Figure 5). Their shapes reflect the degree of interactions with high precision.24 For example, circular contours represent weak interactions, while elliptical contours denote strong interactions. The shapes of the Na-SGM depicted in Figure 5a,e,i of the interactions between A and B are mostly stepped and elliptical, followed by B and C, and finally, A and C. The shapes of K-SGM depicted in Figure 5k, which describes the interactions between A and B, are less stepped and elliptical25 than those presented in Figure 5c (describing the interactions between B and C). Consequently, the interaction orders are AB > BC > AC in the Na-SGM and AC > BC > AB in the K-SGM. Their order is exactly the opposite. The maximum adsorption amount of K-SGM (192.31 mg/g) is nearly twice that of Na-SGM (91.21 mg/g). The results indicated that the difference on Co(II) adsorption capacity between Na-SGM and K-SGM is obvious and not accidental. Their Co(II) adsorption capacities were relatively higher than other adsorbents (see Table 3).
Figure 5.
Response 3D surface and contour plot between each factor (A = pH, B = initial concentration, C = dosage) and response (the Co2+ adsorption capacity): response 3D surface and contour plot between A and B of Na-SGM(a,b) and K-SGM (c,d), A and C of Na-SGM (e,f) and K-SGM (g,h), B and C of Na-SGM (i,j) and K-SGM (k,l).
Table 3. Comparisons of Adsorption Capacities of the Present Adsorbent with other Adsorbents Designed for Co(II) Adsorption.
| no. | adsorbents | BET (mg/g) | BETafter adsorption (mg/g) | type | T (°C) | Qm (mg/g) | ref |
|---|---|---|---|---|---|---|---|
| 1 | metakaolin-based geopolymer | 39.24 | powder | 30 | 69.2 | (14) | |
| 2 | mmination GO nanocomposite | 320 | membrane | 25 | 116.35 | (39) | |
| 3 | NaX-zeolite | 637.4 | 412.6 | powder | 26.75 | 84.1 | (40) |
| 4 | UA-chitin | 48 | powder | 45 | 83.94 | (41) | |
| 5 | K-SGM | 22.96 | 228.73 | microsphere | 25 | 192.31 | this work |
| 6 | Na-SGM | 10.46 | 117.38 | microsphere | 25 | 91.21 | this work |
3.3. Characterization of M-SGM before and after Co(II) Adsorption
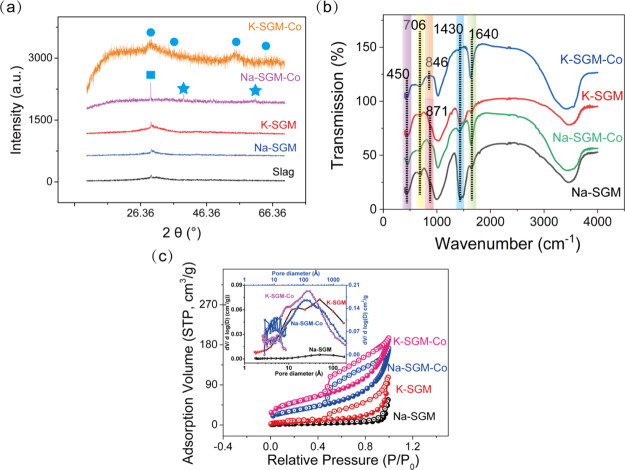
The compositions of the slag and M-SGM before and after Co(II) adsorption were determined by XRD, as shown in Figure 6a. The obtained XRD results indicate that the geopolymer was successfully synthesized from the MOH-activated slag, which was confirmed by the wide hump detected near 30°.13a Compared with M-SGM, several crystalline cobalt peaks (star-like marks) were observed for M-SGM-Co. The Co3O4 XRD pattern exhibited peaks at 55.65 and 65.23° in the K-SGM-Co sample and 18.99 and 49.08° in the Na-SGM-Co sample (JCPDS # 74-2120). In addition, Na-SGM-Co shows two peaks at 39.25 and 60.88°, corresponding to Co2(OH)3Cl (JCPDS # 73-2134). Other peaks of the K-SGM-Co are located at 29.1 and 35.00°, corresponding to Co3Al2Si3O12 (JDPDS # 77-0467). These results demonstrated that cobalt ions were successfully adsorbed on the M-SGM surface, which were also detected by FE-SEM (Figure 8a,e) and XPS (Figure 9). And these results also illustrated that Co(II) were adsorbed on the silicon and aluminum skeletons of K-SGM, while on the surface of Na-SGM.
Figure 6.
XRD characterization of slag, M-SGM, and M-SGM-Co (a), Barrett–Joyner–Halenda (BJH) pore-size distribution and N2 adsorption–desorption isotherm (b) and FT-IR spectra (c) of M-SGM and M-SGM-Co.
Figure 8.
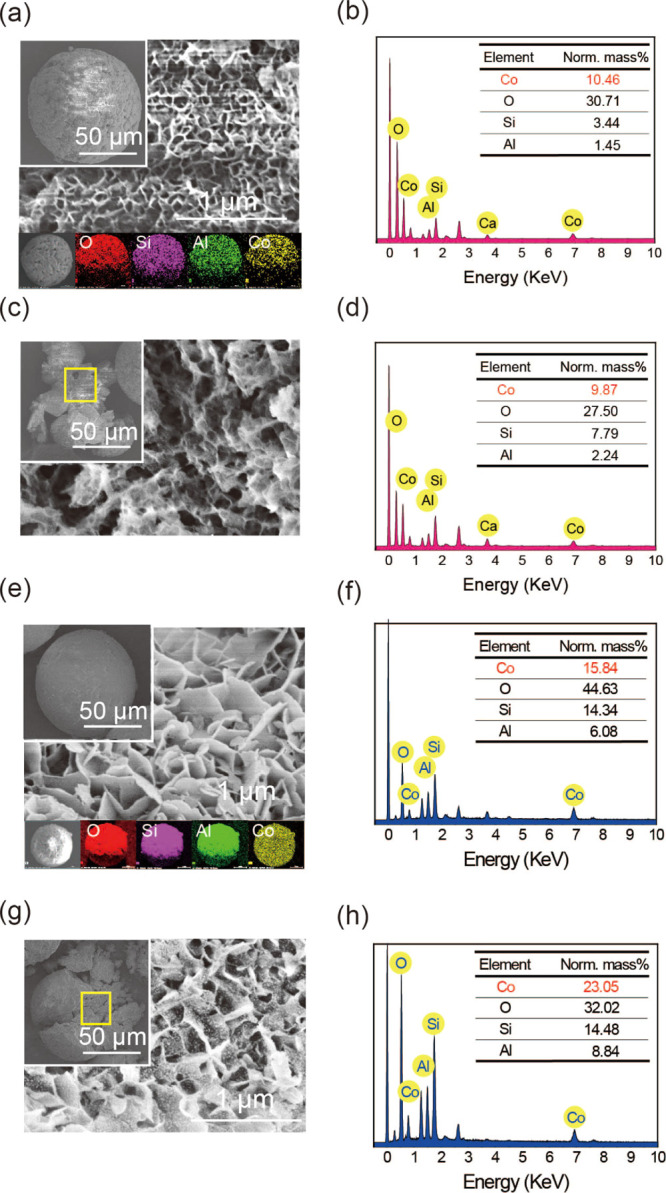
FE-SEM images of the surface of Na-SGM-Co (a) and K-SGM-Co (e), with their EDX of Na-SGM-Co (b) and K-SGM-Co (f) and their element mappings (g) of O (red), Si (purple), Al (green), and Co (yellow); FE-SEM images of the inside of Na-SGM-Co (c) and K-SGM-Co (g) with their EDX of Na-SGM-Co (d) and K-SGM-Co (h).
Figure 9.
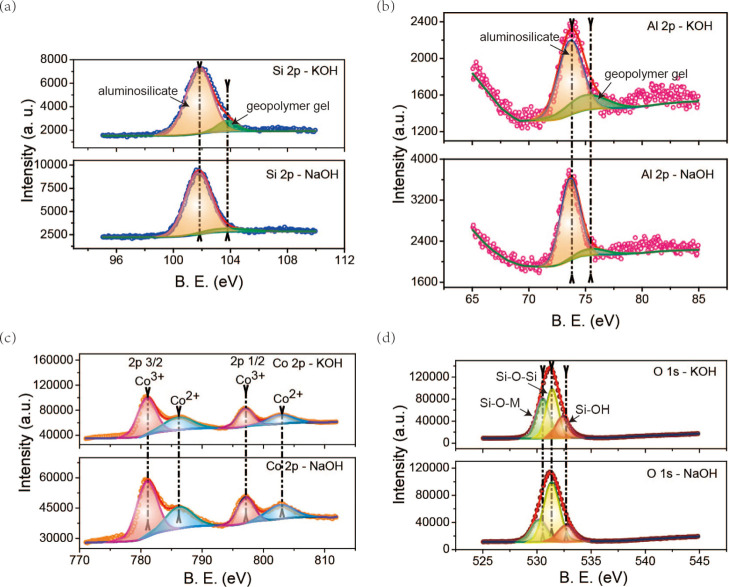
Si 2p (a), Al 2p (b), Co 2p (c), and O 1s (d) XPS spectra of Na-SGM-Co and K-SGM-Co.
The FT-IR spectra of M-SGM before and after Co(II) adsorption are shown in Figure 6b. Owing to the abundance of various hydroxyl-containing species on the geopolymer surface such as Al(OH)4–, AlO(OH)32–, SiO2(OH)22–, and Si(OH)4–, wide peaks at 3400 cm–1 and narrow peaks at 1630 cm–1 were observed for M-SGM-Co. Moreover, the peak at 1430 cm–1 was assigned to the CO32– species,26 which likely originated from CO2 adsorption on CaO in the raw material. The CO32– of K-SGM-Co disappears, while Na-SGM-Co is weakened but not disappeared. The peaks at 1630 cm–1 were strengthened after Co(II) adsorption. This shows that in the process of Co(II) adsorption on K-SGM, more silicon hydroxyls and aluminum hydroxyls such as [Al(OH)4]−, [AlO(OH)3]2–, [SiO2(OH)2]2–, [Si(OH)4]−, and so on are consumed than that of Co(II) adsorption on Na-SGM, causing the geopolymer microspheres to be incapable of absorbing more CO2. The bands at 871, 706, and 457 cm–127 were attributed to Si–O–Si asymmetric stretching, stretching vibrations of Si–O–T (T = Si/Al), and O–Si–O blending vibrations, respectively, confirming that the geopolymer was successfully synthesized. Further, the Co–O stretching vibration peaks of M-SGM-Co were located at 1046 cm–1,28 which might overlap with those produced by Al–O species. These results demonstrated that Co(II) was adsorbed successfully on the M-SGM surface.
According to the classification of the International Union of Pure and Applied Chemistry, the N2 adsorption–desorption isotherm of M-SGM and M-SGM-Co depicted in Figure 6c are all type IV isotherm.29 They exhibit an abrupt uptake at P/P0 = 0.04 and an H2 hysteresis loop spanning from P/P0 = 0.5 to P/P0 = 1.0 in K-SGM, Na-SGM-Co, and K-SGM-Co samples because of the presence of both micropores and mesopores in their structure. However, it is subject to flat at the medium-low pressure (P/P0 = 0–0.8) in the Na-SGM sample, which implied that monolayer adsorption changed to polylayer on the pore surface of Na-SGM. The corresponding pore size determined by BJH are displayed in the inset of Figure 6c, and the BET surface areas, average pore sizes, and pore volumes of M-SGM and M-SGM-Co are listed in Table 4. It could be seen that the BET surface area of KOH-activated microsphere was twice that of NaOH-activated microsphere whether before or after Co(II) adsorption. The BET surface area of Na-SGM-Co (117.38 m2/g) and K-SGM-Co (228.73 m2/g) was ten times that of Na-SGM (10.46 m2/g) and K-SGM (22.96 m2/g), respectively. M-SGM-Co with high surface area may provide additional adsorption active sites for Co2+ ions. Moreover, the average pore size of Na-SGM and K-SGM decreased from 21.31 to 9.10 nm and 16.33 to 6.81 nm after Co(II) adsorption, respectively, suggesting that a large part of the pores of M-SGM and M-SGM-Co contained mesopores. In addition, the pore volume of Na-SGM and K-SGM increased from 0.06 to 0.26 cm3/g and 0.10 to 0.39 cm3/g after Co(II) adsorption, indicating there are a large number of active adsorption sites after Co(II) adsorption. It can be concluded that M-SGM-containing adsorbates [Co(II) in this work] were the adsorption products which can be automatically deposited on the M-SGM and continues to form a porous nanostructure. They will not only seal the active surface of the original adsorbent but also create more active center adsorption sites. As a result, heavy metal-grown aid adsorbents or self-grown cobalt catalysts were named. These might be the reasons that M-SGM with low BET surface area exhibits so high Co(II) adsorption capacities. A possible formation of the heavy metal-grown aid adsorbents on M-SGM is demonstrated in Figure 7. At the beginning, as mentioned above, the zeta potential of K-SGM is more negative than that of Na-SGM; more Co(II) amount in the wastewater is attracted on the surface of K-SGM than that of Na-SGM. Correspondingly, the Cl– ion concentrations in the liquid boundary on the surface of K-SGM are higher than that of Na-SGM. More Cl– ions could more rapidly promote the formation of the metastable zone in the supersaturated region30 and the cobalt-containing crystal nuclei on the M-SGM surface, finally increasing the cobalt-containing crystal growth rate. With the increase of adsorption time, the crystal nuclei become grains, and then, the grains become crystals with a specific morphology.
Table 4. Changes of BET Surface Area, Pore Average Size, and Pore Volume between M-SGM and M-SGM-Co.
| sample | BET surface area (m2/g) | pore average size (nm) | pore volume (cm3/g) |
|---|---|---|---|
| Na-SGM | 10.46 | 21.31 | 0.06 |
| Na-SGM-Co | 117.38 | 9.1 | 0.26 |
| K-SGM | 22.96 | 16.33 | 0.10 |
| K-SGM-Co | 228.73 | 6.81 | 0.39 |
Figure 7.
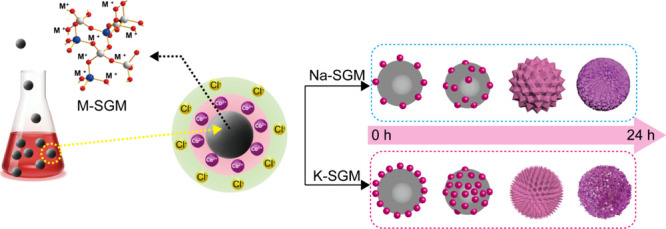
Schematic illustration of the possible formation process of heavy metal-grown aid adsorbents.
The FE-SEM images of Na-SGM-Co and K-SGM-Co are shown in Figure 8. They maintain spheres with a diameter of approximately 100 μm (see the insets of Figure 8a,c) after Co(II) adsorption. The Na-SGM-Co and K-SGM-Co show apparent networks (Figure 8a) with nanometer thickness and abundant nanosheets (Figure 8e) on their surfaces, respectively. The morphology of their interior (Figure 8c,g) is consistent with that of their surface, confirming that Co2+ ions were successfully adsorbed both on their surface and interior. However, all the morphology of the Na-SGM-Co and K-SGM-Co is very different from that of Na-SGM and K-SGM which both exhibit gel-like coarse pores (see Figure 2) which confirmed again the reasons about the low BET surface of Na-SGM and K-SGM. To determine their relative contents, EDX studies were performed for their surface and interior of Na-SGM-Co (Figure 8b,d) and K-SGM-Co (Figure 8f,h). The fraction of surface Na-SGM-Co species was 10.46%, which was more than that of the interior ones (9.87%), indicating that the adsorption was mainly controlled by the diffusion through the intraparticle layer. However, the fraction of surface K-SGM-Co species was 15.84%, which was less than that of the interior ones (23.05%), indicating that the adsorption was mainly controlled by the diffusion through the external boundary layer. Simultaneously, the FE-SEM images with elemental maps (Figure 9a,e) revealed that Co (yellow) atoms were evenly distributed on their surface. This might be the reason for the observed differences in the BET surface area and pore volume between M-SGM and M-SGM-Co as mentioned above.
To further study the surface composition and elemental valence configuration of K-SGM-Co and Na-SGM-Co and explore their adsorption potentials, the XPS spectra of Si (Figure 9a), Al (Figure 9b), Co (Figure 9c), and O (Figure 9d) were analyzed. The surface compositions of these samples calculated from the XPS data are summarized in Table 4 (the binding energy values were calibrated by assigning the position of the C 1s peak to 284.8 eV). The XPS spectra of Si 2p could be both split into two peaks as 101.73 (Si1, aluminosilicate products)31 and 103.77 eV (Si2, geopolymer gel products). As could be seen in Figure 9b, two peaks of Al 2p are located in 73.66 (Al1, luminosilicate products) and 75.53 eV s peaks (Al2, geopolymer gel products) in both samples.32 These indicated that no value of Si and Al binding energy are changed in the K-SGM-Co and Na-SGM-Co. However, as could be seen in Table 4, the fraction amounts of Si2/(Si1 + Si2) and Al2/(Al1 + Al2) of K-SGM-Co (10.91 and 25.43% respectively) are higher than that of Na-SGM-Co (8.62 and 10.50% respectively), implying that K-SGM-Co is more stable and this may be the reason for the larger adsorption capacity.
The Co 2p spectrum of K-SGM-Co and Na-SGM-Co contains two main peaks (Figure 9c). Their Co 2p3/2 peaks can be fitted by the two peaks centered at 781.032 and 797.0 eV, corresponding to Co3+ and Co2+ ions, respectively. The peaks of Co 2p1/2 centered at approximately 782.133 and 802.8 eV34 can be ascribed to Co3+ and Co2+ ions, respectively. The position of the Co 2p spectrum of Na-SGM-Co is the same as that of K-SGM-Co. However, the intensity of peak of Na-SGM-Co is weaker, implying its lower level of adsorption capacity. The fraction value of Co2+/(Co2+ + Co3+) of K-SGM-Co (37.99%) and Na-SGM-Co (38.09%) in Table 4 showed that Co3+ was the main form of Co ions adsorbed on the microspheres and that both Co3+ and Co2+ ions existed simultaneously on their surfaces, which were in good agreement with the XRD results (Table 5).
Table 5. Surface Compositions of M-SGM-Co.
| atomic concentration (at. %) | atomic ratio (at. %) | ||||||||||||
|---|---|---|---|---|---|---|---|---|---|---|---|---|---|
| sample | Si1 | Si2 | Al1 | Al2 | Co2+ | Co3+ | O1 | O2 | O3 | Si2/(Si1 + Si2) | Al2/(Al1 + Al2) | Co2+/(Co2+ + Co3+) | (O1 + O3)/(O1 + O2 + O3) |
| Na-SGM-Co | 91.38 | 8.62 | 89.50 | 10.50 | 61.91 | 38.09 | 22.58 | 60.32 | 17.10 | 8.62 | 10.50 | 38.09 | 38.68 |
| K-SGM-Co | 89.09 | 10.91 | 74.57 | 25.43 | 62.01 | 37.99 | 37.43 | 41.91 | 20.66 | 10.91 | 25.43 | 37.99 | 58.09 |
The O 1s XPS spectrum (Figure 9d) of K-SGM-Co and Na-SGM-Co were resolved into three peaks. In the Na-SGM-Co and K-SGM-Co samples, their first two peaks located at 530.535 and 531.4 eV36 were generally assigned to nonbridging oxygen (Si–O–M, O1) and bridging oxygen (Si–O–Si, O2), respectively. The peaks at 532.38 eV in the K-SGM-Co and 532.70 eV in the Na-SGM-Co were both attributed to the silanol group (Si–OH, O3). The Si–O–M bonds exhibit high reactivity of geopolymerization. The Si–O–Si bonds were corresponded to the silicon skeletons in the synthesized geopolymer. The Si–OH bonds have basic groups. Therefore, the Si–O–M and Si–OH bonds are more active than Si–O–Si bonds for Co(II) adsorption. By calculating the area ratio of (O1 + O3)/(O1 + O2 + O3), the obtained content of (O1 + O3) in the K-SGM-Co (58.09%) and Na-SGM-Co (39.68%) implied that K-SGM-Co might potentially exhibit higher adsorption and catalytic activity.
3.4. Root Reason for the Difference on Co(II) Adsorption Capacity between Na-SGM and K-SGM
Given the obvious difference which mentioned above many times in Co(II) adsorption capacity on Na-SGM and K-SGM, the reasons behind this should be the most concerned by researchers. A couple of the following reasons are well explained. First of all, the adsorption capacity of the same heavy metal ions [Co(II) in this work] on KOH-activated and NaOH-activated geopolymer is inversely proportional to the hydrated ionic radius of K and Na. As hydrated ionic radius of Na (3.58 Å) is greater than that of K (3.31 Å),37 the geopolymer slurry which KOH activated reacts and dissolves more sufficiently than that which NaOH activated. Second, the more fully the reaction is carried out, the more the geopolymer gel contains, and the greater adsorption capacity will be. The ionization process (−Si–OH + M+OH– → Si–O–M+·H2O)38 is a critical step in the geopolymeric depolymerization. The speed of this process depends on the alkalinity of the M+ ion. As the alkalinity degree of K+ is stronger than that of Na+ at the same mole ratios n(M2O)/n(Al2O3) and n(H2O)/n(M2O), the Co(II) adsorption capacity of K-SGM was relatively stronger than that of Na-SGM. Third, the Co(II) affinity was proportional to the electronegativity of the geopolymer surface. As mentioned above in Figure 4b, the electronegativity of K-SGM is greater than that of Na-SGM. Under the same condition, K-SGM exhibited preferable Co(II) adsorption capacity. Fourth, their BET surface areas are different whether before or after Co(II) adsorption. In the geopolymer preparation process, H2O is not only used as solvent but also as the pore-making agent. As hydrated ionic radius of K is smaller than that of Na, the formed pores of K-SGM are also smaller than that of Na-SGM when the water evaporates. This results in a larger BET surface area of K-SGM (22.96 m2/g) and lower than that of Na-SGM (10.46 m2/g). The BET surface area of K-SGM-Co (228.73 m2/g) and Na-SGM-Co (117.38 m2/g) are both approximately ten times than that of K-SGM and Na-SGM because they are heavy metal-grown aid adsorbent or self-grown cobalt catalysts as mentioned above. Five, as mentioned above from FT-IR, the CO32– of K-SGM-Co disappears, while Na-SGM-Co is weakened but not disappeared. This shows that in the process of Co(II) adsorption on K-SGM, more silicon hydroxyl and aluminum hydroxyl such as [Al(OH)4]−, [AlO(OH)3]2–, [SiO2(OH)2]2–, [Si(OH)4]−, and so on are consumed than that of Co(II) adsorption on Na-SGM, causing the geopolymer microspheres to be incapable of absorbing more CO2. Last but not least, according to the XPS analysis as mentioned above, K-SGM contained more geopolymer gel which exhibited higher binding energy and has a relatively less bridged oxygen bonds than Na-SGM. These might be the other critical factors that the adsorption capacities of K-SGM are stronger than that of Na-SGM.
4. Conclusions
In this work, the NaOH-activated and KOH-activated geopolymer microspheres were successfully synthesized with different formulations, and the target formulations were chosen by exploring their optimal Co(II) adsorption capacity. It was found that there are obvious differences on Co(II) adsorption capacity between them (Qe,Na-SGM = 91.21 mg/g, Qe,K-SGM = 192.31 mg/g). This difference also brings about the following significant changes. The Na-SGM-Co and K-SGM-Co shows apparent network structures with nanometer thickness and abundant nanosheets on their surface, respectively, while the morphology of the Na-SGM and K-SGM both revealed a gel-like coarse pore. The BET surface area of Na-SGM-Co (117.38 m2/g) and K-SGM-Co (228.73 m2/g) was ten times that of Na-SGM (10.46 m2/g) and K-SGM (22.96 m2/g), respectively. M-SGM-Co with high surface area may provide additional active sites for Co2+ ions. It also could be seen that the BET surface area of the KOH-activated microsphere was twice that of the NaOH-activated microsphere whether before or after Co(II) adsorption. Moreover, the average pore size of Na-SGM and K-SGM decreased from 21.31 to 9.10 nm and from 16.33 to 6.81 nm after Co(II) adsorption, respectively, suggesting that a large part of M-SGM and M-SGM-Co contained mesopores. In addition, the pore volume of Na-SGM and K-SGM increased from 0.06 to 0.26 cm3/g and 0.10 to 0.39 cm3/g after Co(II) adsorption, indicating the existence of a large number of active adsorption sites after Co(II) adsorption. It could be suggested that M-SGM could combine with heavy metal ions [Co(II) in this work] to optimize each other and form heavy metal-grown aid adsorbents. The hydrated ionic radius of K and Na, the alkalinity degree of K+ and Na+, the electronegativity of Na-SGM and K-SGM surface, the BET surface area and FT-IR changes of CO32– and OH between M-SGM and M-SGM-Co, XPS analysis like the relative content of geopolymer gel, and nonbridged oxygen bonds in the Na-SGM and K-SGM were concluded to be the root reasons for the obvious differences in Co(II) adsorption between Na-SGM and K-SGM. The derived findings in this study could provide significant information for the evaluation of adsorption behaviors between KOH-activated and NaOH-activated geopolymer microspheres.
Acknowledgments
This work was supported by the Chinese Natural Science Fund (grant: 51772055), the Guangxi Natural Science Fund (grant: 2016GXNSFGA380003).
The authors declare no competing financial interest.
References
- Smičiklas I.; Dimovic I.; Mitric M. Removal of Co2+ from aqueous solutions by hydroxyapatite. Water Res. 2006, 40, 2267–2274. 10.1016/j.watres.2006.04.031. [DOI] [PubMed] [Google Scholar]
- Anirudhan T. S.; Deepa J. R.; Christa J. Nanocellulose/nanobentonite composite anchored with multi-carboxyl functional groups as an adsorbent for the effective removal of Cobalt(II) from nuclear industry wastewater samples. J. Colloid Interface Sci. 2016, 467, 307–320. 10.1016/j.jcis.2016.01.023. [DOI] [PubMed] [Google Scholar]
- Shahat A.; Awual M. R.; Naushad M. Functional ligand anchored nanomaterial based facial adsorbent for cobalt(II) detection and removal from water samples. Chem. Eng. J. 2015, 271, 155–163. 10.1016/j.cej.2015.02.097. [DOI] [Google Scholar]
- Su Q.; Yang S.; He Y.; Qin Z.; Cui X. Prepared self-growing supported nickel catalyst by recovering Ni (II) from metal wastewater using geopolymer microspheres. J. Hazard. Mater. 2020, 389, 121919. 10.1016/j.jhazmat.2019.121919. [DOI] [PubMed] [Google Scholar]
- Gunjate J. K.; Meshram Y. K.; Khope R. U.; Awachat R. S. Adsorption based recovery of cobalt using chemically modified activated carbon. Mater. Today: Proc. 2020, 29, 1150. 10.1016/j.matpr.2020.05.388. [DOI] [Google Scholar]
- Hossein Beyki M.; Shemirani F.; Shirkhodaie M. Aqueous Co(II) adsorption using 8-hydroxyquinoline anchored gamma-Fe2O3@chitosan with Co(II) as imprinted ions. Int. J. Biol. Macromol. 2016, 87, 375–384. 10.1016/j.ijbiomac.2016.02.077. [DOI] [PubMed] [Google Scholar]
- Bulin C.; Zhang Y.; Li B.; Zhang B. Removal performance of aqueous Co(II) by magnetic graphene oxide and adsorption mechanism. J. Phys. Chem. Solid. 2020, 144, 109483. 10.1016/j.jpcs.2020.109483. [DOI] [Google Scholar]
- Dehghani M. H.; Yetilmezsoy K.; Salari M.; Heidarinejad Z.; Yousefi M.; Sillanpää M. Adsorptive removal of cobalt(II) from aqueous solutions using multi-walled carbon nanotubes and γ-alumina as novel adsorbents: Modelling and optimization based on response surface methodology and artificial neural network. J. Mol. Liq. 2020, 299, 112154. 10.1016/j.molliq.2019.112154. [DOI] [Google Scholar]
- Joseph I. V.; Tosheva L.; Doyle A. M. Simultaneous removal of Cd(II), Co(II), Cu(II), Pb(II), and Zn(II) ions from aqueous solutions via adsorption on FAU-type zeolites prepared from coal fly ash. J. Environ. Chem. Eng. 2020, 8, 103895. 10.1016/j.jece.2020.103895. [DOI] [Google Scholar]
- Karaa M.; Yuzer H.; Sabah E.; Celik M. S. Adsorption of cobalt from aqueous solutions onto sepiolite. Water Res. 2003, 37, 224–232. 10.1016/s0043-1354(02)00265-8. [DOI] [PubMed] [Google Scholar]
- Dąbrowski A. Adsorption—from theory to practice. Adv. Colloid Interface Sci. 2001, 93, 135–224. 10.1016/s0001-8686(00)00082-8. [DOI] [PubMed] [Google Scholar]
- Davidovits J. Geopolymers Inorganic polymerie new materials. J. Therm. Anal. 1991, 37, 1633–1656. 10.1007/bf01912193. [DOI] [Google Scholar]
- a Tang Q.; Wang K.; Yaseen M.; Tong Z.; Cui X. Synthesis of highly efficient porous inorganic polymer microspheres for the adsorptive removal of Pb2+ from wastewater. J. Clean. Prod. 2018, 193, 351–362. 10.1016/j.jclepro.2018.05.094. [DOI] [Google Scholar]; b Wang K.; Wang F.; Chen F.; Cui X.; Wei Y.; Shao L. One-pot preparation of NaA zeolite microspheres for highly selective and continuous removal of Sr(II) from aqueous solution. ACS Sustain. Chem. Eng. 2019, 7, 2459–2470. 10.1021/acssuschemeng.8b05349. [DOI] [Google Scholar]
- Kara I.; Tunc D.; Sayin F.; Akar S. T. Study on the performance of metakaolin based geopolymer for Mn(II) and Co(II) removal. Appl. Clay Sci. 2018, 161, 184–193. 10.1016/j.clay.2018.04.027. [DOI] [Google Scholar]
- Tang Q.; Wang K.; Yaseen M.; Tong Z.; Cui X. Synthesis of highly efficient porous inorganic polymer microspheres for the adsorptive removal of Pb2+ from wastewater. J. Clean. Prod. 2018, 193, 351–362. 10.1016/j.jclepro.2018.05.094. [DOI] [Google Scholar]
- Su Q.; Yang S.; He Y.; Qin Z.; Cui X. Prepared self-growing supported nickel catalyst by recovering Ni (II) from metal wastewater using geopolymer microspheres. J. Hazard. Mater. 2020, 389, 121919. 10.1016/j.jhazmat.2019.121919. [DOI] [PubMed] [Google Scholar]
- a Hafeez A.; Taqvi S. A. A.; Fazal T.; Javed F.; Khan Z.; Amjad U. S.; Bokhari A.; Shehzad N.; Rashid N.; Rehman S.; Rehman F. Optimization on cleaner intensification of ozone production using Artificial Neural Network and Response Surface Methodology: Parametric and comparative study. J. Clean. Prod. 2020, 252, 119833. 10.1016/j.jclepro.2019.119833. [DOI] [Google Scholar]; b Revathi T.; Jeyalakshmi R.; Rajamane N. P. Geopolymeric binder: the effect of silica fume addition on Fly activation by using response surface methodology. Mater. Today: Proc. 2018, 5, 8727–8734. 10.1016/j.matpr.2017.12.299. [DOI] [Google Scholar]
- Hu Y.-y.; Pan C.; Zheng X.; Hu F.; Xu L.; Xu G.; Jian Y.; Peng X. Prediction and optimization of adsorption properties for Cs+ on NiSiO@NiAlFe LDHs hollow spheres from aqueous solution: Kinetics, isotherms, and BBD model. J. Hazard. Mater. 2021, 401, 123374. 10.1016/j.jhazmat.2020.123374. [DOI] [PubMed] [Google Scholar]
- Darmayanti L.; Kadja G. T. M.; Notodarmojo S.; Damanhuri E.; Mukti R. R. Structural alteration within fly ash-based geopolymers governing the adsorption of Cu2+ from aqueous environment: Effect of alkali activation. J. Hazard. Mater. 2019, 377, 305–314. 10.1016/j.jhazmat.2019.05.086. [DOI] [PubMed] [Google Scholar]
- Cui Y.; Wang D.; Wang Y.; Sun R.; Rui Y. Effects of the n(H2O: Na2Oeq) ratio on the geopolymerization process and microstructures of fly ash-based geopolymers. J. Non-Cryst. Solids 2019, 511, 19–28. 10.1016/j.jnoncrysol.2018.12.033. [DOI] [Google Scholar]
- Xia M.; Ye C.; Pi K.; Liu D.; Gerson A. R. Cr(III) removal from simulated solution using hydrous magnesium oxide coated fly ash: Optimization by response surface methodology (RSM). Chin. J. Chem. Eng. 2018, 26, 1192–1199. 10.1016/j.cjche.2017.11.008. [DOI] [Google Scholar]
- Mary Ealias A.; Saravanakumar M. P. Facile synthesis and characterisation of AlNs using Protein Rich Solution extracted from sewage sludge and its application for ultrasonic assisted dye adsorption: Isotherms, kinetics, mechanism and RSM design. J. Environ. Manage. 2018, 206, 215–227. 10.1016/j.jenvman.2017.10.032. [DOI] [PubMed] [Google Scholar]
- Kim U.; Cho D. H.; Heo J.; Yun J. H.; Choi D. Y.; Cho K.; Kim H. S. Two-stage cultivation strategy for the improvement of pigment productivity from high-density heterotrophic algal cultures. Bioresour. Technol. 2020, 302, 122840. 10.1016/j.biortech.2020.122840. [DOI] [PubMed] [Google Scholar]
- Wei X.; Xu X.; Yang X.; Li J.; Liu Z. Visible light degradation of reactive black-42 by novel Sr/Ag-TiO2@g-C3N4 photocatalyst: RSM optimization, reaction kinetics and pathways. Spectrochim. Acta, Part A 2020, 228, 117870. 10.1016/j.saa.2019.117870. [DOI] [PubMed] [Google Scholar]
- Ajmi K.; Vismara E.; Manai I.; Haddad M.; Hamdi M.; Bouallagui H. Polyvinyl acetate processing wastewater treatment using combined Fenton’s reagent and fungal consortium: Application of central composite design for conditions optimization. J. Hazard. Mater. 2018, 358, 243–255. 10.1016/j.jhazmat.2018.06.050. [DOI] [PubMed] [Google Scholar]
- Xiang J.; Liu L.; He Y.; Zhang N.; Cui X. Early mechanical properties and microstructural evolution of slag/metakaolin-based geopolymers exposed to karst water. Cem. Concr. Compos. 2019, 99, 140–150. 10.1016/j.cemconcomp.2019.03.009. [DOI] [Google Scholar]
- Ge Y.; Cui X.; Kong Y.; Li Z.; He Y.; Zhou Q. Porous geopolymeric spheres for removal of Cu(II) from aqueous solution: synthesis and evaluation. J. Hazard. Mater. 2015, 283, 244–251. 10.1016/j.jhazmat.2014.09.038. [DOI] [PubMed] [Google Scholar]
- Cheng S. Y.; Kou J. W.; Gao Z. H.; Huang W. Preparation of complexant-modified Cu/ZnO/Al2O3 catalysts via hydrotalcite-like precursors and its highly efficient application in direct synthesis of isobutanol and ethanol from syngas. Appl. Catal., A 2018, 556, 113–120. 10.1016/j.apcata.2018.02.027. [DOI] [Google Scholar]
- Ariharan A.; Viswanathan B.; Nandhakumar V. Nitrogen Doped Graphene as Potential Material for Hydrogen Storage. Graphene 2017, 06, 41–60. 10.4236/graphene.2017.62004. [DOI] [Google Scholar]
- a Li G.; Liping X.; Su G.; Zhuang X.; Li Z.; He Y. Study on the growth and characterization of KDP-type crystalsLattice Distortion in KCl-doped KDP Single Crystals Grown from Aqueous Solutions. J. Cryst. Growth 2005, 274, 555–562. 10.1016/j.jcrysgro.2004.10.052. [DOI] [Google Scholar]; b Sekar Ramasubramanian P.; Mahadevan C. Lattice Distortion in KC1-doped KDP Single Crystals Crown from Aqueous Solutions. Cryst. Res. Technol. 1991, 26, K179–K182. 10.1002/crat.2170260737. [DOI] [Google Scholar]
- Black L.; Stumm A.; Garbev K.; Stemmermann P.; Hallam K. R.; Allen G. C. X-ray photoelectron spectroscopy of the cement clinker phases tricalcium silicate and β-dicalcium silicate. Cement Concr. Res. 2003, 33, 1561–1565. 10.1016/s0008-8846(03)00097-8. [DOI] [Google Scholar]
- Ye N.; Chen Y.; Yang J.; Liang S.; Hu Y.; Hu J.; Zhu S.; Fan W.; Xiao B. Transformations of Na, Al, Si and Fe species in red mud during synthesis of one-part geopolymers. Cement Concr. Res. 2017, 101, 123–130. 10.1016/j.cemconres.2017.08.027. [DOI] [Google Scholar]
- Xiong J.; Wu Q.; Mei X.; Liu J.; Wei Y.; Zhao Z.; Wu D.; Li J. Fabrication of Spinel-Type PdxCo3–xO4 Binary Active Sites on 3D Ordered Meso-macroporous Ce-Zr-O2 with Enhanced Activity for Catalytic Soot Oxidation. ACS Catal. 2018, 8, 7915–7930. 10.1021/acscatal.8b01924. [DOI] [Google Scholar]
- Liu Q.; Bian B.; Fan J.; Yang J. Cobalt doped Ni based ordered mesoporous catalysts for CO2 methanation with enhanced catalytic performance. Int. J. Hydrogen Energy 2018, 43, 4893–4901. 10.1016/j.ijhydene.2018.01.132. [DOI] [Google Scholar]
- Ma Y. Y.; Wu C. X.; Feng X. J.; Tan H. Q.; Yan L. K.; Liu Y.; Kang Z. H.; Wang E. B.; Li Y. G. Highly efficient hydrogen evolution from seawater by a low-cost and stable CoMoP@C electrocatalyst superior to Pt/C. Energy Environ. Sci. 2017, 10, 788–798. 10.1039/c6ee03768b. [DOI] [Google Scholar]
- Zhang D. W.; Wang D. M.; Xie F. Z. Microrheology of fresh geopolymer pastes with different NaOH amounts at room temperature. Constr. Build. Mater. 2019, 207, 284–290. 10.1016/j.conbuildmat.2019.02.149. [DOI] [Google Scholar]
- Tansel B.; Sager J.; Rector T.; Garland J.; Strayer R. F.; Levine L.; Roberts M.; Hummerick M.; Bauer J. Significance of hydrated radius and hydration shells on ionic permeability during nanofiltration in dead end and cross flow modes. Sep. Purif. Technol. 2006, 51, 40–47. 10.1016/j.seppur.2005.12.020. [DOI] [Google Scholar]
- Phair J. W.; Van Deventer J. S. J. Effect of the silicate activator pH on the microstructural characteristics of waste-based geopolymers. Int. J. Miner. Process. 2002, 66, 121–143. 10.1016/s0301-7516(02)00013-3. [DOI] [Google Scholar]
- Fang F.; Kong L.; Huang J.; Wu S.; Zhang K.; Wang X.; Sun B.; Jin Z.; Wang J.; Huang X. J.; Liu J. Removal of cobalt ions from aqueous solution by an amination graphene oxide nanocomposite. J. Hazard. Mater. 2014, 270, 1–10. 10.1016/j.jhazmat.2014.01.031. [DOI] [PubMed] [Google Scholar]
- Zhang X.; Yang S.; Tang D.; Yang R. Synthesis of zeolite NaX at 25°C and 95°C: Characterization, cobalt exchange and catalytic performance in epoxidation of styrene. Mater. Res. Bull. 2015, 70, 343–347. 10.1016/j.materresbull.2015.04.049. [DOI] [Google Scholar]
- Dotto G. L.; Cunha J. M.; Calgaro C. O.; Tanabe E. H.; Bertuol D. A. Surface modification of chitin using ultrasound-assisted and supercritical CO2 technologies for cobalt adsorption. J. Hazard. Mater. 2015, 295, 29–36. 10.1016/j.jhazmat.2015.04.009. [DOI] [PubMed] [Google Scholar]


