Abstract
Overexpression of human epidermal growth factor receptor 2 (HER2) is associated with more frequent cancer recurrence and metastasis. Sensitive sensing of HER2 in living breast cancer cells is crucial in the early stages of cancer and to further understand its role in cells. Biomedical imaging has become an indispensable tool in the fields of early cancer diagnosis and therapy. In this study, we designed and synthesized platinum (Pt) nanocluster bionanoprobes with red emission (Ex/Em = 535/630 nm) for fluorescence imaging of HER2. Our Pt nanoclusters, which were synthesized using polyamidoamine (PAMAM) dendrimer and preequilibration, exhibited approximately 1% quantum yield and possessed low cytotoxicity, ultrasmall size, and excellent photostability. Furthermore, combined with ProteinA as an adapter protein, we developed Pt bionanoprobes with minimal nonspecific binding and utilized them as fluorescent probes for highly sensitive optical imaging of HER2 at the cellular level. More importantly, molecular probes with long-wavelength emission have allowed visualization of deep anatomical features because of enhanced tissue penetration and a decrease in background noise from tissue scattering. Our Pt nanoclusters are promising fluorescent probes for biomedical applications.
Introduction
Human epidermal growth factor receptor 2 (HER2) is a member of the transmembrane receptor family.1 HERs are essential for regulating cell proliferation and differentiation.2−4 However, inappropriate activation of HERs is associated with the initiation and development of a variety of cancer types, and their expression level displays a prognostic value. Therefore, HER2 is a promising candidate as an early-stage cancer prognostic indicator and anticancer therapeutic target.5−11
Biomedical imaging to specifically detect and monitor HER2 has become an indispensable tool in the field of early tumor diagnosis.5−11 Recently, our and other research groups have been demonstrating that fluorescent noble-metal nanoclusters can be used as biomedical nanoprobes for highly sensitive fluorescence imaging of cancer at both the cellular and whole organism levels. Noble-metal nanoclusters, such as gold (Au),12−16 silver (Ag),17−20 copper (Cu),21−23 and platinum (Pt),24−31 are composed of several to a few hundred metal atoms, and these metal nanoclusters have ultrasmall size, excellent photostability, and facile surface functionalization. Furthermore, metal nanoclusters exhibit quantum confinement effects and molecular-like properties. Metal nanoclusters with tunable emission from ultraviolet to near-infrared (NIR) have been reported in the last few decades.
Highly fluorescent Au nanoclusters have been popular for the bioimaging.13−16 Although Pt nanomaterials have wide catalytic applications, the fluorescent properties of Pt nanoclusters have not been well investigated. However, because Pt nanoclusters have excellent biocompatibility and fluorescence properties, which are comparable to those of Au nanoclusters, the development of these nanoclusters can tremendously enhance the field of nanomaterials.
In our previous studies, we developed blue- and green-emitting Pt nanoclusters24,25 and demonstrated that Pt nanoclusters have higher biocompatibility than other metal nanoclusters, except gold, and can be utilized as molecular nanoprobes for bioimaging. Le Guével et al.(30) and Huang et al.(27,28) reported the synthesis of yellow-emitting Pt nanoclusters and applied them to biosensing and cellular imaging. However, because most fluorescent Pt nanoclusters reported so far have emissions from 470 to 570 nm, far-red or NIR emitting Pt nanoclusters, which are often preferable in vivo imaging because of enhanced tissue penetration and reduced background noise from tissue scattering and autofluorescence, have never been achieved.
In this study, we report the synthesis of Pt nanoclusters with an emission peak in the 620–640 nm range, high biocompatibility, and excellent stability under physiological conditions and demonstrate that the nanoclusters can be utilized as biomolecular probes to image HER2 in SK-BR-3 (breast cancer) cells. Polyamidoamine (PAMAM) dendrimers,24,25 dimethylformamide,31 and thiolated ligand etching30 have been utilized to synthesize Pt nanoclusters. In particular, PAMAM dendrimers, which are used as molecular templates to produce Pt nanoclusters, have various molecular sizes in the generation of G0–G7 and consist of an alkyl-diamine core, tertiary amine branches, and amidoethanol surfaces. Tertiary amine branches trap the Pt ions by forming a coordination bond. Therefore, increasing the generation of PAMAM dendrimers increases the number of tertiary amine branches, and more Pt ions are incorporated to produce larger Pt nanoclusters with longer emission wavelengths. In this work, we synthesized red-emitting Pt nanoclusters by using PAMAM (G5–OH) (PAMAM dendrimers with hydroxyl surface groups of fifth generation) because PAMAM (G5–OH) can incorporate more Pt ions than PAMAM (G4–OH), which we used to prepare blue- and green-emitting Pt nanoclusters in previous works.24,25
Results and Discussion
Characterization of Pt Nanoclusters
Pt nanoclusters are generally synthesized by reducing hexachloroplatinic acid salt (H2PtCl6) with a reducing agent in the presence of PAMAM dendrimers (Scheme 1). Preparation of the red-emitting fluorescent Pt nanoclusters was achieved by controlling the experimental conditions: the molecular ratio of Pt/PAMAM (G5–OH) from 90:1 to 360:1 and the pre-equilibration time from 1 to 8 days. The optimized molecular ratio of Pt/PAMAM (G5–OH) for obtaining the red-emitting Pt nanoclusters was 180:1. We observed weak fluorescence emission from Pt nanoclusters synthesized at other molecular ratios (Figure S1). Pt nanoclusters prepared at preequilibration times of 1 to 8 days exhibited the most intense fluorescence in the red region after 5 days of incubation for Pt/PAMAM (G5–OH) = 180:1 (Figure S2). Under optimized conditions [Pt/PAMAM (G5–OH) = 180:1, five days], Pt nanoclusters displayed red fluorescence with a maximum excitation/emission wavelength of 535/630 nm (Figure 1).
Scheme 1. Synthesis of Red-Emitting Pt Nanoclusters.
Fructose was added as a reducing agent.
Figure 1.
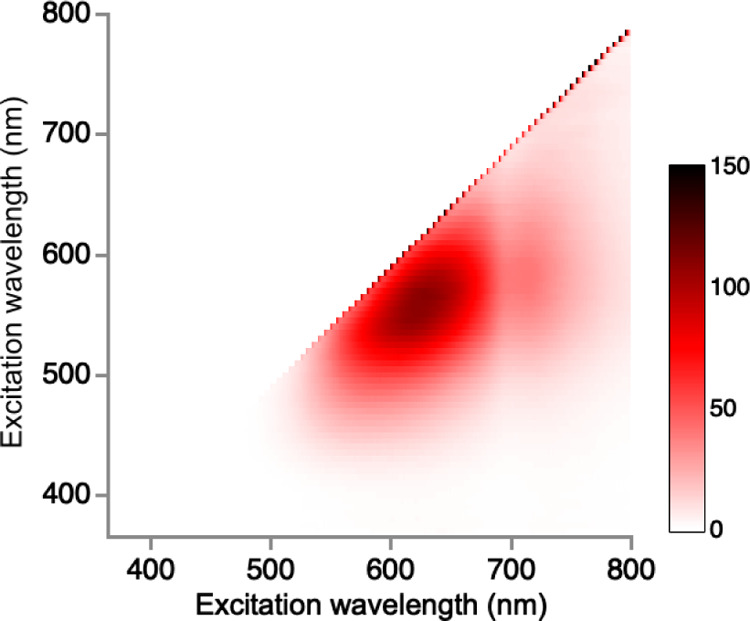
Excitation/emission matrix spectra of Pt nanoclusters.
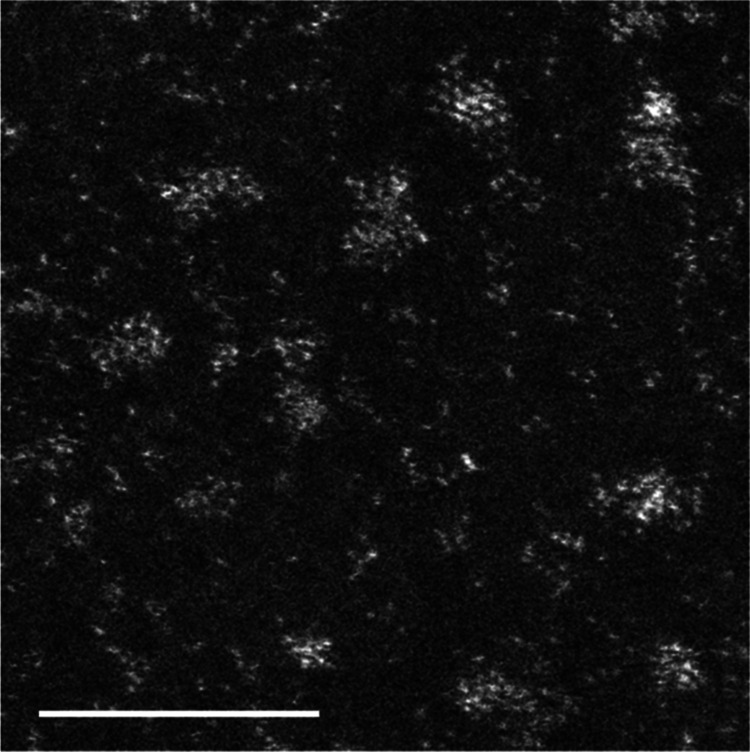
As PAMAM (G5–OH) has a large size (5.7 nm), we were concerned that Pt nanoclusters embedded in PAMAM (G5–OH) would inhibit steric biomolecular mechanisms in living organisms. To avoid this steric hindrance, we performed ligand exchange to extract Pt nanoclusters from PAMAM (G5–OH) using 4-aminobutyl acid (Ami). Ami was added at a molecular ratio of Pt/Ami from 1:100 to 1:200, and these reaction mixtures were allowed to stand for at least 1 week. The ligand-exchanged Pt nanoclusters (PtAmi) were further purified by anion-exchange chromatography to remove PAMAM (G5–OH) and impurities. The eluted fractions showed bright-red emission under visible light (488 nm). Inductively coupled plasma mass spectrometry (ICP-MS) indicated that this fraction included only Pt (2.67 mg/L). The quantum yields (QY) for the Pt nanoclusters were found to be 1% in water. However, matrix-assisted laser desorption/ionization time-of-flight mass spectrometry (MALDI-TOF/MS, AXIMA-CFR, SHIMADZU) showed a broad peak arising from five stable isotopes of Pt. We were unable to estimate the cluster size and number of Pt atoms in the Pt nanoclusters. High-angle annular dark-field–scanning transmission electron microscopy (HAADF–STEM) images showed the morphology of Pt nanoclusters and dispersed Pt atoms as clear bright contrasts because of atomic number (Z) contrast proportional to Z2 (Figure 2).
Figure 2.
HAADF–STEM image of Pt nanoclusters scale bar = 5 nm.
Cellular Viability of PtAmi
Before applying PtAmi as a nanoprobe for detecting and imaging HER2 in living cells, an investigation into its cytotoxicity was carried out using a Countess II Automated Cell Counter and SK-BR-3 breast cancer cells. As shown in Figure 3, PtAmi (1 nM) had a negligible effect on SK-BR-3 cell viability for up to 48 h. Furthermore, the cells incubated with 10 and 100 nM of PtAmi for 48 h did not show obvious cytotoxicity, indicating that PtAmi possesses excellent biocompatibility and could potentially be applied to biomedical imaging.
Figure 3.
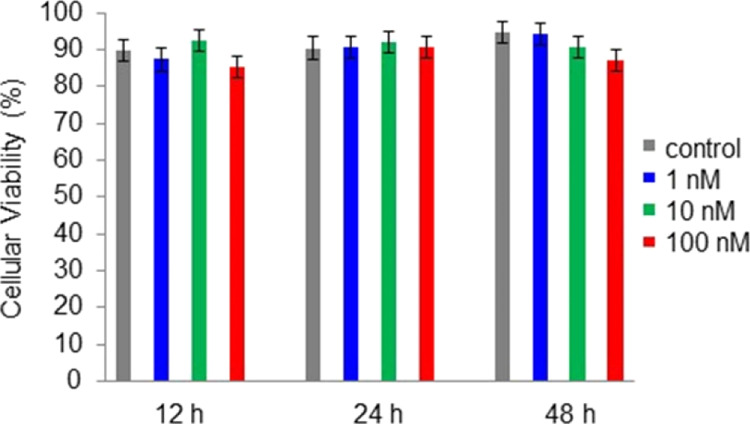
Cellular viability test for PtAmi cytotoxicity in SK-BR-3 cells using the Countess II Automated Cell Counter.
Development and Validation of Pt Bionanoprobes for HER2 Detection
We conjugated PtAmi with an anti-HER2 antibody using ProteinA, which was then confirmed by gel electrophoresis (Figure S3). The red-emitting fluorescence and blue bands corresponded to Pt nanoclusters and proteins (ProteinA and anti-HER2 antibody). The charge states of PtAmi, ProteinA, and anti-HER2 antibodies were found to be negative, slightly negative, and positive, respectively. When PtAmi was directly conjugated with anti-HER2 antibody, the charge of the anti-HER2 antibody was slightly negative, indicating that this antibody was labeled with Pt nanoclusters. However, we also observed a large amount of aggregates and precipitates. Next, we utilized ProteinA as an adapter protein and observed its mobility shift, which indicated that it was conjugated with Pt nanoclusters without the formation of aggregates.
Imaging of HER2 In Vitro
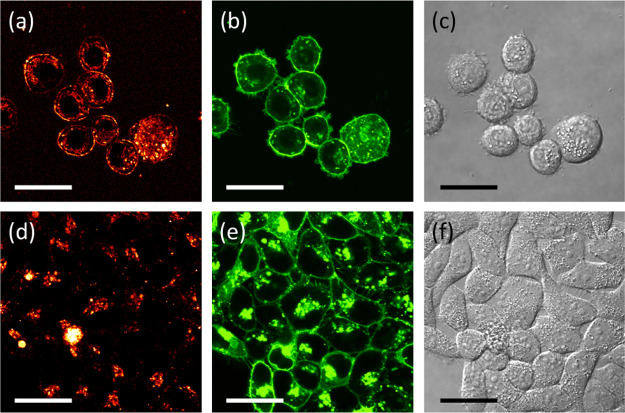
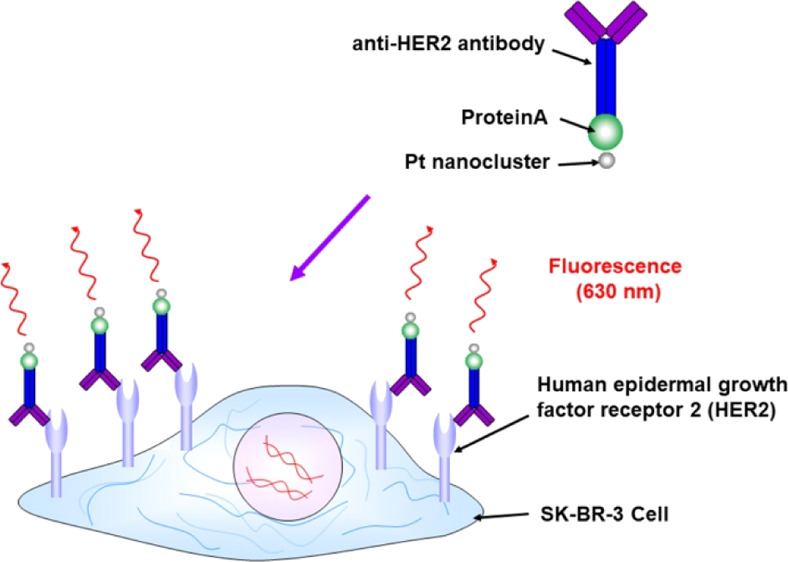
The Pt bionanoprobe (ProteinA conjugated Pt nanocluster) was then applied to image HER2 in SK-BR-3, a HER2-overexpressing breast cancer cell line.10,11 Confocal laser scanning microscopy was also applied to study HER2 via a red fluorescence channel. After cellular membrane labeling with a green fluorescent molecule, SK-BR-3 cells were incubated with the anti-HER2 antibody, followed by staining HER2 with Pt bionanoprobes (Scheme 2). As shown in Figure 4a, red fluorescence from Pt bionanoprobes was observed at the cellular surface. This is consistent with the distribution of the cell membrane, as shown in Figure 4b, indicating that Pt bionanoprobes specifically bound to HER2 via anti-HER2 antibody. The granules observed in the cellular membrane, as shown in Figure 4a,b, are autofluorescence. Comparatively, we did not detect any fluorescence from the cellular surface of HeLa cells, which was expressed at a low level of HER2 (Figure 4d–f). These results demonstrated that our Pt bionanoprobe bound to HER2-overexpressing SK-BR-3 cells with a greater affinity and higher selectivity.
Scheme 2. Illustration of the Pt Bionanoprobe for the Sensing of HER2 in Living Cells.
Figure 4.
After incubation with Pt bionanoprobes: (a) confocal red fluorescence image of SK-BR-3; (b) confocal green fluorescence image of SK-BR-3; (c) transmission image of SK-BR-3; (d) confocal red fluorescence image of HeLa cells; (e) confocal green fluorescence image of HeLa cells; (f) transmission image of HeLa cells. Scale bar = 30 μm.
Conclusions
In summary, we synthesized red-emitting Pt nanoclusters (excitation: 535 nm, emission: 630 nm) that can be used for detecting and imaging HER2 in SK-BR-3 breast cancer cells. The red-emitting fluorescent Pt nanoclusters were prepared by optimizing the experimental conditions [Pt/PAMAM (G5–OH) = 180:1] and pre-equilibration time (5 days). The experimental results also demonstrated that the Pt nanoclusters had excellent biocompatibility and photostability and could be used as bionanoprobes for long-term studies, such as those involving cell marker tracking, in vivo molecular imaging, and medical diagnostic imaging. Furthermore, by using a higher generation of dendrimer, we expect that more Pt ions are coordinated with the higher generation of PAMAM dendrimer, and larger Pt nanoclusters are also synthesized. Through this method, we can extend their photoluminescence wavelength to the NIR region, allowing the visualization of deep anatomical features because of enhanced tissue penetration and a decrease in light scattering as well as background autofluorescence. NIR-emitting Pt nanoclusters are promising fluorescent probes for clinical applications.
Methods
Synthesis of Red-Emitting Pt Nanoclusters
Pt nanoclusters are generally synthesized by reducing hexachloroplatinic acid salt (H2PtCl6) with a reducing agent in the presence of PAMAM (G5–OH) (polyamidoamine dendrimers with hydroxyl surface groups of fifth generation). In this study, H2PtCl6 was first incubated with PAMAM (G5–OH) at a molecular ratio of Pt/PAMAM (G5–OH) = 180:1 to achieve coordination bond formation between PAMAM (G5–OH) and Pt ions during pre-equilibration at 4 °C for five days. Fructose was added as a reducing agent at a molecular ratio of Pt/fructose = 1:100, and this reaction mixture was kept under vigorous stirring at 90 °C for 2 weeks (Scheme 1). After ultracentrifugation (see Supporting Information), to extract Pt nanoclusters from PAMAM (G5–OH), 4-aminobutyl acid (Ami) was added at a molecular ratio of Pt/Ami from 1:100 to 1:200. The ligand-exchanged Pt nanoclusters (PtAmi) were further isolated by anion-exchange chromatography (see Supporting Information). The eluted fractions showed bright-red emission under visible light (488 nm). To characterize Pt nanoclusters, ICP-MS (Agilent 7700× ICP-MS, Agilent Technologies Corp., Japan) was performed for the fractions.
Characterization of the Optical Properties
Fluorescence measurements were performed using a spectrofluorometer (FP-8200ST, JASCO Corp.), and the absolute QYs of the synthesized Pt nanoclusters were evaluated using a QY measurement system (C10027, Hamamatsu Photonics). QY is given by QY = PNem/PNab, where PNem and PNab are the number of photons emitted and absorbed by the fluorescent particles, respectively.
Transmission Electron Microscopy
Pt nanoclusters were diluted with methanol, dropped on a grid (UHR-M10, STEM), dried, and observed with JEOL JEM-ARM200F STEM operating at 200 kV with a CEOS aberration corrector for the probe-forming lens. For STEM imaging, beam convergence was set to 23 mrad in semi-angle, and atomic-resolution HAADF–STEM images were acquired with detector semi-angles of 68–170 mrad. The obtained images were denoized using Fourier transform.
Cytotoxicity of PtAmi
A Countess II Automated Cell Counter (Thermo Fisher Scientific) was used to check cellular viability. SK-BR-3 cells (ATCC) were incubated with 1 mL of PtAmi at different concentrations (1–100 nM in medium) for 12, 24, and 48 h in 35 mm diameter dishes. After incubation, a SK-BR-3 cell suspension for each concentration was prepared, and 10 μL of 0.4% trypan blue stain was added to 10 μL of each suspension. Then, 10 μL of the sample mixture at each concentration was loaded onto a sample slide, and these were inserted into the cell counter to obtain the percentage of live cells (cellular viability).
Preparation of Pt Nanocluster Bionanoprobes
PtAmi was conjugated with ProteinA using a 4-(4,6-dimethoxy-1,3,5-triazin-2-yl)-4-methylmorpholinium chloride (DMT-MM) coupling reaction. To maintain antibody activity, ProteinA24,25,32 was used as an adapter protein for the antibody. ProteinA can bind specifically to the Fc region of the antibody without blocking the antigen-binding site. First, PtAmi (25.0 μM, 400 μL) was mixed with DMT-MM (0.25 M, 400 μL) for 30 min at 25 °C, followed by ProteinA (100 μM, 325 μL) for 2 h at 25 °C. The molar ratio of PtAmi/ProteinA:DMT-MM was set to 1:3.25:10,000. A gel electrophoresis assay was carried out to assess the binding of PtAmi to ProteinA. ProteinA and anti-HER2 antibodies were stained with Coomassie Brilliant Blue prior to observation.
Confocal Fluorescence Microscopy
CellBrite green, which emits a green fluorescence, was used to stain the cellular membrane with the fluorescent molecule. For the preparation of the staining solution, 5 μL of staining solution was added to 1 mL of culture medium. For cell staining, the culture dish containing SK-BR-3 cells (or HeLa cells) was replaced with the CellBrite green staining solution. The cells were then incubated for 20 min at 37 °C. The culture dish was washed twice with phosphate-buffered saline (PBS). Then, anti-HER2 antibody (10 μM, 800 μL) was added to the dish, which was then incubated for 10 min at 37 °C. After washing twice with PBS buffer, 100 μL of ProteinA-conjugated PtAmi was added to the cells, and PtAmi was specifically bound to anti-HER2 antibody after 5 min incubation at 37 °C. Confocal fluorescence imaging was performed with an FV1000 instrument (Olympus) using an oil immersion objective lens (UPlanFLN, 60×, N.A. = 1.3, Olympus). Excitation wavelengths of 473 and 559 nm were used to observe CellBrite green and Pt nanoclusters, respectively. The detection wavelengths of the green and red channels are 485–585 and 575–675 nm, respectively.
Acknowledgments
We thank Dr. T. Fukumoto and Dr. K. Harada for ICP-MS, Dr. A. Ito for MALDI-MS, and Prof. T. Jin for allowing us to use the QY measurement system. We gratefully acknowledge Prof. K. Nakasone for allowing us to use an ultracentrifugation system, Prof. N. Yamamoto, Dr. N. Sugo, and Dr. Y. Hatanaka for allowing us to use the laboratory for in vitro and in vivo imaging, and Dr. K. Yamagami for informative discussions. This work was supported by JSPS KAKENHI, grant nos. 15H05354 and 25810100; the Asahi Glass Foundation, Iketani Science and Technology Foundation, grant nos 0311033-A and 0261010-A, Furukawa Foundation for Promotion of Technology, Electric Technology Research Foundation of Chugoku, Research Foundation for the Electrotechnology of Chubu, grant no R-30204, and Hitachi Metals-Materials Science Foundation.
Supporting Information Available
The Supporting Information is available free of charge at https://pubs.acs.org/doi/10.1021/acsomega.0c02578.
Fluorescence spectra of the synthesized Pt nanoclusters by controlling the experimental conditions: the molecular ratio of Pt/PAMAM (G5–OH), pre-equilibration time, agarose gel electrophoresis analysis of conjugated Pt nanoclusters with ProteinA and anti-HER2 antibody, pH-dependent emission spectra of the synthesized Pt nanoclusters, and time course of the fluorescence intensity decays for red-emitting Pt nanoclusters (PDF)
Author Contributions
The manuscript was written through contributions of all the authors. All the authors have given approval to the final version of the manuscript.
The authors declare no competing financial interest.
Supplementary Material
References
- Arteaga C. L.; Sliwkowski M. X.; Osborne C. K.; Perez E. A.; Puglisi F.; Gianni L. Treatment of HER2-Positive Breast Cancer: Current Status and Future Perspectives. Nat. Rev. Clin. Oncol. 2012, 9, 16–32. 10.1038/nrclinonc.2011.177. [DOI] [PubMed] [Google Scholar]
- Gschwind A.; Fischer O. M.; Ullrich A. The Discovery of Receptor Tyrosine Kinases: Targets for Cancer Therapy. Nat. Rev. Cancer 2004, 4, 361–370. 10.1038/nrc1360. [DOI] [PubMed] [Google Scholar]
- Yarden Y.; Sliwkowski M. X. Untangling the ErbB Signalling Network. Nat. Rev. Mol. Cell Biol. 2001, 2, 127–137. 10.1038/35052073. [DOI] [PubMed] [Google Scholar]
- Hellström I.; Goodman G.; Pullman J.; Yang Y.; Hellström K. E. Overexpression of HER-2 in Ovarian Carcinomas. Cancer Res. 2001, 61, 2420–2423. [PubMed] [Google Scholar]
- Tai W.; Mahato R.; Cheng K. The Role of HER2 in Cancer Therapy and Targeted Drug Delivery. J. Controlled Release 2010, 146, 264–275. 10.1016/j.jconrel.2010.04.009. [DOI] [PMC free article] [PubMed] [Google Scholar]
- Jackson H. W.; Fischer J. R.; Zanotelli V. R. T.; Ali H. R.; Mechera R.; Soysal S. D.; Moch H.; Muenst S.; Varga Z.; Weber W. P.; Bodenmiller B. The Single-Cell Pathology Landscape of Breast Cancer. Nature 2020, 578, 615–620. 10.1038/s41586-019-1876-x. [DOI] [PubMed] [Google Scholar]
- Wolff A. C.; Hammond M. E. H.; Allison K. H.; Harvey B. E.; Mangu P. B.; Bartlett J. M. S.; Bilous M.; Ellis I. O.; Fitzgibbons P.; Hanna W.; Jenkins R. B.; Press M. F.; Spears P. A.; Vance G. H.; Viale G.; McShane L. M.; Dowsett M. Human Epidermal Growth Factor Receptor 2 Testing in Breast Cancer: American Society of Clinical Oncology/College of American Pathologists Clinical Practice Guideline Focused Update. J. Clin. Oncol. 2018, 36, 2105–2122. 10.1200/jco.2018.77.8738. [DOI] [PubMed] [Google Scholar]
- Hammond M. E. H.; Hayes D. F.; Dowsett M.; Allred D. C.; Hagerty K. L.; Badve S.; Fitzgibbons P. L.; Francis G.; Goldstein N. S.; Hayes M.; Hicks D. G.; Lester S.; Love R.; Mangu P. B.; McShane L.; Miller K.; Osborne C. K.; Paik S.; Perlmutter J.; Rhodes A.; Sasano H.; Schwartz J. N.; Sweep F. C. G.; Taube S.; Torlakovic E. E.; Valenstein P.; Viale G.; Visscher D.; Wheeler T.; Williams R. B.; Wittliff J. L.; Wolff A. C. American Society of Clinical Oncology/College of American Pathologists Guideline Recommendations for Immunohistochemical Testing of Estrogen and Progesterone Receptors in Breast Cancer. J. Clin. Oncol. 2010, 28, 2784–2795. 10.1200/jco.2009.25.6529. [DOI] [PMC free article] [PubMed] [Google Scholar]
- Zhang Y.; Jiang S.; Zhang D.; Bai X.; Hecht S. M.; Chen S. DNA-Affibody Nanoparticles for Inhibiting Breast Cancer Cells Overexpressing HER2. Chem. Commun. 2017, 53, 573–576. 10.1039/c6cc08495h. [DOI] [PubMed] [Google Scholar]
- Fehling-Kaschek M.; Peckys D. B.; Kaschek D.; Timmer J.; de Jonge N. Mathematical Modeling of Drug-Induced Receptor Internalization in the HER2-Positive SKBR3 Breast Cancer Cell-Line. Sci. Rep. 2019, 9, 12709. 10.1038/s41598-019-49019-x. [DOI] [PMC free article] [PubMed] [Google Scholar]
- Seo H.-S.; Ku J. M.; Choi H.-S.; Woo J.-K.; Jang B.-H.; Go H.; Shin Y. C.; Ko S.-G. Apigenin Induces Caspase-Dependent Apoptosis by Inhibiting Signal Transducer and Activator of Transcription 3 Signaling in HER2-Overexpressing SKBR3 Breast Cancer Cells. Mol. Med. Rep. 2015, 12, 2977–2984. 10.3892/mmr.2015.3698. [DOI] [PubMed] [Google Scholar]
- Zheng J.; Zhang C.; Dickson R. M. Highly Fluorescent, Water-Soluble, Size-Tunable Gold Quantum Dots. Phys. Rev. Lett. 2004, 93, 077402. 10.1103/physrevlett.93.077402. [DOI] [PubMed] [Google Scholar]
- Liu H.; Hong G.; Luo Z.; Chen J.; Chang J.; Gong M.; He H.; Yang J.; Yuan X.; Li L.; Mu X.; Wang J.; Mi W.; Luo J.; Xie J.; Zhang X.-D. Atomic-Precision Gold Clusters for NIR-II Imaging. Adv. Mater. 2019, 31, 1901015. 10.1002/adma.201901015. [DOI] [PubMed] [Google Scholar]
- Chen Y.; Montana D. M.; Wei H.; Cordero J. M.; Schneider M.; Le Guével X.; Chen O.; Bruns O. T.; Bawendi M. G. Shortwave Infrared in Vivo Imaging with Gold Nanoclusters. Nano Lett. 2017, 17, 6330–6334. 10.1021/acs.nanolett.7b03070. [DOI] [PMC free article] [PubMed] [Google Scholar]
- Sun C.; Yang H.; Yuan Y.; Tian X.; Wang L.; Guo Y.; Xu L.; Lei J.; Gao N.; Anderson G. J.; Liang X.-J.; Chen C.; Zhao Y.; Nie G. Controlling Assembly of Paired Gold Clusters within Apoferritin Nanoreactor for in Vivo Kidney Targeting and Biomedical Imaging. J. Am. Chem. Soc. 2011, 133, 8617–8624. 10.1021/ja200746p. [DOI] [PubMed] [Google Scholar]
- Shang L.; Dong S.; Nienhaus G. U. Ultra-Small Fluorescent Metal Nanoclusters: Synthesis and Biological Applications. Nano Today 2011, 6, 401–418. 10.1016/j.nantod.2011.06.004. [DOI] [Google Scholar]
- Richards C. I.; Choi S.; Hsiang J.-C.; Antoku Y.; Vosch T.; Bongiorno A.; Tzeng Y.-L.; Dickson R. M. Oligonucleotide-Stabilized Ag Nanocluster Fluorophores. J. Am. Chem. Soc. 2008, 130, 5038–5039. 10.1021/ja8005644. [DOI] [PMC free article] [PubMed] [Google Scholar]
- Cerretani C.; Kanazawa H.; Vosch T.; Kondo J. Crystal Structure of a NIR-Emitting DNA-Stabilized Ag16 Nanocluster. Angew. Chem., Int. Ed. 2019, 58, 17153–17157. 10.1002/anie.201906766. [DOI] [PubMed] [Google Scholar]
- Li D.; Qiao Z.; Yu Y.; Tang J.; He X.; Shi H.; Ye X.; Lei Y.; Wang K. In Situ Fluorescence Activation of DNA-Silver Nanoclusters as a Label-Free and General Strategy for Cell Nucleus Imaging. Chem. Commun. 2018, 54, 1089–1092. 10.1039/c7cc08228b. [DOI] [PubMed] [Google Scholar]
- Wang Y.; Dai C.; Yan X.-P. Fabrication of Folate Bioconjugated Near-Infrared Fluorescent Silver Nanoclusters for Targeted in Vitro and in Vivo Bioimaging. Chem. Commun. 2014, 50, 14341–14344. 10.1039/c4cc06329e. [DOI] [PubMed] [Google Scholar]
- Wei W.; Lu Y.; Chen W.; Chen S. One-Pot Synthesis, Photoluminescence, and Electrocatalytic Properties of Subnanometer-Sized Copper Clusters. J. Am. Chem. Soc. 2011, 133, 2060–2063. 10.1021/ja109303z. [DOI] [PubMed] [Google Scholar]
- Qing T.; Zhang K.; Qing Z.; Wang X.; Long C.; Zhang P.; Hu H.; Feng B. Recent Progress in Copper Nanocluster-Based Fluorescent Probing: a Review. Microchim. Acta 2019, 186, 670. 10.1007/s00604-019-3747-4. [DOI] [PubMed] [Google Scholar]
- Kurdekar A. D.; Manohar C. S.; Chunduri L. A. A.; Haleyurgirisetty M. K.; Hewlett I. K.; Kamisetti V. Computational Design and Clinical Demonstration of a Copper Nanocluster Based Universal Immunosensor for Sensitive Diagnostics. Nanoscale Adv. 2020, 2, 304–314. 10.1039/c9na00503j. [DOI] [PMC free article] [PubMed] [Google Scholar]
- Tanaka S.-I.; Miyazaki J.; Tiwari D. K.; Jin T.; Inouye Y. Fluorescent Platinum Nanoclusters: Synthesis, Purification, Characterization, and Application to Bioimaging. Angew. Chem., Int. Ed. 2011, 50, 431–435. 10.1002/anie.201004907. [DOI] [PubMed] [Google Scholar]
- Tanaka S.-i.; Aoki K.; Muratsugu A.; Ishitobi H.; Jin T.; Inouye Y. Synthesis of Green-Emitting Pt8 Nanoclusters for Biomedical Imaging by Pre-Equilibrated Pt/PAMAM (G4-OH) and Mild Reduction. Opt. Mater. Express 2013, 3, 157–165. 10.1364/ome.3.000157. [DOI] [Google Scholar]
- Chen D.; Zhao C.; Ye J.; Li Q.; Liu X.; Su M.; Jiang H.; Amatore C.; Selke M.; Wang X. In Situ Biosynthesis of Fluorescent Platinum Nanoclusters: Toward Self-Bioimaging-Guided Cancer Theranostics. ACS Appl. Mater. Interfaces 2015, 7, 18163–18169. 10.1021/acsami.5b05805. [DOI] [PubMed] [Google Scholar]
- Huang X.; Aoki K.; Ishitobi H.; Inouye Y. Preparation of Pt Nanoclusters with Different Emission Wavelengths and Their Application in Co2+ Detection. ChemPhysChem 2014, 15, 642–646. 10.1002/cphc.201301115. [DOI] [PubMed] [Google Scholar]
- Huang X.; Ishitobi H.; Inouye Y. Formation of Fluorescent Platinum Nanoclusters Using Hyper-Branched Polyethylenimine and Their Conjugation to Antibodies for Bio-imaging. RSC Adv. 2016, 6, 9709–9716. 10.1039/c5ra24522b. [DOI] [Google Scholar]
- Chakraborty I.; Bhuin R. G.; Bhat S.; Pradeep T. Blue Emitting Undecaplatinum Clusters. Nanoscale 2014, 6, 8561–8564. 10.1039/c4nr02778g. [DOI] [PubMed] [Google Scholar]
- Le Guével X.; Trouillet V.; Spies C.; Jung G.; Schneider M. Synthesis of Yellow-Emitting Platinum Nanoclusters by Ligand Etching. J. Phys. Chem. C 2012, 116, 6047–6051. 10.1021/jp211672t. [DOI] [Google Scholar]
- Kawasaki H.; Yamamoto H.; Fujimori H.; Arakawa R.; Inada M.; Iwasaki Y. Surfactant-Free Solution Synthesis of Fluorescent Platinum Subnanoclusters. Chem. Commun. 2010, 46, 3759–3761. 10.1039/b925117k. [DOI] [PubMed] [Google Scholar]
- Jin T.; Tiwari D. K.; Tanaka S.-i.; Inouye Y.; Yoshizawa K.; Watanabe T. M. Antibody–ProteinA Conjugated Quantum Dots for Multiplexed Imaging of Surface Receptors in Living Cells. Mol. BioSyst. 2010, 6, 2325–2331. 10.1039/c0mb00056f. [DOI] [PubMed] [Google Scholar]
Associated Data
This section collects any data citations, data availability statements, or supplementary materials included in this article.


