

Abstract
Pyrolysis liquids are the main products in biomass pyrolysis, and the strong acidity limits its utilization. Likewise, activators are required in the process of preparing biomass-based activated carbon, and current activators are usually chemical agents and not sustainable. Both issues are addressed with the new concept of using acidic pyrolysis liquids as the activator of biomass-based activated carbon. In the present research, corncob-based activated carbon was prepared with phosphoric acid and pyrolysis liquids (bio-oil and wood vinegar) as activators. The effects of activation temperature and the types of activators on the structure and surface chemical properties of activated carbon were investigated. Results show that the adsorption performance and specific surface area of activated carbon prepared with bio-oil are not as good as that prepared with phosphoric acid and wood vinegar, but its yield is relatively high. Some alkali and earth alkaline metals remain on the activated carbon prepared by bio-oil and wood vinegar. At 450 °C, the surface area and pore volume of activated carbon prepared with bio-oil and wood vinegar were much smaller than the ones prepared with phosphoric acid. Increasing the activation temperature may improve the performance of activated carbon. The specific surface area of activated carbon prepared with wood vinegar as the activator can reach 384.35 m2/g at an activation temperature of 850 °C, which is slightly inferior to that prepared with phosphoric acid as the activator. However, the adsorption amount of methylene blue exceeds the activated carbon prepared with phosphoric acid. This shows that wood vinegar can be used as an activator to prepare biomass-based activated carbon to achieve sustainability of the entire preparation process of biomass-based activated carbon.
1. Introduction
Pyrolysis is considered as an important technology of all biomass utilization processes. Particularly, fast pyrolysis enables the low energy density and low transportation cost in utilization of biomass to convert to high volumetric energy density products such as gas, pyrolysis liquids, and char. The mode of regionally concentrated pyrolysis and long-distance transportation after increasing energy density is widely accepted.1 In the regional pyrolysis plant, biomass was heated to 500–900 °C to produce gas, pyrolysis liquids, and char.2−4 There are many options for the products. The pyrolysis liquids can be refined into chemicals,5,6 biodiesel,7 pitch,8 etc. Due to the complicated compositions,9 high water content, high oxygen content, and strong acidity, the refinery process could be complicated.10 Karlsruhe Institute of Technology,1 Curtin University,11 and Institute of Process Engineering12 proposed pathways using bio-oil for preparation of slurry fuels with biochar and coal for the purpose of industrial application of bio-oil. These processes mainly use the calorific value of bio-oil, and the requirements for bio-oil components are not very strict. However, the acidity of bio-oil may cause corrosions during utilization if it is not properly handled.
During the preparation of activated carbon, physical activation, chemical activation and physical–chemical activation are very common.13 Compared with the physical activation method at relatively high temperature,14,15 the chemical activation method at a comfortable temperature has higher activated carbon yield, less environmental pollution,16−18 and is widely used.19 Chemical activation is done by impregnating the material with an activator and then performing a heat treatment between 400 and 900 °C, where the process of preparing activated carbon is carbonized and activated simultaneously.20
Activators are crucial impactors in chemical activations. H3PO4 was usually used as the activator for promoting bond cleavage reactions and protecting the internal pore structure at the same time in chemical activation.21 Pyrolysis liquids and phosphoric acid have two common characteristics. Both liquids can well activate the material by entering the pores of the raw materials. In addition, they are both acidic, which is beneficial to breaking chemical bonds and causing development in porosity. However, there are few research studies on preparing activated carbon using pyrolysis liquids as activators.
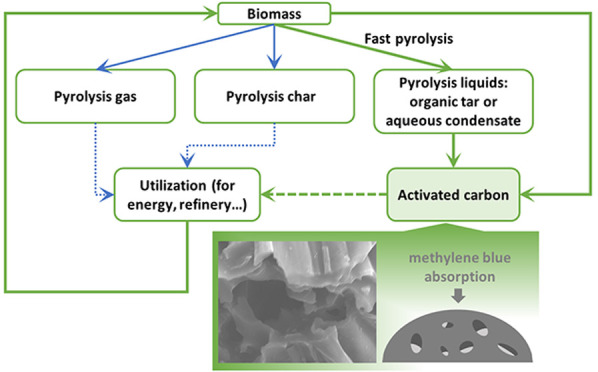
To find a novel way for the use of bio-oils, an integrated bioenergy path is proposed (in Figure 1) whereby biomass is chemically activated using pyrolyzed liquids to produce a high surface area activated carbon for absorption. The uniqueness of the proposed concept includes making full use of the acidity of bio-oil and achieving the sustainability of the biomass-based activated carbon process. Biomass was collected within a certain range and transported to the pyrolysis plant. Part of the pyrolysis liquids produced in pyrolysis is used to activate biomass and prepare activated carbon. This process provides a feasible alternative path (path 4 in Figure 1) for the traditional biomass pyrolysis utilization process, making biomass utilization more flexible and broadening the utilization of biomass pyrolysis liquids. The newly produced activated carbon could be widely used as a versatile adsorbent for separation of gases22 and removal of organic pollutants23 due to its highly developed pore structure,24 huge specific surface areas, and large adsorption capacity.25,26 In comparison with traditional activated carbon, this biomass-based active carbon has advantages of low cost, renewable in materials, low ash content, and relatively environmentally friendly.
Figure 1.

Comparison of current pyrolysis liquid utilization and proposed pathway for production of biomass-based activated carbon.
In the present research, the biomass pyrolysis liquids (bio-oil and wood vinegar) were used as activators for preparation of activated carbon. On the one hand, the preparation of activated carbon with bio-oil as an activator makes full use of the acidic components in bio-oil, which is of great significance for the reuse of bio-oil. It also reduces the use of phosphoric acid, sodium hydroxide, and other chemical reagents, which is of great economic and social significance for the development of sustainable society. In this research, corncob was used as the raw material and bio-oil as the activator to prepare activated carbon. The morphology, pore size, and functional groups of activated carbon activated by phosphoric acid, bio-oil from straw pyrolysis, and wood vinegar were compared. The effect of activation temperature and the type of activator on adsorption properties were investigated. The results provide a feasible route for both utilization of biomass pyrolysis liquids and the selection of organic acids for activation in activated carbon preparation.
2. Results and Discussion
2.1. Yield of Activated Carbon
In preparation of activated carbon, the yield is usually defined as the weight of final activated carbon produced after activation, pickling, and washing divided by the mass of the original raw materials on a dry basis.27Figure 2 shows the yields of activated carbon prepared from corncob with various activators at 450, 650, and 850 °C.
Figure 2.

Yields of activated carbon from corncob prepared with various activators at 450, 650, and 850 °C and activated carbon produced from jackfruit peel and lignin27 and xylan and Paulownia.28
As shown in Figure 4, the yields of activated carbon obtained from corncob are in the range of 10.65–42.87%. The yields are similar with activated carbon from Kraft lignin, jackfruit peel, and cellulose27 and lower than that from Paulownia wood and xylan.28 Compared with the activated carbon prepared by bio-oil and wood vinegar activation, the yields of activated carbon obtained by chemical activation using phosphoric acid as the activating agent are the lowest, which are relatively close to the fixed carbon yield in raw materials. Essentially, corncob is a complex composite material formed by natural polymers such as cellulose, lignin, and hemicellulose, whose contents are lower than xylan and wood, leading to lower activated carbon yields.
Figure 4.

SEM-EDS of activated carbons.
In activation or carbonization at temperatures as high as 850 °C, the polymeric structures in corncob decompose and liberate most of the non-carbon elements, leaving behind a rigid carbon skeleton in the form of aromatic sheets and strips. In this process, the properties of materials, activation temperature, and activators selected have a significant influence on the yields of activated carbon. Generally, high fixed carbon content favors high yields. Therefore, under the condition of phosphoric acid activation, the carbon content of activated carbon prepared with corncob is lower than those of cellulose, wood, and xylan. As the temperature increases, more small molecules are released. Therefore, an excessively high temperature is not conducive to increasing the yield of activated carbon, which could be proven by the trend of all kinds of active carbons. It should be noted that there would be a suitable temperature to maximize the yield of activated carbon, and the temperature will be different for various raw materials and operating conditions. In Figure 4, the yield of activated carbon obtained at 650 °C is obviously higher than those at 450 and 850 °C. The presence of phosphoric acid during activation may promote depolymerization and dehydration of constituent biopolymers. Phosphoric acid and biopolymers are cross-linked by phosphate ester to prevent the shrinkage of the cell wall during heat treatment. When the temperature rises to 650 °C, the cross-linking reaction becomes weak and the specific surface area drops due to the destruction of phosphate ester. When it is replaced by bio-oil or wood vinegar, the acidity of the activator becomes weak and the aromatic condensation reactions are less likely to take place among the adjacent molecules, which results in the evolution of gaseous products from the hydroaromatic structure of carbonized char and the increase in the yield of carbon.
2.2. Characterization of the Activated Carbons
Activated carbon from corncobs can be used as a heterogeneous catalyst or in adsorption of hazardous materials in wastewater. Apart from the carbon atoms, the heteroatoms like hydrogen, oxygen, nitrogen, halogen, sulfur, phosphorus, etc., may bind to the edges of the carbon layer, form functional groups on the surface, change the morphology, and control the surface properties of the activated carbon, which in turn determines its applications. FTIR spectra of activated carbon with various activating agents at 650 and 850 °C are illustrated in Figure 3.
Figure 3.

FTIR spectra of AC produced at an activation temperatures of (a) 650 °C and (b) 850 °C.
All spectra showed a broad absorption band around 3000–3700 cm–1, especially the absorption peak at 3420 and 1042 cm–1, which are primarily characteristic of the stretching vibration band of the hydrogen bond (−OH) in carboxyl, phenols, and alcohols from activated carbon and vibration of C–H. The characteristic peak at 2889 cm–1 represents −CH symmetric or asymmetric stretching vibration in the aliphatic series.13 The peak at 1726 cm–1 may be caused by the C=O stretching vibration of carboxyl or carbonyl groups. The peak at 1432 cm–1 can be attributed to the C=C vibration of the aromatic ring. In the low-wavenumber region, the shoulder peak at 866 cm–1 could be attributed to the out-of-plane bending absorption of C–H in the aromatic ring.23 The surface of the prepared activated carbon has rich functional groups, especially hydroxyl groups and ether bonds. These oxygenic functional groups may act as active sites for the chemical adsorption.29,30
The content of functional groups on the surface is influenced by activator species and activation temperature. AC-SO has the most significant functional groups as it contains more than a hundred organic matters and weaker acidity than wood vinegar and phosphoric acid. After activation, more structure and functional groups in corncob remained. The higher content of C–O may favor gas absorption. As the activation temperature increases from 650 to 850 °C, the relative intensity for the peak around 1710 cm–1 decreases. This shows a decreasing content of carboxylic acid groups as activation temperature increases.
The morphology of activated carbons is shown in Figure 4, and the elements remaining on the surface are also provided. Figure 4a shows the corncob with a rough surface, where the structure is loose and the particle size is less than 100 μm. This kind of structure finds it easy to form abundant pore structures during carbonization. In addition, it is easy for the activator to enter the pore interior during activation, making it form developed microporous structures. As for other types of biomass, it contains alkali and alkaline earth metals as sodium, potassium, and calcium. It also contains a relatively high content of iron. After activation of phosphoric acid, most alkali and alkaline earth metals were removed, as shown in Figure 4b. A considerable amount of iron also disappeared. The main pore structure remained. During activation, phosphoric acid plays a role in promoting the bond fracture reaction. The corncob forms phosphate ester and polyphosphate ester bonds with the activator to promote the cross-linking reaction through cyclization and condensation. After the removal of cross-linking products by washing, a porous pore structure will be left. In comparison, activated carbon prepared with bio-oil and wood vinegar shows a certain content of sodium and potassium. The pore structure of activated carbon prepared with bio-oil and wood vinegar shown in Figure 4c,d is less developed. This may be due to organic acids contained in wood vinegar and straw oil, which could promote fracture of cellulose macromolecule chains. In addition, cellulose and hemicellulose contain hydroxyl groups, which react with organic carboxyl groups to form cellulose esters. After washing to remove cellulose ester, it will leave pores in the surface of activated carbon.31 It is difficult to remove organic constituents because wood vinegar and bio-oil compositions are complicated. Consequently, the generated pore is not developed compared to the activated carbon prepared by phosphoric acid. In addition, the viscosity of bio-oil is higher than wood vinegar, so the hole blockage might be obvious. It is also remarkable that in Figure 4c,d, some of the alkali and earth alkaline metals in bio-oil were left after activation. As shown in Figure 5, the content of potassium in bio-oil is much higher than in wood vinegar, and its content in the activated carbon prepared with bio-oil is also higher.
Figure 5.

XRF analysis of bio-oil ashes.
2.3. Effects of Activators on Adsorption Properties of Activated Carbons
The physicochemical properties of carbon manufactured using different activators may vary in reflection of adsorption properties. The methylene blue adsorption of activated carbon prepared with phosphoric acid, bio-oil, and wood vinegar at 450 °C is shown in Figure 6. At low methylene blue concentrations (such as less than 100 mg/L), the adsorption capacities of AC-WV and AC-SO are higher than that of AC-PA. When the methylene blue concentrations rise to larger than 150 mg/L, the results are different. This indicates that when the solution concentration is 150 mg/L, the adsorption of methylene blue by activated carbon activated by WV and SO tends to be saturated. When the concentration of the solution continues to increase, its adsorption capacity remains basically unchanged. However, as the concentration of the solution increases after 150 mg/L, the adsorption capacity prepared with phosphoric acid increases slightly, but the increment decreases. The acidity of phosphoric acid is stronger than that of straw oil and wood vinegar. It reacts with the original organic matter of the corncob when fully exposed to the corncob. Many irregular pores are formed after the organic matter is dissolved, increasing the adsorption rate.32 This indicates that at low concentrations of solutions, activated carbon prepared using WV and SO has higher adsorption capacity.
Figure 6.

Methylene blue adsorption curves of activated carbon prepared with phosphoric acid, straw oil, and wood vinegar at 450 °C.
To further identify the difference in adsorption capacity of the three activated carbons, the pore structures of absorbents are listed in Table 1. The specific surface area and pore volume of activated carbon activated by phosphoric acid are significantly higher than those activated by bio-oil and wood vinegar. In terms of pore size distribution, the three activated carbons are mainly based on mesopore content. However, the micropore content of activated carbon prepared by phosphoric acid is significantly higher than those of the other two activated carbons. The low content of micropores is consistent with the less adsorption of activated carbon activated by wood vinegar and bio-oil in the methylene blue adsorption experiments.
Table 1. Pore Structure of Activated Carbons Prepared at 450 °C.
| pore size distribution |
|||||
|---|---|---|---|---|---|
| sample | surface area (m2/g) | pore volume (cm3/g) | macropores (>50 nm) | mesopores (2–50 nm) | micropores (<2 nm) |
| AC-PA-450 | 33.98 | 0.024 | 8.32 | 79.60 | 12.08 |
| AC-WV-450 | 2.26 | 0.008 | 12.66 | 86.22 | 1.11 |
| AC-SO-450 | 0.52 | 0.003 | 13.78 | 85.95 | 0.27 |
Figure 7 illustrates the adsorption/desorption isotherms of N2 at −196 °C on activated carbons prepared using different activators at 450 °C. It shows that the isotherm curves of activated carbon activated by phosphoric acid are likely type I based on IUPAC classification, which means that the activated carbon prepared at 450 °C is a microporous material. The absence of a clear plateau indicates that there is wide range of pore sizes in materials. However, the isotherm curves of activated carbon activated by bio-oil and wood vinegar are more likely type III, which arises from the macroporous surface. The results are consistent with the pore distribution in Table 3. In order to develop the pore structure of activated carbon, other operating conditions should be appropriately adjusted for activated carbon activated by wood vinegar and bio-oil.
Figure 7.

N2 adsorption isotherm for activated carbon at activation temperature of 450 °C.
Table 3. Proximate Analysis and Ultimate Analysis of Raw Corncob (%, Air Dry Basis).
| proximate analysis |
ultimate analysis |
|||||||
|---|---|---|---|---|---|---|---|---|
| moisture | fixed carbon | ash | volatile matter | C | H | N | S | Oa |
| 4.19 | 10.85 | 2.38 | 82.58 | 38.55 | 5.57 | 0.42 | 0.58 | 48.31 |
By difference.
2.4. Effects of Activation Temperature on Adsorption Properties of Activated Carbons
The adsorption capacity of activated carbon depends on many factors, such as activation temperature and species of activating agents.33,34 To further develop the pore structure of activated carbon activated by bio-oil and wood vinegar, the activation temperature was elevated, and the adsorption capacity of methylene blue is shown in Figure 8.
Figure 8.

Methylene blue adsorption curves of activated carbon prepared with phosphoric acid, wood vinegar, and straw oil at activation temperatures of (a) 650 °C and (b) 850 °C.
Among the activated carbons prepared at 650 and 850 °C, the activated carbon activated by wood vinegar showed better adsorption capacity, and the adsorption capacity was better than that activated by phosphoric acid. The adsorption capacity of activated carbon activated by bio-oil does not improve with increasing temperature. Compared with the activated carbon prepared at 450 °C in Figure 6, the temperature increase (to 850 °C) can significantly improve the adsorption performance of activated carbon activated by wood vinegar. More carbons in samples were consumed, and more micropores and mesopores were formed with the increase of the activation temperature. The increase in temperature from 450 to 650 °C may induce shrinkage in the carbon structure, resulting in a reduction in the surface area and total pore volume.28 This may explain the decrease in the adsorption performance of activated carbon with an activation temperature of 650 °C. As activation temperature continued to rise, phosphoric acid, and organic acid in pyrolysis liquids can prevent the shrinkage of the cell wall during heat treatment through the cross-linking of phosphate ester, which is an important basis for the formation of developed pore structures of activated carbon. When the activation temperature reaches 850 °C, the specific surface area and specific pore volume of the activated carbon would significantly increase again. The surface area of activated carbon reaches 384.35 m2/g as listed in Table 2, which might be caused by the escape of gas generated due to pyrolysis.35
Table 2. Surface Area and Pore Volume of Activated Carbons Prepared at 650 and 850 °C.
| sample | surface area (m2/g) | pore volume (cm3/g) |
|---|---|---|
| AC-PA-850 | 657.76 | 0.3 |
| AC-WV-850 | 384.35 | 0.21 |
| AC-SO-850 | 24.01 | 0.03 |
| AC-PA-650 | 2.78 | 0.008 |
| AC-WV-650 | 9.91 | 0.014 |
| AC-SO-650 | 2.74 | 0.004 |
Great differences are also observed in N2 adsorption–desorption isotherms (Figure 9) of activated carbons at 650 and 850 °C. The activated carbon prepared at 650 °C exhibits type II behavior, which is similar to that at 450 °C, indicating that the pores are underdeveloped. This is consistent with the results of the methylene blue adsorption experiments. Activated carbon at 850 °C exhibits typical type I behavior, indicating that there is a large number of micropores, which is similar to that obtained from a single-layer reversible adsorption process. It should be noted that the activated carbon activated at 850 °C by wood vinegar has the highest adsorption capacity in both nitrogen and for methylene blue. After activation and high-temperature carbonization, the porosity of the activated carbon was produced by aggressive attack of the reagent during activation, leaving behind the ruptured surface of activated carbon.36
Figure 9.

Adsorption–desorption isotherms of activated carbon prepared with phosphoric acid, wood vinegar, and straw oil as activators at (a) 650 °C and (b) 850 °C.
The pore size distributions of activated carbons are shown in Figure 10. The mesopores are dominant for all activated carbons. The proportion of micropores is significantly higher in activated carbon prepared at 850 °C than those at other temperatures. The activated carbons using wood vinegar as activators have the largest developed micropore content, showing great potential for absorption.
Figure 10.

Pore distribution of activated carbons with different activators and activation temperatures.
3. Conclusions
Considering the limits of application of pyrolysis liquids, the potential to use bio-oil and wood vinegar as alternative materials for chemicals represents fundamental significance. A novel method for preparation of biomass-based activated carbon was proposed in the present research using pyrolysis liquids as activators, which enables the entire process of activated carbon preparation to be achieved by biomass and be sustainable. The properties of activated carbons were compared with those produced using phosphoric acid as the activator. Although activated carbon prepared by bio-oil activation has the highest yield, its pore structure is underdeveloped and its adsorption performance is poor, making it difficult to be used as a porous adsorption material. The surface of the activated carbon contains more alkali metals and alkaline earth metals, indicating that the alkali metals in the bio-oil remain on the surface of the carbon during the activation process, which is easy to melt at high temperature and affects the pore formation. At 450 and 650 °C, the activated carbon prepared by activation of wood vinegar has a slight advantage over the activated carbon prepared by activation of phosphoric acid. When the activation temperature increased to 850 °C, the specific surface area of the activated carbon prepared by wood vinegar reaches 384.35 m2/g, and the adsorption capacity of methylene blue reached ∼45 mg/g, exceeding that of activated carbon prepared by phosphoric acid. This shows that the preparation of activated carbon with wood vinegar as an activator has a better effect. According to the research results, it can be inferred that the use of organic acid solutions such as biomass pyrolysis liquid and even acid wastewater can also be appropriate as an activator in the preparation process of activated carbon, providing an eco-friendly method for activated carbon preparation and a new route for pyrolysis liquid utilization.
4. Experimental Section
4.1. Materials
Corncob collected from local farmers in east China was used as the raw material to prepare activated carbon. The proximate analysis of the corncob is shown in Table 3. The low ash content of raw corncob makes it a good raw material for preparing activated carbon.
Corncob was activated using phosphoric acid, bio-oil produced from pyrolysis of straw, and wood vinegar as activators. The phosphoric acid used is of analytical grade purchased from Shanghai Chemical Reagent Factory, China.
Pyrolysis liquids such as bio-oil and wood vinegar used were purchased from Yineng Bioenergy Co., Ltd. (Anhui Province, China). They were collected in a fast pyrolysis industrial reactor with a reaction temperature of around 500 °C and the feedstock of straw/husk and wood, respectively. The water contents of bio-oil and wood vinegar were measured using a Karl Fischer moisture titrator (Vs10, Mettler Toledo), and the apparent viscosity was determined using a coaxial cylindrical viscometer (HAAKE VTIQ, Thermo) at 25 °C. The characteristic viscosity is defined as the average apparent viscosity at 100 s–1. The density of liquid samples was measured using a densitometer (EasyDens, Anton Paar). The basic characteristics of bio-oil and wood vinegar are listed in Table 4.
Table 4. Basic Characteristics of Bio-oil and Wood Vinegar.
| samples | bio-oil | wood vinegar |
|---|---|---|
| Physical properties | ||
| water content, % | 45.54 | 74.15 |
| apparent viscosity, mPa·s | 67.00 | 15.00 |
| density, g/cm3 | 1.18 | 1.05 |
| heating values, kJ/g | 11.69 | |
| Ultimate analysis (wt %) | ||
| C | 63.32 | 21.92 |
| H | 8.83 | 14.10 |
| Oa | 26.50 | 63.54 |
| N | 0.83 | 0.15 |
| S | 0.52 | 0.29 |
By difference.
Bio-oil and wood vinegar were analyzed by GC/MS (Varian 3800GC/300MS with FFAP column of 30 m × 0.25 mm × 0.25 μm) to identify the compositions, and the GC spectra are shown in Figure 2. The analytical conditions were as follows: the oven temperature started from 40 °C holding for 3 min, then increased by 4 °C/min to 100 °C holding for 3 min, and finally increased to 240 °C holding for 10 min by 6 °C/min; the injector and ion source temperature was 240 and 250 °C, respectively. The organic components include more than 100 organic matter compounds (shown in Figure 11) such as alcohols, acids, phenols, etc. Water is the most abundant among all the components. The water contents of bio-oil and wood vinegar were 45.54 and 74.15%, respectively, as shown in Table 4.
Figure 11.

GC spectrum of bio-oil and wood vinegar.
4.2. Preparation of Activated Carbon
4.2.1. Pretreatment of Corncob
Corncob was ground and sieved until all particles passed through an 80 mesh (0.18 mm) sieve. It was then dried in an oven at 105 °C to a constant weight and placed in a desiccator for use. The preparation of activated carbon is shown in Figure 12.
Figure 12.

Preparation of activated carbon using bio-oil or wood vinegar as activators.
4.2.2. Impregnation with Activators
Corncob was soaked in activators (phosphoric acid, bio-oil, and wood vinegar) with an impregnation ratio of 1:4 (w/w)for 24 h.37 The samples were stirred every 3 h to ensure that the activator going into the raw material. The impregnated samples were placed in the oven to dry at 105 °C until a constant weight.
4.2.3. Carbonization and Activation
The impregnated corncob was placed in a tubular furnace (OTF-1200X, Kejing Auto Instrument, China) and then activated under the protection of nitrogen. The flow rate of nitrogen was adjusted to 50 mL/min. The samples were heated from 25 to 450, 650, and 850 °C at a rate of 10 °C/min. Then, they were maintained at the activation temperature for 75 min.
4.2.4. Pickling and Washing
The high temperature-generated activated carbon was first washed with dilute hydrochloric acid and then washed with hot distilled water until the pH was close to neutral. The final product was dried in an oven at 105 °C for 24 h and kept in an airtight container for further use.38
The activated carbon produced was noted as AC-PA-Y, AC-SO-Y, and AC-WV-Y, where AC is abbreviated for activated carbon, PA represents phosphoric acid, SO represents bio-oil from straw pyrolysis, WV represents wood vinegar, and Y represents the activation temperature.
4.3. Characterization of Samples
4.3.1. Pore Size and Surface Area of AC
Porous properties of the prepared activated carbon were determined by a nitrogen adsorption method38 at −196 °C with a surface area and pore size analyzer (JW-BK122W, China).
4.3.2. Infrared Spectroscopy
Fourier transform infrared spectroscopy analysis was performed using an FTIR spectrometer (Tensor 27, USA) to identify surface functional groups. The AC samples (0.5 mg) were mixed with 200 mg of KBr and pressed at 2 MPa pressure for 1 min to form pellets. The spectra were recorded in the range from 4000 to 400 cm–1.
4.3.3. Scanning Electron Microscope (SEM) Analysis
The surface morphology of raw materials and the activated carbon was recorded using a scanning electron microscope (JSM-6330F) at an accelerating voltage of 15 kV. The samples were coated with gold in an ETD-2000 ion sputter device before being transferred to the SEM specimen chamber. The elements on the surface were also recorded by SEM-EDS.
4.3.4. Adsorption Characteristics
The adsorption properties of activated carbon were determined using the methylene blue (MB) adsorption method. The solutions were prepared in a flask filled with 50 mL of methylene blue at a known concentration. The concentration of methylene blue varies from 5 to 250 mg/L in experiments. It was then mixed with 0.1 g of activated carbon for adsorption. After reaching the adsorption equilibrium, the mixture was centrifuged at 8000 rpm for 20 min. A disposable needle filter was used to extract the supernatant. The concentration of methylene blue in the solution before and after adsorption was analyzed using a UV spectrophotometer (UV1900PC, China) at 664 nm. Adsorption capacity of activated carbon can be calculated using eq 1.
| 1 |
where C0 and Ce are the initial and final (equilibrium) concentrations of methylene blue, respectively, mg/L, V is the volume of solutions, L, and w is the weight of activated carbon, g.
Acknowledgments
Support was provided by the Fundamental Research Funds for the Central Universities (2019QH06), National Training Program of Innovation and Entrepreneurship for Undergraduates (C201903681 and C202003220), and the National Natural Science Foundation of China (51604281).
The authors declare no competing financial interest.
References
- Dahmen N.; Henrich E.; Dinjus E.; Weirich F. The bioliq® bioslurry gasification process for the production of biosynfuels, organic chemicals, and energy. Energy Sustainability Soc. 2012, 2, 3. 10.1186/2192-0567-2-3. [DOI] [Google Scholar]
- Wei L.; Liang S.; Guho N. M.; Hanson A. J.; Smith M. W.; Garcia-Perez M.; McDonald A. G. Production and characterization of bio-oil and biochar from the pyrolysis of residual bacterial biomass from a polyhydroxyalkanoate production process. J. Anal. Appl. Pyrolysis 2015, 115, 268–278. 10.1016/j.jaap.2015.08.005. [DOI] [Google Scholar]
- Marathe P. S.; Westerhof R. J. M.; Kersten S. R. A. Fast pyrolysis of lignins with different molecular weight: Experiments and modelling. Appl. Energy 2019, 236, 1125–1137. 10.1016/j.apenergy.2018.12.058. [DOI] [Google Scholar]
- El-Sayed G. O.; Yehia M. M.; Asaad A. A. Assessment of activated carbon prepared from corncob by chemical activation with phosphoric acid. Water Resources Ind. 2014, 7-8, 66–75. 10.1016/j.wri.2014.10.001. [DOI] [Google Scholar]
- He T.; Zhong Z.; Zhang B. Bio-oil Upgrading Via Ether Extraction, Looped-Oxide Catalytic Deoxygenation, and Mild Electrocatalytic Hydrogenation Techniques. Energy Fuels 2020, 9725. 10.1021/acs.energyfuels.0c01719. [DOI] [Google Scholar]
- Oh S.-J.; Choi G.-G.; Kim J.-S. Preparation of Calcium Magnesium Acetate Deicer Using Raw Acetic Acid-Rich Bio-oil Obtained from Continuous Two-Stage Pyrolysis of Corncob. ACS Sustainable Chem. Eng. 2018, 6, 4362–4369. 10.1021/acssuschemeng.8b00013. [DOI] [Google Scholar]
- Chen J.; Cai Q.; Lu L.; Leng F.; Wang S. Upgrading of the Acid-Rich Fraction of Bio-oil by Catalytic Hydrogenation-Esterification. ACS Sustainable Chem. Eng. 2017, 5, 1073–1081. 10.1021/acssuschemeng.6b02366. [DOI] [Google Scholar]
- Lu Y.; Li D.; Huang X.; Picard D.; Mollaabbasi R.; Ollevier T.; Alamdari H. Synthesis and Characterization of Bio-pitch from Bio-oil. ACS Sustainable Chem. Eng. 2020, 8, 11772–11782. 10.1021/acssuschemeng.0c03903. [DOI] [Google Scholar]
- Wang C.; Luo Z.; Li S.; Zhu X. Coupling effect of condensing temperature and residence time on bio-oil component enrichment during the condensation of biomass pyrolysis vapors. Fuel 2020, 274, 117861. 10.1016/j.fuel.2020.117861. [DOI] [Google Scholar]
- Chang G.; Huang Y.; Xie J.; Yang H.; Liu H.; Yin X.; Wu C. The lignin pyrolysis composition and pyrolysis products of palm kernel shell, wheat straw, and pine sawdust. Energy Convers. Manage. 2016, 124, 587–597. 10.1016/j.enconman.2016.07.038. [DOI] [Google Scholar]
- Abdullah H.; Mourant D.; Li C.-Z.; Wu H. Bioslurry as a fuel. 3. Fuel and rheological properties of bioslurry prepared from the bio-oil and biochar of mallee biomass fast pyrolysis. Energy Fuels 2010, 24, 5669–5676. 10.1021/ef1008117. [DOI] [Google Scholar]
- Feng P.; Lin W.; Jensen P. A.; Song W.; Hao L.; Raffelt K.; Dam-Johansen K. Entrained flow gasification of coal/bio-oil slurries. Energy 2016, 111, 793–802. 10.1016/j.energy.2016.05.115. [DOI] [Google Scholar]
- Budinova T.; Ekinci E.; Yardim F.; Grimm A.; Björnbom E.; Minkova V.; Goranova M. Characterization and application of activated carbon produced by H3PO4 and water vapor activation. Fuel Process. Technol. 2006, 87, 899–905. 10.1016/j.fuproc.2006.06.005. [DOI] [Google Scholar]
- Horikawa T.; Kitakaze Y.; Sekida T.; Hayashi J.; Katoh M. Characteristics and humidity control capacity of activated carbon from bamboo. Bioresour. Technol. 2010, 101, 3964–3969. 10.1016/j.biortech.2010.01.032. [DOI] [PubMed] [Google Scholar]
- Lim W. C.; Srinivasakannan C.; Balasubramanian N. Activation of palm shells by phosphoric acid impregnation for high yielding activated carbon. J. Anal. Appl. Pyrolysis 2010, 88, 181–186. 10.1016/j.jaap.2010.04.004. [DOI] [Google Scholar]
- Puziy A. M.; Poddubnaya O. I.; Martínez-Alonso A.; Suárez-García F.; Tascón J. M. D. Synthetic carbons activated with phosphoric acid: I. Surface chemistry and ion binding properties. Carbon 2002, 40, 1493–1505. 10.1016/S0008-6223(01)00317-7. [DOI] [Google Scholar]
- Zuo S.; Yang J.; Liu J.; Cai X. Significance of the carbonization of volatile pyrolytic products on the properties of activated carbons from phosphoric acid activation of lignocellulosic material. Fuel Process. Technol. 2009, 90, 994–1001. 10.1016/j.fuproc.2009.04.003. [DOI] [Google Scholar]
- Fermanelli C. S.; Córdoba A.; Pierella L. B.; Saux C. Pyrolysis and copyrolysis of three lignocellulosic biomass residues from the agro-food industry: A comparative study. Waste Manage. 2020, 102, 362–370. 10.1016/j.wasman.2019.10.057. [DOI] [PubMed] [Google Scholar]
- Song M.; Jin B.; Xiao R.; Yang L.; Wu Y.; Zhong Z.; Huang Y. The comparison of two activation techniques to prepare activated carbon from corn cob. Biomass Bioenergy 2013, 48, 250–256. 10.1016/j.biombioe.2012.11.007. [DOI] [Google Scholar]
- Timur S.; Ikizoglu E.; Yanik J. Preparation of Activated Carbons from Oreganum Stalks by Chemical Activation. Energy Fuels 2006, 20, 2636–2641. 10.1021/ef060219k. [DOI] [Google Scholar]
- Olivares-Marín M.; Fernández-González C.; Macías-García A.; Gómez-Serrano V. Thermal behaviour of lignocellulosic material in the presence of phosphoric acid. Influence of the acid content in the initial solution. Carbon 2006, 44, 2347–2350. 10.1016/j.carbon.2006.04.004. [DOI] [Google Scholar]
- Hadoun H.; Sadaoui Z.; Souami N.; Sahel D.; Toumert I. Characterization of mesoporous carbon prepared from date stems by H3PO4 chemical activation. Appl. Surf. Sci. 2013, 280, 1–7. 10.1016/j.apsusc.2013.04.054. [DOI] [Google Scholar]
- Sun Y.; Yue Q.; Gao B.; Huang L.; Xu X.; Li Q. Comparative study on characterization and adsorption properties of activated carbons with H3PO4 and H4P2O7 activation employing Cyperus alternifolius as precursor. Chem. Eng. J. 2012, 181-182, 790–797. 10.1016/j.cej.2011.11.098. [DOI] [Google Scholar]
- Yu X.; Han X.; Chang C.; Hu Y.; Xu C. C.; Fang S. Corncob-derived activated carbon for roxarsone removal from aqueous solution: isotherms, kinetics, and mechanism. Environ. Sci. Pollut. Res. 2020, 27, 15785–15797. 10.1007/s11356-020-07942-x. [DOI] [PubMed] [Google Scholar]
- Altintig E.; Arabaci G.; Altundag H. Preparation and characterization of the antibacterial efficiency of silver loaded activated carbon from corncobs. Surf. Coat. Technol. 2016, 304, 63–67. 10.1016/j.surfcoat.2016.06.077. [DOI] [Google Scholar]
- Qin C.; Chen Y.; Gao J.-m. Manufacture and characterization of activated carbon from marigold straw (Tagetes erecta L) by H3PO4 chemical activation. Mater. Lett. 2014, 135, 123–126. 10.1016/j.matlet.2014.07.151. [DOI] [Google Scholar]
- Prahas D.; Kartika Y.; Indraswati N.; Ismadji S. Activated carbon from jackfruit peel waste by H3PO4 chemical activation: Pore structure and surface chemistry characterization. Chem. Eng. J. 2008, 140, 32–42. 10.1016/j.cej.2007.08.032. [DOI] [Google Scholar]
- Yorgun S.; Yıldız D. Preparation and characterization of activated carbons from Paulownia wood by chemical activation with H3PO4. J. Taiwan Inst. Chem. Eng. 2015, 53, 122–131. 10.1016/j.jtice.2015.02.032. [DOI] [Google Scholar]
- Zhang D.; Liu S.; Fu X.; Jia S.; Min C.; Pan Z. Adsorption and Desorption Behaviors of Nitrous Oxide on Various Rank Coals: Implications for Oxy-coal Combustion Flue Gas Sequestration in Deep Coal Seams. Energy Fuels 2019, 33, 11494–11506. 10.1021/acs.energyfuels.9b02763. [DOI] [Google Scholar]
- Luo C.; Zhang D.; Lun Z.; Zhao C.; Wang H.; Pan Z.; Li Y.; Zhang J.; Jia S. Displacement behaviors of adsorbed coalbed methane on coals by injection of SO2/CO2 binary mixture. Fuel 2019, 247, 356–367. 10.1016/j.fuel.2019.03.057. [DOI] [Google Scholar]
- Sych N. V.; Trofymenko S. I.; Poddubnaya O. I.; Tsyba M. M.; Sapsay V. I.; Klymchuk D. O.; Puziy A. M. Porous structure and surface chemistry of phosphoric acid activated carbon from corncob. Appl. Surf. Sci. 2012, 261, 75–82. 10.1016/j.apsusc.2012.07.084. [DOI] [Google Scholar]
- Schreiber B.; Brinkmann T.; Schmalz V.; Worch E. Adsorption of dissolved organic matter onto activated carbon—the influence of temperature, absorption wavelength, and molecular size. Water Res. 2005, 39, 3449–3456. 10.1016/j.watres.2005.05.050. [DOI] [PubMed] [Google Scholar]
- Ahmedna M.; Marshall W. E.; Rao R. M. Production of granular activated carbons from select agricultural by-products and evaluation of their physical, chemical and adsorption properties. Bioresour. Technol. 2000, 71, 113–123. 10.1016/S0960-8524(99)00070-X. [DOI] [Google Scholar]
- Özhan A.; Şahin Ö.; Küçük M. M.; Saka C. Preparation and characterization of activated carbon from pine cone by microwave-induced ZnCl2 activation and its effects on the adsorption of methylene blue. Cellulose 2014, 21, 2457–2467. 10.1007/s10570-014-0299-y. [DOI] [Google Scholar]
- Puziy A. M.; Poddubnaya O. I.; Martínez-Alonso A.; Suárez-García F.; Tascón J. M. D. Synthetic carbons activated with phosphoric acid: II. Porous structure. Carbon 2002, 40, 1507–1519. 10.1016/S0008-6223(01)00318-9. [DOI] [Google Scholar]
- Tay T.; Ucar S.; Karagöz S. Preparation and characterization of activated carbon from waste biomass. J. Hazard. Mater. 2009, 165, 481–485. 10.1016/j.jhazmat.2008.10.011. [DOI] [PubMed] [Google Scholar]
- Mohanty K.; Jha M.; Meikap B. C.; Biswas M. N. Preparation and Characterization of Activated Carbons from Terminalia Arjuna Nut with Zinc Chloride Activation for the Removal of Phenol from Wastewater. Ind. Eng. Chem. Res. 2005, 44, 4128–4138. 10.1021/ie050162+. [DOI] [Google Scholar]
- Nakagawa K.; Namba A.; Mukai S. R.; Tamon H.; Ariyadejwanich P.; Tanthapanichakoon W. Adsorption of phenol and reactive dye from aqueous solution on activated carbons derived from solid wastes. Water Res. 2004, 38, 1791–1798. 10.1016/j.watres.2004.01.002. [DOI] [PubMed] [Google Scholar]