Abstract
Objective:
Restricting dietary methionine to 0.17% in mice increases energy expenditure, reduces fat deposition, and improves metabolic health by increasing hepatic FGF21. The goal was to compare each of these responses in mice with the co-receptor for FGF21 deleted in either adipose tissue or the brain.
Methods:
Methionine-restricted (MR) diets were fed to age-matched cohorts of mice with the co-receptor for FGF21 deleted in either adipose tissue or the brain. The physiological and transcriptional responses to MR were compared in the respective cohorts.
Results:
Tissue-specific deletion of the FGF21 co-receptor in adipose tissue did not abrogate the ability of dietary MR to increase energy expenditure and reduce fat deposition. Tissue-specific deletion of the FGF21 co-receptor from the brain produced mice that were unable to respond to the effects of MR on energy expenditure or the remodeling of adipose tissue.
Conclusions:
The increase in FGF21 produced by dietary MR acts primarily in the brain to produce its physiological effects on energy balance. In contrast, the effects of MR on hepatic gene expression were intact in both models, supporting a mechanism that directly links detection of reduced methionine in the liver to transcriptional mechanisms that alter gene expression in the liver.
Keywords: essential amino acid, nutrient sensing, β-Klotho, obesity, energy expenditure, FGF21
Introduction
Dietary methionine restriction (MR) represents an appealing approach to treat obesity because it produces weight loss without food restriction. It does this by activating transcriptional programs of thermogenesis in brown and white adipose tissue that enhance uncoupled fat oxidation while producing a persistent increase in total energy expenditure (EE) (1–4). The cumulative effect of increased EE limits ongoing fat deposition, and in conjunction with transcriptional changes that reduce hepatic lipid synthesis, dietary MR produces a coordinated improvement in multiple biomarkers of metabolic health (5–8). An important advance in understanding how dietary MR produces these effects came with the observation that within hours of its introduction, dietary MR produces a significant increase in hepatic expression and release of the hormone, fibroblast growth factor 21 (FGF21) into the circulation (5, 9). In subsequent loss-of-function studies with FGF21-null mice, it was shown that FGF21 enhanced in vivo insulin sensitivity through a combination of reduced adiposity and mechanisms that are independent of adiposity (10). Collectively, these studies made a compelling case that FGF21 mediates the thermogenic and insulin-sensitizing effects of dietary MR (10).
Although previous studies have shown that pharmacological administration of FGF21 produces profound effects on a number of metabolic responses, the present studies address the biological significance of the physiological increases in circulating FGF21 that are produced by dietary MR. The importance of this question stems from the attractive possibility of producing beneficial metabolic responses through dietary modulation of FGF21. The initial descriptions of FGF21 provided compelling evidence that it is a powerful metabolic regulator in the context of glucose homeostasis, lipid metabolism, and energy balance (11–17), but controversy remains about how FGF21 signaling is anatomically organized to produce its multiple physiological effects. This question also extends to dietary MR, where current evidence supports the role of FGF21 as an important mediator of the effects of the diet. Using cohorts of mice with tissue-specific deletion of an essential co-receptor of FGF21 signaling, we establish that loss of FGF21 signaling in the brain compromises the ability of dietary MR to remodel adipose tissue and increase EE, but not its ability to affect hepatic gene expression.
Materials and Methods
Experimental Protocols, Diets, and Animals
All experiments were approved by Pennington Biomedical Research Center Institutional Animal Care and Use Committee based on guidelines approved by the National Research Council, Animal Welfare Act, and PHS Policy on humane care and use of animals in scientific research. Mice were singly housed in shoebox cages with corncob bedding. Using the feeding paradigm described previously (18, 19), 5 week-old male mice received either a purified diet containing 0.86% methionine and no cysteine (Con group) or methionine restricted to 0.17% and no cysteine (MR group). The diets were formulated as extruded pellets by Dyets Inc. (Bethlehem, PA) and provided ad libitum. The energy content of Con and MR diets was 15.96 kJ/g, with 18.9% of energy from fat (corn oil), 64.9% from carbohydrate, and 14.8% from a custom mixture of L-amino acids. The amino acid content of the diet on a weight basis was 14.1%. Details of diet composition were provided previously (19). Housing temperature was maintained at 22–23° C for Experiments 1 and 2 and at 28° C in Experiment 3. Lights were on 12 h cycle from 7 AM-7 PM.
Food intake was measured each week by weighing food at the beginning of the feeding interval and then weighing the remaining food. Bedding was sifted through wire mesh to collect wasted food. Additionally, body weight and composition were assessed at weekly intervals using nuclear magnetic resonance (NMR) spectroscopy (Bruker Minispec, Billerica, MA). Animals were fasted for four hours prior to euthanasia and tissue collection. Trunk blood was collected for serum analyses and tissues were harvested and snap frozen in liquid nitrogen until analysis. Fasting serum insulin (Millipore; Billerica, MA) and FGF21 (R&D Systems; Minneapolis, MN) were determined via enzyme-linked immunosorbent assays (ELISA) according to the manufacturers’ protocol.
β-klotho floxed (Klbfl/fl) mice on a B6 background were provided by Dr. Steven Kliewer (16, 20) and tissue-specific knockouts of β-klotho were generated by crossing female Klblfl/fl mice with male Klblfl/fl mice carrying either Adiponectin-Cre (adipose-specific, Jackson Labs, Stock No. 028020) or CamK2a-Cre alleles (brain-specific (21)). The resulting litters contained Cre positive (Klbfl/(Adip) or Klbfl/(CamK2a)) or Cre negative littermate controls (Klbfl/fl of equivalent genetic background to serve as control mice.
Experiment 1
Four-week old male Klbfl/fl or Klbfl/(Adip) mice (n=26–28 per genotype) were housed at 22–23° C and given Con diet for one week prior to being adapted to the Promethion indirect calorimetry (IDC) system (Sable Systems, Las Vegas, NV) for three days. On day 3, half the mice of each genotype were randomized to receive the MR diet while the other half continued on the Con diet. Mice remained in the calorimeter for an additional nine days to measure their responses to the respective diets before being returned to home cages. Thereafter, animals were maintained on assigned diets for eight weeks. Body weight, composition, and food intake were assessed at weekly intervals as described above. Animals were re-acclimated to the Promethion system for one week, followed by five days of VCO2 and VO2 measurements for calculation of energy expenditure (EE). Animals were returned to their home cages for one week of recovery prior to euthanasia and tissue harvest.
Experiment 2
Four-week old male Klbfl/fl or Klbfl/(CamK2a) mice (n=16–20 per genotype) were housed at 22–23° C and given Con diet for one week prior to being randomized to receive Con or MR diet for the following eight weeks. Body weight, composition, and food intake measurements were made at weekly intervals as described above. Animals were then acclimated to the Promethion system for one week, followed by five days of VCO2 and VO2 measurements for calculation of energy expenditure (EE). Animals were returned to their home cages for one week prior to euthanasia and tissue harvest.
Experiment 3
Four-week old male Klbfl/fl or Klbfl/(Adip) mice and Klbfl/fl or Klbfl/(CamK2a) mice (n=16 per genotype) were given Con diet and adapted to housing at 28° C for one week prior to being randomized to receive Con or MR diet for the following eight weeks. This was done to lower basal expression of UCP1 in mice on the Con diet and provide a more sensitive test of MR-dependent increases in UCP1 expression. Thereafter, the mice were euthanized and brown adipose tissue (BAT) was harvested and snap frozen.
Perfusion and Immunohistochemistry
At study’s end, a subset of animals from Experiments 1 and 2 were perfused for immunohistochemical analyses. Mice were injected with Socumb (Henry Schein Medical, Mellville, NY) to induce a deep state of anesthesia. Then mice were perfused with PBS using a peristaltic pump, followed by 10% formalin as a tissue fixative. Inguinal white adipose tissue (IWAT) samples were harvested, stored in 10% formalin, and then embedded in paraffin, cut into 5 μm sections, and sequentially stained for UCP1 and wheat germ agglutinin (WGA) as previously described (4). The slides were imaged using a Hamamatsu Nanozoomer slide scanner using a DAPI/FITC/TxRed filter set and the percentage of WGA stained cells expressing UCP1 was measured using Visiopharm software (Visiopharm, H0rsholm, Denmark) as before (4).
RNA Isolation and Gene Expression
Total RNA was isolated using the RNeasy Mini Kit (QIAGEN, Inc.; Valencia, CA) and 1 μg of total RNA was used for reverse transcription to produce cDNA. Gene expression was measured via quantitative real-time PCR, and mRNA concentrations were normalized to cyclophilin expression, and expressed as fold-change relative to Klbfl/fl mice on the Con diet. The primers used for all PCR reactions are provided in online supporting information Table 1.
Western Blotting
Whole cell lysates of BAT were prepared by homogenizing tissue in buffer (150 mM NaCI, 1 mM EDTA, 1 mM EGTA, 10 mM Tris, 1% Triton x-100, 0.5% NP-40) and protein quantitated by Lowry assay. Three μg were loaded per lane, separated by SDS-PAGE, and transferred to polyvinylidene fluoride membranes (BioRad; Hercules, CA). Expression of UCP1 was measured as previously described and standardized to PDC-E2 (3). Blots were developed using enhanced chemiluminescence and band densities determined using Image J software.
Analysis of Energy Expenditure
VO2 is expressed as liters (L) of O2 consumed per h, while Respiratory Exchange Ratio (RER) is the ratio of VCO2 produced to VO2 consumed. EE was calculated as (VO2 × (3.815 + (1.232 × RER)) × 0.96 kCal/h) × 4.019 kJ/kCal, and expressed as kJ/h/mouse. Group differences in 24 h EE (kJ/h/mouse) at study’s end were compared using Analysis of Covariance (ANCOVA) (JMP Software, Version 12; SAS Institute Inc., Cary, NC) to calculate least squares means that accounted for variation in EE attributable to differences in lean mass, fat mass, and activity among the mice. The initial diet-dependent change in daytime and nighttime EE was calculated by subtracting the daytime and nighttime EE of each group prior to diet changes from the day and night time measures of EE during the nine days after initial exposure to the MR diet on day 0. The diet-induced change in mean daytime and nighttime EE measurements were compared to the corresponding measures of EE in mice of each genotype on the Con diet using a repeated measures two-way ANOVA and the Bonferroni correction to account for multiple comparisons.
Statistical Analysis
Body weight, body composition, food intake, gene expression, and protein expression levels were analyzed using two-way ANOVA (GraphPad Prism; San Diego, CA) with genotype and diet as main effects. Group differences in EE (kJ/hr/mouse) were compared using as described previously ANCOVA (3). The least square means ± SEM for each genotype x diet interaction were compared using two-way ANOVA and the significance of the model effects and interaction were tested using residual variance calculated by the ANCOVA. Protection against type I errors was set at 5% (α = 0.05).
Results
Experiment 1
The initial body weight and composition of control (Klbfl/fl) and adipocyte-specific β-klotho knockout mice (Klbfl/(Adip)) did not differ, and both genotypes responded to dietary MR with a comparable decrease in body weight and adiposity over the duration of the study (Table 1). The MR diet also produced comparable increases in energy intake and serum FGF21 in both genotypes, and a comparable decrease in fasting insulin (Table 1).
Table 1 –
Energy balance and serum hormone parameters for mice with β-Klotho deleted in adipose tissue (Klbfl/fl x AdipCRE) or the central nervous system (CNS) (Klbfl/fl x CamK2aCRE) and fed control or methionine-restricted diets for 11 wksA
| Experiment 1 | Experiment 2 | |||||||
|---|---|---|---|---|---|---|---|---|
| Klbfl/fl | Klbfl/(Adip) | Klbfl/fl | Klbfl/(CamK2a) | |||||
| Control | MR | Control | MR | Control | MR | Control | MR | |
| Initial BW (g) | 19.1 ± 0.4a | 19.7 ± 0.3a | 18.9 ± 0.6a | 19.2 ± 0.4a | 15.7 ± 0.6a | 16.2 ± 0.9a | 16.5 ± 0.4a | 17.1 ± 0.6a |
| Final BW (g) | 29.0 ± 0.9a | 23.4 ± 0.4b | 26.3 ± 0.7a | 22.4 ± 0.5b | 29.5 ± 1.0a | 24.5 ± 0.8b | 30.5 ± 1.0a | 24.1 ± 0.5b |
| Initial % AdiposityB | 10.2 ± 0.3a | 9.9 ± 0.3a | 9.7 ± 0.4a | 9.9 ± 0.3a | 10.4 ± 0.5a | 11.0 ± 0.9a | 11.6 ± 0.5a | 12.6 ± 0.7a |
| Final % AdiposityB | 14.8 ± 0.6a | 11.9 ± 0.2b | 12.0 ± 0.6b | 9.9 ± 0.3c | 15.1 ± 1.2a | 12.4 ± 0.9b | 14.7 ± 0.7a | 10.7 ± 0.7b |
| Initial Fat Mass (g) | 1.94 ± 0.08a | 1.95 ± 0.09a | 1.83 ± 0.09a | 1.90 ± 0.08a | 1.63 ± 0.11a | 1.78 ± 0.19a | 1.91 ± 0.13a | 2.15 ± 0.20a |
| Final Fat Mass (g) | 4.29 ± 0.31a | 2.78 ± 0.07b | 3.16 ± 0.21c | 2.22 ± 0.09d | 4.45 ± 0.32a | 3.04 ± 0.18b | 4.48 ± 0.26a | 2.58 ± 0.21c |
| Energy IntakeC (kJ/d/mouse) | 47.2 ± 1.0a | 52.8 ± 1.5b | 48.9 ± 1.0a,b | 51.7 ± 1.6a,b | 44.1 ± 1.8a | 53.2 ± 1.6b | 40.8 ± 0.7a | 39.0 ± 0.8a |
| Energy IntakeC (kJ/d/g) | 1.98 ± 0.05a | 2.51 ± 0.05b | 2.12 ± 0.05a | 2.49 ± 0.03b | 1.93 ± 0.05a | 2.43 ± 0.06b | 1.77 ± 0.02c | 1.77 ± 0.02c |
| Serum Insulin (ng/ml) | 3.06 ± 0.74a | 0.57 ± 0.04b | 2.04 ± 0.61a | 0.61 ± 0.09b | 3.45 ± 0.79a | 1.48 ± 0.37b | 3.03 ± 0.30b | 0.75 ± 0.16b |
| Serum FGF21 (ng/ml) | 6.62 ± 2.59a | 15.1 ± 3.1b | 7.1 ± 1.3a | 19.2 ± 3.6b | 1.2 ± 0.6a | 7.8 ± 2.7b | 0.7 ± 0.1a | 19.1 ± 1.8b |
Body weight, adiposity, energy intake, serum insulin, and serum FGF21 were measured as described in the Materials and Methods, and compared by two-way analysis of variance using Genotype and Diet as main effects. Least squares means were compared using residual variance as the error term and presented as mean ± SEM (n=13–16 mice/group for Experiment 1 and n=8–10 mice/group for Experiment 2). Within each experiment, means of each variable annotated with different superscripts differ at P < 0.05.
Body composition was measured by NMR as described in the Materials and Methods and % adiposity was calculated as fat mass / body weight x 100.
The average food intake less spillage was determined over a 24 h period in mice of each genotype on each diet, converted to kJ, and expressed per mouse or per unit of body weight. Means represent average daily energy intake over the entire study and were compared by two-way ANOVA as described above.
The effects of MR on EE were examined at the beginning and end of Experiment 1. At the beginning of the experiment when all mice were on the Con diet, the transition between daytime and nighttime EE was comparable between Klbfl/fl and Klbfl/(Adip) mice (Figure 1A). This pattern continued for 3 days after introduction of dietary MR to half the mice, but between days 4 and 5, a larger nighttime increase in EE in both Klbfl/fl and Klbfl/(Adip) mice on the MR diet begins to emerge (Figure 1A). Between days 5 to 9, both daytime and nighttime EE in Klbfl/fl and Klbfl/(Adip) mice on the MR diet are increased relative to mice of each genotype on the Con diet (Figure 1A). To better assess the timing of diet-dependent effects on EE after introduction of dietary MR, the daytime and nighttime EE during the 3 day run-in period were subtracted from the daytime and nighttime means of each group after introduction of MR and plotted as diet-dependent changes in EE from days 0 through 8. Figure 1B shows that daytime EE in the Klbfl/fl and Klbfl/(Adip) mice on the Con diet did not change appreciably during this period. Daytime EE in the Klbfl/fl and Klbfl/(Adip) mice on the MR diet was similar to mice on the Con diet from day 0 to 4, but on day 5 the daytime EE became significantly higher in Klbfl/(Adip) mice on the MR diet compared to Con (Figure 1B). On days 6 to 8, daytime EE in Klbfl/fl and Klbfl/Adip) mice on the MR diet was higher than mice of each genotype fed Con diet. A similar pattern emerges with respect to nighttime EE, where Klbfl/fl and Klbfl/(Adip) mice on both diets were initially comparable (Figure 1C). However, by day 4, nighttime EE in Klbfl/(Adip) mice on the MR diet is significantly higher than Klbfl/(Adip) mice on Con diet. By day 5 and all subsequent days, nighttime EE in Klbfl/fl and Klbfl/(Adip) mice on MR diet is higher than mice of both genotypes on the Con diet (Figure 1C). Relative to mice on the Con diet at study’s end, dietary MR produced a slightly smaller increase in total EE in Klbfl/(Adip) mice than Klbfl/fl mice (Figure 1D). However, viewed collectively, the effects of dietary MR on measures of energy balance were unaffected by the absence of FGF21 signaling in adipose tissue.
Figure 1 -. Assessment of acute and chronic effects of dietary MR on EE in Control mice (Klbfl/fl), mice with adipocyte-specific Klb knockout (Klbfl/(Adip)), or mice with brain-specific Klb knockout (Klbfl/(CamK2a)).

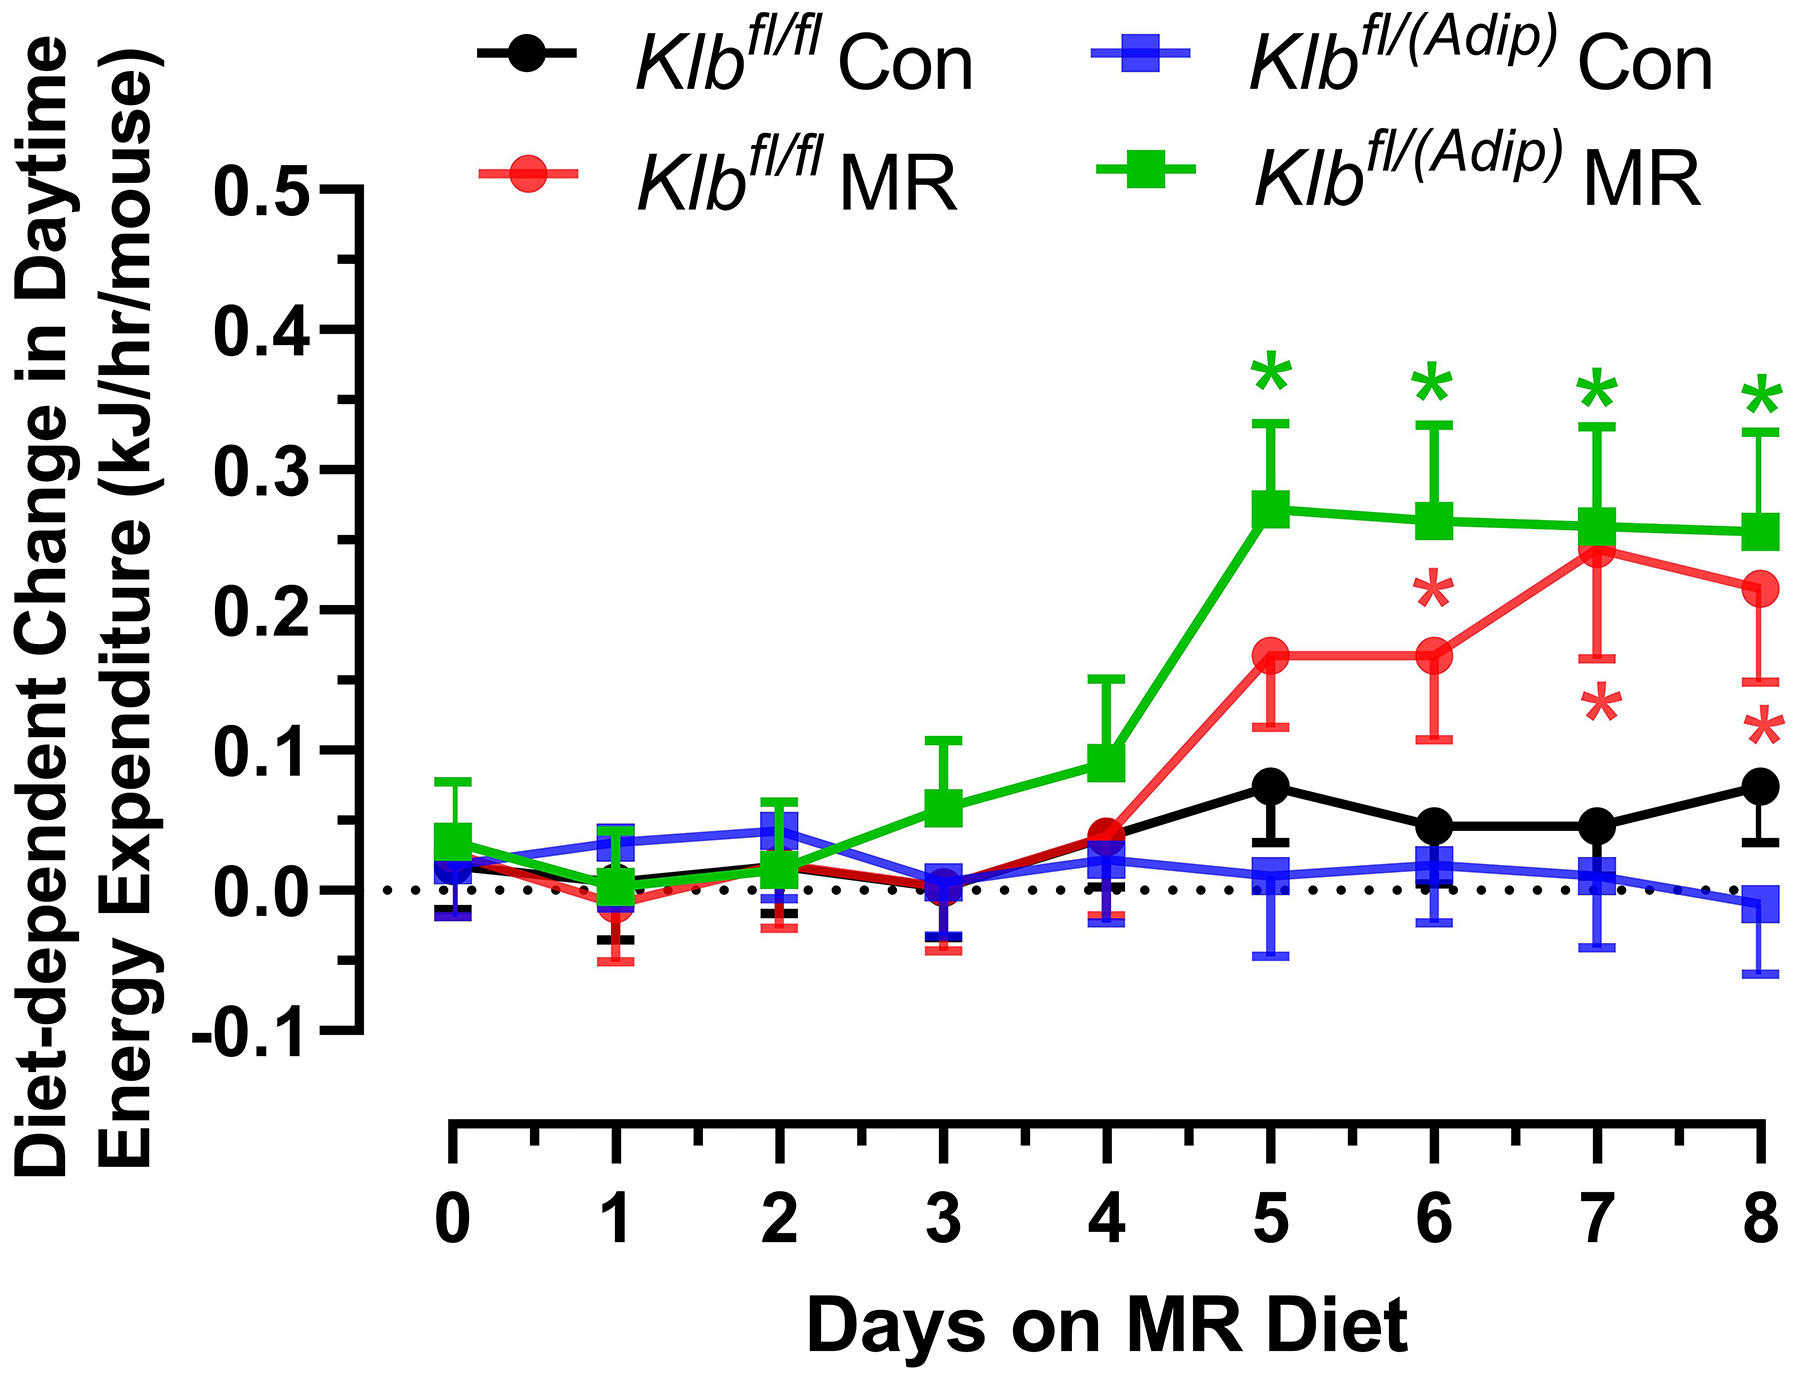
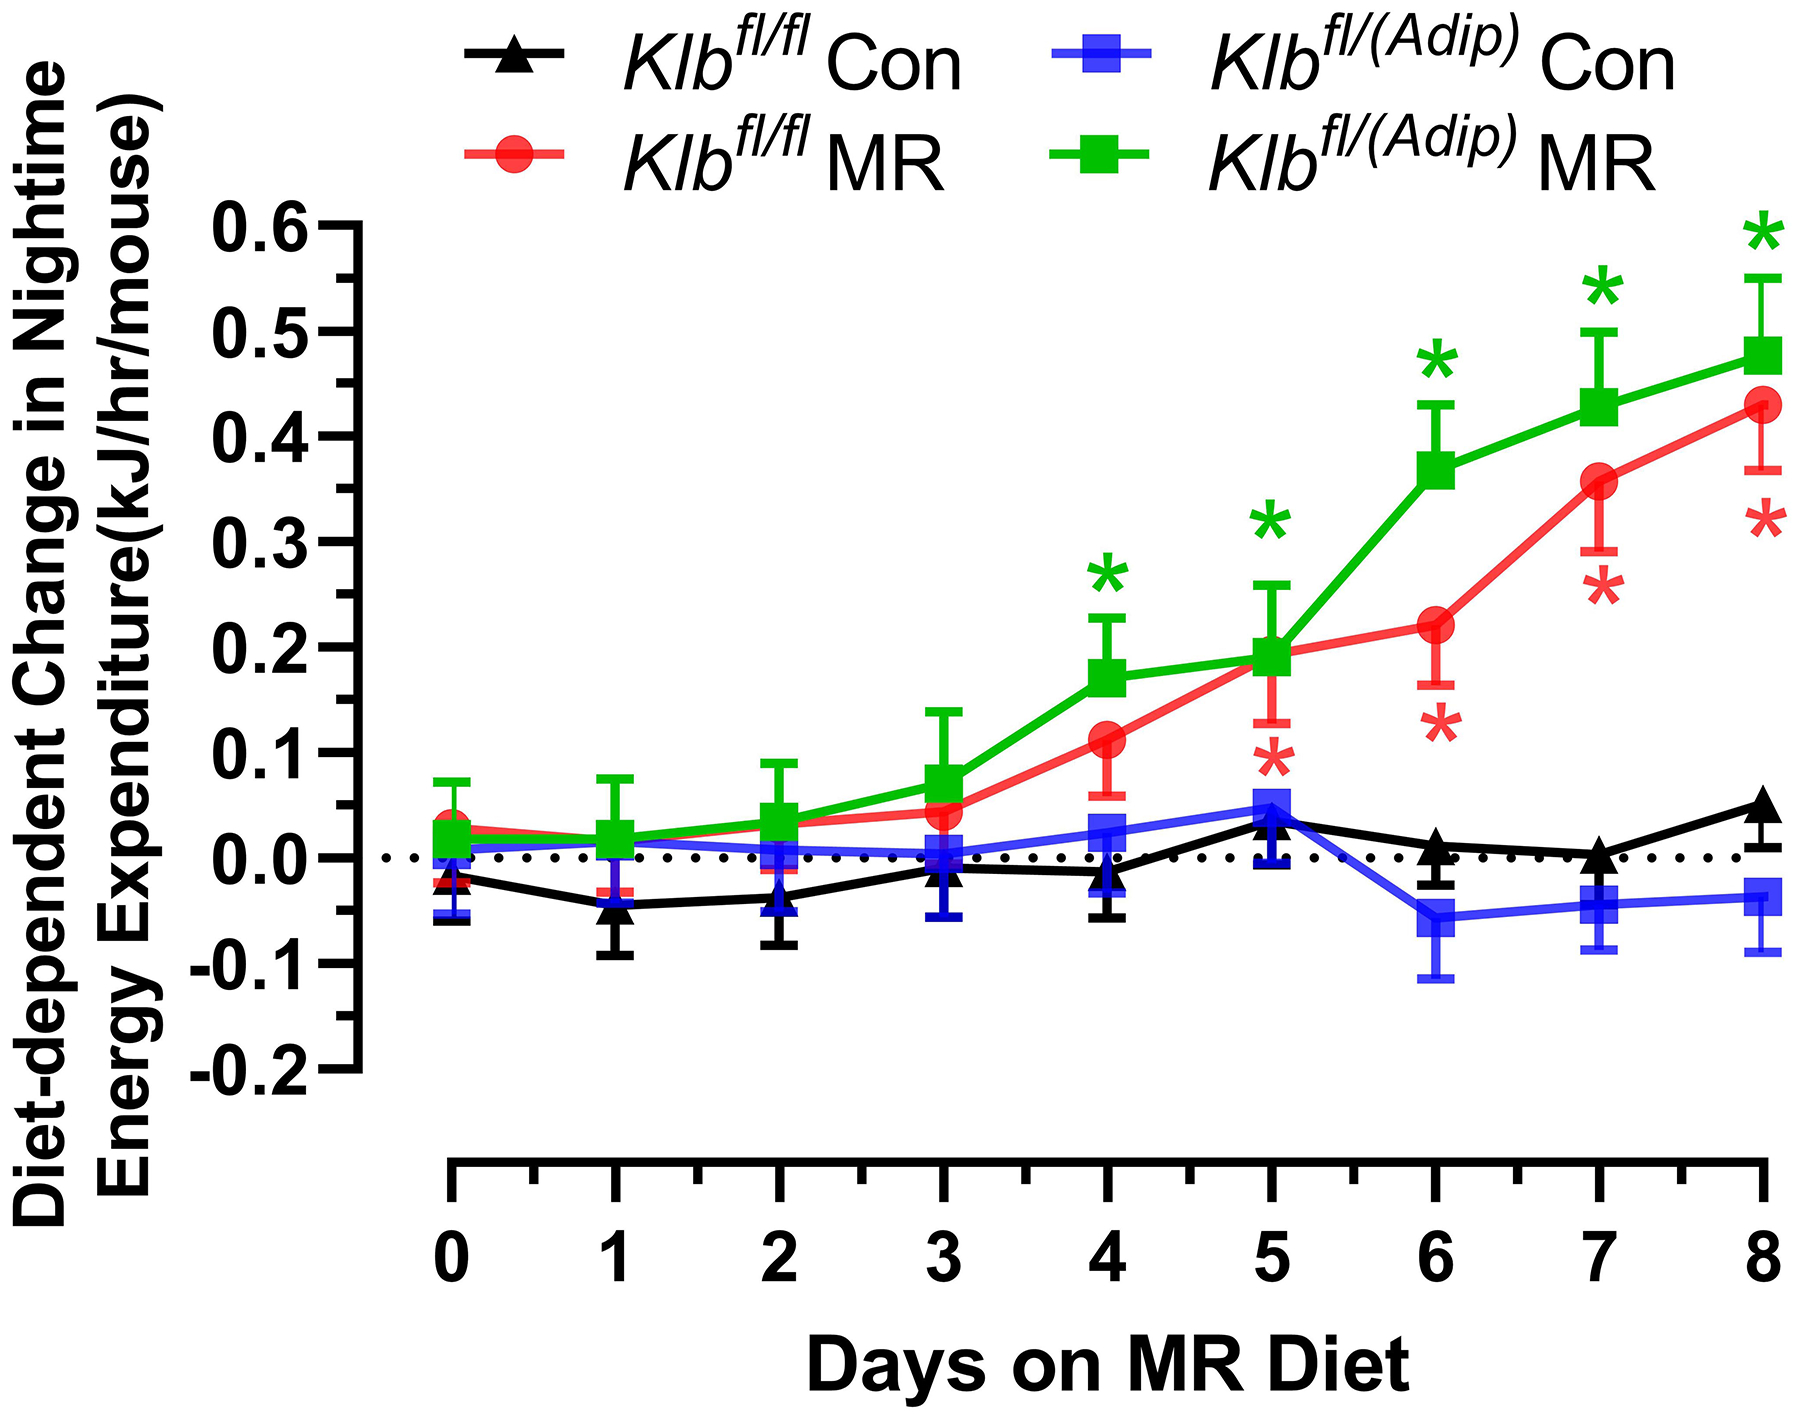
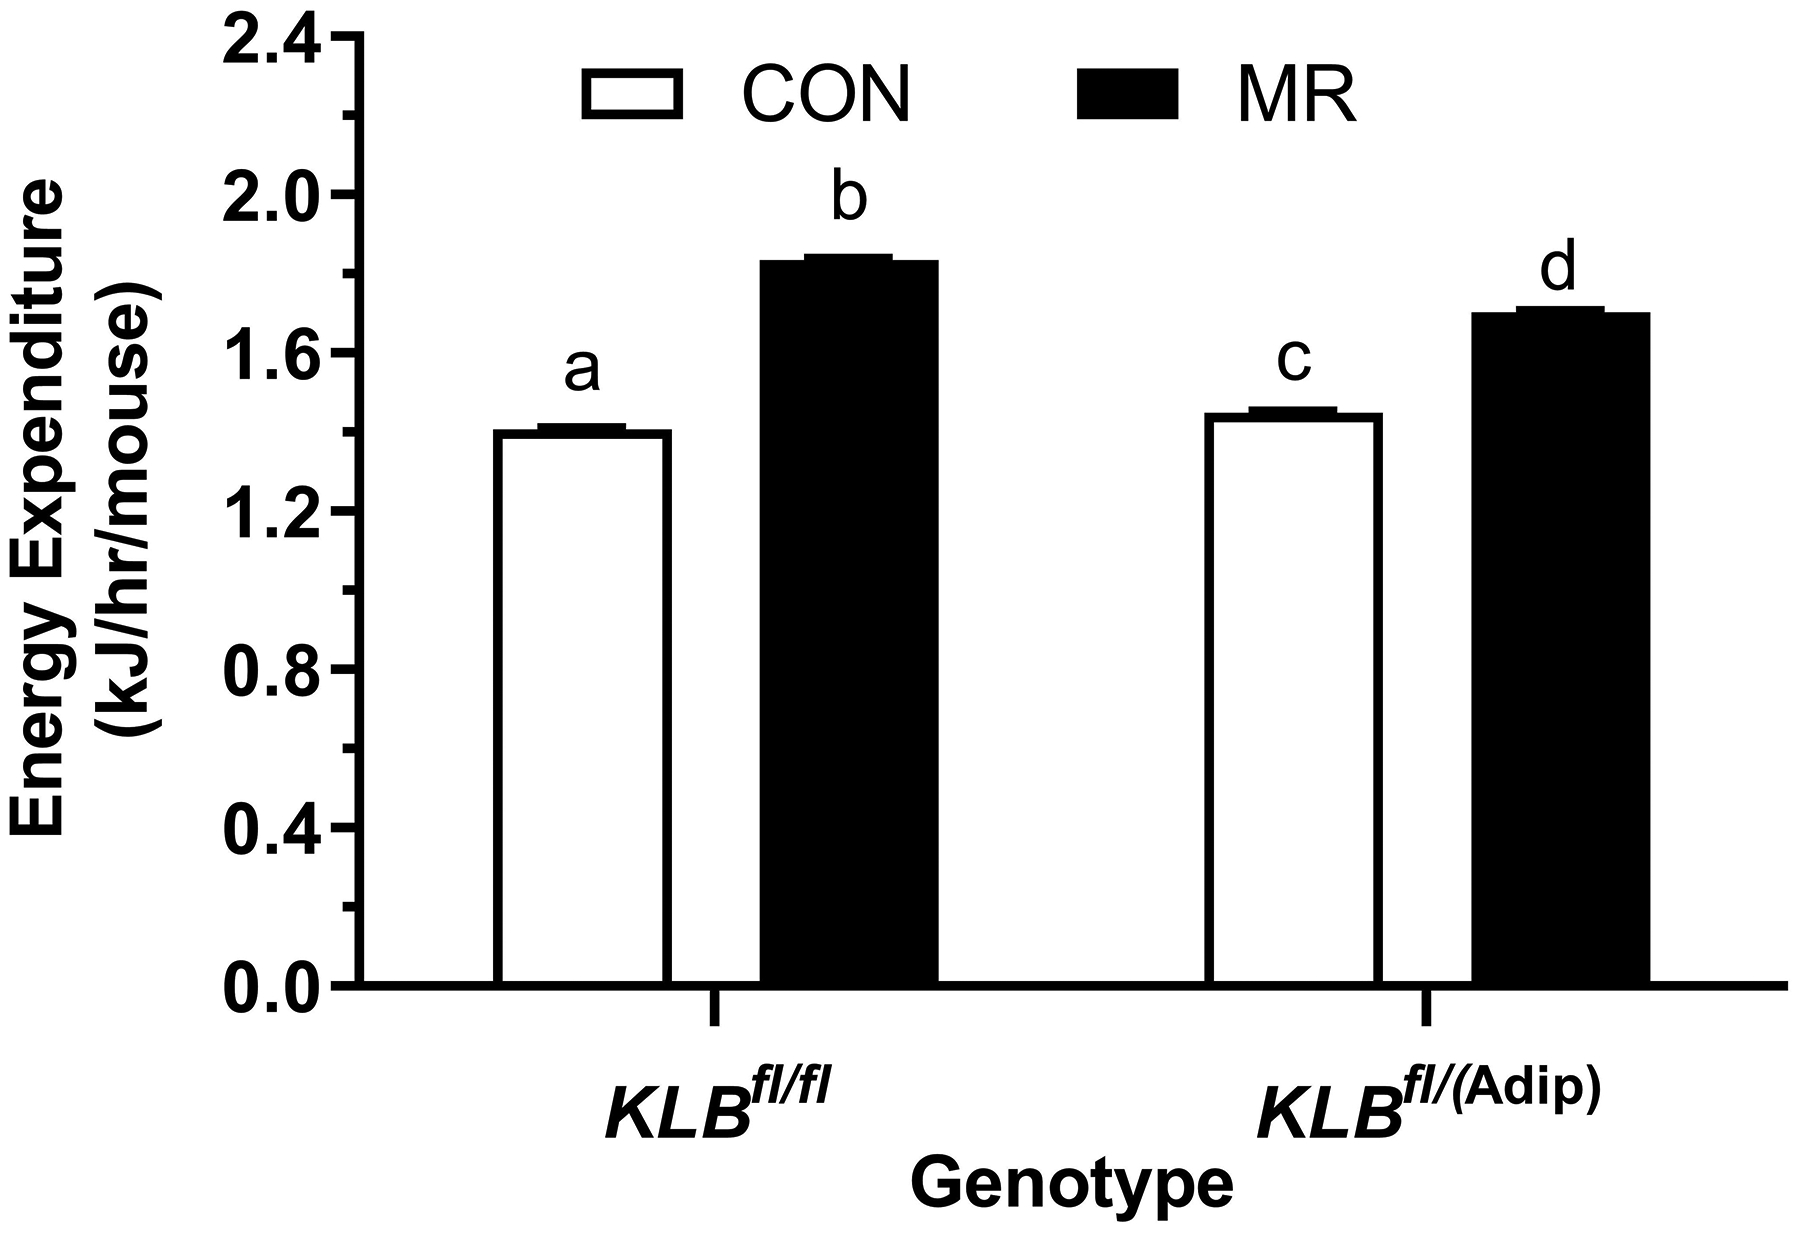
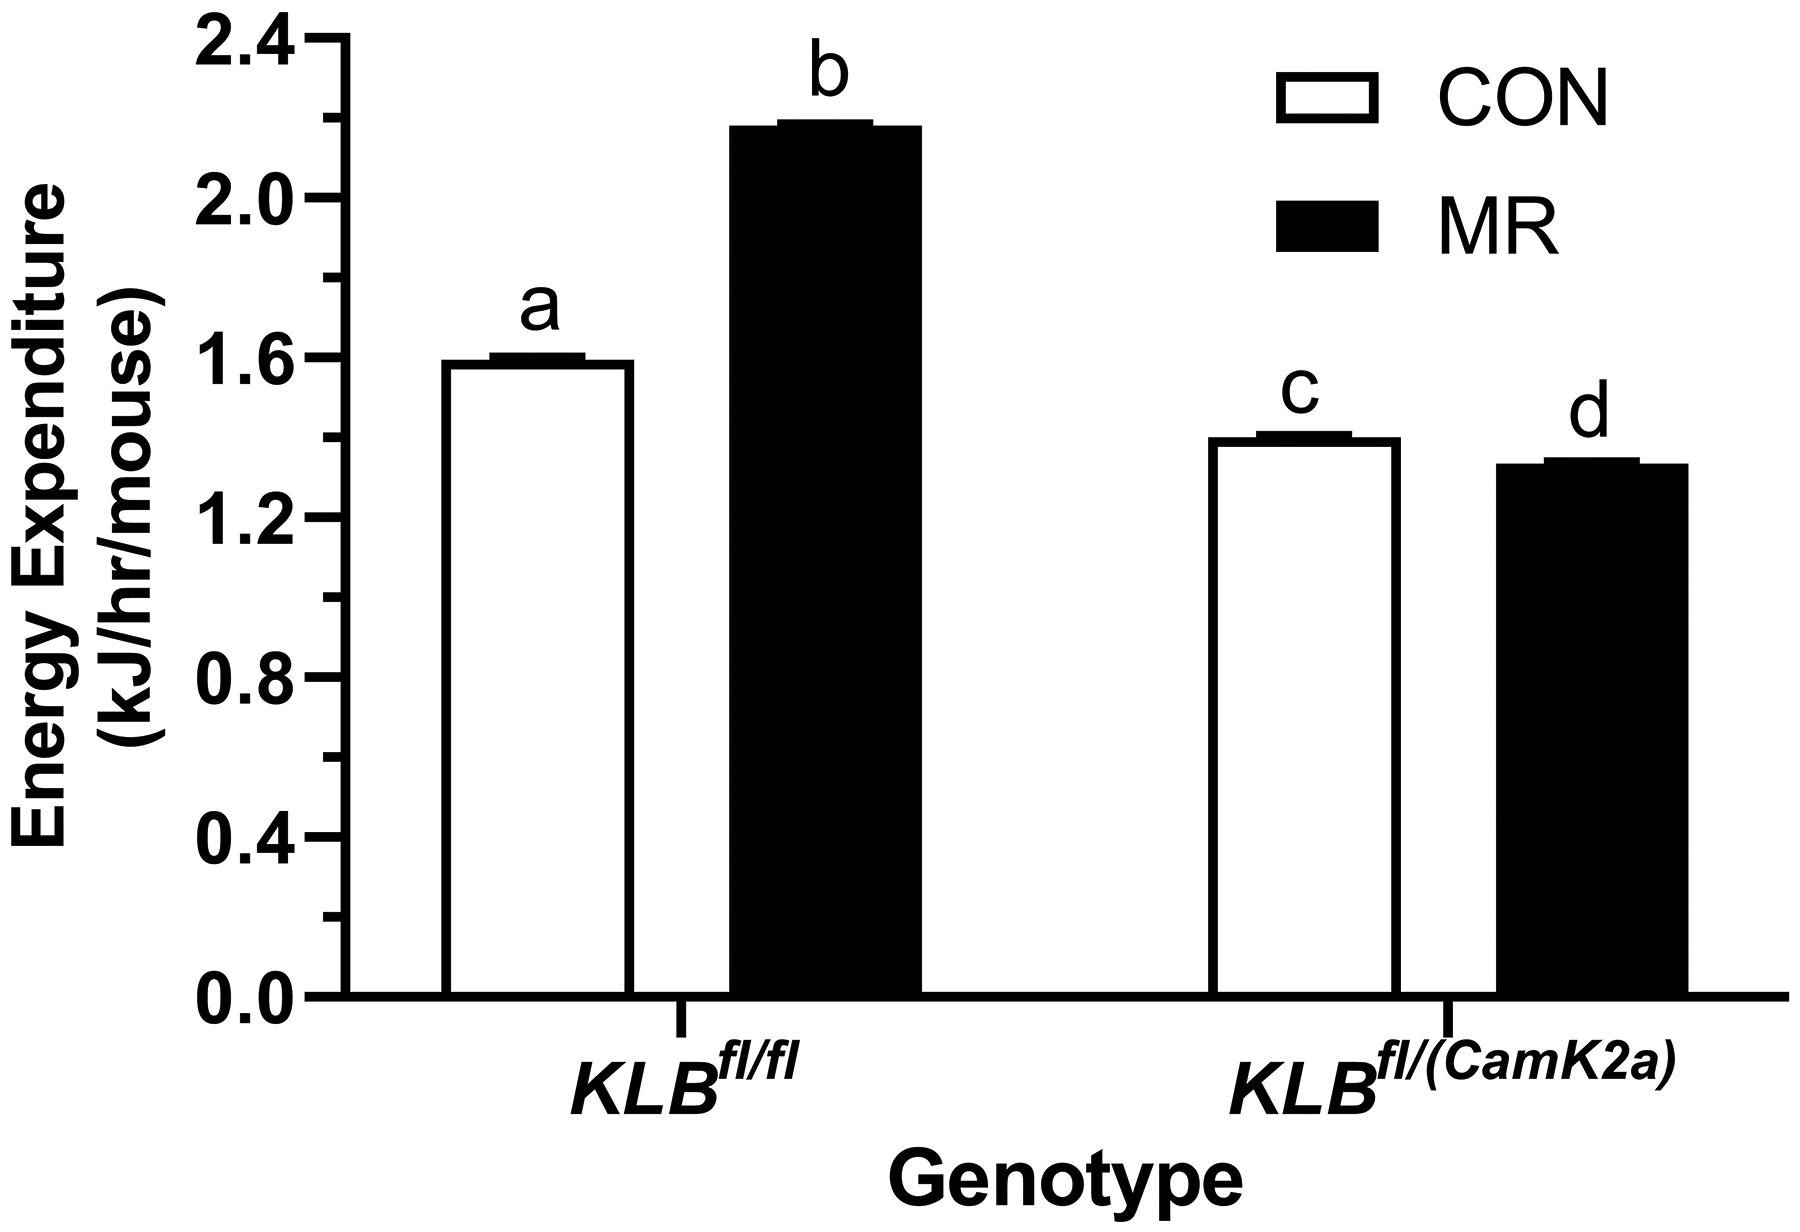
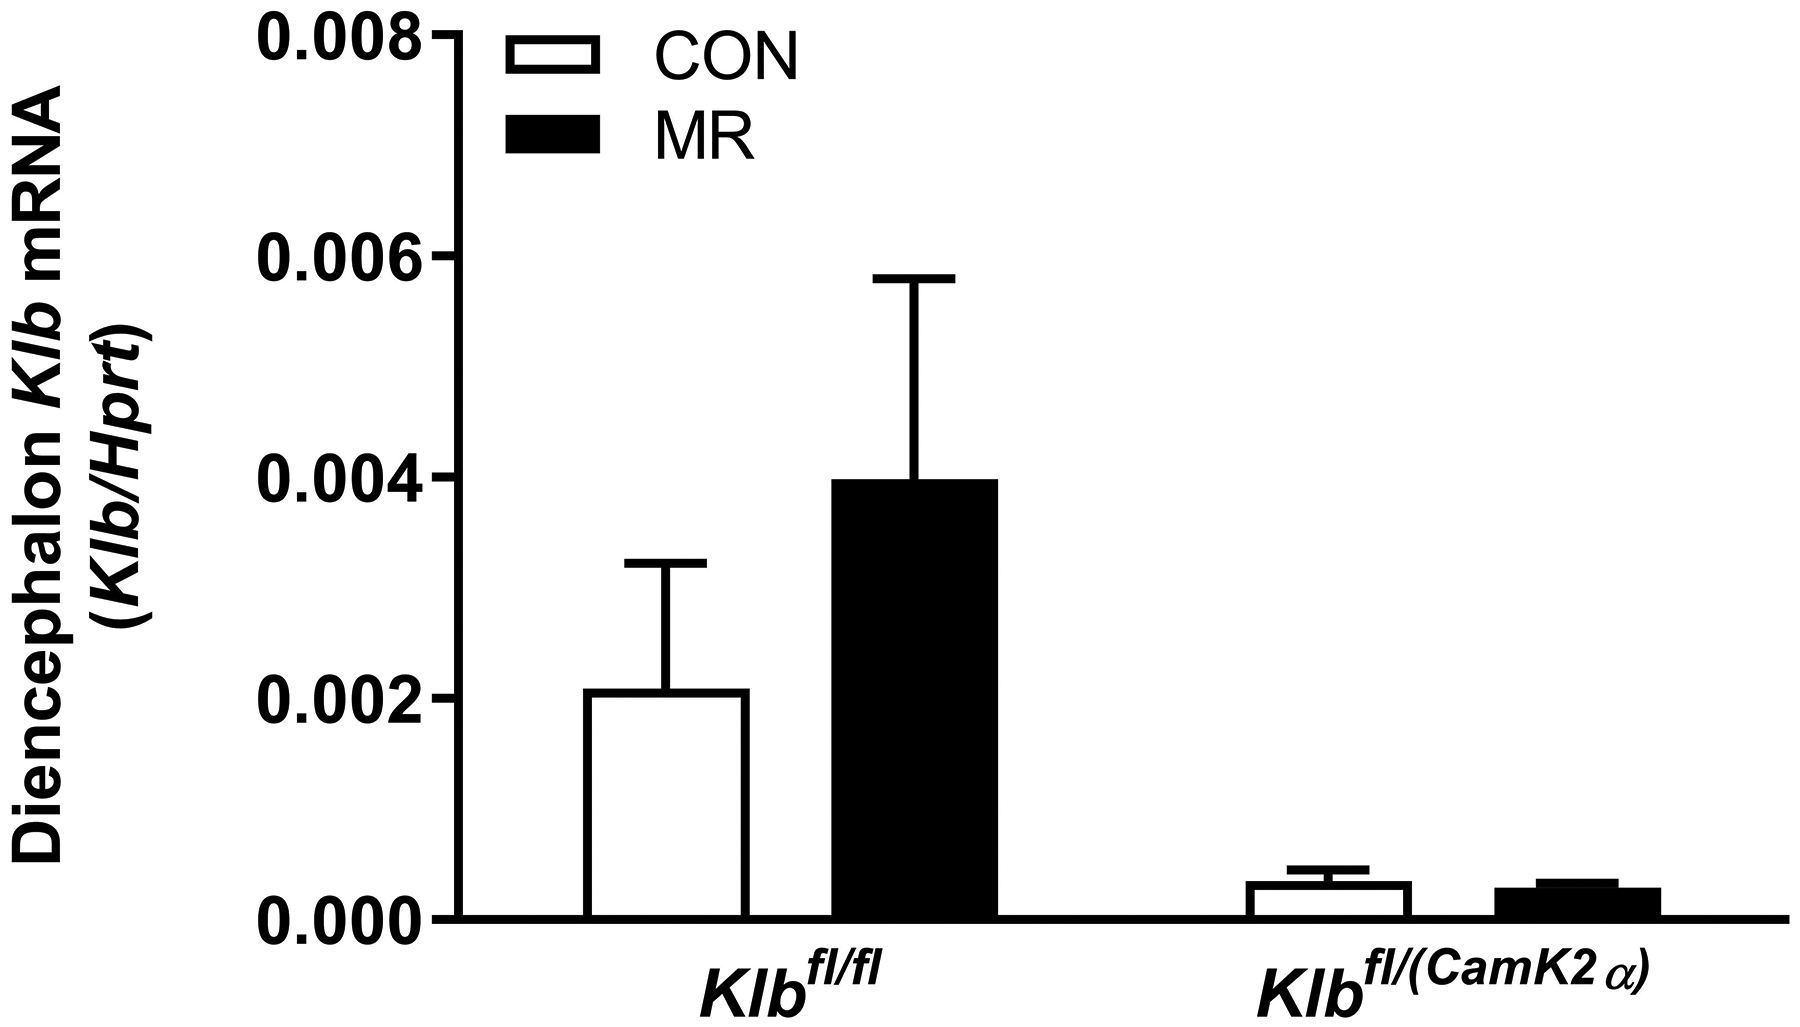
EE was measured via indirect calorimetry (IDC) during the first 12 days of the experiment in sixteen Klbfl/fl and sixteen Klbfl/(Adip) mice on Con and MR diets and for the last 7 days of the experiment in each genotype x diet combination. At the beginning of Experiment 1, Control mice (Klbfl/fl) and adipocyte-specific Klb knockout mice (Klbfl/(Adip)) were placed in the calorimeter chambers for 4 days with all animals receiving the control diet (Con). Then on day 0, half the mice of each genotype were switched to the MR diet while the other half of the mice continued on the Con diet. EE was measured for the next 9 days (Fig. 1A). Error bars are omitted for clarity in Fig. 1A. To better assess the timing of diet-dependent effects on EE after introduction of dietary MR, the mean daytime and nighttime EE during the 3 day run-in period was subtracted from the daytime and nighttime means for each successive 24 h period for each group after introduction of MR, and plotted as diet-dependent changes in daytime and nighttime EE from days 0 through 8. Figs. 1B and 1C show the change over time in daytime mean EE (Fig. 1B) and nighttime mean EE (Fig. 1C) in the Klbfl/fl and Klbfl/(Adip) mice on the Con and MR diets. Mean daytime and nighttime EE in the 4 groups were compared using a repeated meaures two-way ANOVA and means annotated with an asterisk on specific days differ from their corresponding genotype on the Con diet on that day at P<0.05. At the end of Experiments 1 (Fig. 1D) and 2 (Fig. 1E), all mice in each experiment were re-acclimated to the IDC chambers for one week, followed by five days of VCO2 and VO2 measurements for calculation of total energy expenditure (EE). Mean 24 h EE was calculated from the measurements made during the last 5 days of each study and compared by ANCOVA as described in Materials and Methods. All values are expressed as mean ± SEM for 8 mice of each genotype × diet combination. In Figs. 1D and 1E, least square means for 24 h EE not sharing a common letter differ at p < 0.05. In Fig. 1F, the transcript abundance of β-klotho was measured in the diencephlon using hypoxanthine guanine phosphoribosyl transferase (Hrpt) as a denominator and determined to be undetectable.
The biochemical and transcriptional effects of the diets in IWAT and liver from Experiment 1 are illustrated in Figures 2A, 2B, and 4A. Dietary MR produced a comparable increase in mRNA of thermogenic genes associated with fat oxidation (e.g., Ucp1, Cox7a, Cox8b) in IWAT of both Klbfl/fl and Klbfl/(Adip) mice (Figure 2A). To assess the extent of remodeling of IWAT by dietary MR, dual-label immunohistochemistry was used to measure changes in the number of cells expressing UCP1 within the entire inguinal depot. This was accomplished by staining cell membranes with WGA (green) and mitochondrial UCP1 (red) in replicate sections of the depot (Figure 2B). An unbiased imaging algorithm was used to count the total number of cells within each section and the total number of cells also expressing UCP1 in the same section. The median number of cells expressing UCP1 in Klbfl/fl and Klbfl/(Adip) mice on the Con diet was comparable and dietary MR produced a similar increase in the number of cells expressing UCP1 in each genotype (Figure 2B).
Figure 2 -. Transcriptional markers of browning and UCP1 protein expression in IWAT from Experiments 1 and 2.
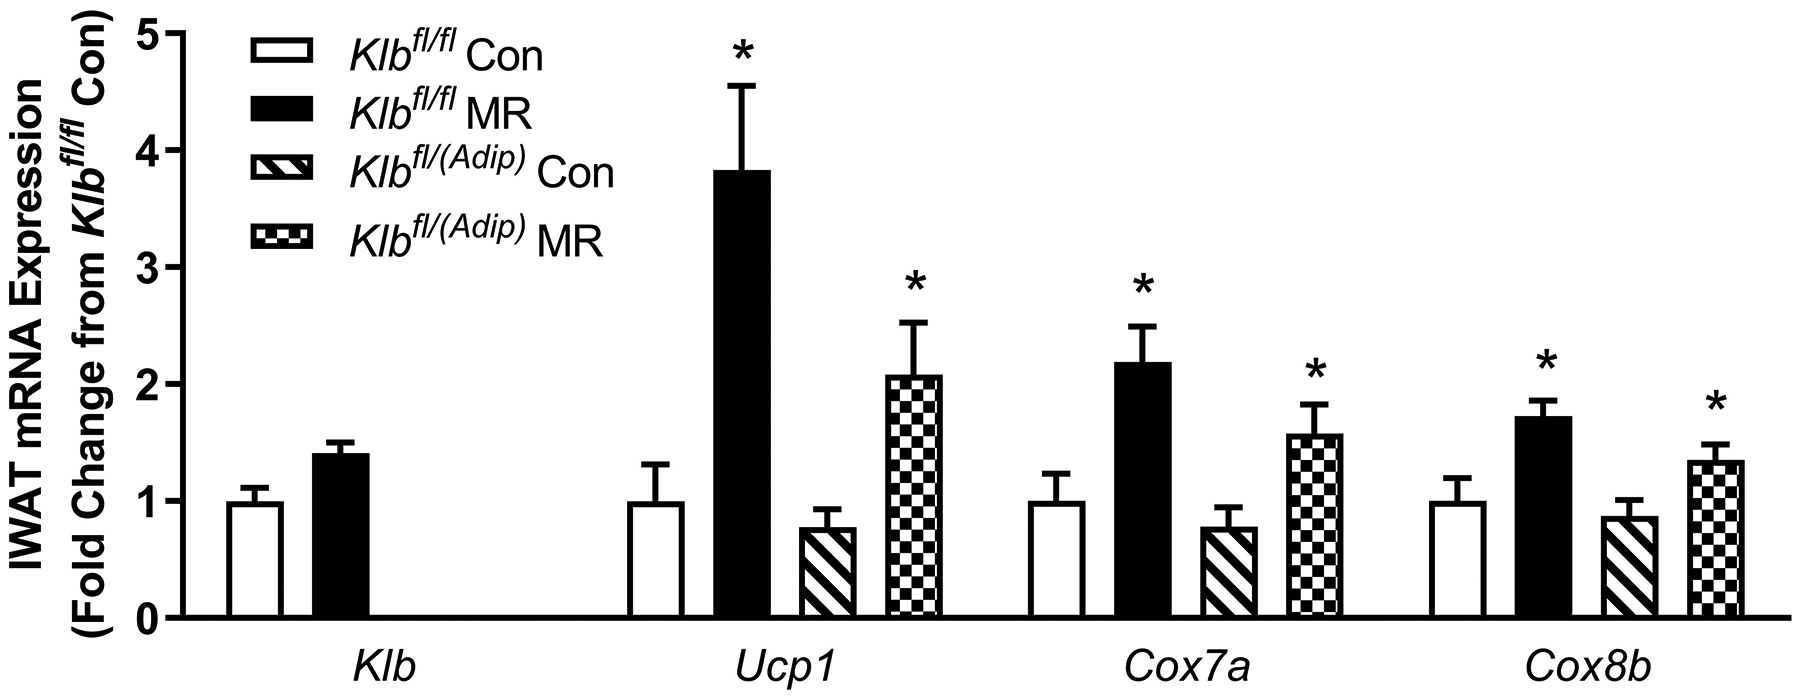
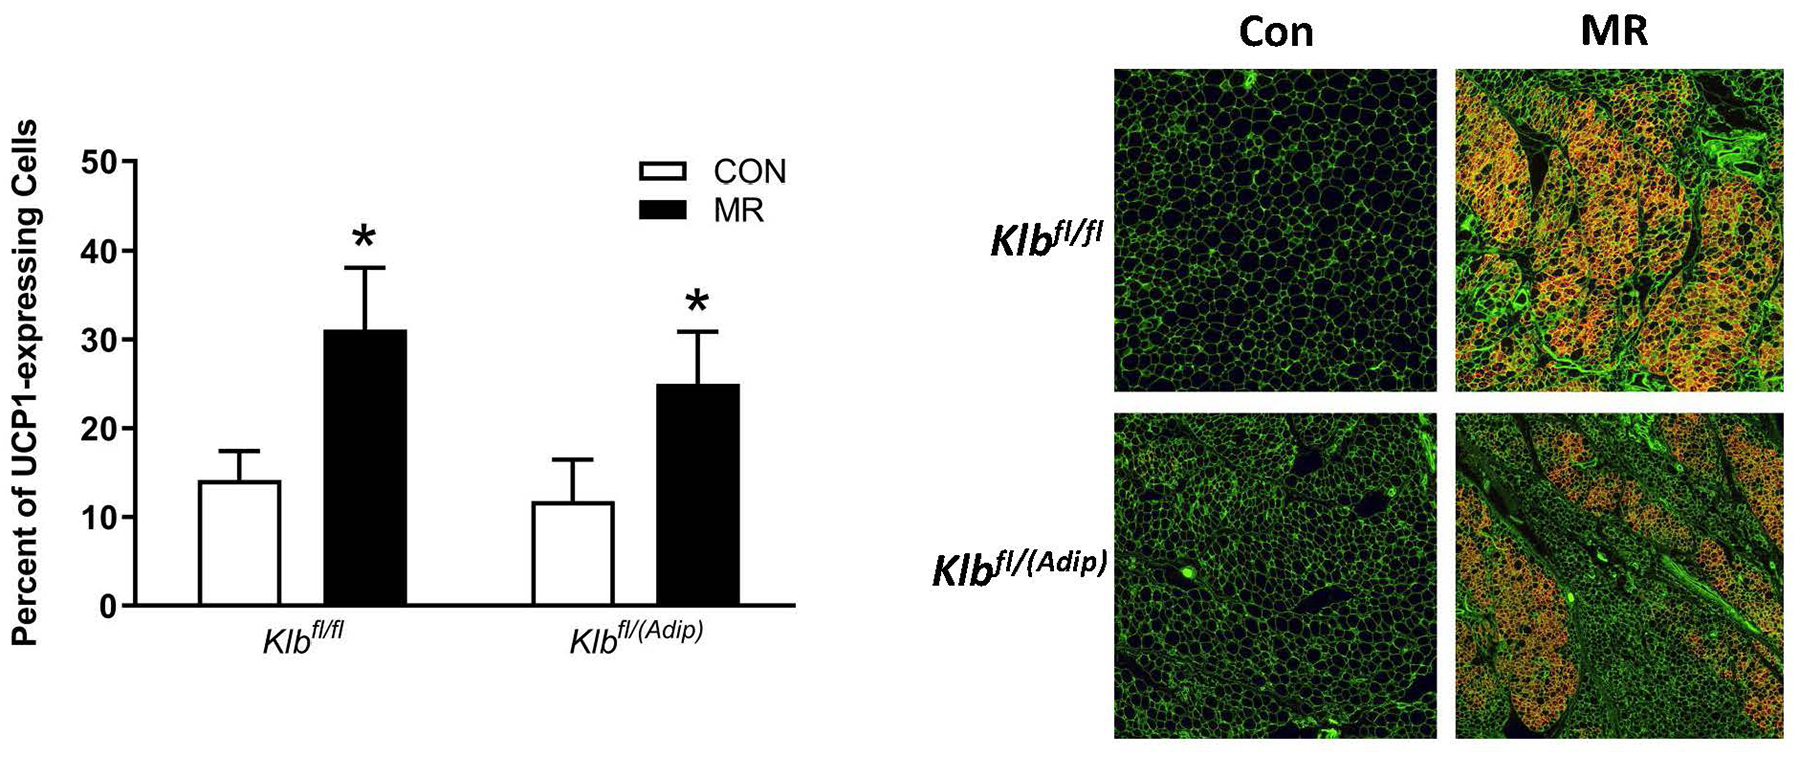
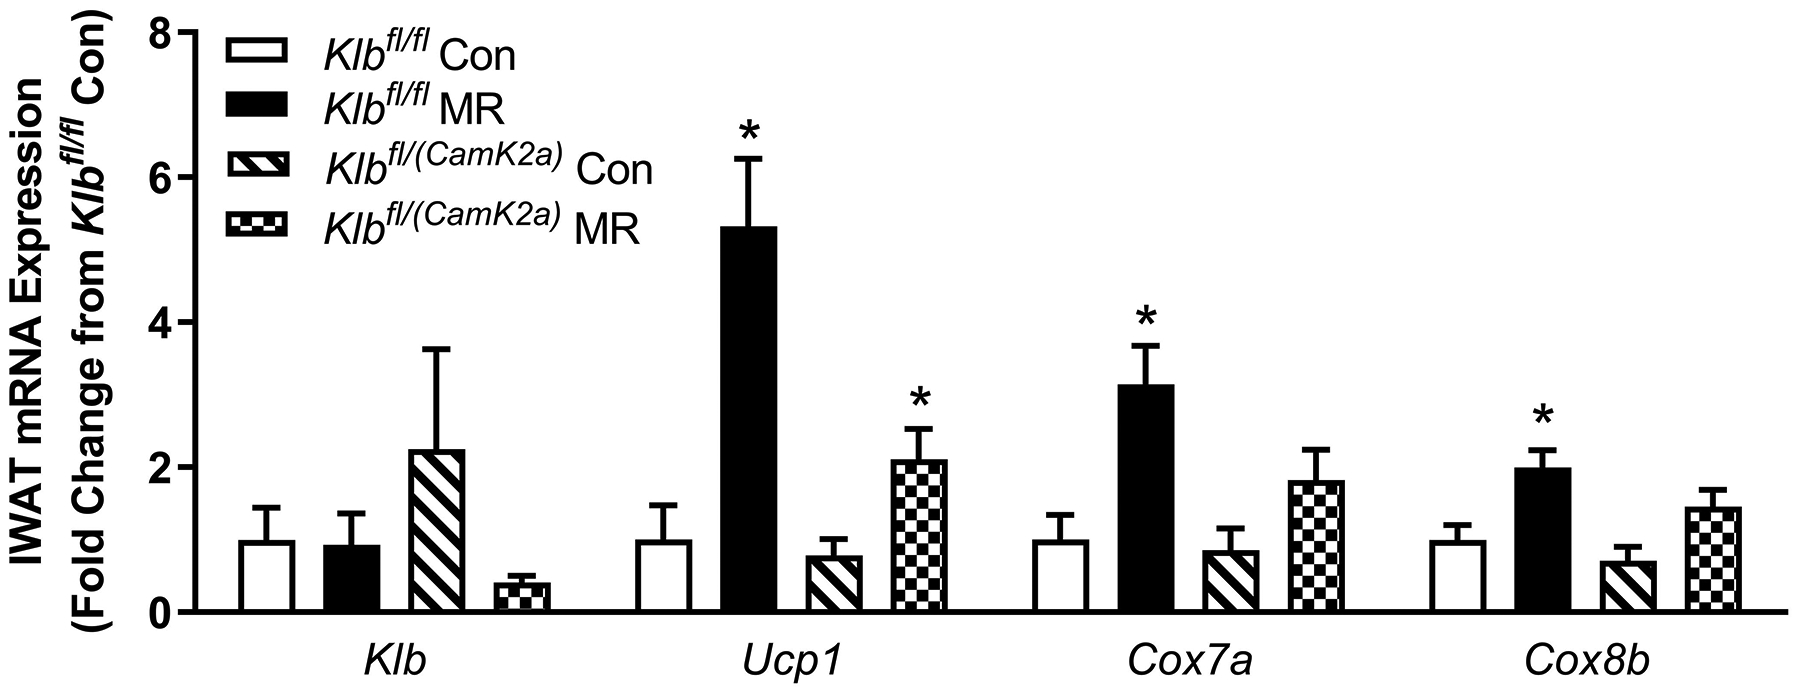
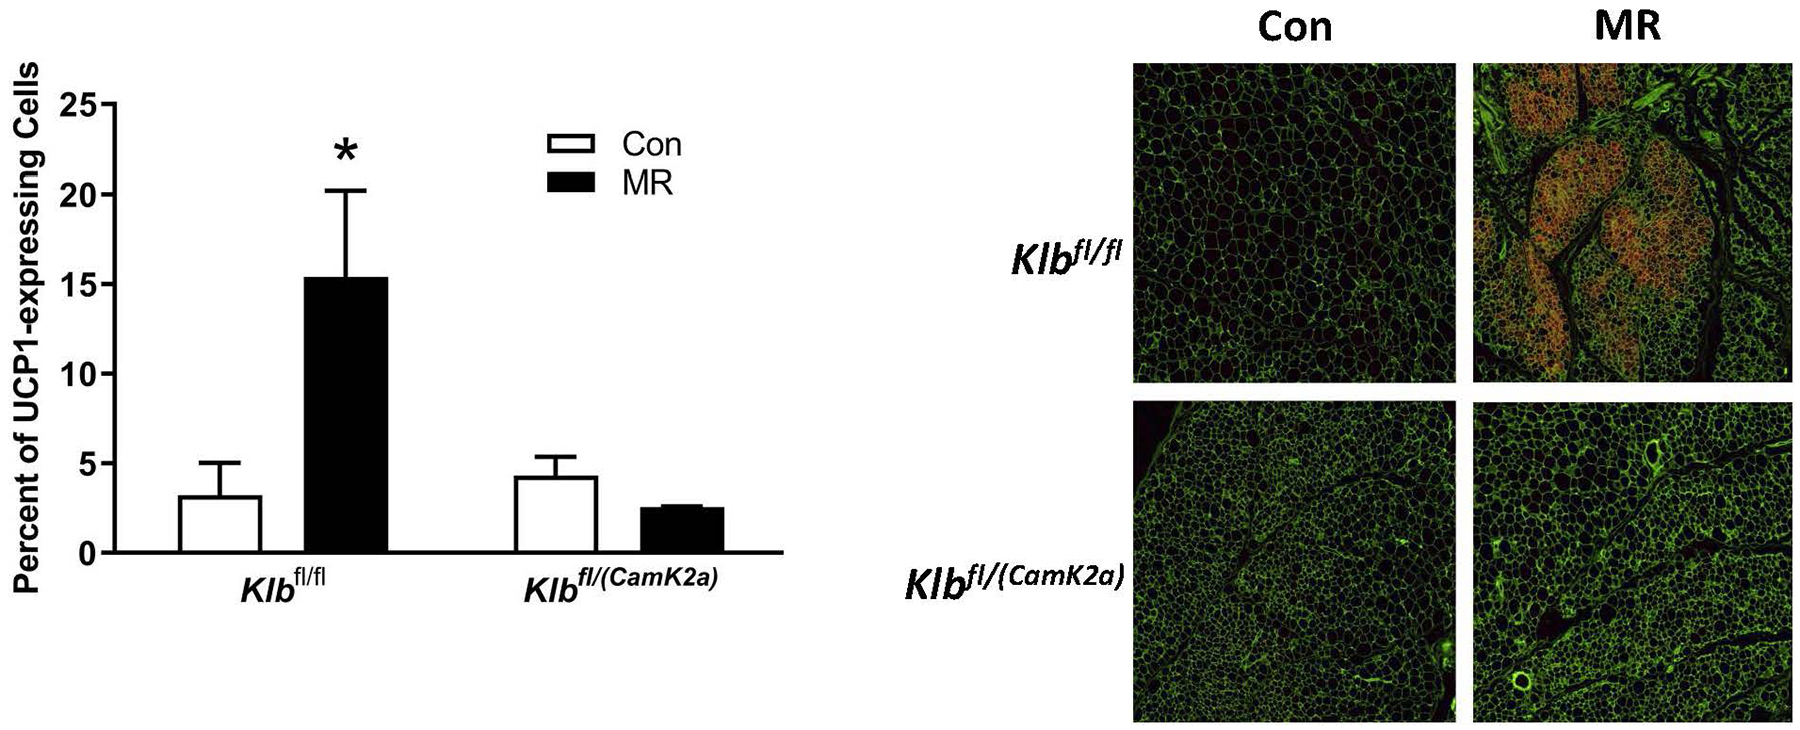
Effects of MR on thermogenic gene expression in IWAT were measured via qPCR and expressed as fold-change relative to Klbfl/fl mice on the Con diet in Experiment 1 (Fig. 2A) and Klbfl/fl mice on the Con diet in Experiment 2 (Fig. 2D). Con - control; MR - methionine restricted diets; Klb - β-klotho; Ucp1 - uncoupling protein 1; Cox7a - cytochrome C oxidase subunit 7A; Cox8b - cytochrome C oxidase subunit 8B. Means for fold-change of gene expression denoted with an asterisk (*) differ from their corresponding genotype on the Con diet at p < 0.05. Effect of dietary MR on morphology and UCP1 expression in IWAT sections from Klbfl/fl mice and adipocyte-specific Klb knockout mice (Klbfl/(Adip)) from Experiment 1 (Fig. 2B) and in IWAT sections from Klbfl/fl mice and brain-specific Klb knockout mice (Klbfl/(CamK2a)) from Experiment 2 (Fig. 2D). IWAT sections from each genotype × diet combination were stained for UCP1 (red) and wheat germ agglutinin (green) for cell membranes. The percentage of the total cells in each section expressing UCP1 was determined in replicate sections (n=4) from each genotype × diet combination using Visiopharm software Cell Prolifer Software as described in the Methods. The percentage of UCP1-expressing cells in each group is presented in the accompanying bar graphs of Figs. 2B and 2D. Diet-induced differences within each genotype are denoted with an asterisk (P<0.05).
Figure 4 -. Transcriptional responses to dietary MR in livers from Control mice (Klbfl/fl), mice with adipocyte-specific Klb knockout (Klbfl/(Adip)), or mice brain-specific Klb knockout (Klbfl/(CamK2a)).
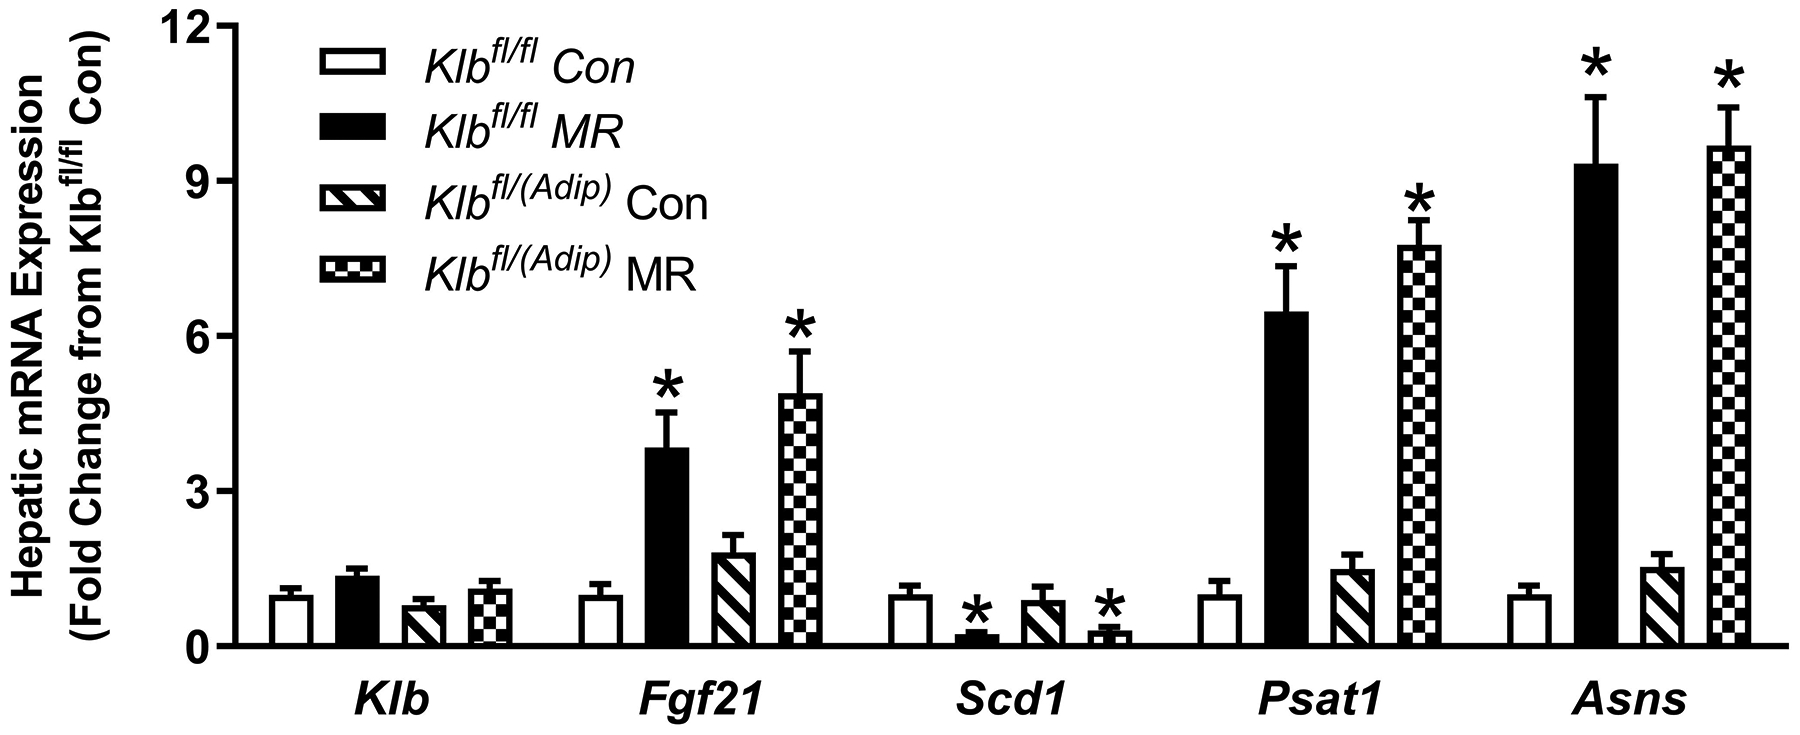
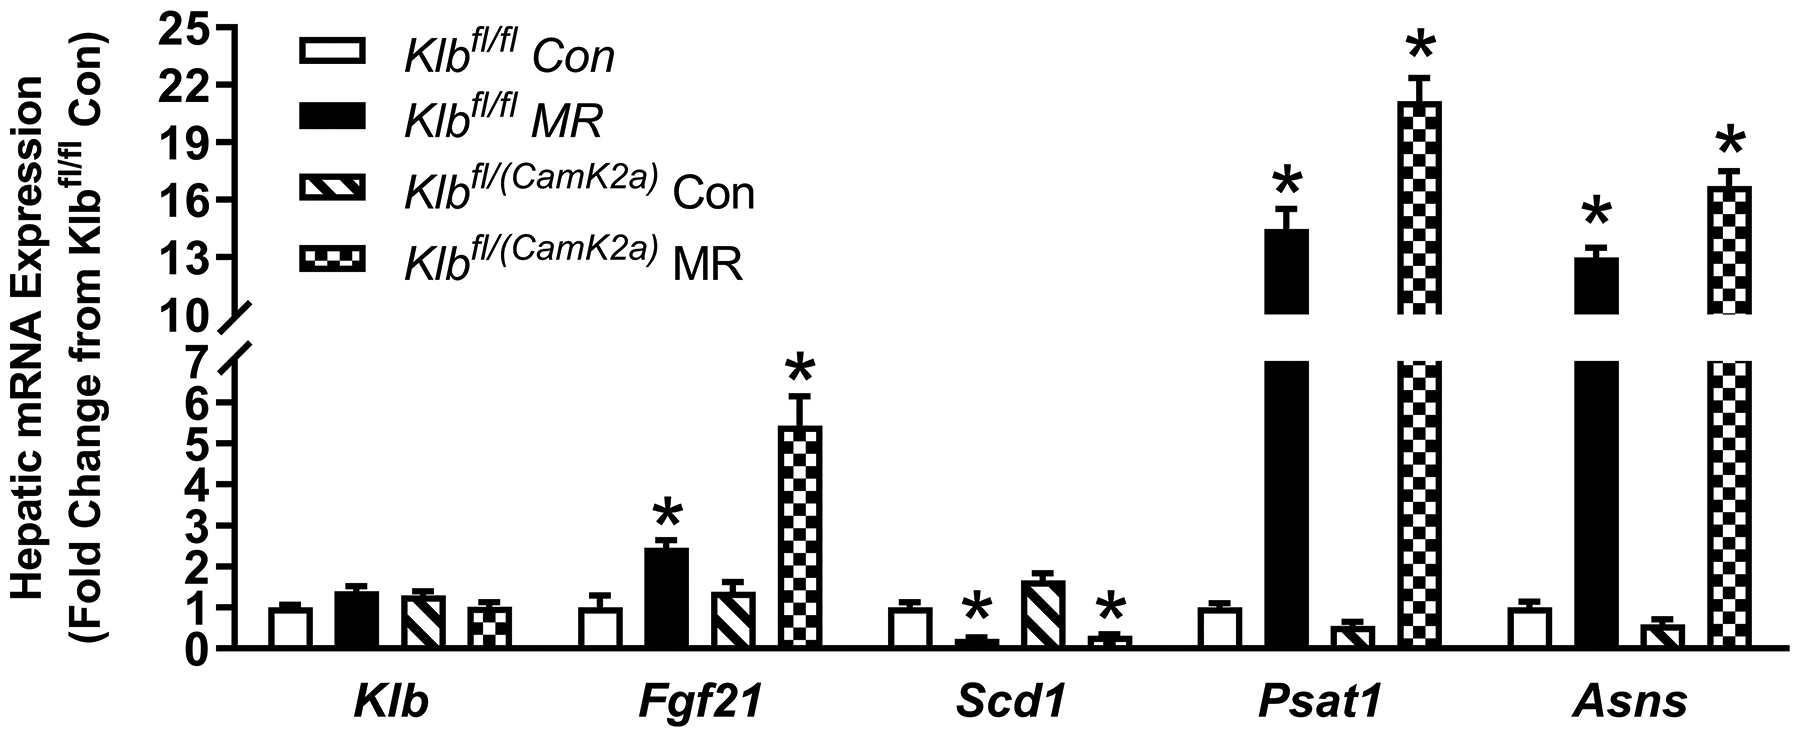
Hepatic gene expression was measured via qPCR in livers harvested from Klbfl/fl and Klbfl/(Adip) mice on Con and MR diets from Experiment 1 (Fig. 4A) and from Klbfl/fi and Klbfl/(CamK2a) mice on Con and MR diets from Experiment 2 (Fig. 4B). Klb - β-klotho; Fgf21 - fibroblast growth factor 21; Scd1 - stearoyl CoA desaturase 1; Psat1 - Phosphoserine Aminotransferase 1; Asns - asparagine synthaseWithin each experiment, gene expression was analyzed using a two way ANOVA with genotype and diet as main effects and residual variance used as the error term. All values are expressed as mean ± SEM for 8 mice of each genotype x sex. Means for fold-change of gene expression denoted with an asterisk (*) indicates significant difference from the Con within genotype at p < 0.05.
In liver, the MR diet reproduced its previously reported activation of Fgf21 gene expression, down regulation of Scd1 mRNA, and increase in activating transcription factor 4 (ATF4) target genes (9, 22) (Figure 4A). All four of these transcriptional effects of MR were comparable in liver of Klbfl/fl and Klbfl/(Adip) mice. Collectively, the absence of β-klotho from adipose tissue did not compromise the ability of dietary MR to produce its expected transcriptional effects in WAT or liver.
Experiment 2
The initial body weight and composition of control (Klbfl/fl) and brain-specific β-klotho knockout mice (Klbfl/(CamK2a)) did not differ, and both genotypes responded to dietary MR with a comparable decrease in body weight and adiposity over the duration of the study (Table 1). Energy intake per mouse was comparable between Klbfl/fl and Klbfl/CamK2a)mice on the Con diet, but MR produced opposite effects on energy intake in the two genotypes. MR increased intake in Klbfl/fl mice over the course of the study whereas energy intake in Klbfl/CamK2a) mice on the MR diet was unchanged or slightly decreased (Table 1). When energy intake is scaled to body weight, energy intake per gram body weight in Klbfl/CamK2a) mice on Con and MR diets is nearly identical, indicating that the loss of weight and adiposity in Klbfl/CamK2a) mice on the MR diet is explained primarily by their reduction in food intake (Table 1). In contrast, the response of control mice (Klbfl/fl) to MR was a large increase in energy intake per g body weight, indicative of weight loss driven by an increase in EE (Table 1). These predictions are supported by measurements of EE showing that MR significantly increased EE in Klbfl/fl mice, but had no effect on EE in Klbfl/(CamK2a) mice (Figure 1E). Interestingly, EE in Klbfl/(CamK2a) mice on the Con diet was lower than EE in Klbfl/fl mice on the Con diet (Figure 1E). Figure 1F shows that β-klotho mRNA levels were below the limits of detection in the Klbfl/(CamK2a) mice.
The absence of β-klotho in the brain did not compromise the ability of dietary MR to increase serum FGF21 in Klbfl/fl and Klbfl/(CamK2a) mice (Table 1). Although dietary MR produced reductions in adiposity in Klbfl/fl and Klbfl/(CamK2a) mice through opposite effects on energy intake and EE, the comparable MR-dependent reductions in adiposity in Klbfl/fl and Klbfl/(CamK2a) mice translated into comparable reductions in fasting insulin (Table 1).
Dietary MR produced a 5-fold induction of Ucp1 mRNA in IWAT of Klbfl/fl mice relative to the Con diet, and smaller but significant increases in Cox7a and Cox8b mRNA (Figure 2C). The MR diet increased Ucp1 mRNA by ~2-fold in IWAT of Klbfl/(CamK2a) mice, but the effect of the diet on Cox7a and Cox8b mRNA was not significant (Figure 2C). Evaluation of MR-dependent changes in IWAT UCP1 protein expression showed that the diet produced a 3-fold increase in the number of inguinal adipocytes expressing UCP1 in Klbfl/fl mice but did not increase UCP1 expressing adipocytes in Klbfl/CamK2a) mice (Figure 2D). In contrast to the effects in IWAT, dietary MR produced comparable induction of Fgf21 mRNA, Psat1 mRNA, and Asns mRNA in liver of Klbfl/fl and Klbfl/(CamK2a) mice, and a comparable reduction in Scd1 mRNA (Figure 4B). Collectively, these findings indicate that brain-specific deletion of β-klotho blocks the ability of dietary MR to increase EE and remodel IWAT, but not its ability to modulate hepatic gene expression.
Experiment 3
Klbfl/fl ,Klbfl/(Adip), Klbfl/fl and Klbfl/(CamK2a) mice were adapted to 28° C to lower temperature-dependent sympathetic activity before examining whether deletion of adipocyte-specific or brain-specific signaling by FGF21 would compromise the ability of MR to induce UCP1 protein expression in BAT. UCP1 expression was comparable in BAT from Klbfl/fl and Klbfl/(Adip) mice on the Con diet, and dietary MR produced a similar 2.2-fold induction of UCP1 in both genotypes (Figure 3A). Basal expression of UCP1 was also similar in BAT from Klbfl/fl and Klbfl/(CamK2a) mice on the Con diet, and dietary MR also produced a significant increase in BAT UCP1 in Klbfl/fl mice (Figure 3B). In contrast, dietary MR failed to increase UCP1 in BAT from Klbfl/(CamK2a) mice (Figure 3B), supporting the view that FGF21 signaling in the brain, but not adipose tissue, is essential for MR-dependent induction of UCP1.
Figure 3 -. Effect of dietary MR on UCP1 expression in BAT of Control mice (Klbfl/fl), mice with adipocyte-specific Klb knockout (Klbfl/(Adip), or mice brain-specific Klb knockout (Klbfl/(CamK2a)) housed at 28° C.
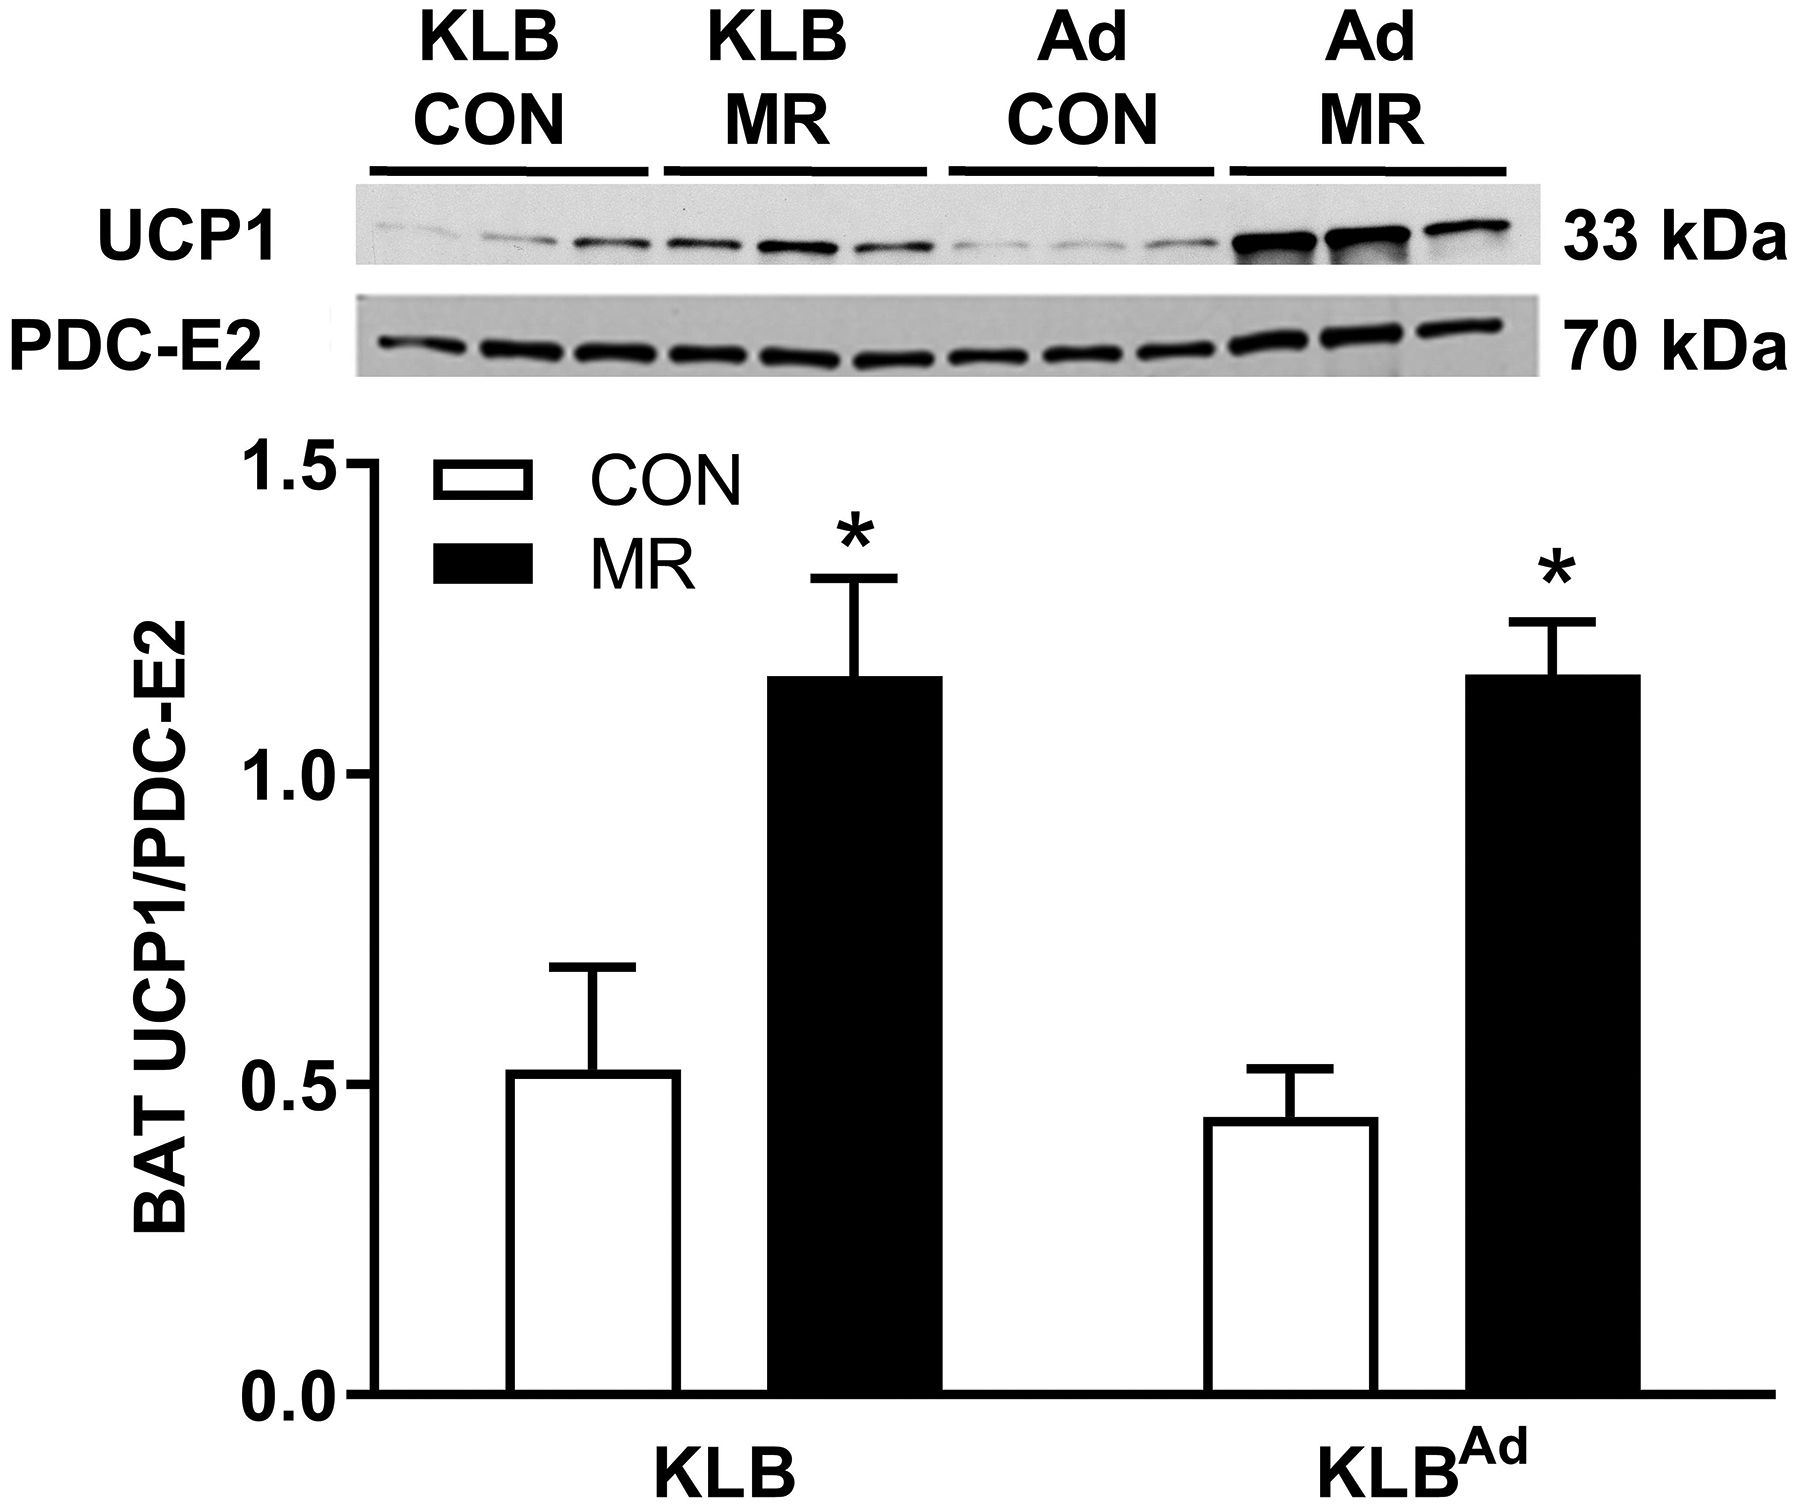
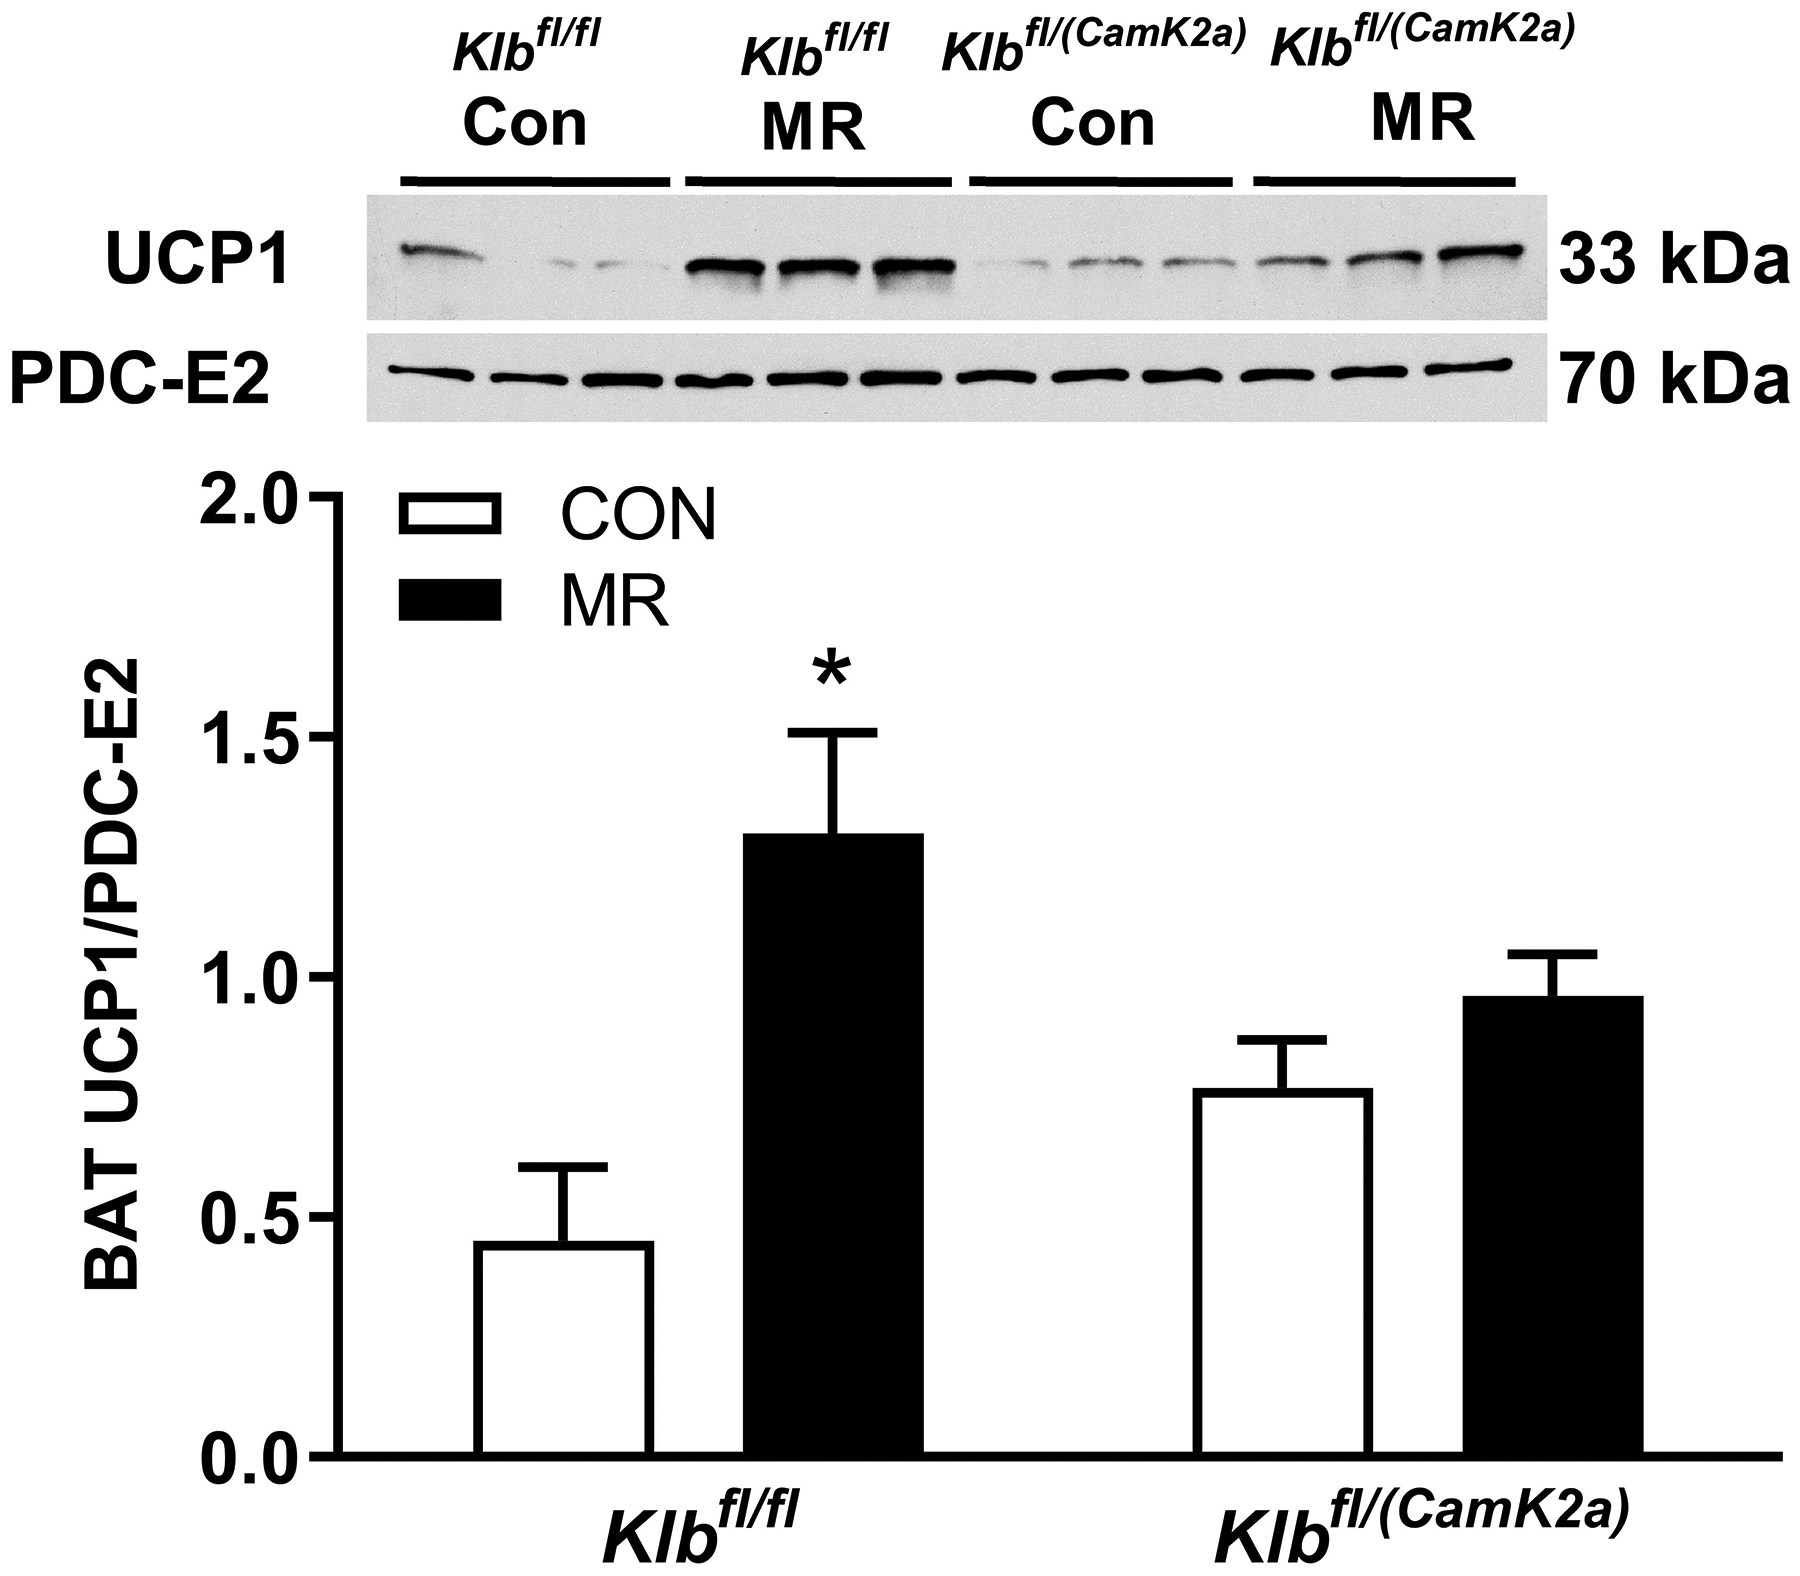
Klbfl/fl or Klbfl/(Adip) mice and Klbfl/fl or Klbfl/(CamK2a) mice were provided the Con diet and adapted to housing at 28° C for one week prior to being randomized to receive Con or MR diet for the following eight weeks. Thereafter, the mice were euthanized and UCP1 expression was measured by Western blot in BAT whole cell extracts from Klbfl/fl and Klbfl/(Adip) mice (Fig. 3A) and in Klbfl/fl or Klbfl/(CamK2a) mice (Fig. 3B) on the two diets. The mitochondrial marker, PDC-E2 (pyruvate dehydrogenase dihydrolipoamide acetyltransferase) was used as a loading control and UCP1 expression was determined in 5 to 6 replicates per group and expressed as the ratio of UCP1 to PDC-E2 as before (10). Figs. 3A and 3B show representative blots of samples from each experiment.
Discussion
Dietary MR produces a reproducible series of transcriptional, physiological, and behavioral responses that reduce fat deposition, enhance insulin sensitivity, reduce circulating lipids, and both prevent and reverse diet-induced obesity (2, 5–7, 23–28). Although FGF21 has been shown to play an essential role as a mediator in many of these biological responses to dietary MR (10), a major unresolved goal has been to understand the anatomical organization of FGF21 signaling in terms of how it produces the component responses of this complex metabolic phenotype. In initial reports, the biological responses to FGF21 were catalogued in studies where FGF21 was infused at high doses or increased via transgenic overexpression, so it was initially unclear whether the smaller but physiological increases in FGF21 produced by MR (5) would be sufficient to elicit all of the responses produced by pharmacological levels of the hormone (29). However, many if not most of the metabolic, transcriptional, and signaling effects produced by FGF21 are fully reproduced by dietary MR (2, 3, 5, 7, 24). For example, like MR, FGF21 directly increases adiponectin secretion from adipocytes (30), increases lipogenic gene expression in WAT (11), promotes browning of WAT (31), and increases thermogenic gene expression in BAT and WAT (31). Dietary MR also produces significant browning of WAT (2, 4, 7) and given the increased glucose uptake and utilization associated with browning (32), it is attractive to suggest that MR is functioning through this mechanism to increase insulin sensitivity in WAT. However, recent reports argue that the glycemic improvements produced by FGF21 in WAT are independent of browning (33, 34) and are dependent on direct effects of FGF21 in adipose tissue (5, 13, 20, 35). This view is also supported by studies showing that pegylated FGF21, which is too big to penetrate the CNS, is fully effective in normalizing glucose utilization in insulin resistant states (36). Collectively, these findings support the view that at least some of the effects of dietary MR are mediated by direct effects of FGF21 signaling in adipocytes.
FGF21 also acts centrally, and although the specific CNS regions where FGF21 is acting remain ill-defined, evidence is strong that FGF21 increases energy expenditure by increasing SNS outflow to adipose tissue (12, 16, 37, 38). We have shown that dietary MR increases core temperature, energy expenditure, and thermogenic function of BAT and WAT through increases in SNS stimulation of adipose tissue (1, 2). However, we have also shown that dietary MR produces increases in insulin sensitivity that are independent and additional to the enhanced insulin signaling that accrues from MR-induced weight loss and reduced adiposity (10). When undertaking the present work, our initial hypothesis was that the MR-induced increase in FGF21 acts through a combination of direct effects in adipose tissue and centrally to mediate the increase in SNS-dependent browning and thermogenesis. We were uncertain whether direct FGF21 signaling in adipose tissue synergized with SNS-dependent input to enhance browning and thermogenesis. Recent work supported this possibility by proposing that SNS-dependent increases in adipocyte expression of FGF21 produced a paracrine effect that enhanced browning of WAT and activation of thermogenesis in BAT (31, 38). The only evidence obtained to support this view was the small but significant induction of UCP1 mRNA expression by MR in IWAT of Klbfl/(CamK2a) mice (Fig. 2C). MR produced a large 20-fold induction of FGF21 in these mice so perhaps the hepatic hormone was able to act directly on inguinal adipose tissue and increase expression of this thermogenic gene. However, the other two thermogenic genes measured in these samples were unaffected. More importantly, immunohistochemical analysis of IWAT provided no evidence that MR was able to induce UCP1 expression in this tissue (Fig. 2D). Therefore, using genetic tools to alternatively delete FGF21 signaling in adipose tissue (e.g., Klbfl/(Adip)) and the CNS (e.g., Klbfl/(CamK2a)), we found little evidence that FGF21 signaling in adipose tissue played any significant role in MR-induced browning of adipose tissue or increases in EE. In contrast, deletion of FGF21 signaling in the brain fully blocked the ability of dietary MR to increase food intake, increase EE, and induce expression of UCP1 in BAT. These results mirror our previous findings in FGF21-null mice (10), including the slight negative effect on energy intake that produced the weight loss and decrease in adiposity observed in the Klbfl/(CamK2a) mice here. This similarity across two models argues against a non-specific effect of the diet being produced in any single mouse line.
An important unresolved question from the CamK2a-Cre model is exactly where in the brain FGF21 signaling is being deleted. The initial work showed that CamK2a-Cre targeted primarily glutamatergic neurons in the forebrain (16, 20, 21), and neurons within the hypothalamic suprachiasmatic nucleus or paraventricular nucleus (16, 39–41). The latter sites are most associated with known effects of FGF21-dependent signaling. It seems likely that FGF21 may signal in multiple brain areas through redundant systems to coordinate responses involving food intake and activation of the SNS. Much additional work will be needed to understand how FGF21 mediates the coordination of these important survival responses. However, the present work makes a compelling case that FGF21 signaling in the brain is essential in mediating the responses to dietary MR on energy balance.
Lastly, it is important to note that the ability of dietary MR to modulate hepatic gene expression was fully intact in mice with FGF21 signaling alternatively deleted in adipose tissue or the brain. This included FGF21 itself, the lipogenic gene, SCD1, and two ATF4-sensitive genes shown previously to be upregulated by dietary MR (7, 8). We previously found that the ability of dietary MR to downregulate lipogenic gene expression was fully intact in FGF21 null mice (10). These findings support the view that at least some of the transcriptional effects of dietary MR in the liver are independent of transcriptional activation of hepatic FGF21 and likely involve direct essential amino acid sensing and signaling mechanisms. Viewed collectively, the model that best explains the complex phenotype produced by dietary MR involves a combination of direct sensing of reduced dietary methionine by the liver and secondary effects of transcriptionally activated FGF21 acting primarily in the CNS.
Supplementary Material
Study Importance.
What is already known about this subject?
Restriction of dietary methionine to 0.17% reduces adiposity, enhances browning of white adipose tissue, increases energy expenditure, and improves insulin sensitivity by increasing hepatic transcription and release of hepatic FGF21.
The increased circulating FGF21 is thought to act both centrally and through direct effects in peripheral tissues to produce these integrated physiological responses.
Methionine restriction produces remodeling of white adipose tissue through a FGF21-dependent mechanism, but it is unclear where FGF21 acts to produce these effects.
What does your study add?
Tissue-specific deletion of the FGF21 co-receptor in adipose tissue does not abrogate the ability of dietary methionine restriction to increase energy expenditure and reduce fat deposition.
Tissue-specific deletion of the FGF21 co-receptor from the brain produced mice that were unable to respond to the effects of methionine restriction on energy expenditure and remodeling of adipose tissue.
The effects of methionine restriction on hepatic gene expression were intact in both models, supporting a mechanism that directly links detection of reduced methionine to transcriptional mechanisms in the liver.
Potential of work to change clinical practice
Given that a major goal of our work is to develop therapeutic diets that reduce obesity by reducing dietary methionine, it is important to establish the tissue-specific roles of endocrine mediators of dietary methionine restriction in pre-clinical studies.
Using cohorts of mice with the co-receptor of FGF21 deleted in either adipose tissue or the brain, we establish that the increase in FGF21 produced by dietary MR acts primarily in the brain to produce its physiological responses.
Acknowledgments
This work was supported BY NIH DK-096311 (TWG). This work also made use of the Genomics Core Facility supported by NIH P20-GM103528 (TWG) and NIH 2P30 DK072476. This research project used the Transgenic and Animal Phenotyping core facilities that are supported in part by the NORC (NIH 2P30 DK072476) and by an equipment grant (S10OD023703) from the NIH. LAF was supported by an ADA mentor-based postdoctoral fellowship award (ADA 7-13-MI-05).
Footnotes
Disclosure: The authors have no conflicts of interest to disclose.
Reference List
- 1.Plaisance EP, Henagan TM, Echlin H et al. Role of G-adrenergic receptors in the hyperphagic and hypermetabolic responses to dietary methionine restriction. Am J Physiol Regul Integr Comp Physiol 2010;299:R740–R750. [DOI] [PMC free article] [PubMed] [Google Scholar]
- 2.Hasek BE, Stewart LK, Henagan TM et al. Dietary methionine restriction enhances metabolic flexibility and increases uncoupled respiration in both fed and fasted states. Am J Physiol Regul Integr Comp Physiol 2010;299:R728–R739. [DOI] [PMC free article] [PubMed] [Google Scholar]
- 3.Wanders D, Burk DH, Cortez CC et al. UCP1 is an essential mediator of the effects of methionine restriction on energy balance but not insulin sensitivity. FASEB J 2015;29(June 2015):2603–15. [DOI] [PMC free article] [PubMed] [Google Scholar]
- 4.Patil Y, Dille KN, Burk DH, Cortez CC, Gettys TW. Cellular and molecular remodeling of inguinal adipose tissue mitochondria by dietary methionine restriction. J Nutr Biochem 2015;26:1235–47. [DOI] [PMC free article] [PubMed] [Google Scholar]
- 5.Stone KP, Wanders D, Orgeron M, Cortez CC, Gettys TW. Mechanisms of increased in vivo insulin sensitivity by dietary methionine restriction in mice. Diabetes 2014;63:3721–33. [DOI] [PMC free article] [PubMed] [Google Scholar]
- 6.Malloy VL, Krajcik RA, Bailey SJ, Hristopoulos G, Plummer JD, Orentreich N. Methionine restriction decreases visceral fat mass and preserves insulin action in aging male Fischer 344 rats independent of energy restriction. Aging Cell 2006;5(4):305–14. [DOI] [PubMed] [Google Scholar]
- 7.Hasek BE, Boudreau A, Shin J et al. Remodeling the integration of lipid metabolism between liver and adipose tissue by dietary methionine restriction in rats. Diabetes 2013;62:3362–72. [DOI] [PMC free article] [PubMed] [Google Scholar]
- 8.Ghosh S, Forney LA, Wanders D, Stone KP, Gettys TW. An integrative analysis of tissue-specific transcriptomic and metabolomic responses to short-term dietary methionine restriction in mice. PLoS ONE 2017;12(5):e0177513. [DOI] [PMC free article] [PubMed] [Google Scholar]
- 9.Wanders D, Stone KP, Forney LA et al. Role of GCN2-independent signaling through a non-canonical PERK/NRF2 pathway in the physiological responses to dietary methionine restriction. Diabetes 2016;65(6):1499–510. [DOI] [PMC free article] [PubMed] [Google Scholar]
- 10.Wanders D, Forney LA, Stone KP, Burk DH, Pierse A, Gettys TW. FGF21 Mediates the Thermogenic and Insulin-Sensitizing Effects of Dietary Methionine Restriction but not its Effects on Hepatic Lipid Metabolism. Diabetes 2017;66:858–67. [DOI] [PMC free article] [PubMed] [Google Scholar]
- 11.Coskun T, Bina HA, Schneider MA et al. Fibroblast growth factor 21 corrects obesity in mice. Endocrinology 2008;149(12):6018–27. [DOI] [PubMed] [Google Scholar]
- 12.Holland WL, Adams AC, Brozinick JT et al. An FGF21-Adiponectin-Ceramide Axis Controls Energy Expenditure and Insulin Action in Mice. Cell Metab 2013;(17):790–7. [DOI] [PMC free article] [PubMed] [Google Scholar]
- 13.Kharitonenkov A, Shiyanova TL, Koester A et al. FGF-21 as a novel metabolic regulator. J Clin Invest 2005;115(6):1627–35. [DOI] [PMC free article] [PubMed] [Google Scholar]
- 14.Adams AC, Coskun T, Rovira AR et al. Fundamentals of FGF19 & FGF21 action in vitro and in vivo. PLoS ONE 2012;7(5):e38438. [DOI] [PMC free article] [PubMed] [Google Scholar]
- 15.Xu J, Stanislaus S, Chinookoswong N et al. Acute glucose-lowering and insulin-sensitizing action of FGF21 in insulin-resistant mouse models--association with liver and adipose tissue effects. Am J Physiol Endocrinol Metab 2009;297(5):E1105–E1114. [DOI] [PubMed] [Google Scholar]
- 16.Bookout AL, de Groot MH, Owen BM et al. FGF21 regulates metabolism and circadian behavior by acting on the nervous system. Nat Med 2013;19(9):1147–52. [DOI] [PMC free article] [PubMed] [Google Scholar]
- 17.Xu J, Lloyd DJ, Hale C et al. Fibroblast growth factor 21 reverses hepatic steatosis, increases energy expenditure, and improves insulin sensitivity in diet-induced obese mice. Diabetes 2009;58(1):250–9. [DOI] [PMC free article] [PubMed] [Google Scholar]
- 18.Forney LA, Wanders D, Stone KP, Pierse A, Gettys TW. Concentration-dependent linkage of dietary methionine restriction to the components of its metabolic phenotype. Obesity (Silver Spring) 2017;25:730–8. [DOI] [PMC free article] [PubMed] [Google Scholar]
- 19.Wanders D, Forney LA, Stone KP, Hasek BE, johnson WD, Gettys TW. The Components of Age-Dependent Effects of Dietary Methionine Restriction on Energy Balance in Rats. Obesity (Silver Spring) 2018;26(4):740–6. [DOI] [PMC free article] [PubMed] [Google Scholar]
- 20.Ding X, Boney-Montoya J, Owen BM et al. betaKlotho is required for fibroblast growth factor 21 effects on growth and metabolism. Cell Metab 2012;16(3):387–93. [DOI] [PMC free article] [PubMed] [Google Scholar]
- 21.Casanova E, Fehsenfeld S, Mantamadiotis T et al. A CamKIIalpha iCre BAC allows brain-specific gene inactivation. Genesis 2001;31(1):37–42. [DOI] [PubMed] [Google Scholar]
- 22.Stone KP, Wanders D., Calderon LF, Spurgin SB, Scherer PE, Gettys TW. Compromised responses to dietary methionine restriction in adipose tissue but not liver of ob/ob mice. Obesity (Silver Spring) 2015;23(9):1836–44. [DOI] [PMC free article] [PubMed] [Google Scholar]
- 23.Lees EK, Krol E, Grant L et al. Methionine restriction restores a younger metabolic phenotype in adult mice with alterations in fibroblast growth factor 21. Aging Cell 2014;13(5):817–27. [DOI] [PMC free article] [PubMed] [Google Scholar]
- 24.Ghosh S, Wanders D, Stone KP, Van NT, Cortez CC, Gettys TW. A systems biology analysis of the unique and overlapping transcriptional responses to caloric restriction and dietary methionine restriction in rats. FASEBJ 2014;28:2577–90. [DOI] [PMC free article] [PubMed] [Google Scholar]
- 25.Wanders D, Ghosh S, Stone K., Van NT, Gettys TW. Transcriptional impact of dietary methionine restriction on systemic inflammation: Relevance to biomarkers of metabolic disease during aging. Biofactors 2013;40:13–26. [DOI] [PMC free article] [PubMed] [Google Scholar]
- 26.Ables GP, Perrone CE, Orentreich D, Orentreich N. Methionine-restricted C57BL/6J mice are resistant to diet-induced obesity and insulin resistance but have low bone density. PLoS ONE 2012;7(12):e51357. [DOI] [PMC free article] [PubMed] [Google Scholar]
- 27.Perrone CE, Mattocks DA, Plummer JD et al. Genomic and Metabolic Responses to Methionine-Restricted and Methionine-Restricted, Cysteine-Supplemented Diets in Fischer 344 Rat Inguinal Adipose Tissue, Liver and Quadriceps Muscle. J Nutrigenet Nutrigenomics 2012;5(3):132–57. [DOI] [PubMed] [Google Scholar]
- 28.Perrone CE, Mattocks DA, Jarvis-Morar M, Plummer JD, Orentreich N. Methionine restriction effects on mitochondrial biogenesis and aerobic capacity in white adipose tissue, liver, and skeletal muscle of F344 rats. Metabolism 2009;59:1000–11. [DOI] [PubMed] [Google Scholar]
- 29.Angelin B, Larsson TE, Rudling M. Circulating fibroblast growth factors as metabolic regulators--a critical appraisal. Cell Metab 2012;16(6):693–705. [DOI] [PubMed] [Google Scholar]
- 30.Lin Z, Tian H, Lam KS et al. Adiponectin mediates the metabolic effects of FGF21 on glucose homeostasis and insulin sensitivity in mice. Cell Metab 2013;17(5):779–89. [DOI] [PubMed] [Google Scholar]
- 31.Fisher FM, Kleiner S, Douris N et al. FGF21 regulates PGC-1alpha and browning of white adipose tissues in adaptive thermogenesis. Genes Dev 2012;26(3):271–81. [DOI] [PMC free article] [PubMed] [Google Scholar]
- 32.Emanuelli B, Vienberg SG, Smyth G et al. Interplay between FGF21 and insulin action in the liver regulates metabolism. J Clin Invest 2014;124(2):515–27. [DOI] [PMC free article] [PubMed] [Google Scholar]
- 33.Veniant MM, Sivits G, Helmering J et al. Pharmacologic Effects of FGF21 Are Independent of the “Browning” of White Adipose Tissue. Cell Metab 2015;21(5):731–8. [DOI] [PubMed] [Google Scholar]
- 34.Samms RJ, Smith DP, Cheng CC et al. Discrete Aspects of FGF21 In Vivo Pharmacology Do Not Require UCP1. Cell Rep 2015;11(7):991–9. [DOI] [PubMed] [Google Scholar]
- 35.Adams AC, Yang C, Coskun T et al. The breadth of FGF21’s metabolic actions are governed by FGFR1 in adipose tissue. Mol Metab 2012;2(1):31–7. [DOI] [PMC free article] [PubMed] [Google Scholar]
- 36.Camacho RC, Zafian PT, Achanfuo-Yeboah J, Manibusan A, Berger JP. Pegylated Fgf21 rapidly normalizes insulin-stimulated glucose utilization in diet-induced insulin resistant mice. Eur J Pharmacol 2013;715(1–3):41–5. [DOI] [PubMed] [Google Scholar]
- 37.Owen BM, Ding X, Morgan DA et al. FGF21 Acts Centrally to Induce Sympathetic Nerve Activity, Energy Expenditure, and Weight Loss. Cell Metab 2014;20:670–7. [DOI] [PMC free article] [PubMed] [Google Scholar]
- 38.Douris N, Stevanovic D, Fisher FM et al. Central Fibroblast Growth Factor 21 Browns White Fat via Sympathetic Action in Male Mice. Endocrinology 2015;156:2470–81. [DOI] [PMC free article] [PubMed] [Google Scholar]
- 39.Liang Q, Zhong L, Zhang J et al. FGF21 maintains glucose homeostasis by mediating the cross talk between liver and brain during prolonged fasting. Diabetes 2014;63(12):4064–75. [DOI] [PubMed] [Google Scholar]
- 40.Owen BM, Bookout AL, Ding X et al. FGF21 contributes to neuroendocrine control of female reproduction. Nat Med 2013;19(9):1153–6. [DOI] [PMC free article] [PubMed] [Google Scholar]
- 41.Matsui S, Sasaki T, Kohno D et al. Neuronal SIRT1 regulates macronutrient-based diet selection through FGF21 and oxytocin signalling in mice. Nat Commun 2018;9(1):4604–07033. [DOI] [PMC free article] [PubMed] [Google Scholar]
Associated Data
This section collects any data citations, data availability statements, or supplementary materials included in this article.


