Abstract
Background
The anti-inflammatory drug sulfasalazine (SAS) has been confirmed to inhibit the growth of triple-negative breast cancer (TNBC), but the mechanism is not clear. The aim of this study was to use network pharmacology to find relevant pathways of SAS in TNBC patients.
Material/Methods
Through screening of the GeneCards, CTD, and ParmMapper databases, potential genes related to SAS and TNBC were identified. In addition, gene ontology and Kyoto Encyclopedia of Genes and Genomes analyses were performed using the R programming language. Protein–protein interaction networks were constructed using Cytoscape. The Kaplan-Meier plotter screened genes related to TNBC prognosis. TNBC patient gene expression profiles and clinical data were downloaded from The Cancer Genome Atlas database. A heatmap was generated using the R programming language that presents the expression of potential target genes in patients with TNBC.
Results
Eighty potential target genes were identified through multiple databases. The bioinformatical analyses predicted the interrelationships, potential pathways, and molecular functions of the genes from multiple aspects, which are associated with physiological processes such as the inflammatory response, metabolism of reactive oxygen species (ROS), and regulation of proteins in the matrix metalloproteinase (MMP) family. Survival analysis showed that 12 genes were correlated with TNBC prognosis. Heatmapping showed that genes such as those encoding members of the MMP family were differentially expressed in TNBC tissues and normal tissues.
Conclusions
Our analysis revealed that the main reasons for the inhibitory effect of SAS on TNBC cells may be inhibition of the inflammatory response and MMP family members and activation of ROS.
MeSH Keywords: Gene Regulatory Networks, Inflammation, Matrix Metalloproteinases, Reactive Oxygen Species, Sulfasalazine, Triple Negative Breast Neoplasms
Background
In 2020, among the top 10 major cancer types represented by new cancer cases and the number of estimated deaths according to gender, breast cancer (BC) will rank first as the cause of new cases of tumors in females, and as a cause of death, it will rank second [1]. BC is the most common type of malignant tumor in females and includes numerous subtypes with high heterogeneity [2]. Approximately one-fourth of breast tumors are “triple-negative” (ER− [estrone receptor]/PR− [progesterone receptor]/HER2− [HER2 receptor tyrosine kinase]) breast cancer (TNBC) and usually have a basal molecular phenotype [3]. Due to chemotherapy resistance and the lack of TNBC-targeted therapeutics, patient prognosis is grim [4]. Meanwhile, an increasing number of drugs not used to treated tumors have been shown to have critical antitumor effects. For example, aspirin can inhibit metastasis of colon cancer cells [5] and metformin can control the oxidative phosphorylation rate and growth of thyroid cancer in vivo and in vitro [6]. There is a critical need to explore more anti-resistance mechanisms and the anticancer effects of some non-cancer drugs in the field of TNBC. In our previous research, we found that the anti-inflammatory drug SAS could inhibit growth of BC cells, and TNBC cells show particularly sensitivity to SAS. The main mechanism underlying the effect of SAS is production of a large number of reactive oxygen species (ROS), inducing ferroptosis [7]. However, the study also found that in addition to the ferroptosis pathway, there may be other mechanisms that can induce the death of TNBC cells, such as autophagy and apoptosis. To investigate this further, we decided to reexamine the specific reasons why SAS inhibits proliferation of TNBC cells by using a network pharmacological method.
In 2007, Hopkins at the University of Dundee in the United Kingdom proposed the term “network pharmacology” [8] and then described network pharmacology as a “next-generation drug development model” [9]. Network pharmacology is based on the “disease gene-target drug” interaction network. It systematically and comprehensively observes the influence of drugs on the disease network, thereby revealing the underlying mechanisms of drugs that act on humans. Because of the development of network pharmacology, we have a better understanding of the pharmacological effects of many natural medicines and some traditional Chinese medicines [10,11]. Through network pharmacology, some traditional Chinese medicines also have been discovered for treatment of BC [12]. However, there have been few reports about use of network pharmacology for TNBC and the role of the SAS drug network.
Our previous studies confirmed that SAS leads to a more sensitive growth-inhibiting phenotype in TNBC cells [7]. Moreover, the possibility of multipurpose mechanism pathways was also discovered. Therefore, screening of multiple databases through the new method of network pharmacology is helpful to find new mechanisms underlying the phenotype.
In our research, we used different databases to mine some genes related to SAS and TNBC. A drug network with these genes was constructed and analyzed. New potential targets and pathways involved in the effects of SAS on TNBC were discovered. Some specific genes play important roles in the phenotype. Our research mainly demonstrated the effects of SAS on three major types of genes. The first type inhibits expression of inflammation-related genes to reduce the effect of inflammation on TNBC. Inhibition of the matrix metalloproteinase (MMP) family and increased accumulation of ROS are the main causes of inhibition of growth and proliferation of TNBC. Such findings help us to further study the mechanism of the effects of SAS on TNBC and focus on developing more precise treatment options. This is also a model for exploring the anticancer effects of non-tumor drugs. A schematic diagram showing the analysis procedures used for SAS target gene prediction is shown in Figure 1.
Figure 1.
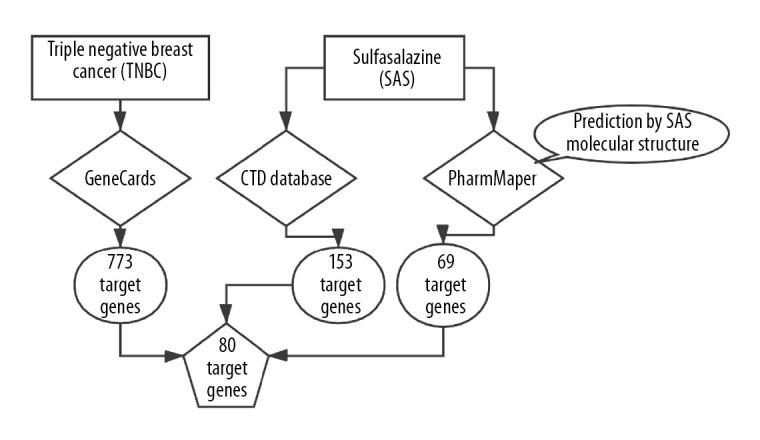
Flowchart of screening of 80 genes.
Material and Methods
Data acquisition and database application
The molecular structure of SAS was obtained from PubChem (https://pubchem.ncbi.nlm.nih.gov/). The GeneCards (https://www.genecards.org/) knowledgebase automatically integrates gene-centric data from approximately 150 web sources, including genomic, transcriptomic, proteomic, genetic, clinical, and functional information. Information on a total of 3 885 TNBC-related genes was retrieved from the GeneCards database using “triple-negative breast cancer” as key words. According to a GeneCards Inferred Functionality Score (GIFtS) greater than 20, we selected the top 19.9% of genes, which comprised a total of 773 genes. The GIFtS algorithm uses the wealth of information in GeneCards annotations to produce scores aimed at predicting the degree of functionality of a gene. The PharmMapper (http://www.lilab-ecust.cn/pharmmapper/) server is a freely accessible web server designed to identify potential target candidates for the given small molecules (drugs, natural products, or other newly discovered compounds with unidentified binding targets) using a pharmacophore mapping approach [13]. The PharmMapper database was used for molecular structural analysis to screen 69 genes related to SAS. The Comparative Toxicogenomics Database (CTD, http://ctdbase.org/) is a robust, publicly available database with toxicogenomic information. It provides manually curated key information about chemical gene/protein interactions and chemical-disease and gene-disease relationships derived from peer-reviewed scientific literature [14]. The database was used to rescreen data for 153 genes related to SAS. Data for patients with TNBC was obtained from The Cancer Genome Atlas (TCGA) database (https://www.cancer.gov/). After analysis, 80 potential targets related to both TNBC and SAS were identified.
Gene function and pathway enrichment analysis
Functional enrichment analyses of 80 potential target genes were performed by the R programming language packages “clusterProfiler,” “org.Hs.eg.db,” “enrichplot,” and “ggplot2.” The gene ontology (GO) categories consisted of biological processes (BPs) and molecular functions (MFs). KEGG (Kyoto Encyclopedia of Genes and Genomes) enrichment analysis was performed to determine the pathways significantly associated with 80 potential target genes. GO analysis is a commonly used approach for annotating genes and gene products according to molecular functions, biological pathways, and cellular components [15]. KEGG is a useful resource for systematic analysis of gene functions and related high-level genome functional information[16].
PPI (protein–protein interaction) network construction and module analysis
The STRING database version 11.0 (http://string-db.org/) aims to collect and integrate interactions between proteins, including direct (physical) interactions and indirect (functional) interactions [17], and a combined score >0.95 was set as the cut-off criterion. Then, we used Cytoscape version 3.6.0 [18] to visualize the biomolecular interaction networks of the potential genes. Molecular Complex Detection (MCODE), a plug-in used to produce the best results for calculating correlation levels, was subsequently used to identify the clusters in the network.
Analysis of potential target gene expression in TNBC
To analyze the expression of 80 potential target genes in TNBC, we downloaded data regarding expression of genes in 220 TNBC samples from the TCGA database. The “heatmap” package in the R programming language was used for analysis, and the expression heatmap was generated.
Survival analysis of potential target genes
The Kaplan-Meier plotter (https://kmplot.com/analysis/) is capable of assessing the effect of 54k genes on survival in 21 cancer types. The system includes gene chip and RNA-seq data, and the sources for the databases include Gene Expression Omnibus (GEO), The European Genome-Phenome Archive (EGA), and TCGA [19]. In this system, we set the status of ER, PR and HER2 to negative and identified a total of 255 patients with TNBC. Relapse-free survival (RFS) in patients with TNBC was assessed by Kaplan–Meier plots and the log rank P value; log rank P<0.05 was set as the cut-off criterion.
All statistical tests were performed with R version 3.5. P<0.05 was considered to indicate a statistically significant difference.
Results
Screening and identification of TNBC- and SAS-related genes
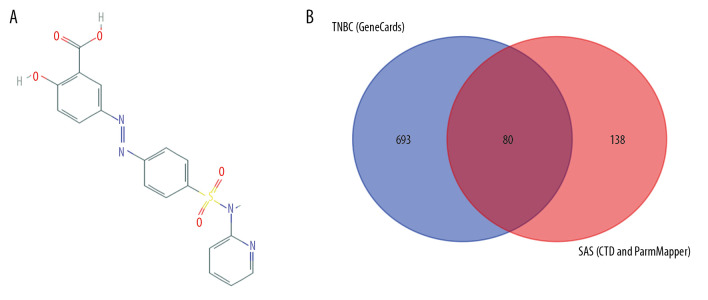
The molecular structure of SAS was obtained from the PubChem database (Figure 2A). Information a total of 773 TNBC-related genes was retrieved from the GeneCards database. PharmMapper was applied to identify 69 SAS-related genes through pharmacophores. Information on genes related to SAS was sorted from the CTD database a second time, and 153 potential target genes were identified. We first summarized the data for SAS-related target genes in the PharmMapper database and the CTD database, and these data were further intersected with the TNBC-related target genes selected by GeneCards (Figure 2B). Finally, 80 target genes related to SAS and TNBC were identified (Table 1).
Figure 2.
(A) Chemical structure of sulfasalazine that was downloaded from the PubChem database. (B) Identification of potential target genes associated with both SAS and TNBC.
Table 1.
80 target genes related to SAS and TNBC.
| Num. | Gene symbol | Description | Ensembl ID |
|---|---|---|---|
| 1 | MMP2 | Matrix metallopeptidase 2 | ENSG00000087245.12 |
| 2 | ANXA2 | Annexin A2 | ENSG00000182718.16 |
| 3 | NR3C2 | Nuclear receptor subfamily 3, group C, member 2 | ENSG00000151623.14 |
| 4 | ABCG2 | ATP-binding cassette, sub-family G (WHITE), member 2 (Junior blood group) | ENSG00000118777.10 |
| 5 | ANXA1 | Annexin A1 | ENSG00000135046.13 |
| 6 | NOS2 | Nitric oxide synthase 2, inducible | ENSG00000007171.16 |
| 7 | MMP13 | Matrix metallopeptidase 13 | ENSG00000137745.11 |
| 8 | MMP3 | Matrix metallopeptidase 3 | ENSG00000149968.11 |
| 9 | IL2RA | Interleukin 2 receptor, alpha | ENSG00000134460.15 |
| 10 | IL10 | Interleukin 10 | ENSG00000136634.5 |
| 11 | TIMP3 | TIMP metallopeptidase inhibitor 3 | ENSG00000100234.11 |
| 12 | MTHFR | Methylenetetrahydrofolate reductase (NAD(P)H) | ENSG00000177000.10 |
| 13 | BIRC5 | Baculoviral IAP repeat containing 5 | ENSG00000089685.14 |
| 14 | TNFSF11 | Tumor necrosis factor (ligand) superfamily, member 11 | ENSG00000120659.14 |
| 15 | EGFR | Epidermal growth factor receptor | ENSG00000146648.15 |
| 16 | IKBKB | Inhibitor of kappa light polypeptide gene enhancer in B-cells, kinase beta | ENSG00000104365.13 |
| 17 | NQO1 | NAD(P)H dehydrogenase, quinone 1 | ENSG00000181019.12 |
| 18 | CCNE1 | Cyclin E1 | ENSG00000105173.13 |
| 19 | ALK | Anaplastic lymphoma receptor tyrosine kinase | ENSG00000171094.15 |
| 20 | IL2 | Interleukin 2 | ENSG00000109471.4 |
| 21 | CDH1 | Cadherin 1, type 1, E-cadherin (epithelial) | ENSG00000039068.18 |
| 22 | IFNG | Interferon, gamma | ENSG00000111537.4 |
| 23 | IL4 | Interleukin 4 | ENSG00000113520.10 |
| 24 | NAT2 | N-acetyltransferase 2 (arylamine N-acetyltransferase) | ENSG00000156006.4 |
| 25 | MUC1 | Mucin 1, cell surface associated | ENSG00000185499.16 |
| 26 | BCL2 | B-cell CLL/lymphoma 2 | ENSG00000171791.11 |
| 27 | CCNG1 | Cyclin G1 | ENSG00000113328.18 |
| 28 | TNFRSF11B | Tumor necrosis factor receptor superfamily, member 11b | ENSG00000164761.8 |
| 29 | CLU | Clusterin | ENSG00000120885.19 |
| 30 | ICAM1 | Intercellular adhesion molecule 1 | ENSG00000090339.8 |
| 31 | CAV1 | Caveolin 1, caveolae protein | ENSG00000105974.11 |
| 32 | CYP1A1 | Cytochrome P450, family 1, subfamily A, polypeptide 1 | ENSG00000140465.13 |
| 33 | PPARG | Peroxisome proliferator-activated receptor gamma | ENSG00000132170.19 |
| 34 | RELA | V-rel avian reticuloendotheliosis viral oncogene homolog A | ENSG00000173039.18 |
| 35 | HIF1A | Hypoxia inducible factor 1, alpha subunit (basic helix-loop-helix transcription factor) | ENSG00000100644.16 |
| 36 | GSTP1 | Glutathione S-transferase pi 1 | ENSG00000084207.15 |
| 37 | CXCL8 | Chemokine (C-X-C motif) ligand 8 | ENSG00000169429.10 |
| 38 | MAPK9 | Mitogen-activated protein kinase 9 | ENSG00000050748.17 |
| 39 | CDK2 | Cyclin-dependent kinase 2 | ENSG00000123374.10 |
| 40 | IL1RN | Interleukin 1 receptor antagonist | ENSG00000136689.18 |
| 41 | ODC1 | Ornithine decarboxylase 1 | ENSG00000115758.12 |
| 42 | NFE2L2 | Nuclear factor, erythroid 2-like 2 | ENSG00000116044.15 |
| 43 | NR3C1 | Nuclear receptor subfamily 3, group C, member 1 (glucocorticoid receptor) | ENSG00000113580.14 |
| 44 | IL17A | Interleukin 17A | ENSG00000112115.5 |
| 45 | TLR4 | Toll-like receptor 4 | ENSG00000136869.13 |
| 46 | TP53 | Tumor protein p53 | ENSG00000141510.15 |
| 47 | TNF | Tumor necrosis factor | ENSG00000232810.3 |
| 48 | INSR | Insulin receptor | ENSG00000171105.13 |
| 49 | EGF | Epidermal growth factor | ENSG00000138798.11 |
| 50 | CASP9 | Caspase 9, apoptosis-related cysteine peptidase | ENSG00000132906.17 |
| 51 | CDKN1A | Cyclin-dependent kinase inhibitor 1A | ENSG00000124762.13 |
| 52 | CAT | Catalase | ENSG00000121691.4 |
| 53 | ABCC2 | ATP-binding cassette, sub-family C,member 2 | ENSG00000023839.10 |
| 54 | MPO | Myeloperoxidase | ENSG00000005381.7 |
| 55 | VIM | Vimentin | ENSG00000026025.13 |
| 56 | PCNA | Proliferating cell nuclear antigen | ENSG00000132646.10 |
| 57 | FABP4 | Fatty acid binding protein 4, adipocyte | ENSG00000170323.8 |
| 58 | SPP1 | Secreted phosphoprotein 1 | ENSG00000118785.13 |
| 59 | F2 | Coagulation factor II (thrombin) | ENSG00000180210.14 |
| 60 | PTGS2 | Prostaglandin-endoperoxide synthase 2 | ENSG00000073756.11 |
| 61 | CTNNB1 | Catenin (cadherin-associated protein), beta 1 | ENSG00000168036.16 |
| 62 | NFKB1 | Nuclear factor of kappa light polypeptide gene enhancer in B-cells 1 | ENSG00000109320.11 |
| 63 | TIMP2 | TIMP metallopeptidase inhibitor 2 | ENSG00000035862.12 |
| 64 | IL1B | Interleukin 1, beta | ENSG00000125538.11 |
| 65 | CCND1 | Cyclin D1 | ENSG00000110092.3 |
| 66 | NFKBIA | Nuclear factor of kappa light polypeptide gene enhancer in B-cells inhibitor, alpha | ENSG00000100906.10 |
| 67 | IGFBP3 | Insulin-like growth factor binding protein 3 | ENSG00000146674.14 |
| 68 | TLR2 | Toll-like receptor 2 | ENSG00000137462.6 |
| 69 | CTSD | Cathepsin D | ENSG00000117984.12 |
| 70 | TIMP1 | TIMP metallopeptidase inhibitor 1 | ENSG00000102265.11 |
| 71 | BAX | BCL2-associated X protein | ENSG00000087088.19 |
| 72 | GSK3B | Glycogen synthase kinase 3 beta | ENSG00000082701.14 |
| 73 | CCL2 | Chemokine (C-C motif) ligand 2 | ENSG00000108691.9 |
| 74 | HGF | Hepatocyte growth factor (hepapoietin A; scatter factor) | ENSG00000019991.15 |
| 75 | MMP1 | Matrix metallopeptidase 1 | ENSG00000196611.4 |
| 76 | TYMP | Thymidine phosphorylase | ENSG00000025708.12 |
| 77 | IL6 | Interleukin 6 | ENSG00000136244.11 |
| 78 | CASP3 | Caspase 3, apoptosis-related cysteine peptidase | ENSG00000164305.17 |
| 79 | CSF2 | Colony stimulating factor 2 (granulocyte-macrophage) | ENSG00000164400.5 |
| 80 | MMP9 | Matrix metallopeptidase 9 | ENSG00000100985.7 |
Gene function and pathway enrichment analyses
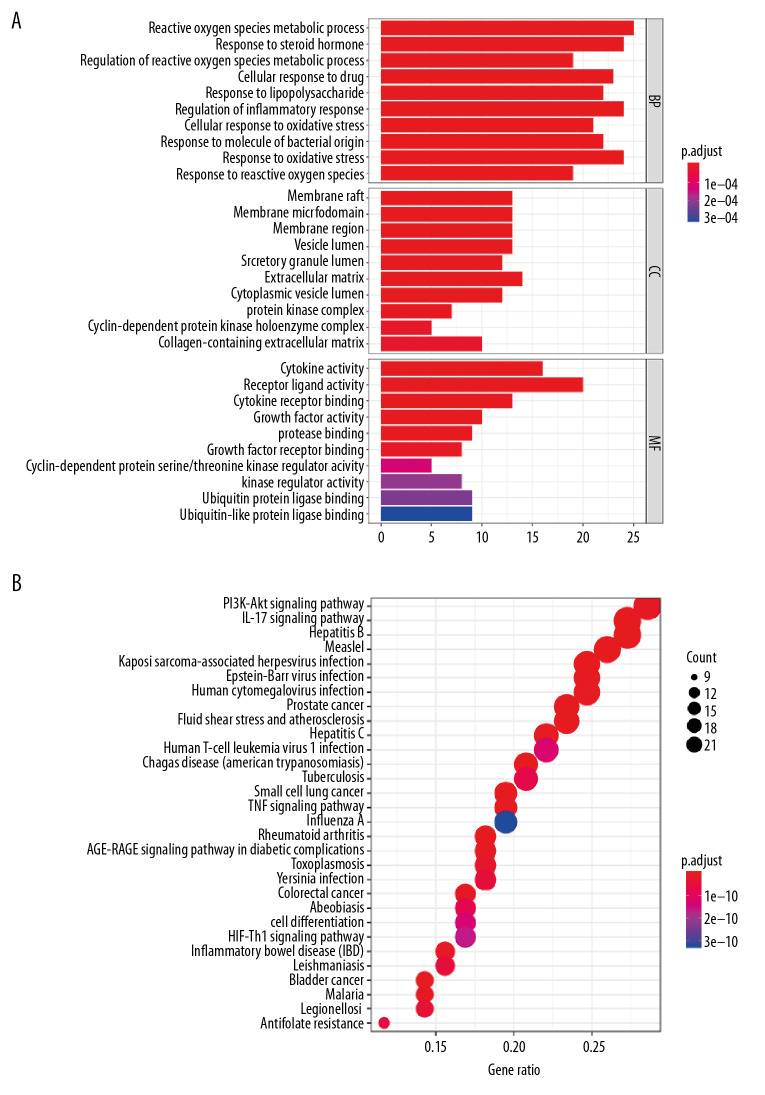
As shown in Figure 3A, the top 10 biological processes (BP) included the ROS metabolic process, response to steroid hormone, regulation of ROS metabolic process, cellular response to drugs, response to lipopolysaccharide, regulation of the inflammatory response, cellular response to oxidative stress, response to molecules of bacterial origin, response to oxidative stress, and response to ROS. These functional terms are highly relevant to regulation and metabolism of ROS. This is consistent with our previous findings that TNBC death may be closely related to metabolism of ROS. Moreover, Figure 3A also shows the top 10 cellular components (CC), including the membrane raft, membrane microdomain, membrane region, vesicle lumen, secretory granule lumen, extracellular matrix, cytoplasmic vesicle lumen, protein kinase complex, cyclin-dependent protein kinase holoenzyme complex, and collagen-containing extracellular matrix. This suggests that many cytokines and production of proteins may be involved. In addition, in Figure 3A, we can also see that the molecular functions (MFs) of the 80 genes with relatively high correlations included cytokine activity, receptor ligand activity, cytokine receptor binding, growth factor activity, protease binding, and growth factor receptor binding. Based on the MF results, these 80 genes are closely associated with activation and regulation of various receptors. The relevant signal pathways were discovered by using KEGG analysis. The two pathways that were most significant were the PI3K-Akt signaling pathway and the interleukin (IL)-17 signaling pathway (Figure 3B). The phosphatidylinositol-3-kinase -Akt pathway promotes cell metabolism, proliferation, and survival in response to extracellular signals. The most significant role of IL-17 is its involvement in induction and mediation of pro-inflammatory responses. Both of these important pathways are involved in multiple physiological processes in TNBC cells. The results of the above analysis lead us to believe that SAS inhibits growth of TNBC cells for a variety of possible reasons. The large accumulation of ROS, activation of inflammation, and regulation of cellular metabolism could be among the reasons. Of course, KEGG analysis gives many other pathways as well, which are calculable results, but for the SAS and TNBC projects that we focused on, we felt that the pathways that could cause cell death and inflammation production made the most sense.
Figure 3.
(A, B) Functional and pathway enrichment analysis of genes related to SAS and TNBC.
PPI network analysis
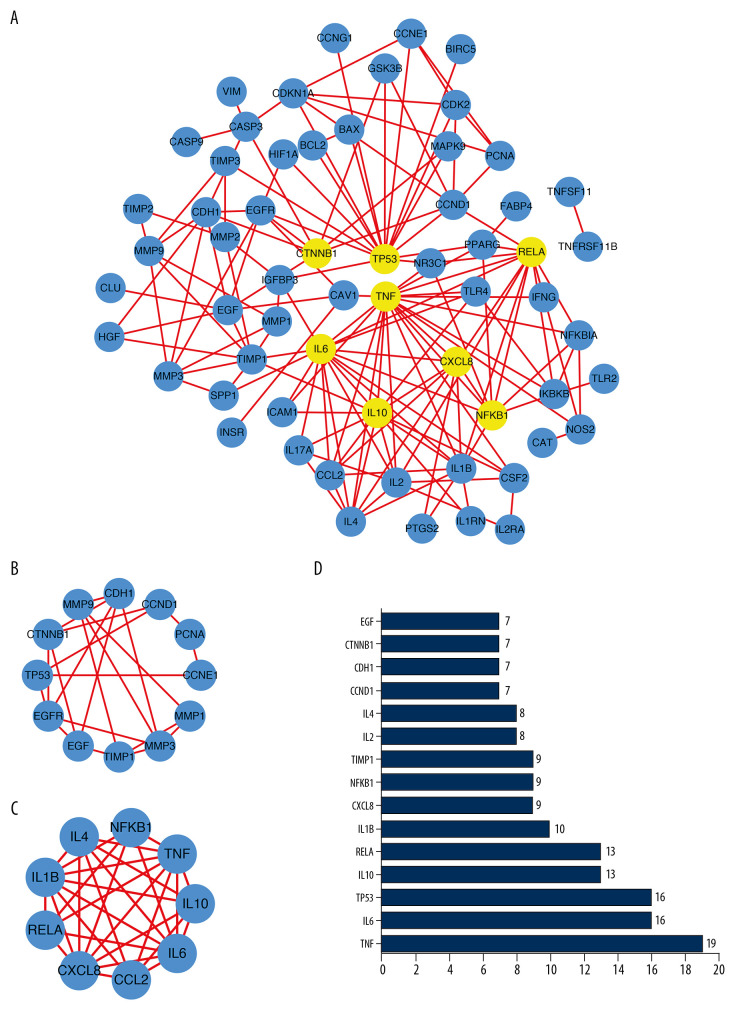
With interaction and pathway exploration mining among 80 targets based on the STRING database, an entire interaction network was constructed using Cytoscape and a total of 61 nodes and 152 edges were obtained from 80 genes. The yellow nodes correspond to the most relevant target genes (Figure 4A). We used MCODE in Cytoscape to calculate the optimal grouping of the entire network, producing two optimal subgroups (Figure 4B, 4C) that were significantly related to theMMP and IL families. Based on the STRING statistics, the top 15 nodes with the most edges are presented in Figure 4D. From the results of PPI Network analysis, there are more potential pathways between these 15 target genes and other molecules. The MMP and IL families in the two subgroups also showed significant differences in expression in heat map analysis. Among them, CXCL8 and TNF were statistically significant in survival analysis, which proved that they might be associated with prognosis. However, CXCL8 and TNF did not differ significantly in expression of TNBC by heatmap analysis.
Figure 4.
(A) Protein–protein interaction (PPI) network of 80 genes associated with SAS and TNBC. The 8 yellow nodes indicate the 8 genes that are connected to the highest number of other genes. (B, C) From the entire PPI network, 2 significant subgroups were identified by MCODE in Cytoscape. (D) The top 15 nodes with the most connections among 80 nodes.
Identification of 80 prognosis-associated genes
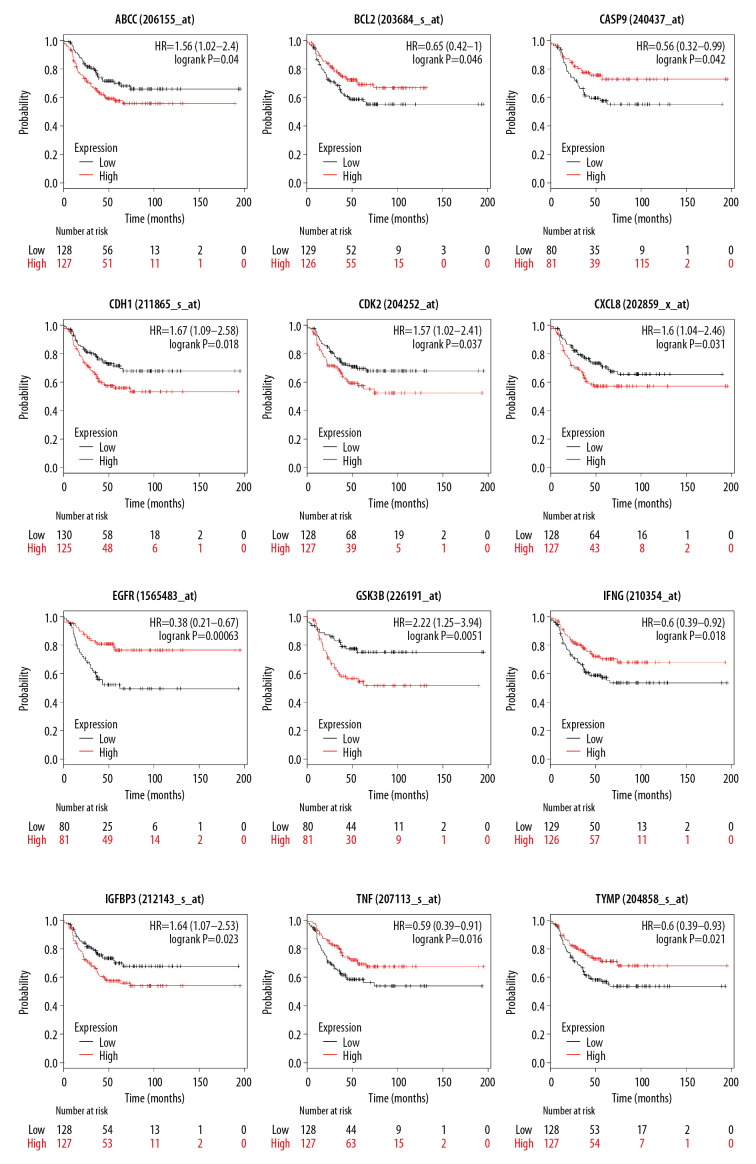
Survival analysis was performed with the median as the cut-off criterion. As a result, 12 genes (ABCC2, BCL2, CASP9, CDH1, CDK2, CXCL8, EGFR, GSK3B, IFENG, IGFBP3, TNF, and TYMP) were found to be associated with RFS in patients with TNBC. As shown in Figure 5, patients with high expression of ABCC2, CDH1, CDK2, CXCL8, GSK3B, and IGFBP3 had shorter RFS. In contrast, low expression of the remaining six genes predicted poor survival. Among these prognosis-related genes, BCL2, EGFR,and IFENG were shown to be associated with ROS metabolism in GO analysis and TNF and EGFR were shown to be associated with inflammatory pathways. The KEGG shows that BCL2 is AKT pathway-relevant and regulates cell proliferation, cycle, and various metabolic processes. Expression of BCL2 and CASP9 also differed significantly between TNBC and normal tissues, but there was little difference in expression of other prognosis-related genes screened.
Figure 5.
The 12 genes identified by the Kaplan-Meier survival analysis were significantly associated with relapse-free survival (RFS) among the 80 genes.
Differential expression of 80 genes in TNBC and normal tissues
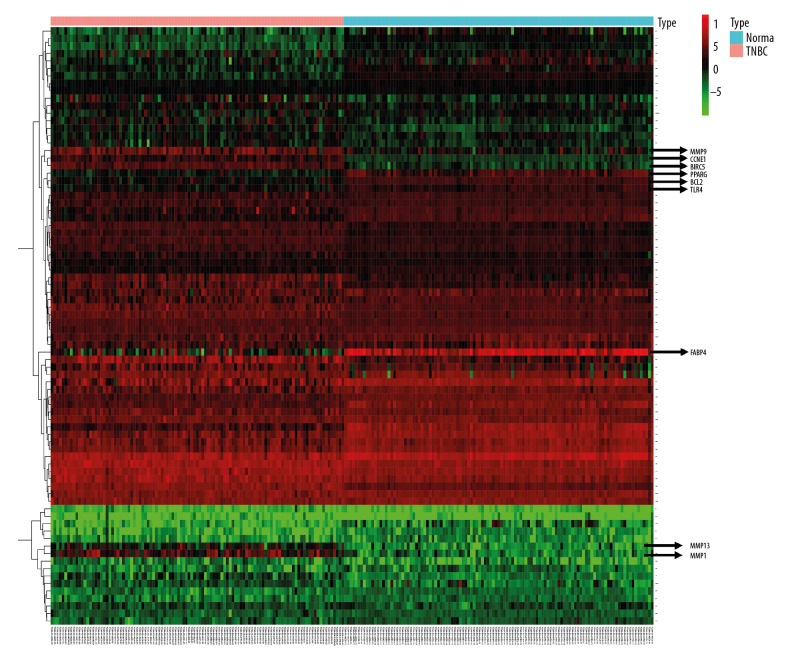
Differential expression analysis of genes in 220 TNBC samples was performed using the “heatmap” software package in the R programming language. As shown in Figure 6, we found that several genes were significantly differentially expressed. MMP family genes were significantly overexpressed in TNBC tissues. CCNE1 and ERIC5 were also highly overexpressed in TNBC. However, levels of expression of peroxisome proliferator activated receptor gamma (PPARG), BCL2, TLR4, and FABP4 were significantly lower in TNBC than in normal tissues, suggesting that they may be involved in suppressing cancer development. From the results of the expression analysis, we can once again focus on BCL2, who also showed some differences in the survival analysis. Similarly, various gene expressions in the MMP family showed significant differences. Together with results of previous PPI analyses, we have more reason to believe that the MMP family has an important role in cell death caused by SAS.
Figure 6.
Heatmap of 80 differentially expressed genes. Red color represents upregulated genes, and green represents downregulated genes in TNBC patients and normal patients.
Discussion
Considering that TNBC lacks ER expression and effective therapeutic targets, chemotherapy is indispensable in clinical practice. The chemotherapy regimens used for TNBC mainly include paclitaxel and anthracyclines [20]. However, chemotherapy leads to many inevitable problems, such as resistance and bone marrow suppression. Therefore, it is worth investigating the new use of old drugs. Our previous research found that SAS has a significant inhibitory effect on TNBC cells, mainly by activating the ferroptosis pathway to produce a large amount of ROS to cause cell death [7]. In addition, it has also been shown that there may be many other potential pathways involved in generation of ROS. In this study, a rigorous network pharmacological analysis of 80 genes related to SAS and TNBC was conducted, which provides an unprecedented opportunity to determine some of the relevant pathways and indicates an appropriate direction for future research.
An increasing number of studies have shown that inflammation plays an important role in tumorigenesis, and TNBC is no exception [21]. Interestingly, we found that some of the 80 genes identified in this study, such as TNF and NF-κB are significantly related to inflammation, as are many IL family genes. In general, SAS is broadly used to treat chronic inflammation in the gut, joints, and retina. In addition to the obvious inhibitory effect of SAS on inflammation, some studies have also shown a significant inhibitory effect on the NF-κB signaling pathway [22]. The NF-κB transcription factor family members isare well-documented critical components involved in cell survival and proliferation, immunity, and inflammation, thereby acting as important mediators of cancer emergence, progression, and metastasis [23]. In a cancer setting, tumors are often characterized by elevated levels of cytokines that are produced and secreted by the classical pathway, including two proinflammatory cytokines, TNF and IL-1B, which commonly trigger tumor activation[24]. Indeed, emerging evidence suggests that TNF fuels progression of breast cancer by promoting proliferation, transformation, angiogenesis, invasion, and metastasis [25] as well as by being vital for viability of TNBC cell lines [26]. Inhibition of TNF by SAS was proven many years ago [27], so expression or activity of some molecules downstream of TNF, such as RELA, also will be affected [22]. On the other hand, SAS has a significant inhibitory effect on both IL-1B [28,29] and IL-6 [30,31]. Therefore, we can generate a scientific hypothesis stating that SAS inhibits the expression or activity of inflammation-related factors and thus inhibits the occurrence and development of TNBC. However, not enough basic research has been conducted to confirm this hypothesis.
MMPs are a group of Zn-dependent neutral peptide endonucleases characterized by transmembrane transport and secretion [32], the main role of which are to degrade the extracellular matrix [33]. Recently, mechanisms by which MMPs promote tumorigenesis and development have become relatively well known, such as degradation of the extracellular matrix, activation of cell growth factors, and regulation of angiogenesis. Interactions between various mechanisms jointly stimulate the occurrence and development of tumors. MMPs also exert many necessary functions in breast cancer and have negative prognostic value for patients with breast cancer [34]. This is consistent with the results we obtained in the heatmap analysis. MMPs are mainly produced by interstitial fibroblasts, and tumor progression and poor prognosis are related to expression of MMP1, MMP7, and MMP12 in the interstitium [35]. MMPs have been studied in breast cancer subtypes but rarely have been studied in TNBC. In TNBC, patients with high expression of CD147 and MMP9 have worse prognosis than patients with low expression of those 2 genes [36]. Many relevant studies have been performed on MMPs and SAS, and we found that SAS can inhibit expression and activity of MMPs. SAS inhibits expression and activity of MMP1, MMP2, MMP3, and MMP9, which are activated by IL-1B [37]. Lakey RL et al. found that mRNA expression of MMP13 increased under IL-1A cotreatment with oncostatin M (OSM). However, SAS can inhibit this phenomenon [38]. Therefore, there are reasons to speculate that SAS can affect degradation of the extracellular matrix, activation of cell growth factors, and regulation of angiogenesis by inhibiting expression and activity of MMPs in TNBC.
A large number of ROS-related biological processes were found to be associated with the 80 genes by GO analysis. ROS produced by peroxidation can affect various cell functions. Therefore, we focused on the impact of ROS on TNBC. ROS are known to play a controversial role during cancer initiation and progression. Studies of ROS have not come to consistent conclusions regarding TNBC. A previous study found increased ROS levels in TNBC cell lines and a dependency on ROS for survival, because antioxidant treatment induced cell death in TNBC cells but not in an ER -positive cell line [39]. In contrast, there is also literature showing that the decrease in TNBC growth is due to the large accumulation of ROS [40]. Our study found that SAS promotes expression of TFRC by inhibiting the expression of SLC7A11, thereby inducing ferroptosis in MDA-MB-231 TNBC cells and producing a large amount of ROS. It was also found in our previous study that reducing ROS accumulation in SAS-treated TNBC cells with ferroptosis inhibitors can reverse the decrease in cell proliferation [7].
ROS also plays an important role in TNBC radiotherapy. In combination with radiation, niclosamide treatment resulted in a significant increase in ROS generation and induction of apoptosis in parental and radioresistant TNBC cells in vitro and TNBC xenograft tumors in vivo [41]. Moreover, ROS have been reported to be associated with chemotherapy resistance in TNBC. Lu Lu et al. demonstrated that MYC and MCL1 cooperated in maintaining chemotherapy-resistant cancer stem cells (CSCs) in TNBC. MYC and MCL1 increased mitochondrial oxidative phosphorylation (mtOXPHOS) and generation of ROS, which are involved in maintenance of CSCs [41]. Previous results have shown that SAS increases accumulation of ROS, which is the main cause of inhibition of growth and proliferation of TNBC. However, some specific mechanisms are still unclear. From our GO analysis, approximately 25% of genes were shown to be associated with regulation of ROS. Here, we selected some genes from among 80 potential target genes for analysis. From the results, ANXA1, NOS2 and NQO1 were the genes that appeared most frequently in ROS-related biological processes. Giovanna Leoni et al. described a novel signaling pathway that is activated by an endogenous formyl peptide receptor ligand and ANXA1, which mediate activation of ROS by an epithelial nicotinamide adenine dinucleotide phosphate oxidase [42]. Bhaskar S et al. found that copper sulfate results in increased lipoprotein oxidation which results in increased expression of NOS2 mRNA [2]. Studies on NQO1 and ROS have shown a continued increasing trend. In 2018, Luo S et al. found in a study of glioblastoma multiforme that knocking out NQO1 increased the number of ROS and decreased cell proliferation. In contrast, overexpression of NQO1 attenuates ROS and increases cell proliferation [43]. Treatment with the PPARG agonist pioglitazone can trigger changes in metabolic patterns, change the cellular energy supply pattern from glucose oxidation to fatty acid oxidation, and inhibit pyruvate oxidation to reduce glutathione levels. These metabolic changes cause a significant increase in ROS levels in cancer cells [44]. Similar to pioglitazone, SAS can act as an agonist of PPARG, increasing PPARG expression [45]. Therefore, this also may be the explanation for the large amount of ROS produced in SAS-treated tumor cells. Both nuclear factor, erythroid 2 such as 2 (NFELE2) and NAD(P)H quinone dehydrogenase 1 (NQO1) are important factors involved in the oxidative peroxidation reaction, and SAS can generate a large amount of ROS by increasing their expression and activity [46]. Consequently, SAS can damage cells by peroxidation by NFELE2 and NQO1. This could be another reason for accumulation of ROS in SAS-treated cells. In short, SAS may stimulate accumulation of ROS in cells through different pathways, thereby inhibiting the growth of TNBC cells.
However, we must admit that our research still has some limitations. First, our research lacks the support of basic experiments. In addition, there are not enough data supporting clinical use of SAS in patients with TNBC. Furthermore, in the survival analysis, we did not have sufficient data to explore the effect of the 80 genes on the rate of overall survival (OS) in patients with TNBC. We chose RFS as the indicator. RFS mainly reflects recurrence and progression of the disease, but the best indicator for the survival time of patients is still OS.
Conclusions
In summary, we first used different databases to identify 80 genes linked with a noncancer drug (SAS) and the BC type with the worst prognosis (TNBC). Finally, we found that SAS may reduce development of TNBC by inhibiting expression of inflammation-related genes and MMP-related genes. Simultaneously stimulating expression of genes related to the oxidative stress pathway and increasing the accumulation of intracellular ROS may also be one of the potential mechanisms by which SAS suppresses cancer (Figure 7). Therefore, our research can set the direction for follow-up research on SAS and provide a theoretical basis for clinical treatment of SAS in TNBC.
Figure 7.
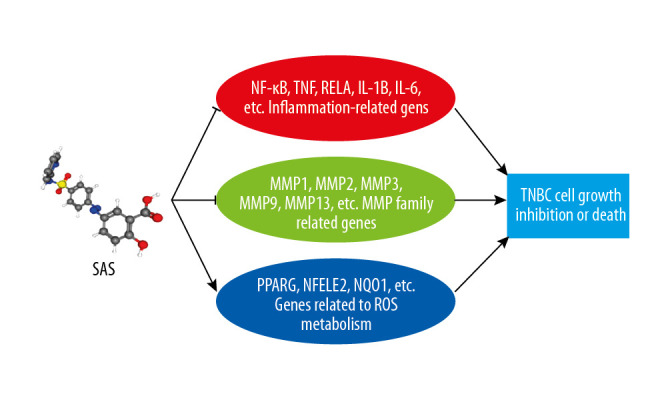
Schematic diagram of potential pathways for SAS to inhibit growth and proliferation of TNBC cells.
Footnotes
Availability of data and materials
The datasets used during the present study are available from the corresponding author upon reasonable request.
Conflict of interests
None.
Source of support: The current study was supported by grants from the China Scholarship Council (File No.201908500101)
References
- 1.Siegel RL, Miller KD, Jemal A. Cancer statistics. Cancer J Clin. 2020;70:7–30. doi: 10.3322/caac.21590. [DOI] [PubMed] [Google Scholar]
- 2.Polyak K. Heterogeneity in breast cancer. J Clin Invest. 2011;121:3786–88. doi: 10.1172/JCI60534. [DOI] [PMC free article] [PubMed] [Google Scholar]
- 3.Weigelt B, Reis-Filho JS. Histological and molecular types of breast cancer: Is there a unifying taxonomy? Nat Rev Clin Oncol. 2009;6:718–30. doi: 10.1038/nrclinonc.2009.166. [DOI] [PubMed] [Google Scholar]
- 4.Kim C, Gao R, Sei E, et al. Chemoresistance evolution in triple-negative breast cancer delineated by single-cell sequencing. Cell. 2018;173:879–893.e13. doi: 10.1016/j.cell.2018.03.041. [DOI] [PMC free article] [PubMed] [Google Scholar]
- 5.Kagbo-Kue S, Ajose T, Bakinde N. Aspirin inhibited the metastasis of colon cancer cells by inhibiting the expression of toll-like receptor 4. Cell Biosci. 2018;8:36. doi: 10.1186/s13578-018-0234-2. [DOI] [PMC free article] [PubMed] [Google Scholar]
- 6.Thakur S, Daley B, Gaskins K, et al. Metformin targets mitochondrial glycerophosphate dehydrogenase to control rate of oxidative phosphorylation and growth of thyroid cancer in vitro and in vivo. Clin Cancer Res. 2018;24:4030–43. doi: 10.1158/1078-0432.CCR-17-3167. [DOI] [PMC free article] [PubMed] [Google Scholar]
- 7.Yu H, Yang C, Jian J, et al. Sulfasalazine induced ferroptosis in breast cancer cells is reduced by the inhibitory effect of estrogen receptor on the transferrin receptor. Oncol Rep. 2019;42:826–38. doi: 10.3892/or.2019.7189. [DOI] [PubMed] [Google Scholar]
- 8.Hopkins AL. Network pharmacology. Nat Biotechnol. 2007;25:1110–11. doi: 10.1038/nbt1007-1110. [DOI] [PubMed] [Google Scholar]
- 9.Hopkins AL. Network pharmacology: The next paradigm in drug discovery. Nat Chem Biol. 2008;4:682–90. doi: 10.1038/nchembio.118. [DOI] [PubMed] [Google Scholar]
- 10.Zhang Z, Yi P, Yang J, et al. Integrated network pharmacology analysis and serum metabolomics to reveal the cognitive improvement effect of Bushen Tiansui formula on Alzheimer’s disease. J Ethnopharmacol. 2020;249:112371. doi: 10.1016/j.jep.2019.112371. [DOI] [PubMed] [Google Scholar]
- 11.Luo TT, Lu Y, Yan SK, et al. Network pharmacology in research of chinese medicine formula: methodology, application and prospective. Chin J Integr Med. 2020;26:72–80. doi: 10.1007/s11655-019-3064-0. [DOI] [PubMed] [Google Scholar]
- 12.Zeng L, Yang K. Exploring the pharmacological mechanism of Yanghe Decoction on HER2-positive breast cancer by a network pharmacology approach. J Ethnopharmacol. 2017;199:68–85. doi: 10.1016/j.jep.2017.01.045. [DOI] [PubMed] [Google Scholar]
- 13.Wang X, Shen Y, Wang S, et al. PharmMapper 2017 update: A web server for potential drug target identification with a comprehensive target pharmacophore database. Nucleic Acids Res. 2017;45:W356–60. doi: 10.1093/nar/gkx374. [DOI] [PMC free article] [PubMed] [Google Scholar]
- 14.Davis AP, Grondin CJ, Johnson RJ, et al. The comparative toxicogenomics database: Update 2017. Nucleic Acids Res. 2017;45:D972–78. doi: 10.1093/nar/gkw838. [DOI] [PMC free article] [PubMed] [Google Scholar]
- 15.The Gene Ontology Consortium. Expansion of the Gene Ontology knowledgebase and resources. Nucleic Acids Res. 2017;45:D331–38. doi: 10.1093/nar/gkw1108. [DOI] [PMC free article] [PubMed] [Google Scholar]
- 16.Kanehisa M, Furumichi M, Tanabe M, et al. KEGG: New perspectives on genomes, pathways, diseases and drugs. Nucleic Acids Res. 2017;45:D353–61. doi: 10.1093/nar/gkw1092. [DOI] [PMC free article] [PubMed] [Google Scholar]
- 17.Szklarczyk D, Morris JH, Cook H, et al. The STRING database in 2017: Quality-controlled protein-protein association networks, made broadly accessible. Nucleic Acids Res. 2017;45:D362–68. doi: 10.1093/nar/gkw937. [DOI] [PMC free article] [PubMed] [Google Scholar]
- 18.Shannon P, Markiel A, Ozier O, et al. Cytoscape: A software environment for integrated models of biomolecular interaction networks. Genome Res. 2003;13:2498–504. doi: 10.1101/gr.1239303. [DOI] [PMC free article] [PubMed] [Google Scholar]
- 19.Gyorffy B, Lanczky A, Eklund AC, et al. An online survival analysis tool to rapidly assess the effect of 22,277 genes on breast cancer prognosis using microarray data of 1,809 patients. Breast Cancer Res Treat. 2010;123:725–31. doi: 10.1007/s10549-009-0674-9. [DOI] [PubMed] [Google Scholar]
- 20.Sikov WM, Berry DA, Perou CM, et al. Impact of the addition of carboplatin and/or bevacizumab to neoadjuvant once-per-week paclitaxel followed by dose-dense doxorubicin and cyclophosphamide on pathologic complete response rates in stage II to III triple-negative breast cancer: CALGB 40603 (Alliance) J Clin Oncol. 2015;33:13–21. doi: 10.1200/JCO.2014.57.0572. [DOI] [PMC free article] [PubMed] [Google Scholar]
- 21.Matsumoto H, Koo SL, Dent R, et al. Role of inflammatory infiltrates in triple negative breast cancer. J Clin Pathol. 2015;68:506–10. doi: 10.1136/jclinpath-2015-202944. [DOI] [PubMed] [Google Scholar]
- 22.Wahl C, Liptay S, Adler G, Schmid RM. Sulfasalazine: A potent and specific inhibitor of nuclear factor kappa B. J Clin Invest. 1998;101:1163–74. doi: 10.1172/JCI992. [DOI] [PMC free article] [PubMed] [Google Scholar]
- 23.Shostak K, Chariot A. NF-kappaB, stem cells and breast cancer: The links get stronger. Breast Cancer Res. 2011;13:214. doi: 10.1186/bcr2886. [DOI] [PMC free article] [PubMed] [Google Scholar]
- 24.Barbie TU, Alexe G, Aref AR, et al. Targeting an IKBKE cytokine network impairs triple-negative breast cancer growth. J Clin Invest. 2014;124:5411–23. doi: 10.1172/JCI75661. [DOI] [PMC free article] [PubMed] [Google Scholar]
- 25.Yu M, Zhou X, Niu L, et al. Targeting transmembrane TNF-alpha suppresses breast cancer growth. Cancer Res. 2013;73:4061–74. doi: 10.1158/0008-5472.CAN-12-3946. [DOI] [PubMed] [Google Scholar]
- 26.Pileczki V, Braicu C, Gherman CD, Berindan-Neagoe I. TNF-alpha gene knockout in triple negative breast cancer cell line induces apoptosis. Int J Mol Sci. 2012;14:411–20. doi: 10.3390/ijms14010411. [DOI] [PMC free article] [PubMed] [Google Scholar]
- 27.Bissonnette EY, Enciso JA, Befus AD. Inhibitory effects of sulfasalazine and its metabolites on histamine release and TNF-alpha production by mast cells. J Immunol. 1995;156:218–23. [PubMed] [Google Scholar]
- 28.Soliman NA, Keshk WA, Rizk FH, Ibrahim MA. The possible ameliorative effect of simvastatin versus sulfasalazine on acetic acid induced ulcerative colitis in adult rats. Chem Biol Interact. 2019;298:57–65. doi: 10.1016/j.cbi.2018.11.002. [DOI] [PubMed] [Google Scholar]
- 29.Soubh AA, Abdallah, El-Abhar HS. Geraniol ameliorates TNBS-induced colitis: Involvement of Wnt/beta-catenin, p38MAPK, NFkappaB, and PPARgamma signaling pathways. Life Sci. 2015;136:142–50. doi: 10.1016/j.lfs.2015.07.004. [DOI] [PubMed] [Google Scholar]
- 30.Niu X, Zhang H, Li W, et al. Protective effect of cavidine on acetic acid-induced murine colitis via regulating antioxidant, cytokine profile and NF-kappaB signal transduction pathways. Chem Biol Interact. 2015;239:34–45. doi: 10.1016/j.cbi.2015.06.026. [DOI] [PubMed] [Google Scholar]
- 31.Keerthy HK, Mohan CD, Sivaraman Siveen K, et al. Novel synthetic biscoumarins target tumor necrosis factor-alpha in hepatocellular carcinoma in vitro and in vivo. J Biol Chem. 2014;289:31879–90. doi: 10.1074/jbc.M114.593855. [DOI] [PMC free article] [PubMed] [Google Scholar]
- 32.Martin MD, Matrisian LM. The other side of MMPs: Protective roles in tumor progression. Cancer Metastasis Rev. 2007;26:717–24. doi: 10.1007/s10555-007-9089-4. [DOI] [PubMed] [Google Scholar]
- 33.Kessenbrock K, Plaks V, Werb Z. Matrix metalloproteinases: Regulators of the tumor microenvironment. Cell. 2010;141:52–67. doi: 10.1016/j.cell.2010.03.015. [DOI] [PMC free article] [PubMed] [Google Scholar]
- 34.Cid S, Eiro N, Fernandez B, et al. Prognostic influence of tumor stroma on breast cancer subtypes. Clin Breast Cancer. 2018;18:e123–33. doi: 10.1016/j.clbc.2017.08.008. [DOI] [PubMed] [Google Scholar]
- 35.Finak G, Bertos N, Pepin F, et al. Stromal gene expression predicts clinical outcome in breast cancer. Nat Med. 2008;14:518–27. doi: 10.1038/nm1764. [DOI] [PubMed] [Google Scholar]
- 36.Zhao S, Ma W, Zhang M, et al. High expression of CD147 and MMP-9 is correlated with poor prognosis of triple-negative breast cancer (TNBC) patients. Med Oncol. 2013;30:335. doi: 10.1007/s12032-012-0335-4. [DOI] [PMC free article] [PubMed] [Google Scholar]
- 37.Lu Y, Fukuda K, Li Q, et al. Role of nuclear factor-kappaB in interleukin-1-induced collagen degradation by corneal fibroblasts. Exp Eye Res. 83:560–68. doi: 10.1016/j.exer.2006.02.008. 20016. [DOI] [PubMed] [Google Scholar]
- 38.Lakey RL, Cawston TE. Sulfasalazine blocks the release of proteoglycan and collagen from cytokine stimulated cartilage and down-regulates metalloproteinases. Rheumatology (Oxford) 2009;48:1208–12. doi: 10.1093/rheumatology/kep236. [DOI] [PubMed] [Google Scholar]
- 39.Sarmiento-Salinas FL, Delgado-Magallon A, Montes-Alvarado JB, et al. Breast cancer subtypes present a differential production of reactive oxygen species (ROS) and susceptibility to antioxidant treatment. Front Oncol. 2019;9:480. doi: 10.3389/fonc.2019.00480. [DOI] [PMC free article] [PubMed] [Google Scholar]
- 40.Gong X, Smith JR, Swanson HM, Rubin LP. Carotenoid lutein selectively inhibits breast cancer cell growth and potentiates the effect of chemotherapeutic agents through ROS-mediated mechanisms. Molecules. 2018;23:905. doi: 10.3390/molecules23040905. [DOI] [PMC free article] [PubMed] [Google Scholar]
- 41.Lu L, Dong J, Wang L, et al. Activation of STAT3 and Bcl-2 and reduction of reactive oxygen species (ROS) promote radioresistance in breast cancer and overcome of radioresistance with niclosamide. Oncogene. 2018;37:5292–304. doi: 10.1038/s41388-018-0340-y. [DOI] [PubMed] [Google Scholar]
- 42.Warne JP, John CD, Christian HC, et al. Gene deletion reveals roles for annexin A1 in the regulation of lipolysis and IL-6 release in epididymal adipose tissue. Am J Physiol Endocrinol Metab. 2006;291:E1264–73. doi: 10.1152/ajpendo.00655.2005. [DOI] [PMC free article] [PubMed] [Google Scholar]
- 43.Luo S, Lei K, Xiang D, Ye K. NQO1 is regulated by PTEN in Glioblastoma, mediating cell proliferation and oxidative stress. Oxid Med Cell Longev. 2018 doi: 10.1155/2018/9146528. 9146528. [DOI] [PMC free article] [PubMed] [Google Scholar]
- 44.Lee KM, Giltnane JM, Balko JM, et al. MYC and MCL1 cooperatively promote chemotherapy-resistant breast cancer stem cells via regulation of mitochondrial oxidative phosphorylation. Cell Metab. 2017;26:633–47.e7. doi: 10.1016/j.cmet.2017.09.009. [DOI] [PMC free article] [PubMed] [Google Scholar]
- 45.Srivastava N, Kollipara RK, Singh DK, et al. Inhibition of cancer cell proliferation by PPARgamma is mediated by a metabolic switch that increases reactive oxygen species levels. Cell Metab. 2014;20:650–61. doi: 10.1016/j.cmet.2014.08.003. [DOI] [PMC free article] [PubMed] [Google Scholar]
- 46.Martinez-Augustin O, Lopez-Posadas R, Gonzalez R, et al. Genomic analysis of sulfasalazine effect in experimental colitis is consistent primarily with the modulation of NF-kappaB but not PPAR-gamma signaling. Pharmacogenet Genomics. 2009;19:363–72. doi: 10.1097/FPC.0b013e3283299a73. [DOI] [PubMed] [Google Scholar]


