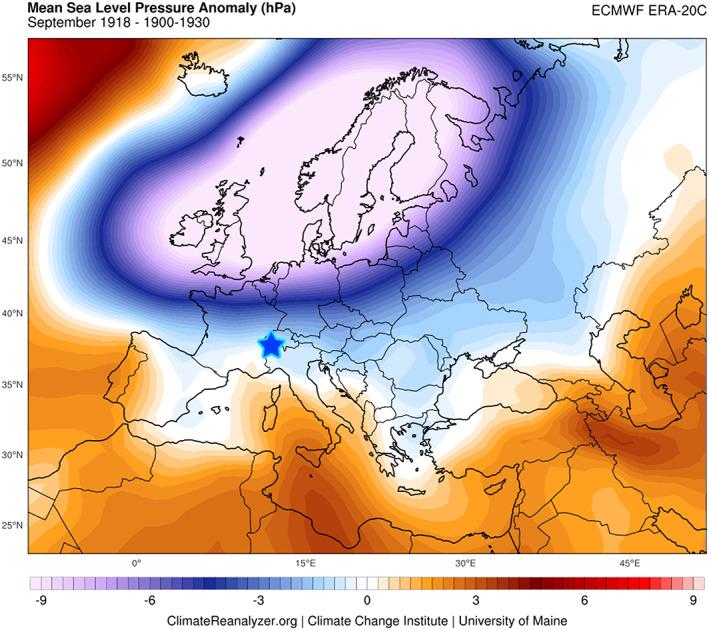
Figure 4.

Atmospheric pressure anomaly over Europe. The CG ice core site (4,450 m.a.s.l.) is shown as a star. A mean sea level pressure difference map was calculated for September 1918 from an average for the 1900–1930 interval in the ECMWF ERA‐20C reanalysis data set via the Climate Reanalyzer™. A strong Iceland low pressure system influenced unusually cold and wet climate conditions during the month of September 1918.
