

Abstract
Starch produced by plants is a stored form of energy and is an important dietary source of calories for humans and domestic animals. Disproportionating enzyme (D‐enzyme) catalyzes intramolecular and intermolecular transglycosylation reactions of α‐1, 4‐glucan. D‐enzyme is essential in starch metabolism in the potato. We present the crystal structures of potato D‐enzyme, including two different types of complex structures: a primary Michaelis complex (substrate binding mode) for 26‐meric cycloamylose (CA26) and a covalent intermediate for acarbose. Our study revealed that the acarbose and CA26 reactions catalyzed by potato D‐enzyme involve the formation of a covalent intermediate with the donor substrate. HPAEC of reaction substrates and products revealed the activity of the potato D‐enzyme on acarbose and CA26 as donor substrates. The structural and chromatography analyses provide insight into the mechanism of the coupling reaction of CA and glucose catalyzed by the potato D‐enzyme. The enzymatic reaction mechanism does not involve residual hydrolysis. This could be particularly useful in preventing unnecessary starch degradation leading to reduced crop productivity. Optimization of this mechanism would be important for improvements of starch storage and productivity in crops.
Keywords: 4‐α‐glucanotransferase, acarbose, crystal structure, cycloamylose, D‐enzyme, potato
Abbreviations
- AM
amylomaltase
- CA
cycloamylose
- CA26
26‐meric
- CGTase
cyclodextrin glucanotransferase
- D‐enzyme
disproportionating enzyme
- DP
degree of polymerization
- HPAEC
high performance anion‐exchange chromatography
1. INTRODUCTION
Starch from plants is the main carbon and energy source for humans and domestic animals. Disproportionating enzyme (D‐enzyme; 4‐α‐glucanotransferase; EC 2.4.1.25) was discovered in potato (Solanum tuberosum) tubers. D‐enzyme functions to disproportionate the degree of polymerization of maltooligosaccharides. 1 The enzyme has since been found in many plant tissues. 2 D‐enzyme is essential for starch metabolism in plants. 3 , 4 A similar 4‐α‐glucanotransferase, termed amylomaltase (AM), is also present in various bacteria. 5 The disproportionation reaction of D‐enzyme and AM, expressed in Equation (1), is an intramolecular transglycosylation reaction where the enzyme catalyzes the transfer of glucan segment from one α‐1,4‐glucan molecule to another (Figure S1a). Some D‐enzymes and AM reportedly catalyze the cyclization reaction where transglycosylation occurs within a single linear glucan molecule to produce a cyclic glucan, as shown in Equation (2) (Figure S1b). These enzymes also catalyze the reverse reaction of Equation (2), where cyclic glucan is linearized and transferred to an acceptor glucan molecule to produce single linear glucan. This linearization reaction is referred to as coupling reaction.
| (1) |
| (2) |
Although the cyclization reaction has been observed for cyclodextrin glucanotransferase (CGTase; EC 2.4.1.19), this reaction differs from that of 4‐α‐glucanotransferase in that a smaller cyclic glucan is produced. CGTase produces cyclic‐1, 4‐glucan with a degree of polymerization (DP) of 6–8, 6 which are often termed cyclodextrins. Conversely, D‐enzyme and AM yield a cyclic‐1, 4‐glucan with a higher DP, which has a number of biotechnological applications, including drug and gene delivery. 7 , 8 Potato D‐enzyme, plastidial disproportionating enzyme 1 (atDPE1) from Arabidopsis thaliana (a small weed from the mustard family), and AM from the heat‐tolerant bacterium Thermus aquaticus reportedly to produce cyclic‐1, 4‐glucan with DPs from 17 to several hundred, 9 16 to 50, 10 and 22, 11 respectively. In addition to the differences in the ranges of DP in CA products, unique characteristics of potato D‐enzyme in non‐hydrolytic activities and activities with CA as donor substrate were also reported 9 (Figure S1c). Specifically, CGTase and AM from T. aquaticus catalyze transglycosylation reactions and display a weak but significant level of hydrolytic activity (Figure S1d). Conversely, potato D‐enzyme exclusively catalyzes transglycosylation reactions and thus appears to be the 4‐α‐glucanotransferase with the lowest level of hydrolytic activity among the enzymes. 5 Additionally, potato D‐enzyme does not show any activity with CA alone as a substrate, but displays specific activities with CA and glucose as donor and acceptor substrates, respectively 9 (Figure S1c), that have not been reported for the other enzymes in the α‐amylase family.
D‐enzyme, atDPE1, AM, and CGTase all belong to the α‐amylase family, 5 which includes over 20 different enzymes. These enzymes catalyze hydrolysis and/or transglycosylation of α‐1,4‐ and/or α‐1,6‐glucosidic linkages at the conserved anomeric center. 12 , 13 A number of crystal structures of the enzymes in the α‐amylase have a common structural feature consisting of a (β/α)8 barrel (TIM‐barrel). Crystal structures including CGTase from several sources, 14 , 15 atDPE1 complexes with acarbose and a sugar chain, 16 and AM from T. aquaticus complexed with 34‐meric CA 17 have been determined. These structures provide insights into the reaction mechanism to produce polymeric sugar rings in which three conserved carboxylic acid residues play a central role 14 , 18 (Figure S2). The first carboxylic acid residue acts as an acid/base catalyst that protonates the donor substrate. Simultaneously, the C1 carbon atom of the donor substrate is attacked by the second carboxylate as a nucleophile, which results in the formation of a covalent glycosyl enzyme intermediate. The covalent intermediate is subject to nucleophilic attack on the C1 by a hydroxyl group of the acceptor substrate, which is bound with the third carboxylate to stabilize ground and transition states. The nucleophilic attack results in the formation of a new glycosidic bond. A hypothesis posits that the transfer reaction mechanism for disproportionation is common in α‐amylase‐type enzymes. 18 , 19 However, the reaction mechanism cannot account for the unique characteristics of potato D‐enzyme, namely, its inactivity with CA as sole substrate and its specific activity with CA and glucose as donor and acceptor substrates. Details of the reaction mechanisms for the production of CA have been referenced in the structural evaluations described above, while reaction mechanisms with CA as donor substrate have not been addressed. Hence, the reaction mechanism coupling of CA and glucose catalyzed by the potato D‐enzyme remains uncertain.
In the present study, we present the crystal structures of the potato D‐enzyme, including two different types of complex structures, a primary Michaelis complex (substrate binding mode) for CA26, and the covalent intermediate for acarbose. Structural analysis in combination with high‐performance anion‐exchange chromatography (HPAEC) were used to elucidate the structural basis for the unique characteristics of potato D‐enzyme, the DP ranges of the reaction products, and the reaction mechanism for the coupling reactions with CA and glucose as the donor and acceptor substrates, respectively.
2. RESULTS
2.1. Transferase activity of potato D‐enzyme
The activities of the glucan‐chain transfer reaction using maltotriose as a substrate with purified native and selenomethionyl D‐enzymes were measured prior to crystallization. The transfer reaction involves dissociation of a glucose residue in the maltotriose as the donor substrate and bonding with the other maltotriose as the acceptor substrate (Figure S1e). The reaction products, one molecule each of maltopentose and glucose, were detected by the glucose oxidase method. 20 The activities of the D‐enzymes are shown in Table 1. The activities of native and selenomethionyl D‐enzymes were not appreciably changed and corresponded well to that from a natural source (47.5 U/mg; Table 1). 21
TABLE 1.
Activities of wild‐type and selenomethionine labeled D‐enzyme
| Types of D‐enzyme | Specific activity (U/mg) |
|---|---|
| Native D‐enzyme | 38.9 |
| Selenomethionine labeled D‐enzyme | 49.1 |
| D‐enzyme from natural source 21 | 47.5 |
2.2. Overall structure of potato D‐enzyme
In the initial stage of this study (in 2005), no crystal structure homologous to that of potato D‐enzyme was available for molecular replacement; therefore, multiwavelength anomalous diffraction (MAD) phasing was applied to solve the structure of potato D‐enzyme using a selenomethionyl derivative of this enzyme. Native (substrate free) and complex structures with acarbose and CA26 were determined by molecular replacement using the structure of selenomethionyl D‐enzyme as a search model refined at resolutions of 2.00 Å, 2.03 Å, and 2.05 Å. Statistics for data collection and refinements are summarized in Table 2. The final model of these structures consisted of one protein molecule in an asymmetric unit. The protomer displayed extensive interactions with a buried area of 8,930 Å2 for neighboring protein molecule related by crystallographic two‐fold symmetry to form a homodimer structure. The dimer structure (the likely biological unit of potato D‐enzyme in solution) was stable in solution as determined by the PISA program. 23 The dimeric structure of potato D‐enzyme was 115 Å in length with well‐defined electron densities from 2 to 524 in the native (substrate‐free) and CA26 complex. In the acarbose complex, residues 78–79 and 277–282 displayed weak electron densities derived from the disorder of the residues. The protomer structure of the potato D‐enzyme was essentially composed of one domain, featuring an (α/β)8 barrel (domain A) and three types of subdomains: B1(244–301, 322–349), B2(67–206), and B3(32–48, 392–405, 417–448, 472–507). This structure is common among most starch‐hydrolyzing enzymes, including the α‐amylases 24 from various species, CGTase 25 and pullulanase 26 (Figure 1, Figure S3), although some of the enzymes in the α‐amylase family 24 and CGTase 25 are composed of three domains (A, B, and C). The closest related structure of native (substrate‐free) D‐enzyme from potato is atDPE1 (apo form) from A. thaliana, whose sequence identity is 69.6%, with a root‐mean‐square deviation (RMSD) of 0.84 Å. The electron density maps clearly showed differences in the orientation of loops L80s and L280s (Figure S4). The N‐terminal 25 residues comprising the dimerization arm protruded from domain A and interacted with the other subunit (Figure 1); the orientation and interactions of the 25 N‐terminal residues indicate that they participate in the dimerization and form a part of the substrate‐binding cavity in the neighboring subunit (Figures 1 and 2). Subunit interactions by hydrogen bonds were also observed with residues on loops L1‐L5, which contribute to stabilizing the dimerization (Figure S3). Using the primary sequences in the α‐amylase as a basis for identification, Asp321, Glu368, and Asp421 were determined to be the catalytic residues in potato D‐enzyme. Also, the Cα positions of the residues in the native (substrate‐free) structure of potato D‐enzyme closely match those of the α‐amylases from other species, CGTase, 14 , 15 and those of AM from T. aquatics. 17 In the native (substrate‐free) structure, the Asp321 showed two types of conformations, one pointing to the substrate binding cleft (conformation A) and the other hydrogen bonding with Asp241 (conformation B) (Figure S5). The active site was located on the long cleft formed by subdomains B1, B2, and B3 (Figure 2c; Figure S6).
TABLE 2.
Data collection and refinement statistics
| Crystal type | SeMet 33 | Native (substrate‐free) Acarbose | CA26 | |||
|---|---|---|---|---|---|---|
| Peak | Edge | Remote | ||||
| Data collection and processing statistics | ||||||
| Beam line | PF BL‐5A | AR‐NW12A | BL44XU | BL‐5A | ||
| Space group | C2221 | C2221 | C2221 | C2221 | ||
| Unit cell dimension (Å) | ||||||
| a (Å) | 69.7 | 69.9 | 69.2 | 70.8 | ||
| b (Å) | 120.3 | 120.5 | 120.3 | 120.4 | ||
| c (Å) | 174.2 | 174.4 | 174.7 | 174.6 | ||
| Wavelength (Å) | 0.9791 | 0.9794 | 1.000 | 1.000 | 0.900 | 1.000 |
| Resolution (Å) | 50.0‐2.03 | 50.0‐1.96 | 50.0‐2.00 | 35.4‐2.00 | 60.0‐2.03 | 60.9‐2.05 |
| (2.10‐2.03) | (2.03‐1.96) | (2.07‐2.00) | (2.11‐2.00) | (2.10‐2.03) | (2.16‐2.05) | |
| Total reflections | 342,034 | 371,974 | 349,274 | 361,684 | 347,674 | 266,389 |
| Unique reflections | 47,324 (4,693) | 52,631 (5,179) | 49,370 (4,872) | 49,562 (7,039) | 46,983 (4,620) | 46,979 (6,745) |
| I/I | 24.5 (8.2) | 24.6 (5.7) | 26.8 (8.2) | 44.2 (19.9) | 32.3 (7.9) | 17.1 (4.8) |
| Redundancy | 7.2 (6.4) | 7.1 (5.7) | 7.1 (5.8) | 7.3 (6.8) | 7.4 (7.5) | 5.7 (5.7) |
| Completeness (%) | 100 (99.9) | 99.9 (99.2) | 99.9 (99.4) | 99.2 (97.8) | 99.9 (99.7) | 99.6 (99.3) |
| R merge a (%) | 5.4 (19.4) | 5.2 (24.5) | 4.7 (18.8) | |||
| R meas (%) | 3.2 (9.2) | 8.8 (38.7) | 6.8 (38.1) | |||
| CC1/2 | 1.000 (0.996) | 0.998 (0.936) | ||||
| Number of Se‐atoms | 7 | |||||
| Refinement statistics | ||||||
| Resolution | 35.4‐2.00 | 60.0‐2.03 | 49.6‐2.00 | |||
| Protein atoms | 4,183 | 4,119 | 4,191 | |||
| Ligand atoms | 6 | 46 | 122 | |||
| Water molecule | 613 | 455 | 290 | |||
| R work/R free (%) | 14.7/18.0 | 16.3/20.6 | 16.6/19.6 | |||
| Root mean square deviations | ||||||
| Bond lengths (Å) | 0.01 | 0.01 | 0.01 | |||
| Bond angles (°) | 1.77 | 1.69 | 1.78 | |||
| Ramachandran statistics (%) | ||||||
| Residues in favored region | 97.3 | 97.6 | 91.5 | |||
| Residues in allowed region | 2.5 | 2.4 | 8.5 | |||
| Residues in outlier region | 0.2 | 0 | 0 | |||
Note: Numbers in parentheses are for the highest shell.
R merge = 100Σ|I − <I>|/Σ I, where I is the observed intensity and <I> is the average intensity from multiple observations of symmetry‐related reflection.
FIGURE 1.
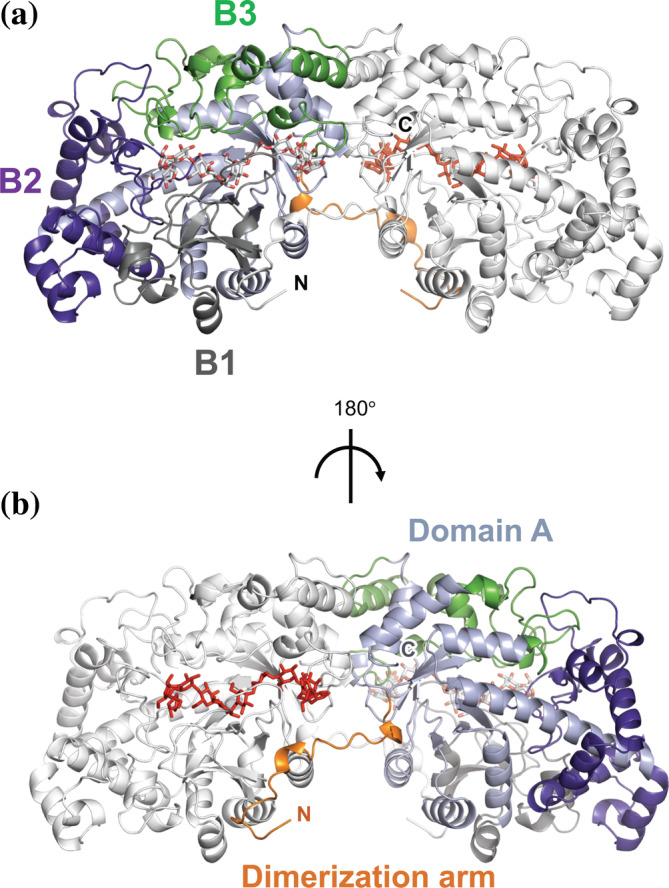
Crystal structures of potato D‐enzyme. Overview of the potato D‐enzyme (CA26 complex). Domain A and subdomains B1, B2, and B3 are colored light blue, gray, purple, and green, respectively. Dimerization arm is colored yellow. The subunit structure corresponding to the crystallographic two‐fold symmetry is colored white. Residues from CA26 are shown as stick models
FIGURE 2.
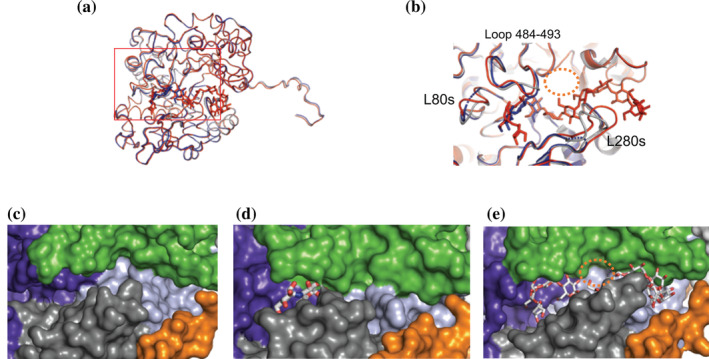
(a, b) Superposed structures of native (substrate‐free), acarbose, and CA26 complexes. (a) Overall and (b) close‐up view of the superimposed structures. Panel B is a close‐up view of the red rectangle in panel A. String models of native (substrate‐free) and complex structures of acarbose and CA26 are colored gray, blue, and red, respectively. Residues from acarbose and CA26 are shown as stick models. Loop residues 67–94 and 275–292 are labeled L80s and L280s, respectively. (c–e) Surface structures of substrate binding‐sites in native (substrate‐free) (c), acarbose (d) and CA26 (e) complexes. Proposed binding site for the acceptor glucose is shown as an orange‐dotted circle. Color representations of the surfaces are the same as in Figure 1
2.3. Acarbose complex structure
The RMSD of Cα atoms between native (substrate‐free) and acarbose complex structures was 0.2 Å, while a defined difference was observed at L80s (residues 67–94), L280s (residues 275–292), and Loop 484–493 (Figure 2; Figure S3). The movement of Loop 484–493 has been attributed to the interaction with residues from acarbose, which narrows the active site cleft (Figure 2c, 2d). A clear electron density on the F o–F c omit map, which corresponds to the carbohydrate residues from acarbose, was observed at the active site (Figure 3a). The three carbohydrate residues from acarbose, designated Acr1, Acr2, and Glc1 from the non‐reducing end, were located on subsites −3, −2, and −1, respectively 27 (Figure 3c; Figure S7). The atomic distance between the anomeric carbon (C1) of the Glc1 and the terminal oxygen at Asp321 was 1.45 Å, indicating a covalent bond among the atoms. The orientation of the Asp321 corresponded to “conformation A” in the native (substrate‐free) structure of the potato D‐enzyme. The electron density corresponding to the water molecule peripheral (4 Å radius) to the C1 atom of the Glc1 residue was not observed in the present acarbose complex structure. Glc1 has hydrogen bonds with Arg319, His420, and Asp421, and hydrophobic interactions with Tyr84 at subsite −1 in the acarbose complex structure. Similarly, the Acr2 formed hydrogen bonds with Asn485 and a main chain nitrogen atom on Ala488, and displayed hydrophobic interactions with Trp494 at subsite −2. The Acr1 hydrogen bonded with Gln490 at subsite −3 (Figure 3c). All three carbohydrate residues from acarbose conferred a stable 4C1 conformation in the complex structure.
FIGURE 3.
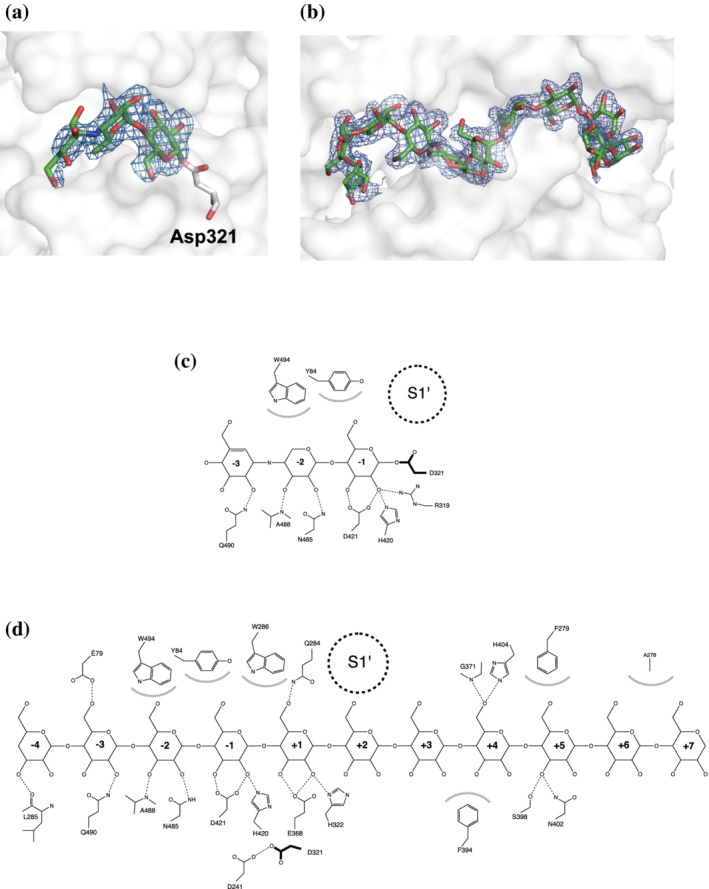
Residues from acarbose and CA26 at the binding site in the acarbose and CA26 complexes. (a, b) F o–F c omit electron density map (blue) for residues from acarbose (a) and CA26 (b) bound to potato D‐enzyme. The contour levels of the omit maps for acarbose residues and residues from CA26 are 2.5σ and 3σ, respectively. Protein surfaces (grey) are shown as transparent. (c, d) Schematic figures detailing protein‐ligand interactions for the acarbose (c) and CA26 (d) complexes. Dashed lines and gray arcs indicate hydrogen bonds and hydrophobic interactions, respectively. The supposed glucose binding pocket (S1′) is indicated by a dotted circle. For simplicity, water‐mediated interactions have been omitted
2.4. HPAEC analysis of transfer reaction
The crystal structure of the acarbose complex revealed a covalent bond between Asp321 and carbohydrates from acarbose. HPAEC analysis was performed to confirm whether this complex structure corresponds to a binding state in which the substrate‐mimicking inhibitor inhibits the catalytic reaction, or an intermediate state of the substrate in the catalytic reaction. Enzyme‐free acarbose solutions were first analyzed by HPAEC over a series of incubation times (Figure 4a). The retention time for acarbose was between that of maltotriose (G3) and maltotetraose (G4), and the chromatogram from solutions with the series of incubation times coincided. The findings indicated that the acarbose did not degrade under the experimental conditions or during the incubation. The solutions containing D‐enzyme and acarbose were incubated and analyzed by HPAEC. None of the reaction products were observed (Figure 4b). Next, enzymatic products from potato D‐enzyme with acarbose and maltotriose as donor and acceptor substrates, respectively, were analyzed by HPAEC. The chromatogram showed several peaks corresponding to products from the transfer reactions. Some of these products resulted from the transfer reactions among maltotriose (G1, G4–G7), while others were estimated to contain carbohydrate residues from acarbose (peaks marked with an asterisk after 15 min; Figure 4c). A similar chromatogram was also obtained from the concurrent addition of acarbose and maltotriose (Figure 4d). HPAEC analysis of the reaction mixture incubated with D‐enzyme and maltotriose showed only products from the transfer reactions among maltotriose (G1, G4–G7; Figure 4e).
FIGURE 4.
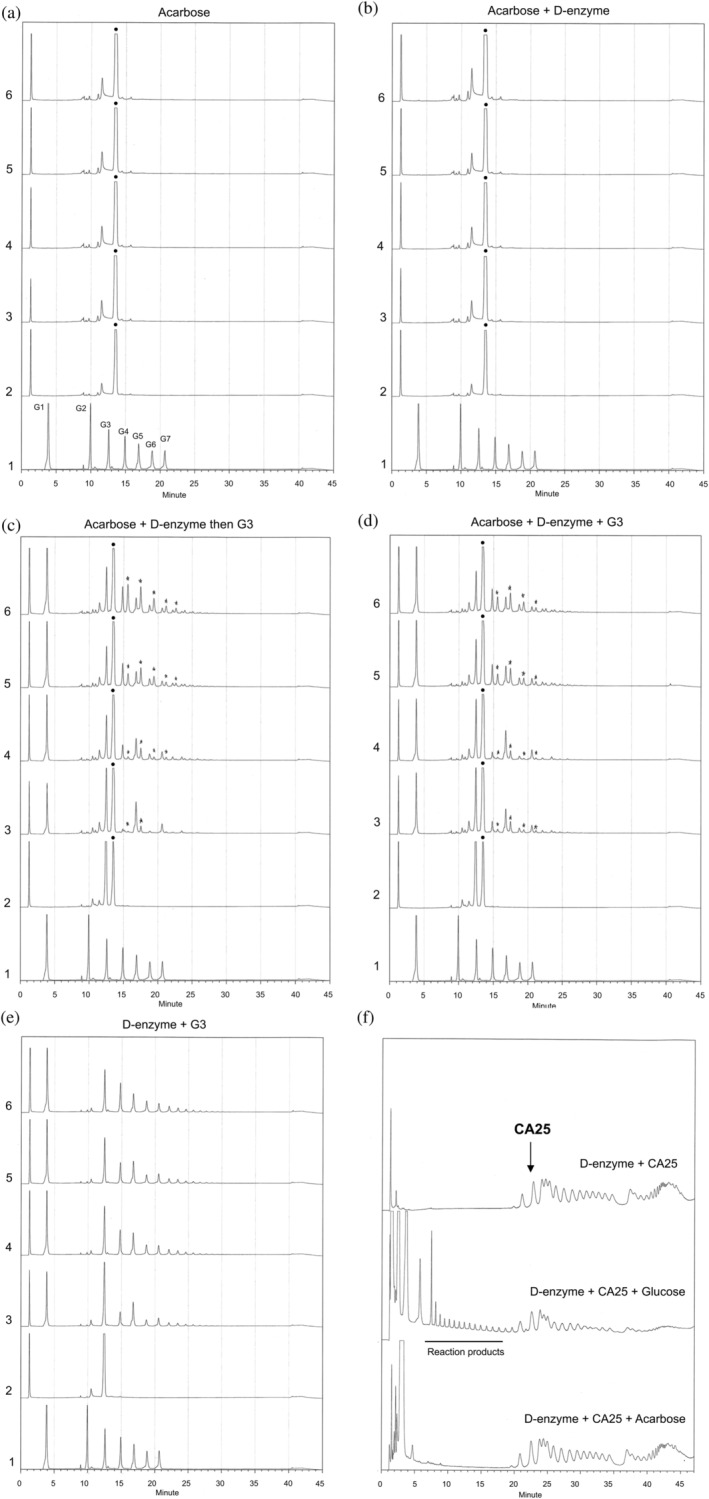
HPAEC analysis for products from transfer reaction by potato D‐enzyme. Chart 1 in panels (a)–(e) is the data for the control mixture containing glucose (G1), maltose (G2), maltotriose (G3), maltotetraose (G4), maltopentaose (G5), maltohexaose (G6), and maltoheptaose (G7). Charts 2 to 6 show the data with incubation time at 1, 5, 20, 60, and 120 min. The filled circles (●) indicate the peaks from acarbose. The star symbols (★) indicate peaks from the reaction products including acarbose residues. (a) HPAEC of acarbose. The acarbose solution was incubated without D‐enzyme and acceptor molecule. (b) HPAEC of products in the solution incubated with potato D‐enzyme and acarbose. (c) HPAEC of products from the transfer reaction with acarbose and maltotriose as donor and acceptor substrate, respectively. (d) HPAEC of products in solution incubated with a mixture of D‐enzyme, acarbose, and maltotriose. (e) HPAEC of products in solution incubated with potato D‐enzyme and maltotriose. (f) HPAEC analysis for products using CA as a substrate. Subfigures show products in the solutions incubated with (top) D‐enzyme and CA, (middle) D‐enzyme, CA, and glucose, and (bottom) D‐enzyme, CA, and acarbose. Peaks corresponding to the reaction products are underlined
To investigate activities using cycloamylose as a substrate for the potato D‐enzyme, products from the coupling reaction with CA and glucose were analyzed by HPAEC (Figure 4f). The reaction products did not appear in solutions incubated with either a mixture of CA and D‐enzyme (panel a) or a mixture of CA, D‐enzyme, and acarbose (panel c). Conversely, reaction products were observed in a solution incubated with a mixture of CA, D‐enzyme, and glucose (panel b). These results indicated that potato D‐enzyme can catalyze the coupling reaction of CA only in the presence of effective acceptor (glucose) but not in the absence of acceptor or in the presence of in‐effective acceptor (acarbose).
2.5. Complex structure with cycloamylose
HPAEC analysis confirmed well‐defined activities for the coupling reaction of CA and glucose catalyzed by potato D‐enzyme. To elucidate the binding state and reaction mechanism with CA, a structural analysis of potato D‐enzyme complexed with CA26 was performed. The crystal structure of the CA26 complex comprised one subunit and a sugar chain composed of 11 glucose residues from CA26 in its asymmetric unit (Figures 1a,b, and 2a,b,e). A clear electron density on the F o–F c omit map corresponding to the glucose residues was identified at the substrate binding cleft (Figure 3b). Crystal packing of the complex structure indicates that there is enough space for the 15 unmodeled (i.e., disordered) glucose residues adjacent to the 11 modeled glucose residues (Figure S8).
The orientation of the Asp321 catalytic residue in the CA26 complex structure corresponded to “Conformation B” in the native (substrate‐free) structure (Figure S5). The atomic distance between a carboxylate oxygen at Asp321 and the C1 atom in the glucose residue Glc +1 was 4.9 Å.
RMSD between native (substrate‐free) and CA26 complex was 0.56 Å. Defined differences were observed at L280s and L80s, where positional differences at the Cα atoms of Phe279 and Ser280 on L280s were 5.2 and 5.8 Å, respectively. The findings indicated that the movement of L80s and L280s would have been caused by the binding of CA26 to the substrate binding site in potato D‐enzyme. The aromatic ring of Phe279 was parallel with the ring of Phe394 in subdomain B3, which formed a cleft suitable for stacking with the pyranose‐ring of the CA26 substrate (Figure S9). The sugar chain was bound at subsites −4 to +7, forming the substrate binding cleft (Figure 3d) in which all of the identified glucose residues formed stable 4C1 conformations in the CA26 complex. As expected, the conformation of glucose residues in the CA26 complex was dissimilar to the crystal structure of CA26, 28 but similar to its solution structure. 29 , 30 Glucose residues at positive subsites bound at the cleft forming a gradual helix (left‐handed) with Phe279 at the center, while glucose residues at negative subsites did not form a helical structure (Figure S9). The torsion angle between Glc +6 and + 7 formed a kinked structure with an angle of 90° that would allow an interaction with Ala278 (Figure 5). Glc −3 and − 4 displayed a bowed orientation where the α‐1,4‐glucoside bond between the residues displayed a band‐flip structure, including the trans orientation, 28 , 31 attributable to Glu79 with a hydrogen bond to Glc‐3. The Ala278 and Glu79 residues were not conserved in atDPE1 or AM (Figure S10). The orientation of glucose residues at the negative side in the AM complex structure could be attributable to the interaction with Tyr54 (Figure 5c), which was not conserved in potato D‐enzyme and atDPE1 (Figure S10). This was the basis of the differences in conformation and direction of terminal‐glucose residues in structure of potato D‐enzyme complex (CA26 complex) among the complex structures (Figure 5).
FIGURE 5.
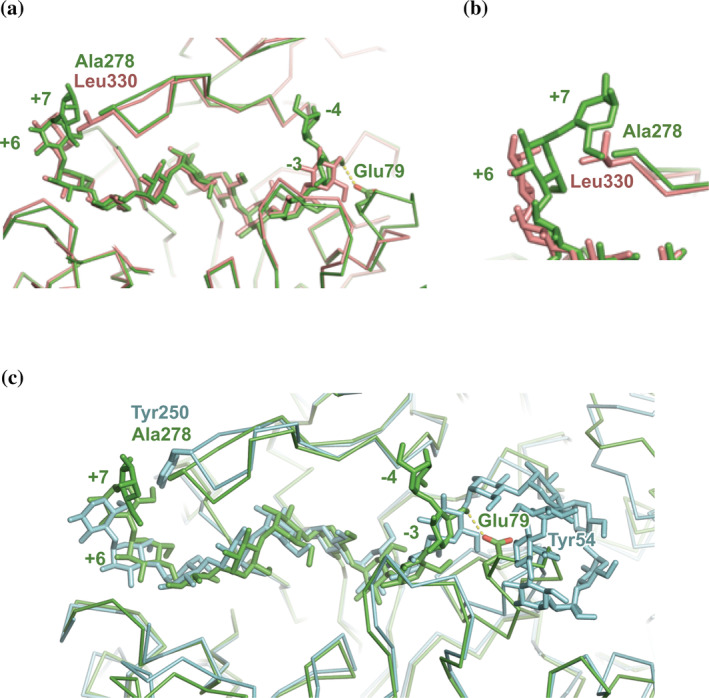
Superposition of the CA26 complex and other 4‐α‐glucanotransferases complexed with amylose and CA. (a) Superposition of the CA26 complex and atDPE1 complexed with the 9‐meric amylose (PDB code: 5CPS). The main chain tracings of D‐enzyme and atDPE1 are shown in green and pink, respectively. Residues Glu79 and Ala278 in D‐enzyme, Leu330 in atDPE1, and glucose residues are shown as stick models. The hydrogen bond between Glu79 and glucose residue is shown as a dotted line. (b) Closeup view around Ala278. (c) Superposition with the CA26 complex and AM from T. aquaticus in the complex with 17‐meric glucose residues (PDB code: 5JIW). The color representation of D‐enzyme is the same as in panel A. The main chain tracing of AM from T. aquaticus is shown in cyan. Tyr250, Tyr54, and glucose residues in the AM structure are shown as stick models
3. DISCUSSION
D‐enzyme shares many structural features with atDPE1 and AM, however, potato D‐enzyme exclusively catalyzes transglycosylation without any hydrolysis reaction. 5 The structures of the native D‐enzyme, acarbose complex, and CA26 complex revealed that D‐enzyme does not undergo large‐scale structural movement upon substrate binding. Instead, there are local movements of Loop 484–493, L80s, and L280s in the acarbose complex and L80s and L280s in the CA26 complex. The structure of the acarbose complex captured the reaction intermediate state. In contrast, CA26 complex structure showed no cleavage of CA26, which straddled subsite +1 and −1 in the active site center. The orientation of the terminal‐glucose residues binding in the CA26 complex differed from that of atDPE1 and AM. This would influence the DP of the products, which is characterized by a wide range of 17 to several hundred in potato D‐enzyme. The orientation of the sugar chain binding to AM may influence the DP of the products in the cyclization reaction. 17
Two types of orientations of the key residue Asp321 (conformations A and B) was observed in the native (substrate‐free) structure (Figure S5). Acarbose and CA26 complexes displayed conformation A or B at Asp321, respectively (Figure 6). Conformations A and B represent the active and inactive states, respectively, given the distance of the C1 atom in the donor substrate. Hence, Asp321 in acarbose and CA26 complexes could represent the active and inactive states, respectively. This was evidenced by the crystal structure of the acarbose complex; Asp321 with conformation A possessed a covalent bond with the acarbose residue forming a covalent glycosyl enzyme intermediate.
FIGURE 6.
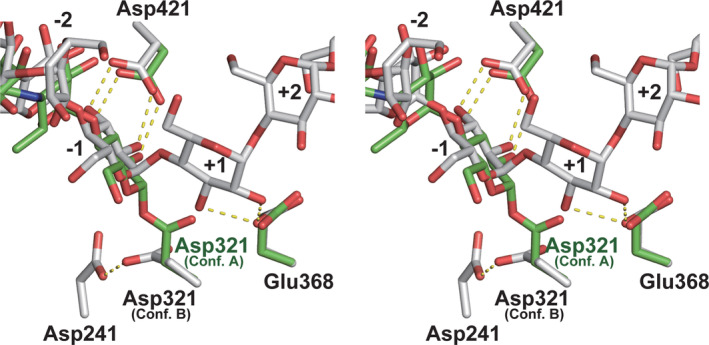
Superposition of the catalytic and carbohydrate residues in the acarbose and CA26 complexes (stereo view). Residues in the acarbose and CA26 complexes are shown as green and gray sticks, respectively. Dotted lines indicate hydrogen bonds. Glucose residues are numbered as shown in Figure 3c,d
This observation raises the question of how the active enzyme captures the intermediate state. We propose two possible reasons. First, the acarbose molecule would not function as an acceptor substrate with D‐enzyme. The acarbose residues in the complex structure is a leftover residual portion (Acr1‐Acr2‐Glc1) produced by elimination of the reducing end glucose from acarbose. The acarbose residues are located on subsites −1 to −3, which are the binding site for the donor substrate in the α‐amylase family. 16 The orientation of acarbose residues as donor substrate also corresponds to that predicted by subsite theory for the D‐enzyme from Ipomoea batatas (sweet potato). 32 On the other hand, a kinetic study of CGTase implicated subsite +2 as an important site for binding acceptor molecules. 22 Similarly, it is conceivable that the important sites for binding with an acceptor molecule in potato D‐enzyme would be near subsites +1 and +2, which likely recognize and bind the pyranose structure of glucose residues in acceptor molecules. However, the corresponding residues as acceptor molecules on subsites +1 and +2 are valienamine and 4‐amino‐4,6‐dideoxy‐α‐D‐glucose residues in acarbose, whose structures differ from that of glucose (Figure S7). For this reason, acarbose could not become an acceptor molecule. Thus, the intermediate state forming the covalent bond with a donor substrate would remain in the crystal structure of the acarbose complex, where there is not any suitable acceptor substrate. The second reason is that there is almost no potential for hydrolytic activity to occur with water as the acceptor molecule in potato D‐enzyme. 9 The enzyme's non‐hydrolytic activity is explained by the long atomic distance (5.7 Å) between the terminal oxygen at Glu368, which activates the acceptor or water molecule, and C1 in the acarbose residue. Similar inferences were also reported for AM from T. aquaticus, which has a low hydrolysis activity, whereby the terminal oxygen of Glu340 activates an acceptor molecule 5.5 Å from C1 in the acarbose residue (PDB code: 2OWC). 19 Thus, the intermediate state is stabilized without any hydrolysis in the crystal structure of the acarbose complex.
To confirm whether the crystal structure of the acarbose complex is indeed the intermediate state of the donor substrate in potato D‐enzyme, HPAEC analysis was performed. The reaction with the acarbose‐D‐enzyme complex and maltotriose (G3) as acceptor substrate produced products including acarbose residues (Figure 4c, asterisk) although no reaction products were observed from the acarbose‐D‐enzyme solution. The findings indicate that the crystal structure of the acarbose complex does not form a complex structure with the inhibitor mimicking donor substrate, but is instead associated with the formation of the intermediate state of the donor substrate, acarbose. The collective data indicate that the active D‐enzyme captures the reaction intermediate in solution and in the crystalline state due to a lack of suitable acceptor substrate and the lowest level of hydrolysis activity in the 4‐α‐glucanotransferase members.
The crystal structure of the CA26 complex indicated the inactive state, in which no cleavage of CA26 bound to subsites from −4 to +7 and an inactive orientation of Asp321 (conformation B) were observed (Figure 6). In addition, HPAEC analysis for solutions of products incubated with D‐enzyme and CA showed that D‐enzyme did not catalyze reactions having CA as the sole substrate, but instead catalyzed reactions with both CA and glucose (Figure 4f). The reactivity of potato D‐enzyme has also been reported, whereby D‐enzyme did not act on CA as substrate, but if glucose was added as acceptor molecule smaller cyclic and linear molecules were produced. 9 These results suggest that an inactive Asp321 in the CA26 complex must be activated with glucose, followed by the resumption of the coupling reaction. An “accessible pocket” would explain why the CA26 complex is the inactive state. An accessible pocket for Asp321 and Asp368 adjacent to subsite +1 was observed in the CA26 complex (Figure 2b,e), which would provide enough space to accommodate the glucose molecule. Although this is not yet any structural evidence for glucose binding to the pocket, we propose that the accessible pocket would be a glucose binding site, referred to as subsite +1′, for the coupling reaction with CA26 and glucose.
The crystal structures of potato D‐enzyme and its active site conformation, including the subsite +1′, supports our proposed mechanism for the coupling reaction with CA and glucose in potato D‐enzyme (Figure 7). Prior to the binding of CA to the active site, Asp321 orientation is in equilibrium between conformations A and B, which corresponds to the crystal structure of native (substrate‐free) (panel A). In the coupling reaction, CA initially binds to the potato D‐enzyme, which changes the orientation of Asp321 to conformation B, whereby the residues and orientation of CA correspond to the crystal structure of the CA26 complex (panel B). The glucose molecule then binds to subsite +1′, inducing a conformational change in Asp321 to the active state, represented as the “A conformation” (panels C and D). The active orientation of Asp321 establishes a covalent bond with the glucose residue (−1) of the donor substrate (panel E), whose orientation could identify the crystal structure of the acarbose complex. This is followed by the activation of the acceptor glucose molecule by Glu368 at subsite +1′, which causes a nucleophilic attack on the anomeric carbon atom (C1) in the intermediate state of the donor substrate (panels E and F). The linearized product is released and the orientation of Asp321 changes to a mixture of conformations A and B (panels F and A).
FIGURE 7.
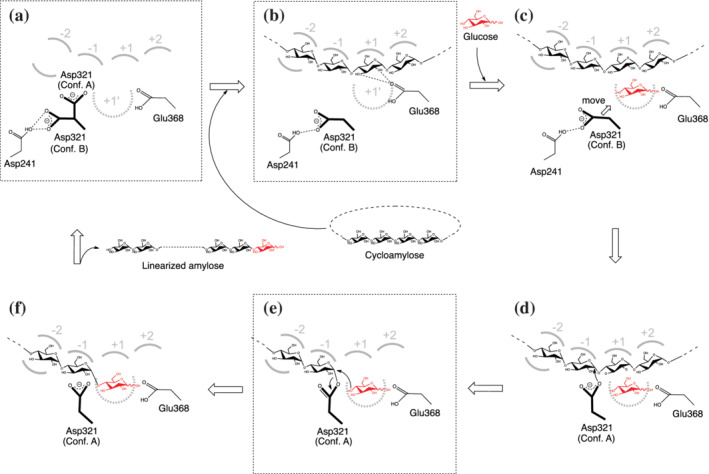
Proposed mechanism for the coupling reaction with CA and glucose in potato D‐enzyme. Only the subsites between −2 and +2 are drawn as a representative illustration. Dotted‐edge panels A, B, and E*, correspond to crystal structures of native (substrate‐free), the CA26, and acarbose complexes, respectively. *Glucose molecule at subsite +1′ is not included in the crystal structure. (a) Apo structure of potato D‐enzyme. (b) Binding of CA to potato D‐enzyme. The glucose residues from CA bind to the subsites from −4 to +7. (c) Binding of a glucose molecule as the acceptor substrate to subsite +1′ induces movement of Asp321. (d) The orientation of the Asp321 (conformation A) leads to the formation of the covalent bond to C1 of the glucose residue at subsite −1. (e) Nucleophilic attack of the glucose molecule (acceptor substrate) activated by Glu368. (f) Linearized product in potato D‐enzyme
The reaction mechanism accompanying the binding of glucose at subsite +1′ occurs only with CA as donor‐substrate. In the case of binding the reducing end of linear glucans or acarbose as donor‐substrates, the reaction would involve the elimination of glucose at reducing end of linear glucans and the formation of a covalently bonded intermediate, including the active orientation of Asp321 (conformation A) without binding of glucose at subsite +1′. In contrast, when binding CA as a donor‐substrate, Asp321 would maintain its inactive orientation (conformation B) until the glucose molecule binds at subsite +1′.
The residues and structures that form the proposed subsite +1′ in the potato D‐enzyme are highly conserved in atDPE1 and AM. Although the coupling reaction between CA and glucose reportedly occurs only through potato D‐enzyme catalysis, 9 the structural similarities at subsite +1′ indicate that coupling reactions by other enzymes of the α‐amylase family could also occur with the same reaction mechanism illustrated in Figure 7. Arg319, which is highly conserved among 4‐α‐glucanotransferases (Figure S10), forms hydrogen bonds with Asp321 in the CA26 complex. Arg319 appears to form the back wall of the putative glucose binding pocket. Therefore, Arg319 is likely to be involved in the regulation of the conformational change of Asp321 upon glucose binding. In addition, the mechanism of the coupling reaction in Figure 7 could adapt to that of the disproportionation reaction in Equation (1), where the glucose molecule is replaced with the non‐reducing end glucose of the linear glucan as the acceptor substrate, that is, (α‐1,4‐glucan)m + Glucose ≥ (α‐1,4‐glucan)m–x + (α‐1,4‐glucan)x‐Glucose.
This CA26 structure represents the first complex structure as the pre‐reaction state for the coupling reaction with CA and glucose (Figure 7b). Structural analyses of complex structures using CA as substrates were also reported in AM and atDPE1, but the experimental conditions differed from this study. The AM complex study used an inactive double mutant (D293A/D395N) of AM. 17 The atDPE1 structure using CAs displayed a covalently bound intermediate (data set name: CAM‐A/B, PDB code: 5CQ1). 16 The basis of the structural differences between the CA26 and the atDPE1 complexes are unclear. They might be the consequence of the different characteristics between two enzymes and/or the soaking times with CA to prepare each complex crystal (CA26 complex: 10 min, atDPE1 complex: overnight 16 ). The 10‐min soaking time is standard in preparing complex structures of CA26, and so was sufficient for our structural analyses of the potato D‐enzyme.
The unique characteristics of potato D‐enzyme could be optimized to prevent unnecessary reactions, including hydrolysis. If the potato D‐enzyme catalyzed enzymatic reactions with fractional hydrolysis, it would cause steady starch degradation, resulting in reduced crop productivity. Thus, the reaction mechanism preventing hydrolysis would be particularly important for crops. The crystal structures of potato D‐enzyme and results of HPAEC analysis provide insight into the mechanism of the reaction catalyzed by potato D‐enzyme, particularly those involving the coupling reaction with CA and glucose as donor and acceptor substrates, respectively. While D‐enzyme is essential in starch degradation in plants, 3 , 4 the physiological role of CA in plants remains unclear. Key questions that must be investigated include physiological roles of CA synthesis and the coupling reaction of CA and glucose in plants, in addition to confirmation of the coupling reaction in other enzymes of the α‐amylase family.
4. MATERIALS AND METHODS
4.1. Expression and purification of potato D‐enzyme
Escherichia coli BL21 (DE3) cells (Novagen, Burlington, MA) were transformed with the pET‐21d plasmid (Novagen) containing the potato D‐enzyme gene. 33 The cells were cultured in Terrific broth (2.4% yeast extract, 1.2% tryptone, 0.45% glycerol, 1.3% K2HPO4, 0.38% KH2PO4), and the expression of the protein was induced for 60 hr at 18°C without addition of isopropylthiogalactoside. The pelleted cells were suspended in a sonication buffer (1 mM EDTA; 100 mM NaCl; 50 mM phosphate buffer, pH 7.0) and disrupted by sonication. The cell debris was pelleted by centrifugation (12,000 × g for 20 min at 4°C). The supernatant was collected, and ammonium sulfate was added to a final concentration of 550 mM. After 1 hr at 4°C, the solution was centrifuged at 12,000 × g for 10 min at 4°C and the supernatant was loaded onto a Phenyl‐Toyopearl 650 M column (1.6 × 8 cm; Tosoh, Tokyo, Japan) and eluted with a linear gradient of 550 to 0 mM ammonium sulfate in the same buffer. D‐enzyme fractions were pooled and dialyzed against 50 mM Tris–HCl solution at pH 7.0. The dialysate was loaded onto a DEAE‐Toyopearl 650S column (0.9 × 8 cm; Tosoh) equilibrated with the same buffer. The enzyme was eluted with a linear gradient of 30 to 120 mM NaCl in the same buffer. D‐enzyme fractions were pooled and dialyzed against 50 mM Tris–HCl solution at pH 8.0. The dialysate was loaded onto a DEAE‐Toyopearl 650S column (0.9 × 8 cm; Tosoh) equilibrated with the same buffer. The enzyme was eluted with a linear gradient of 30 to 150 mM NaCl in the same buffer. The D‐enzyme fractions were observed on SDS‐PAGE, concentrated to 10 mg/ml, and the buffer was exchanged to a solution of 5 mM Tris–HCl, pH 7.6. The method for labeling the D‐enzyme with selenomethionine and its purification has been previously described. 33
4.2. Transferase activity of D‐enzyme
Transferase activities were measured with maltotriose (G3) as a substrate. The reaction mixture was comprised of 1% (w/v) maltotriose, 5 mM Tris–HCl (pH 7.6), and 0.57 mg of the purified D‐enzymes, in a total volume of 120 μl. After incubation at 30°C for 10 min, the reaction was discontinued by heating at 100°C. The amount of glucose produced was measured by a glucose oxidase method. 20
4.3. Preparation of CA26
CA26 was synthesized by the enzymatic reaction of AM from T. aquatics with amylose followed by incubation at 70 °C for 90 min. The purification method for CA26 followed a previously reported protocol 34 using reversed‐phase chromatography with a refractive index detector (ShodexSE‐61) and an LC‐6 AD pump (Shimadzu, Kyoto, Japan) on a DAISOPAK SP‐120‐5‐ODS‐BP column (20 × 250 mm, Osaka Soda Co., Ltd., Osaka, Japan). The molecular weight and purity of CA 26 was evaluated by matrix‐assisted laser‐desorption time of flight mass spectroscopy. The purified CA26 was freeze‐dried and used for crystallization.
4.4. X‐ray crystallographic analysis of potato D‐enzyme
4.4.1. Crystallization
Imamura et al. 33 described crystallization of D‐enzyme labeled with selenomethionine. D‐enzyme crystals were grown at 4°C for 7 to 10 days by the hanging‐drop vapor diffusion method. Crystals of substrate‐free D‐enzyme (Native (substrate‐free)) were obtained by mixing 2 μl of protein solution with 2 μl of reservoir solution (12% (w/v) polyethylene glycol 8,000; PEG8000, Hampton Research, Aliso Viejo, CA), 100 mM HEPES at pH 7.6, and 100 mM CaCl2). D‐enzyme crystals complexed with acarbose (acarbose complex) and CA26 (CA26 complex) were obtained by soaking native (substrate‐free) crystals in the reservoir solution containing 15 mM acarbose and 25 mM CA26 for 10 min, respectively. Each of crystals were then soaked in reservoir solutions containing 27% glycerol for 5 s and frozen with liquid nitrogen.
4.4.2. Data collection, structure solution, and refinement
A method for data collection of D‐enzyme labeled with selenomethionine has been previously described. 33 Diffraction data from native (substrate‐free) and CA26 complex crystals were collected via beamlines NW‐12A and BL‐5A at Photon Factory (Tsukuba, Japan) using synchrotron radiation with Quantum210 and 315 detectors, respectively (ADSC, Poway, CA). Diffraction data from the acarbose complex was collected on the beamline BL44XU at SPring‐8 (Hyogo, Japan) using synchrotron radiation and a DIP6040 imaging‐plate detector (MAC Science/Bruker AXS; Bruker, Billerica, MA). Measurements were performed at 100 K with λ = 1.000 Å (native (substrate‐free) and CA26 complex), and λ = 0.9000 Å (acarbose complex). The data sets from the native (substrate‐free) and CA26 complexes were processed with mosflm 35 and scaled with SCALA, 36 while those from the acarbose complex were processed with Denzo and SCALEPACK. 37 All data sets belonged to the space group C2221 with one molecule per asymmetric unit. The D‐enzyme structure was solved by the multiwavelength anomalous diffraction method with selenomethionyl D‐enzyme crystal. Initial phases were determined by the SOLVE program 38 and phase improvement by density modification was performed using the RESOLVE program. 39 A model was then obtained by automatic tracing with the ARP/wARP program. 40 The structure was then modeled by O 41 and refined using the Crystallography & NMR System. 42 Phase information values for the native (substrate‐free) and complex structures were calculated by molecular replacement methodology using the Molrep program 43 with the selenomethionyl structure as a search model. The acarbose and CA26 models were fitted into the substrate binding sites according to the difference electron density map. Refinements to the native (substrate‐free) and complex structures were performed using the Refmac5 program, 44 with 5% of the data having been set aside as a free set. The refinement statistics are shown in Table 2. Figures 1, 2, 3, 5, and 6 were produced using the PyMOL (version 2.3) software (http://www.pymol.org).
4.4.3. HPAEC analysis
HPAEC analysis was performed to confirm the enzymatic activity of potato D‐enzyme with acarbose and maltotriose as donor and acceptor substrates. First, a solution including potato D‐enzyme and acarbose was pre‐incubated to produce a complex structure with donor substrate, which corresponded to the crystal structure of the acarbose complex. Maltotriose as the acceptor substrate was then added to the solution and incubated over a series of incubation times. Following incubation, the reaction was discontinued and the products were analyzed by HPAEC. Practical procedures are described below. Acarbose solution (60 μl of 1% acarbose in 5 mM Tris–HCl) and 40 μl of protein solution (5 mg/ml D‐enzyme in 5 mM Tris–HCl, pH 7.5) were mixed and incubated at 30°C for 1 hr (pre‐incubation). After the pre‐incubation, 100 μl of 4% acceptor substrate was added to each of five replicates of the solution and incubated at 30°C for 1, 5, 20, 60, and 120 min. Maltotriose was used as the acceptor substrate. The reaction was discontinued by heating at 100°C for 10 min. Reaction products were analyzed with HPAEC using a Dinex BioLC model 4000i on Carbopac PA‐100 column (250 × 4 mm, Thermo Fisher Scientific, Waltham, MA) coupled with a ModelPAD‐II pulsed amperometric detector (Dionex Corp., Sunnyvale, CA) (Figure 4c). For comparison, HPAEC analysis for the solution incubated only with acarbose (without D‐enzyme and acceptor molecule) was performed (Figure 4a). Additionally, HPAEC analysis for solutions incubated with D‐enzyme and acarbose (Figure 4b), D‐enzyme and maltotriose (Figure 4e), or a mixture of D‐enzyme, acarbose, and maltotriose (Figure 4d) were also performed.
For the coupling reaction using CA as donor substrate, 60 μl of 1% CA (polymerization unit; 24–50) solution, 40 μl of protein solution (0.5 mg/ml D‐enzyme in 5 mM Tris–HCl at pH 7.5), and 100 μl of 1% glucose or acarbose solution were mixed and incubated at 30°C for 3 hr. After the incubation, the reactions were terminated by heating at 100°C for 10 min, followed by HPAEC analysis (Figure 4f panels b (glucose) and c (acarbose)). Similarly, the coupling reaction without the acceptor molecule was also performed (Figure 4f panel a).
ACCESSION CODES
Atomic coordinates and structural parameters of D‐enzyme were deposited in the Protein Data Bank, www.pdb.org (PDB codes: D‐enzyme/substrate‐free, 7COV; D‐enzyme/acarbose, 6LX1; D‐enzyme/CA26, 6LX2).
AUTHOR CONTRIBUTIONS
Kayo Imamura: Conceptualization; data curation; formal analysis; investigation; methodology; project administration; supervision; validation; visualization; writing‐original draft; writing‐review and editing. Takanori Matsuura: Methodology. Atsushi Nakagawa: Methodology. Shinichi Kitamura: Methodology. Masami Kusunoki: Methodology; supervision. Takeshi Takaha: Formal analysis; funding acquisition; methodology; resources. Hideaki Unno: Data curation; formal analysis; methodology; validation; visualization; writing‐original draft; writing‐review and editing.
CONFLICT OF INTEREST
The authors declare no potential conflict of interest.
Supporting information
Figure S1 Schemes of the reactions shown in Equation (1) and (2) and those catalyzed by D‐enzymes
Figure S2 Presumed reaction mechanism for the α‐amylase family
Figure S3 Topology diagram for potato D‐enzyme
Figure S4 Superposition of potato D‐enzyme (native (substrate‐free)) and atDPE1 (apo form) from Arabidopsis thaliana (PDB code: 5CPQ)
Figure S5 Catalytic residues in potato D‐enzyme (Native (substrate‐free))
Figure S6 Molecular surface of the subunit structure (Native (substrate‐free))
Figure S7 Molecular structure of acarbose
Figure S8 Crystal packing of CA26 complex
Figure S9 Ribbon and stick models around Phe279 and Phe394 in Native (substrate‐free) and CA26 complex
Figure S10 Structure‐based sequence alignment with potato D‐enzyme atDPE1 from A. thaliana and AM from Thermus aquaticus
ACKNOWLEDGMENTS
We thank the staff at the Photon Factory and SPring‐8 for developing an excellent beamline and for assistance with the data collection. This work was performed using beamlines BL‐5A and AR‐NW12A at Photon Factory (Tsukuba, Japan) and the Osaka University beamline BL44XU at SPring‐8 (Harima, Japan) (Proposal No. C04A44XU‐7132‐N). This work was supported by a grant from the Program for the Promotion of Basic Research Activities for Innovative Bioscience in Japan. Kayo Imamura greatly appreciates Dr. Yasunori Nitta for support, advice and encouragement all through this project.
Imamura K, Matsuura T, Nakagawa A, et al. Structural analysis and reaction mechanism of the disproportionating enzyme (D‐enzyme) from potato. Protein Science. 2020;29:2085–2100. 10.1002/pro.3932
Kayo Imamura and Hideaki Unno contributed equally to this study.
Funding information Program for the Promotion of Basic Research Activities for Innovative Bioscience in Japan
Contributor Information
Kayo Imamura, Email: imamura.kayo.3w@kyoto-u.ac.jp.
Hideaki Unno, Email: unno@nagasaki-u.ac.jp.
REFERENCES
- 1. Peat S, Whelan WJ, Rees WR. 10. The enzymic synthesis and degradation of starch. Part XX. The disproportionating enzyme (D‐enzyme) of the potato. J Chem Soc. 1956;0:44–53. [Google Scholar]
- 2. Lin TP, Preiss J. Characterization of d‐enzyme (4‐alpha‐glucanotransferase) in Arabidopsis leaf. Plant Physiol. 1988;86:260–265. [DOI] [PMC free article] [PubMed] [Google Scholar]
- 3. Lütken H, Lloyd JR, Glaring MA, et al. Repression of both isoforms of disproportionating enzyme leads to higher malto‐oligosaccharide content and reduced growth in potato. Planta. 2010;232:1127–1139. [DOI] [PubMed] [Google Scholar]
- 4. Zeeman SC, Smith SM, Smith AM. The breakdown of starch in leaves. New Phytol. 2004;163:247–261. [DOI] [PubMed] [Google Scholar]
- 5. Takaha T, Smith SM. The functions of 4‐alpha‐glucanotransferases and their use for the production of cyclic glucans. Biotechnol Genet Eng Rev. 1999;16:257–280. [DOI] [PubMed] [Google Scholar]
- 6. Terada Y, Yanase M, Takata H, Takaha T, Okada S. Cyclodextrins are not the major cyclic alpha‐1,4‐glucans produced by the initial action of cyclodextrin glucanotransferase on amylose. J Biol Chem. 1997;272:15729–15733. [DOI] [PubMed] [Google Scholar]
- 7. Fujii H, Shin‐Ya M, Takeda S, et al. Cycloamylose‐nanogel drug delivery system‐mediated intratumor silencing of the vascular endothelial growth factor regulates neovascularization in tumor microenvironment. Cancer Sci. 2014;105:1616–1625. [DOI] [PMC free article] [PubMed] [Google Scholar]
- 8. Toita S, Morimoto N, Akiyoshi K. Functional cycloamylose as a polysaccharide‐based biomaterial: Application in a gene delivery system. Biomacromolecules. 2010;11:397–401. [DOI] [PubMed] [Google Scholar]
- 9. Takaha T, Yanase M, Takata H, Okada S, Smith SM. Potato D‐enzyme catalyzes the cyclization of amylose to produce cycloamylose, a novel cyclic glucan. J Biol Chem. 1996;271:2902–2908. [DOI] [PubMed] [Google Scholar]
- 10. Tantanarat K, O'Neill EC, Rejzek M, Field RA, Limpaseni T. Expression and characterization of 4‐α‐glucanotransferase genes from Manihot esculenta Crantz and Arabidopsis thaliana and their use for the production of cycloamyloses. Process Biochem. 2014;49:84–89. [Google Scholar]
- 11. Terada Y, Fujii K, Takaha T, Okada S. Thermus aquaticus ATCC 33923 amylomaltase gene cloning and expression and enzyme characterization: Production of cycloamylose. Appl Environ Microbiol. 1999;65:910–915. [DOI] [PMC free article] [PubMed] [Google Scholar]
- 12. MacGregor EA, Janecek S, Svensson B. Relationship of sequence and structure to specificity in the alpha‐amylase family of enzymes. Biochim Biophys Acta. 2001;1546:1–20. [DOI] [PubMed] [Google Scholar]
- 13. Kuriki T, Imanaka T. The concept of the alpha‐amylase family: Structural similarity and common catalytic mechanism. J Biosci Bioeng. 1999;87:557–565. [DOI] [PubMed] [Google Scholar]
- 14. Uitdehaag JC, Mosi R, Kalk KH, Veen BA van der, Dijkhuizen L, Withers SG, Dijkstra BW (1999) X‐ray structures along the reaction pathway of cyclodextrin glycosyltransferase elucidate catalysis in the alpha‐amylase family. Nat Struct Biol 6:432–436. [DOI] [PubMed] [Google Scholar]
- 15. Ishii N, Haga K, Yamane K, Harata K. Crystal structure of alkalophilic asparagine 233‐replaced cyclodextrin glucanotransferase complexed with an inhibitor, acarbose, at 2.0 A resolution. J Biochem. 2000;127:383–391. [DOI] [PubMed] [Google Scholar]
- 16. O'Neill EC, Stevenson CEM, Tantanarat K, et al. Structural dissection of the maltodextrin disproportionation cycle of the Arabidopsis Plastidial Disproportionating enzyme 1 (DPE1). J Biol Chem. 2015;290:29834–29853. [DOI] [PMC free article] [PubMed] [Google Scholar]
- 17. Roth C, Weizenmann N, Bexten N, et al. Amylose recognition and ring‐size determination of amylomaltase. Sci Adv. 2017;3:e1601386. [DOI] [PMC free article] [PubMed] [Google Scholar]
- 18. Przylas I, Terada Y, Fujii K, Takaha T, Saenger W, Sträter N. X‐ray structure of acarbose bound to amylomaltase from Thermus aquaticus. Implications for the synthesis of large cyclic glucans. Eur J Biochem/FEBS. 2000;267:6903–6913. [DOI] [PubMed] [Google Scholar]
- 19. Barends TRM, Bultema JB, Kaper T, Maarel MJEC v d, Dijkhuizen L, Dijkstra BW. Three‐way stabilization of the covalent intermediate in amylomaltase, an alpha‐amylase‐like transglycosylase. J Biol Chem. 2007;282:17242–17249. [DOI] [PubMed] [Google Scholar]
- 20. Miwa I, Okudo J, Maeda K, Okuda G. Mutarotase effect on colorimetric determination of blood glucose with ‐D‐glucose oxidase. Clin Chim Acta. 1972;37:538–540. [DOI] [PubMed] [Google Scholar]
- 21. Takaha T, Yanase M, Okada S, Smith SM. Disproportionating enzyme (4‐alpha‐glucanotransferase; EC 2.4.1.25) of potato. Purification, molecular cloning, and potential role in starch metabolism. J Biol Chem. 1993;268:1391–1396. [PubMed] [Google Scholar]
- 22. van der VBA, Leemhuis H, Kralj S, Uitdehaag JC, Dijkstra BW, Dijkhuizen L. Hydrophobic amino acid residues in the acceptor binding site are main determinants for reaction mechanism and specificity of cyclodextrin‐glycosyltransferase. J Biol Chem. 2001;276:44557–44562. [DOI] [PubMed] [Google Scholar]
- 23. Krissinel E, Henrick K. Inference of macromolecular assemblies from crystalline state. J Mol Biol. 2007;372:774–797. [DOI] [PubMed] [Google Scholar]
- 24. Machius M, Wiegand G, Huber R. Crystal structure of calcium‐depleted bacillus licheniformis alpha‐amylase at 2.2 a resolution. J Mol Biol. 1995;246:545–559. [DOI] [PubMed] [Google Scholar]
- 25. Lawson CL, Montfort R v, Strokopytov B, et al. Nucleotide sequence and X‐ray structure of cyclodextrin glycosyltransferase from Bacillus circulans strain 251 in a maltose‐dependent crystal form. J Mol Biol. 1994;236:590–600. [DOI] [PubMed] [Google Scholar]
- 26. Mikami B, Iwamoto H, Malle D, et al. Crystal structure of pullulanase: Evidence for parallel binding of oligosaccharides in the active site. J Mol Biol. 2006;359:690–707. [DOI] [PubMed] [Google Scholar]
- 27. Davies GJ, Wilson KS, Henrissat B. Nomenclature for sugar‐binding subsites in glycosyl hydrolases. Biochem J. 1997;321:557–559. [DOI] [PMC free article] [PubMed] [Google Scholar]
- 28. Gessler K, Usón I, Takaha T, et al. V‐Amylose at atomic resolution: X‐ray structure of a cycloamylose with 26 glucose residues (cyclomaltohexaicosaose). Proc Natl Acad Sci U S A. 1999;96:4246–4251. [DOI] [PMC free article] [PubMed] [Google Scholar]
- 29. Kitamura S. Cyclic oligosaccharides and polysaccharides. In: Semlyen JA, Anthony J, editors. Dordrecht: Springer Netherlands, 2002; p. 125–160. 10.1007/0-306-47117-5_4. [DOI] [Google Scholar]
- 30. Kitamura S, Isuda H, Shimada J, et al. Conformation of cyclomaltooligosaccharide (“cycloamylose”) of dp21 in aqueous solution. Carbohydr Res. 1997;304:303–314. [Google Scholar]
- 31. Jacob J, Geßler K, Hoffmann D, et al. Spannungsinduzierte “Band‐Flips” in Cyclodecaamylose und höheren Homologen. Angew Chem. 1998;110:626–629. [Google Scholar]
- 32. Suganuma T, Setoguchi S, Fujimoto S, Nagahama T. Analysis of the characteristic action of D‐enzyme from sweet potato in terms of subsite theory. Carbohydr Res. 1991;212:201–212. [Google Scholar]
- 33. Imamura K, Matsuura T, Ye Z, et al. Crystallization and preliminary X‐ray crystallographic study of disproportionating enzyme from potato. Acta Cryst F. 2005;61:109–111. [DOI] [PMC free article] [PubMed] [Google Scholar]
- 34. Koizumi K, Sanbe H, Kubota Y, Terada Y, Takaha T. Isolation and characterization of cyclic alpha‐(1—>4)‐glucans having degrees of polymerization 9‐31 and their quantitative analysis by high‐performance anion‐exchange chromatography with pulsed amperometric detection. J Chromatogr A. 1999;852:407–416. [DOI] [PubMed] [Google Scholar]
- 35. Steller I, Bolotovsky R, Rossmann MG, IUCr (1997) An algorithm for automatic indexing of oscillation images using Fourier analysis. J Appl Cryst 30:1036–1040. [Google Scholar]
- 36. Evans P. Scaling and assessment of data quality. Acta Crystallogr. 2006;D62:72–82. [DOI] [PubMed] [Google Scholar]
- 37. Otwinowski Z, Minor W. DENZO and SCALEPACK In: Rossmann MG, Arnold E, editors. International tables for crystallography volume F: Crystallography ofbiological macromolecules. Netherlands: Springer, 2001; p. 226–235. [Google Scholar]
- 38. Terwilliger TC, Berendzen J. Automated MAD and MIR structure solution. Acta Cryst D. 1999;55:849–861. [DOI] [PMC free article] [PubMed] [Google Scholar]
- 39. Terwilliger TC. Maximum‐likelihood density modification. Acta Crystallogr. 2000;D56:965–972. [DOI] [PMC free article] [PubMed] [Google Scholar]
- 40. Perrakis A, Morris R, Lamzin VS. Automated protein model building combined with iterative structure refinement. Nat Struct Biol. 1999;6:458–463. [DOI] [PubMed] [Google Scholar]
- 41. Jones TA, Zou JY, Cowan SW, Kjeldgaard M. Improved methods for building protein models in electron density maps and the location of errors in these models. Acta Cryst A. 1991;47:110–119. [DOI] [PubMed] [Google Scholar]
- 42. Brünger AT, Adams PD, Clore GM, et al. Crystallography & NMR system: A new software suite for macromolecular structure determination. Acta Cryst D. 1998;54:905–921. [DOI] [PubMed] [Google Scholar]
- 43. Vagin A, Teplyakov A. MOLREP: An automated program for molecular replacement. J Appl Cryst. 1997;30:1022–1025. [Google Scholar]
- 44. Murshudov GN, Vagin AA, Dodson EJ. Refinement of macromolecular structures by the maximum‐likelihood method. Acta Cryst D. 1997;53:240–255. [DOI] [PubMed] [Google Scholar]
Associated Data
This section collects any data citations, data availability statements, or supplementary materials included in this article.
Supplementary Materials
Figure S1 Schemes of the reactions shown in Equation (1) and (2) and those catalyzed by D‐enzymes
Figure S2 Presumed reaction mechanism for the α‐amylase family
Figure S3 Topology diagram for potato D‐enzyme
Figure S4 Superposition of potato D‐enzyme (native (substrate‐free)) and atDPE1 (apo form) from Arabidopsis thaliana (PDB code: 5CPQ)
Figure S5 Catalytic residues in potato D‐enzyme (Native (substrate‐free))
Figure S6 Molecular surface of the subunit structure (Native (substrate‐free))
Figure S7 Molecular structure of acarbose
Figure S8 Crystal packing of CA26 complex
Figure S9 Ribbon and stick models around Phe279 and Phe394 in Native (substrate‐free) and CA26 complex
Figure S10 Structure‐based sequence alignment with potato D‐enzyme atDPE1 from A. thaliana and AM from Thermus aquaticus