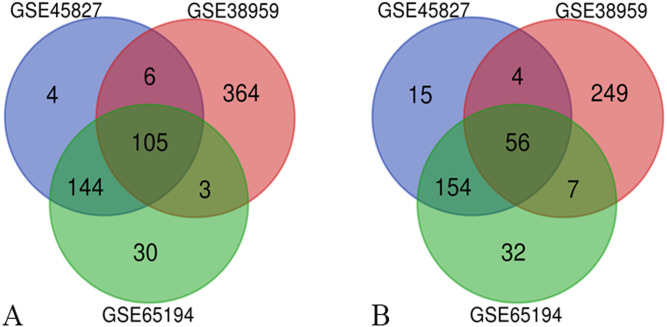
Figure 1. Venn diagrams of the differentially expressed genes (DEGs).
Venn diagrams of the differentially expressed genes (DEGs) from three independent data sets (GSE45827, GSE38959, GSE65194). (A) a total of 105 up-regulated DEGs were identified and (B) 56 down-regulated DEGs were identified, using adjust P value < 0.01 and |logFC| ≥ 2 as cut-off criteria.

