Abstract
Hyporheic zones contribute to lower temperatures in many rivers, creating a longitudinal heterogeneous array of thermal refuges. In this study, we had the unique opportunity to show temperature reduction along actual hyporheic zone pathlines in a large river system that contribute to the maintenance of refuges through discharge into off-channel habitats. Temperature was monitored in a dense network of wells that were located along pathlines in small islands, from a calibrated ground-water flow model. Temperature along one 600-m pathline was reduced about 7 °C. Among three islands that were adjacent to the river, the northern two showed exponential decrease in temperature with distance, with fitted thermal Péclet numbers of 2.7 and 6.5, while the southern island showed no significant decrease. We suggest this is due to the higher infiltration rate in the wet season in this larger, more mature island, which suppresses hyporheic flow in the wet season.
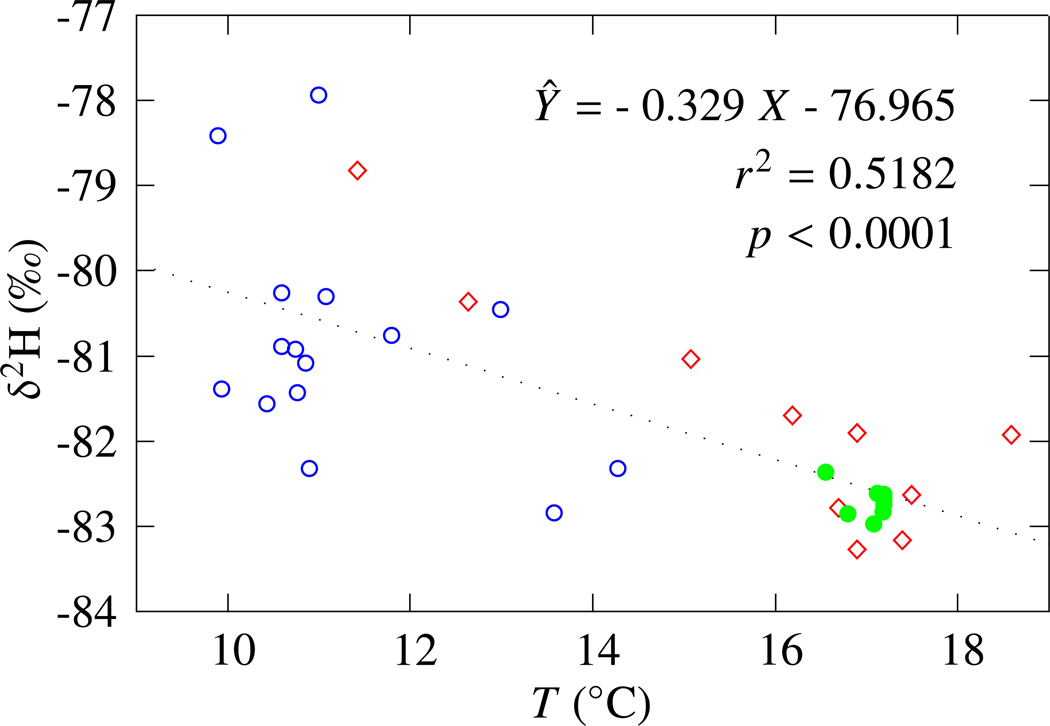
Stable isotope sampling showed that values of δ2H were higher in areas where we observed lower temperatures. The overall relationship of δ2H versus temperature was significant with a slope of −0.329. This implies that lower temperatures are associated with water that has had contact with deeper groundwater or that lower temperatures have been affected by local rainfall infiltration, or water that has entered the hyporheic zone in winter. These findings are important because they allow estimation of the temperature benefit that may be achieved in similar geomorphic settings, providing implications for riparian restoration.
1. Introduction
The Clean Water Act (33 U.S.C. §§1251–1387) calls for the restoration and maintenance of the “chemical, physical, and biological integrity of the Nation’s waters.” This manifests itself in the Pacific Northwest through the goal to protect fresh water habitat of salmon and trout. Key to meeting this is protecting and restoring the thermal regime that provides the cold water critical to the survival of these fish. The summer period when rivers and streams warm is when sources of cold water are most critical to the support of salmon and trout. The temperature thresholds for salmonids are well known (U.S Environmental Protection Agency, 2003, and references therein). Salmonids are cold water species which can thermoregulate by moving to cooler areas to maintain temperature requirements.
The influence of groundwater mixing with discharge back to rivers (hyporheic flow) contributes to a spatially heterogeneous thermal regime, buffering temperature changes along large river riparian corridors. This creates local cool water refuges for anadromous fish (Ligon et al., 1999; Ebersole et al., 2001, 2003; McCullough et al., 2009; Krause et al., 2011b; Ebersole et al., 2015). Somewhat analogous patterns have been observed with regard to interstitial invertebrate habitat (Krause et al., 2011a). Some studies have related the lower temperature habitats to geomorphological features and longitudinal profiles (e.g., Ebersole et al., 2015; Fullerton et al., 2015; Neumann and Curtis, 2016; Ouellet et al., 2017, and references therein).
For large rivers, the cooling benefit is not thought to have a dramatic effect on the temperature of the entire river, but the localized benefits in areas that can serve as cold water refuges in an otherwise warmer river are an important ecological resource (Nielsen et al., 1994; Burkholder et al., 2008; Arrigoni et al., 2008; Torgersen et al., 2012). Restoration efforts have been shown to enhance this effect (Poole and Berman, 2001; Stanford et al., 2002; Singh et al., 2018).
Our goal in this paper was to examine temperature reduction along a typical corridor of the Willamette River at Green Island. This “island” actually consists of numerous small islands and their associated cutoffs and alcoves that have been shown to induce hyporheic flow due to the natural geomorphic evolution of this dynamic anastomosing system (Faulkner et al., 2012). Other rivers exist which have these characteristics, and are shown to have temperature controls strongly related to groundwater-surface water interactions (e.g., see Mosley, 1983; Uehlinger et al., 2003; Shope et al., 2012). Arscott et al. (2001) studied thermal characteristics of five study reaches, and noted the importance of groundwater upwelling in maintaining lower temperatures in summertime in certain reaches. Our study site on the Willamette River is similar to their lowland meandering floodplain. It is indicative of the natural geomorphic evolution of the entire lower river system with cutoffs developing due to avulsion of meanders which create small islands (Dykaar and Wigington, 2000; Wallick et al., 2007).
The river itself supports several runs of salmon. It flows through the most populous part of Oregon, with pressures from growth, industry, agriculture and forestry having significantly altered the natural thermal regime. The Willamette is impaired for water temperature in the summer when the temperatures were high enough to threaten the survival of salmonids (Oregon Department of Environmental Quality, 2006).
Historically, geologists and geophysicists have regarded temperature variation in groundwater with interest to the combined effects of geothermal gradient and heat conduction and diffusion (Bredehoeft and Papadopulos, 1965; Domenico and Schwartz, 1990). Here, we adapt these ideas to predict cooling in the hyporheic zone (e.g., see Anderson, 2005; Caissie et al., 2014). In this article, we present the results of monitoring temperature along hyporheic pathlines in a section of the Willamette River riparian corridor. We examine how temperature reduction by dissipation of heat during heat transfer processes in the hyporheic zone may play a substantial role in the development of potential thermal refuges, as described above. Our findings are unique among similar studies in that we were able to monitor temperature within the hyporheic zones along relatively long pathlines.
2. Methods
2.1. Study Site
In 2008, we installed 50 monitoring wells in the Green Island area along the Willamette River, 33 of the wells were concentrated along three islands, currently or previously isolated lands in the braided floodplain of the riparian zone (Fig. 1).
Figure 1:
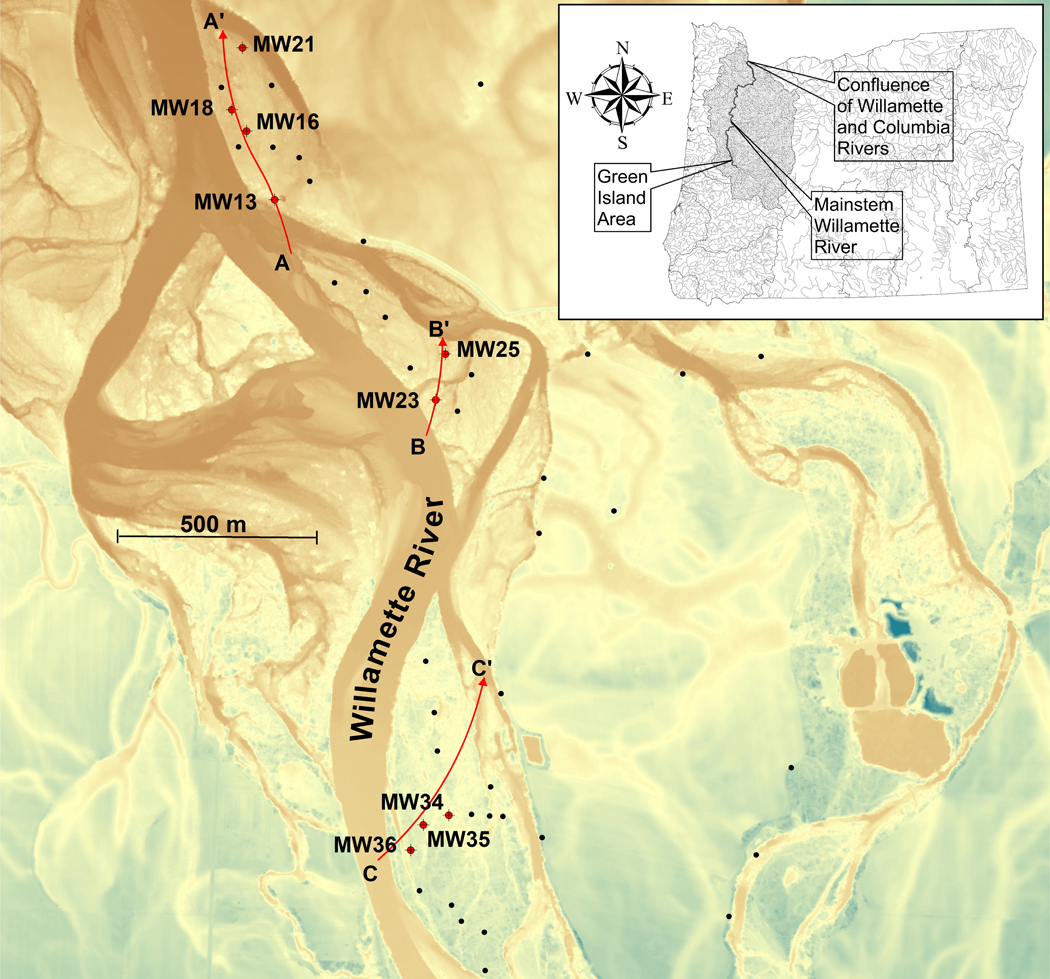
Map of Green Island, with the base map in the form of a bare earth LiDAR image. LiDAR is essentially radar which has been adapted to use light rather than radio frequencies. This map shows locations of our study wells along transects and the selected steady-state pathlines for the dry season. Black dots indicate locations of all constructed wells. The labeled red dots indicate wells whhich were located along the pathlines.
The name “Green Island” refers, as locally defined, to an area that has multiple islands, as mentioned in the Introduction. The north island is now connected by land along its southeast side, but the connected area consists of recently deposited coarse gravels and cobbles which have a hydraulic conductivity about four times higher, on average, than the rest of the area (Faulkner et al., 2012). The area was an island in the 1950’s in aerial photographs, so we retain the name. The other two are still true islands.
Alcoves often form when upstream flow in a cutoff is blocked by bar deposits, leaving off-channel remnants connected to the main channel at the original downstream end as the bar takes over and expands (Fernald et al., 2006). The north and south islands of our site are lenticular, and the middle island is irregular in shape (Wyrick and Klingeman, 2011). The south island is mature (pre-1936, as determined with aerial photographs) with mature/mixed vegetation. The north island is much younger (formed beginning 1951), and still is dominated by pioneer vegetation. The middle island was mostly vegetation bare in 1951, and is a remnant of a larger island that was avulsed between 1951 and 1979. It is still undergoing active avulsion, the most recent of which occurred in the winter of 2012, as seen by aerial photography. Most of the wells used for this study on the island were destroyed in this event. Unconsolidated cobbles and gravels of fluvial origin are ubiquitous throughout the sedimentary environment.
The Willamette Valley lowlands normally experience a cool wet season, lasting from about October through about May, and a warm, dry season during the summer. From December 1892 through June, 1945, the annual average total precipitation in Eugene was 969 mm, with 75% of this occurring in November through April (Western Regional Climate Center, 2018). During the winter, continuous rainfall events are common, while evaporation is essentially zero, creating ideal conditions for substantial rainfall interception in areas with dense, tall tree canopy.
2.2. Instrumentation and Data Collection
Because location and elevation data were critical for calibration head measurements, this information was carefully determined. Each well was precisely located using a combination of a GPS receiver (Trimble Model 4700, micro-centered L1/L2 geodetic ground plane antenna, Trimble Navigation Ltd., Sunnyvale, CA, USA) which was used for areas free of dense tree canopy, and an electronic total station (Topcon GTS 211D, Topcon Corporation, Tokyo, Japan) for areas located in the riparian forested areas, where forest canopy was too dense for accurate GPS reception. Each monitoring well was instrumented with a self-contained data logger (Solinst Model 3001 LT (F30/M10), Solinst Canada, Ltd., Georgetown, ON). The technical specifications list a temperature accuracy of ± 0.1°C, and a resolution of 0.1°C. Wells were placed at depths averaging 3.58 m below ground surface (range 3.00 to 4.52 m). They were screened to 1.52 m (5 ft) above the bottom, and the loggers were placed at approximately 0.6 m above the bottom in the screened interval. Twenty-seven of the wells were completed in poorly to well-graded gravels, with minor amounts of silt, and six wells were completed in poorly graded sands. The data loggers recorded pressure and temperature at 10 minute intervals continuously from March, 2009 through April, 2013.
Numerical groundwater flow modeling was done using MODFLOW (Harbaugh et al., 2000), and this is documented in Faulkner et al. (2012). Since that work, we have noted that three of the hyporheic pathlines closely intersected several of the monitoring wells (Fig 1) in each of the islands mentioned mentioned above. In this paper, we consider three different scales of observation; 1) the three pathlines separately, 2) all of the mean pathlines presented in Faulkner et al. (2012) lumped together in each of the islands, and 3) all observations in all three islands as a whole.
2.3. Analysis of Data
Under near-surface conditions the geothermal gradient can be regarded as negligible, and heat dissipation follows forced convection in porous media flow. For a temperature T in a flow velocity field v = i(dx/dt) + j(dy/dt) + k(dz/dt), with i, j, and k being unit vectors along the easting, northing, and elevation directions respectively, a fairly general governing equation for heat transfer in porous media is (Bejan, 1995):
| (1) |
where σ is the capacity ratio, defined by
| (2) |
where θ is the aquifer porosity, ρ is the density, cp is the specific heat, and the subscripts f, and s indicate the parameters are for the fluid versus solid phases. and α is the aggregate thermal diffusivity of the aquifer, defined by
| (3) |
and k is the effective thermal conductivity of the aggregate fluid and aquifer matrix.
If we consider flow on a pathline along distance s in meters (see Fig. 2), assume the velocity along it is constant, and assume that θ is also constant, then σ becomes an aggregate term for the fluid combined with the aquifer matrix. Then Eq. 1 simplifies to
| (4) |
where vs is the effective water velocity along the pathline, and (ρcp)fs is the aggregate term for the density times the specific heat capacity of the fluid and aquifer matrix. If we further assume that T(t) is constant, (i.e., T is a function of s only), the left side of Eq. 4 is zero.
Figure 2:
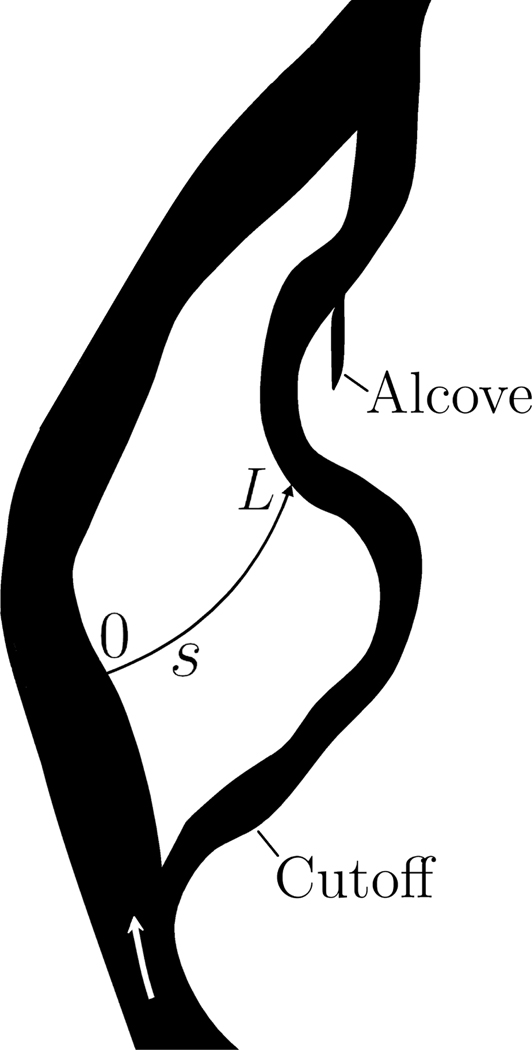
Schematic of a typical hyporheic pathline following s from 0 to L.
For a distance traveled from s = 0 to s = L, Bredehoeft and Papadopulos (1965) offered the following useful solution to this equation which incorporates effective measures of convection heat transfer that are commonly reported for porous media:
| (5) |
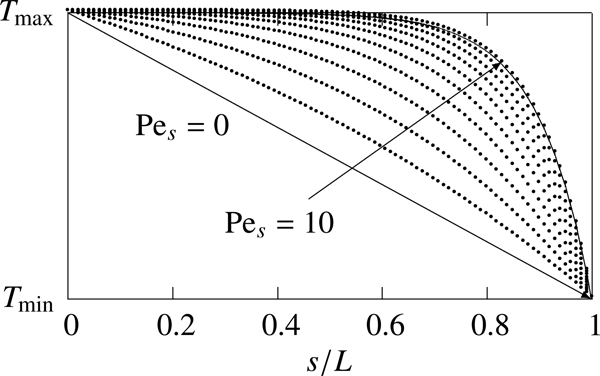
where T0 and TL are the estimated temperatures at the entry and exit points of the hyporheic zone, Pes is the thermal Péclet number, equal to vsL/α. This dimensionless number affects the convexity of the temperature profile T(s) (Fig. 3). We also use tL (T0 < tL < TL) to represent the mean total time of travel (days) along each of the three pathlines.
Figure 3:
Effect of Pes on the temperature profile along s from 0 to L.
The pressure transducer data from the data loggers was used to calibrate two steady-state stochastic flow models for groundwater in both the wet and dry seasons. The MODPATH code (Pollock, 1994) was used with the MODFLOW (Harbaugh et al., 2000) steady-state simulations to develop mean pathlines for flow in each of the wet and dry seasons. This work is documented in Faulkner et al. (2012). Here we report only the mean pathlines from that study.
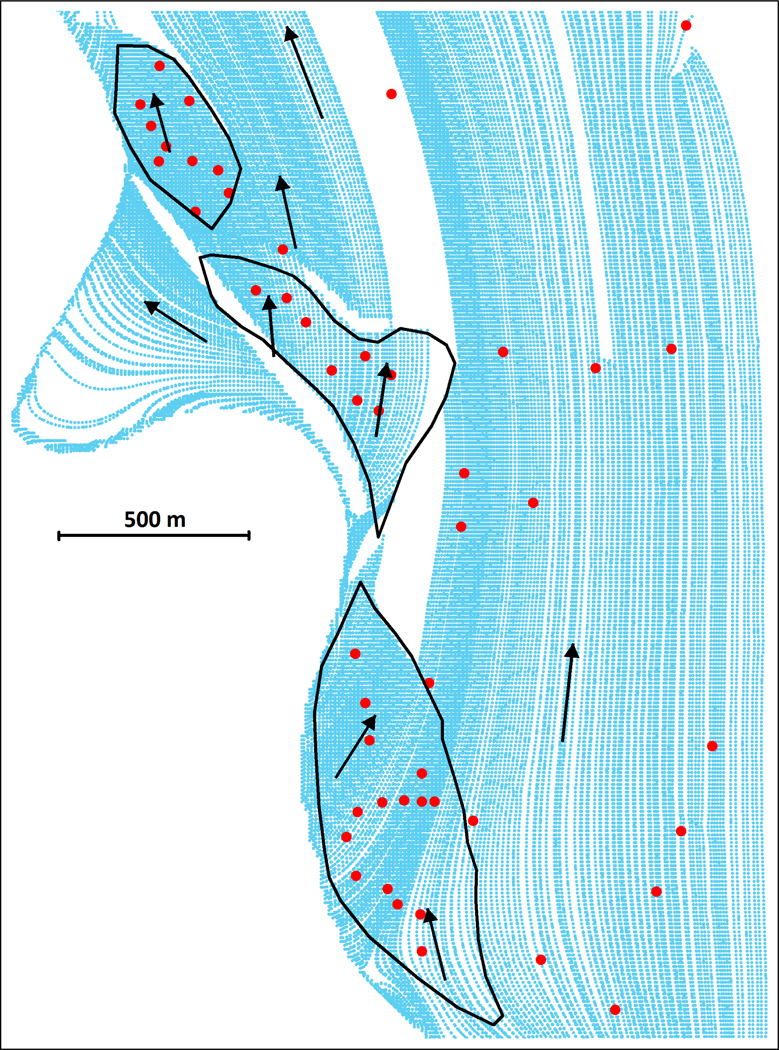
For each computational cell in MODFLOW that intersects a pathline, MODPATH computes the exit point. The exit points can be exported to a text file containing the three-dimensional locations of each point, to create a pathline map (Fig. 4) and for other uses. We wrote an awk program (Aho et al., 1988) to find the nearest pathline to the midpoint of each well screen. This allowed us to calculate the distances along the pathline nearest to each well in each of the three geomorphic areas of interest (Figs 1 and 4). Note that we are presenting all the dry-season pathlines for the Green Island region (Fig. 4) as well as the three that intersected closely with monitoring wells (Fig. 1). The black borders indicate the three islands as identified above (Fig. 4). They are shown here for spatial reference.
Figure 4:
Mean dry season MODFLOW/MODPATH pathlines for modeled area east of the Willamette River. Red dots indicate locations of all of the installed wells, for reference.
The nearest pathline distance was used with the temperature data to obtain a least squares fit for Eq. 5 to the data. The least squares fits were obtained using SAS software (Copyright ©SAS Institute, Cary, NC) PROC NLIN. Since T0 and TL were also uncertain parameters, these were estimated along with Pes. The upper and lower 95% confidence limits for all parameters were computed by SAS using , where t(n - p, 1 – α/2) is the t-statistic, n is the number of mean temperature observations, p is the number of parameters (3), n – p is the number of degrees of freedom, α is set to 0.05, are the parameter estimates, and stderri is the approximate standard error, estimated for each parameter.
Temperature measurements were made quarterly at the large north alcove to the northeast of the north island using a YSI Model 6920 data sonde from 8/8/2008 through 4/14/2010, resulting in seven measurements. Data from the USGS gage at Harrisburg, Oregon (USGS gage 14166000) included water temperature measurements. Several additional temperature measurements were made in surface water sites in the Willamette River, the north alcove, and the slough along the east side of the south island using iButton® temperature loggers, which list a temperature resolution of 0.5 °C.
2.4. Stable Isotope Sampling (𝛅2H)
Water samples were collected quarterly for analysis of δ2H using a peristaltic pump. Wells were purged at least three casing volumes and then monitored for stabilization of pH, specific conductance, dissolved oxygen, and oxidation reduction potential, prior to collecting the samples in 20 mL glass vials fitted with polyseal conical caps to prevent evaporation. The value of δ2H is expressed as a ratio to “Vienna standard mean ocean water” as follows:
The value δ2H is reported as parts per thousand (‰). Samples were analyzed on a Laser Absorption Water-Vapor Isotope Spectrometer (Model 908–0004, Los Gatos Research, Mountain View, CA) located at the Integrated Stable Isotope Research Facility at the Western Ecology Division of the EPA, Corvallis, Oregon. Measurement precision was determined on repeated measures of study samples, and was 0.3‰. Since the samples were collected quarterly, we used the dates nearest to the dry and wet season dates of August 24, 2009 and December 20, 2010. These dates were selected based on measured river stages at the nearby USGS Harrisburg gage when sustained periods of steady river level occurred at the dry and wet periods during 2009 and 2010 (Faulkner et al., 2012). When replicates were done, the means of the two were used.
Quarterly sampling analysis results for stable isotopes were reported when sampling fell within one month of the August 25, 2009 dry season date and the December 20, 2010 wet season date. In some cases samples were not taken during those quarters (i.e., MW18, MW23 (wet), MW34–36 (wet), and Willamette River (wet)).
3. Results and Discussion
The calibrated MODFLOW/MODPATH models suggest that during the dry season, the simulated average steady state pathlines that were seeded in the river nodes essentially follow along the water table surface until they reach a cutoff or alcove where hyporheic water is discharged (Figs. 4 and 5). The flows are driven by the gradients in the potentiometric surfaces caused by elevation changes between the Willamette River and the various cutoffs and alcoves (Fig. 1).
Figure 5:
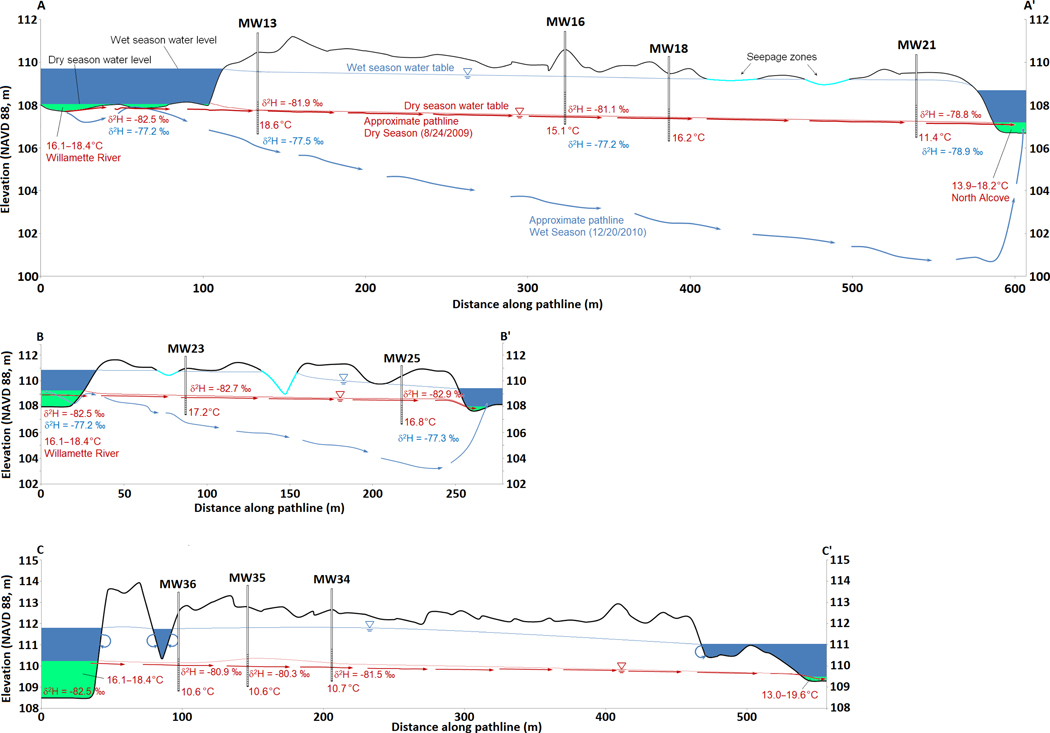
Schematic of hyporheic pathlines traversing distance 0 to L through islands along river riparian zones. Cross-sections (Fig. 1) are A-A’ (north), B-B’ (middle), and C-C’ (south). The flow pathlines and water levels are derived from the MODFLOW/MODPATH results along each cross-section. Pathlines and values shown in blue represent the wet season observations versus red, for the dry season. Note magnification of vertical scale.
During the wet season (November through April, six months recharge), river stage and the water table rise substantially, causing the pathlines seeded at the river to be driven with a downward component where they pass below the screened monitoring wells (Fig. 5). We therefore focus our discussion on the dry season pathlines (May through Oct.) which were repeatedly in contact with the temperature sensors.
The models were run in steady-state mode, so that the pathlines as depicted (Fig. 5) represent the two end members of flow, and during much of the year, flow of water can be expected to be oscillating between these end member pathlines. The pathlines for the vertical cross section A-A’ represent a total travel distance of about 600 m, with a mean travel time of about 3.8 years (approx. four seasons), from 26 Monte Carlo runs (Faulkner et al., 2012). The travel time from B-B’ has a mean of about 0.75 years (one season), C-C’ has a mean of about 4.9 years, covering five seasons (Table 1). During wet season, recharge is contributing to the subsurface system as the hyporheic water moves from the river to the alcove.
Table 1:
Estimated parameters with their lower and upper 95% confidence limits. Note that South Island optimization failed to yield asymptotic statistics for Pes and T0. The parameters which are italicized indicate that no good fit was found. The values for the mean of L and tL are for 26 Monte Carlo runs for each pathline (Faulkner et al., 2012).
| T0 (°C) | Tl (°C) | Pes | L (m) | tL(days) | |||||||
|---|---|---|---|---|---|---|---|---|---|---|---|
| Island | Estimate | L95 | U95 | Estimate | L95 | U95 | Estimate | L95 | U95 | Mean | Mean |
| North | 18.2 | 15.8 | 20.5 | 11.1 | 8.6 | 13.5 | 2.7 | −0.9 | 6.4 | 599 | 1400 |
| Middle | 17.2 | 17.1 | 17.3 | 16.6 | 16.4 | 16.7 | 6.5 | 1.3 | 11.6 | 260 | 275 |
| South | 10.8 | - | - | 11.3 | 10.6 | 12.0 | 0.0 | - | - | 554 | 1793 |
In the north and middle islands, we can see a dramatic rise in the water table in the wet season accompanied by a downward component of flow due to the increased vertical hydraulic gradient (Fig. 5, A-A’, B-B’). But this downward component of flow does not eliminate flow from the mainstem river to the alcove, but merely drives the wet season pathline deeper, to eventually re-emerge in the alcove or cutoff. However, in the south island, wet season flow from the river to its cutoff is turned away due to the higher groundwater mounding there (Fig. 5, C-C’). This pathline is the southernmost one which is captured by the slough along the east side of the island. There is an accumulation of temperature buffering, mostly as a result of recharge through the vadose zone, which happens season after season, resulting in a final decrease in temperature in the wells farthest from the river entry point. This buffering effect has been described in Arrigoni et al. (2008) who concluded that one of the components of temperature patterns in hyporheic flow is a reduction in the variation of temperature. Our study suggests that this effect may be present, as the result of the maintenance of hyporheic flow in those islands. In the south island, there is no maintenance of hyporheic flow season-to-season because recharge in the winter is great enough to prevent it each wet season. In some parts of the south island, the pathlines are driven deeper and often penetrate into a flow system that does not return to the river (Fig. 4, right half). They pass under the cutoffs into a larger flow system. So the south island mostly shows the effect of precipitation dominantly, and not an accumulative effect of recharge during the shift from one season to the next. Because of this, temperature and δ2H do not show a pattern along the C-C’ dry season pathline. However, temperature measurements in the slough along the south island show a pattern similar to that of the north island alcove (ranging 13.0 °C to 19.6 °C). It indicates a cooler environment, apparently brought by hyporheic discharge at a more local level than that induced through the distance between the mainstem river and the slough. It suggests that there is a dry season pattern of hyporheic flow, most likely in the southern part of the south island, which is not captured by our temperature model, because it enters near the southernmost part of the island (Fig. 4), has a shorter residence time, and contributes hyporheic discharge in the “headwater” (south) end of the slough.
For the quarterly period representing the dry season, 2009, Willamette River temperature was 18.4 °C. Sampling done in the north alcove had temperatures at the bottom of the water column ranging systematically from 13.9 to 18.2 °C (R. C. Wildman and S. V. Gregory, Unpublished data), with the lower temperature occurring in the upstream end, strongly influenced by hyporheic discharge, and the higher temperature in the downstream end, where mixing with ambient surface water near the connection with the Willamette River was greatest. In the same period, sampling done in the slough near the hyporheic discharge location C’ had temperatures ranging from 13.0 °C at the upgradient end to 19.6 °C at the downstream end, which was, again, closest to ambient surface water connected with water of the mainstem Willamette River (R. C. Wildman and S. V. Gregory, Unpublished data). These data indicate a temperature reduction associated with hyporheic discharge (Fig. 5).
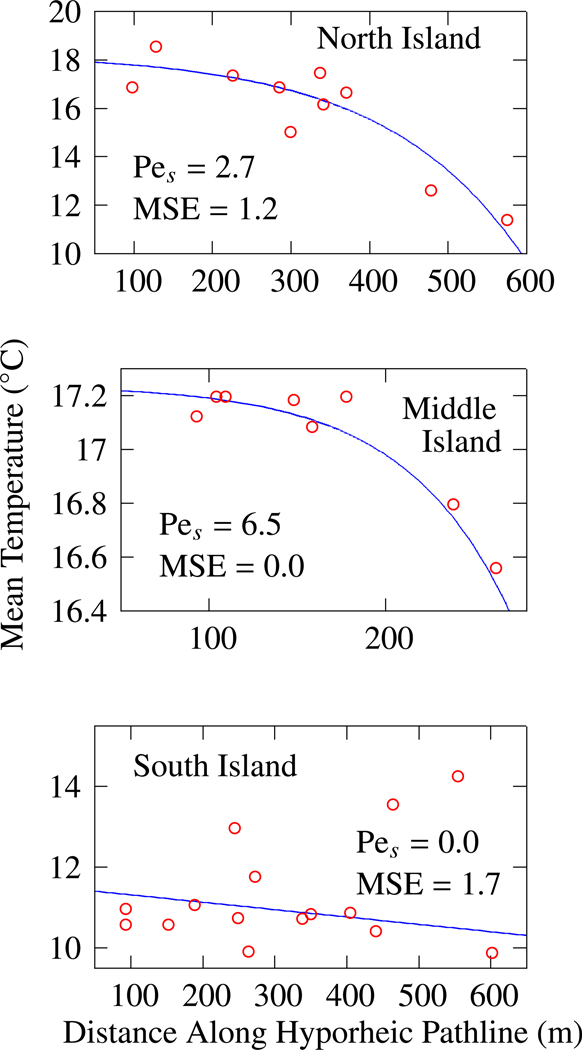
We can consider not only the wells which fell along a single pathline, but also all of the wells within each “island” for which we have calculated the distance along any pathline they intersected that was computed by the awk program, as described in Section 2.2. These are the wells which fell within the polygons representing islands (Fig. 4), and the estimated fits to Eq. 5, as described in Section 2.2 are shown (Fig. 6).
Figure 6:
Plot of all pathline distances intersecting a well, and their mean temperatures on Aug. 24, 2009.
We see good fits of Eq. 5 to the data for the north island (Pr > F: 0.0024) and middle island (Pr > F: 0.0004). However, for the south island the attempt to minimize the function to the data resulted in the matrix of second derivatives being singular, meaning the optimization algorithms in SAS could not find a robust minimum for the objective function. It suggests that any hyporheic flow contributing to the lower temperatures observed in the slough to the east of the south island, was not captured by our monitoring wells. This is supported by examining the flow pathlines (Fig. 4). The south island results do not converge to a reliable estimate of Pes, or indicate that it is approximately zero (straight line).
For the north and middle islands, noting the different scales (Fig. 6), it can be seen that the higher the Péclet number the more convex the relationship between temperature and distance becomes. The middle island temperatures showed a much better fit (MSE ≈ 0.0). For the middle island, the higher Péclet number indicates that advection is more dominant over diffusive processes than for north or south islands.
The estimates of Pes were 2.7 for the north island and 6.5 for the middle island, although there is considerable uncertainty (Table 1). They suggest that temperature reduction in the north island is controlled more by diffusion processes than by advection, as compared to the middle island. However it should be noted that the temperature range for the middle island is considerably smaller, and therefore error may be greater than model results indicate.
It is interesting to consider stable isotope data for the south island. Overall δ2H, which includes south island, indicates a significant relationship to temperature which suggests that conditions during precipitation, flooding, and river recharge (of the hyporheic) are important factors in temperature regulation in the hyporheic zone (Fig. 7).
Figure 7:
Stable isotope values as a function of temperature for all of the wells inside the hyporheic zone (the areas outlined in Fig. 4). Only data from dry-season quarterly sampling were used. Symbols are  North island,
  Middle island,
  South island. The p-value is the approximate probability, based on the F-distribution. Note that the color scheme used here has nothing to do with those of previous figures.
Just as with the cross sections (Fig. 5), we see that south island shows the effect of recharge accumulation in the wet season, and therefore does not display a clear effect of hyporheic cooling. Locally, waters which have relatively high values of δ2H are typically derived from rainfall-recharged groundwater, while relatively lower values are typically derived from the main Willamette River (Brooks et al., 2012). Brooks et al. (2012) reported that local rainwater had a mean of −63‰, while the Willamette River varied from a high of −70 during the winter to a low of −84 during the summer. We see this effect in the cross sections A-A’ and B-B’, where wet season δ2H values (shown in blue) are consistently higher than dry season values (shown in red) due to the influence of rainfall infiltration and recharge to the shallow groundwater. However, all δ2H values indicate a high contribution of river water as a source.
The δ2H values do not show the increasing pattern along the pathline of the middle and south island (Fig. 5, C-C’) that is seen in the north island. However if we simply plot δ2H versus mean daily temperature for all island wells (Fig. 7) we can see that when the temperature is lower, we see higher values of δ2H. This indicates lower temperatures are generally associated with water that has had more contact with deeper groundwater, or groundwater that has been affected more by local rainfall infiltration. Another factor is that the Willamette River isotopes shift seasonally as well, so higher isotope values correspond to either a greater contribution of local groundwater or were associated with river flow in the winter. Summer river δ2H values are more negative (Brooks et al., 2012). Thus, more enriched values measured in wells during the summer indicate either longer transit time (winter river water) or more mixing with local groundwater.
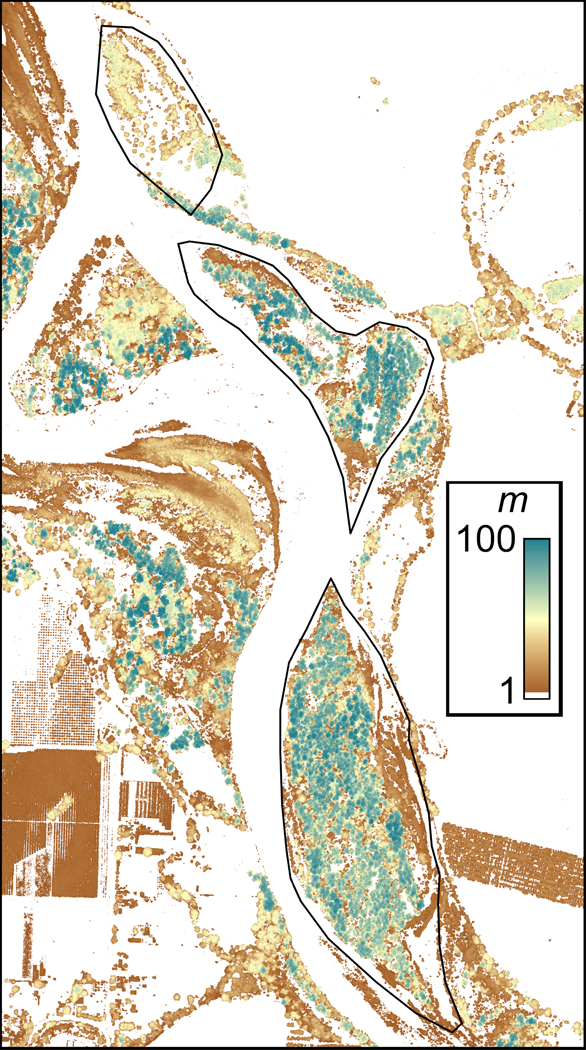
The middle island experiences shorter distance of flow through it from the river (Figs. 4 and 5) which probably explains the fairly consistently low isotope values from our groundwater samples from it (Fig. 5). It experiences less of an effect of rainfall recharge. This is in contrast to the north island, which shows δ2H values with a relatively wide range, in accordance with the longer distances of flow from the river (Fig. 4). The lack of hyporheic flow in the south island is most likely due to its larger size and mature vegetation, including a well-established forest of older tall trees capable of considerable interception during the long-duration rainfall events of the Willamette Valley winters (Fig. 8).
Figure 8:
Raster image of a portion of the study site, generated by subtracting bare earth LiDAR from highest hit LiDAR, in order to show height of forested areas and other vegetation. Areas shown in white had heights less than about 0.25 meter.
4. Conclusions
The goals of the Clean Water Act call for the maintenance of the physical, chemical, and biological integrity of the nation’s waters for the protection of aquatic life (and human health). In the Pacific Northwest, the Clean Water Act is implemented through protecting and restoring the thermal regime of rivers and streams for the protection of salmonids. Protecting thermal regimes includes identifying and understanding the physical features that provide cold water that is critical for the survival of salmonids in freshwater. In this study, we had the unique opportunity to observe temperature reduction along three hyporheic pathlines in the summer along a portion of the Willamette River corridor in Oregon. Results of numerical flow modeling indicated that in areas where hyporheic flow is maintained throughout the year, temperature reduction can be achieved. In areas where hyporheic flow is interrupted by seasonally high rainfall and forest canopy interception, the temperature reduction is less apparent, due to suppression of winter time hyporheic flow in the greater part of the island. Nevertheless, lower temperatures, as compared to the mainstem Willamette River, were observed in the slough to the east of the island, most likely due to hyporheic flow with a shorter residence time (less than one season) in the southernmost portion of the island.
Our monitoring wells which had temperature sensors with data recorders showed substantial temperature reductions of up to 7 °C. Combining temperature data along the nearest hyporheic pathlines allowed fitting of an analytical model which provided estimates of thermal Péclet numbers from less than zero to about 12. The thermal Péclet number is a useful metric. Its value indicates the strength of advection versus diffusive processes (albeit semiempirical) and provides some information about which of these processes is dominant.
We used stable isotope sampling (δ2H) from water in the wells to provide additional information regarding the origin of this water. We observed that lower temperatures were associated with higher values of δ2H and vice versa, which follows with our observations along the modeled pathlines. This supports our conclusion that river water penetration into the hyporheic zone and the associated temperature conduction have a beneficial effect, regardless of the specific physical mechanism that causes it.
This study has demonstrated substantial evidence that hyporheic zones, heterogeneously distributed along large river corridors provide a cooling effect. It indicates that hyporheic flows can provide an important source of cold water and thus important cold water refuge habitat for salmonids. Federal, state and local agencies charged with the protection and restoration of water quality and salmonids, can use this information to better prioritize protection and restoration efforts.
5 Acknowledgements
We thank the Board of the McKenzie River Trust and Joe Moll and Chris Vogel, who facilitated access to the Green Island project site. We also thank Steve Cline, Ron Waschmann, Peter Beedlow, Connie Burdick, Jana Compton, Dixon Landers, Marilyn Erway, Justin Groves, Gail Heine, Ashley McEl-murry, Dan Rasor, and Marjorie Storm for their assistance with surveying, sampling support, and well installation. We gratefully acknowledge the input and invaluable sharing of data collected by Stan Gregory and Randy Wildman, of Oregon State University, as part of a wider-scale study undertaken to characterize thermal characteristics of aquatic refuges in the Willamette River system. We thank Ken Fritz and Steve Kraemer for their very helpful technical reviews and comments to improve the manuscript. The US Environmental Protection Agency funded and managed the research described here. The views expressed in this article are those of the authors and do not necessarily represent the views or policies of the U.S. Environmental Protection Agency. Mention of trade names or commercial products does not constitute endorsement or recommendation for use.
References
- Aho AV, Kernighan BW, and Weinberger PJ (1988). The AWK Programming Language. Addison-Wesley, Reading, Massachusetts: 210 pp. [Google Scholar]
- Anderson MP (2005). Heat as a ground water tracer. Ground Water, 43(6):951–968. doi: 10.1111/j.1745-6584.2005.00052.x. [DOI] [PubMed] [Google Scholar]
- Arrigoni AS, Poole GC, Mertes LAK, O’Daniel SJ, Woessner WW, and Thomas SA (2008). Buffered, lagged, or cooled? Disentangling hyporheic influences on temperature cycles in stream channels. Water Resour. Res, 44:W09418. [Google Scholar]
- Arscott DB, Tockner K, and Ward JV (2001). Thermal heterogeneity along a braided floodplain river (Tagliamento River, northeastern Italy. Can. J. Fish. Aquat. Sci, 58:2359–2373. DOI: 10.1139/cjfas-58-12-2359. [DOI] [Google Scholar]
- Bejan A. (1995). Convection Heat Transfer. John Wiley & Sons, New York, second edition 623 pp. [Google Scholar]
- Bredehoeft JD and Papadopulos IS (1965). Rates of vertical groundwater movement estimated from the earth’s thermal profile. Water Resour. Res, 1:325–328. [Google Scholar]
- Brooks JR, Wigington PJ, Phillips DL, Comeleo R, and Coulombe R. (2012). Willamette River Basin surface water isoscape (δ18O and δ2H): temporal changes of source water within the river. Ecosphere, 3(5):39. doi.org/ 10.1890/ES11-00338.1. [DOI] [Google Scholar]
- Burkholder BK, Grant GE, Haggerty R, Khangaonkar T, and Wampler PJ (2008). Influence of hyporheic flow and geomorphology on temperature of a large, gravel-bed river, Clackamas River, Oregon, USA. Hydrol. Process, 22:941–953. [Google Scholar]
- Caissie D, Kurylyk BL, St-Hilaire A, El-Jabi N, and MacQuarrie KTB (2014). Streambed temperature dynamics and corresponding heat fluxes in small streams experiencing seasonal ice cover. J. Hydrol, 519:1441–1452. http://dx.doi.org/10.10167j.jhydrol.2014.09.034. [Google Scholar]
- Domenico PA and Schwartz FW (1990). Physical and Chemical Hydrogeology. John Wiley & Sons, New York: 824 pp. [Google Scholar]
- Dykaar BB and Wigington PJ (2000). Floodplain formation and cotton-wood colonization patterns on the Willamette River, Oregon, USA. Environ. Manage, 25(1):87–104. [DOI] [PubMed] [Google Scholar]
- Ebersole JL, Liss WJ, and Frissell C. (2001). Relationship between stream temperature, thermal refugia and rainbow trout Oncorhynchus mykiss abundance in arid-land streams in the northwestern United States. Ecol. Freshw. Fish, 10(1):1–10. [Google Scholar]
- Ebersole JL, Liss WJ, and Frissell C. (2003). Thermal heterogeneity, stream channel morphology and salmonid abundance in northeast Oregon streams. Can. J. Fish. Aquat. Sci, 60:1266–1280. [Google Scholar]
- Ebersole JL, Wigington PJ, Leibowitz SG, Comeleo RL, and Van Sickle J. (2015). Predicting the occurrence of cold-water patches at intermittent and ephemeral tributary confluences with warm rivers. Freshw. Sci, 34(1):111–124. [Google Scholar]
- Faulkner BR, Brooks JR, Forshay KJ, and Cline SP (2012). Hyporheic flow patterns in relation to large river floodplain attributes. J. Hydrol, 448 – 449(0):161–173. http://dx.doi.org/10.10167j.jhydrol.2012.04.039. [Google Scholar]
- Fernald AG, Landers DH, and Wigington PJ (2006). Water quality changes in hyporheic flow paths between a large gravel bed river and off-channel alcoves in Oregon, USA. River Res. Applic, 22:1111–1124. [Google Scholar]
- Fullerton AH, Torgersen CE, Lawler JJ, Faux RN, Steel EA, Beechie TJ, Ebersole JL, and Leibowitz SG (2015). Rethinking the longitudinal stream temperature paradigm: region-wide comparision of thermal infrared imagery reveals unexpected complexity of river temperatures. Hydrol. Process, 29:4719–4737. DOI: 10.1002/hyp.10506. [DOI] [Google Scholar]
- Harbaugh AW, Banta ER, Hill MC, and McDonald MG (2000). MODFLOW-2000, The U.S. Geological Survey Modular Ground-Water Model—User Guide to Modularization Concepts and the Ground-Water Flow Process Open-File Report 00–92, U.S: Geological Survey, 121 pp. [Google Scholar]
- Krause S, Hannah DM, and Blume T. (2011a). Interstitial pore-water temperature dynamics across a pool-riffle-pool sequence. Ecohydrol, 4:549–563. DOI: 10.1002/eco.199. [DOI] [Google Scholar]
- Krause S, Hannah DM, Fleckenstein JH, Heppell CM, Kaeser D, Pickup R, Pinay G, Robertson AL, and Wood PJ (2011b). Inter-disciplinary perspectives on processes in the hyporheic zone. Ecohydrol, 4:481–499. DOI: 10.1002/eco.176. [DOI] [Google Scholar]
- Ligon F, Rich A, Rynearson G, Thornburgh D, and Trush W. (1999). Report of the Scientific Review Panel on California Forest Practice Rules and Salmonid Habitat. Prepared for the Resources Agency of California and the National Marine Fisheries Service, Sacramento, California, June, 1999, 92 pp. [Google Scholar]
- McCullough DA, Bartholow JM, Jager HI, Beschta RL, Cheslak EF, Deas ML, Ebersole JL, Foott JS, Johnson SL, Marine KR, Mesa MG, Petersen JH, Souchon Y, Tiffan KF, and Wurts-baugh WA (2009). Research in thermal biology: Burning questions for coldwater stream fishes. Rev. Fish. Sci, 17(1):90–115. [Google Scholar]
- Mosley MP (1983). Flow requirements for recreation and wildlife in New Zealand rivers –a review. J. Hydrol, 22(2):152–174. [Google Scholar]
- Neumann NN and Curtis PJ (2016). River–groundwater interactions in salmon spawning habitat: riverbed flow dynamics and non–stationarity in an end member mixing model. Ecohydrol, 9:1410–1423. 10.1002/eco.1736. [DOI] [Google Scholar]
- Nielsen JL, Lisle RE, and Ozaki V. (1994). Thermally stratified pools and their use by steelhead in Northern California streams. T. Am. Fish. Soc, 123:613–626. [Google Scholar]
- Oregon Department of Environmental Quality (2006). Willamette Basin TMDL. Technical report, Oregon Department of Environmental Quality. https://www.oregon.gov/deq/wq/tmdls/Pages/TMDLs-Willamette-Basin.aspx (accessed 11/12/2018). [Google Scholar]
- Ouellet V, Gibson EE, Daniels MD, and Watson NA (2017). Riparian and geomorphic controls on thermal habitat dynamics of pools in a temperate headwater stream. Ecohydrol., 2017:10:e1891. 10.1002/eco.1891. [DOI] [Google Scholar]
- Pollock DW (1994). User’s guide for MODPATH/MODPATH-PLOT, version 3: A particle tracking post–processing package for MODFLOW, the U.S. Geological Survey finite–difference ground–water flow model: U.S. Geological Survey Open–File Report 94–464, 6 ch. [Google Scholar]
- Poole GC and Berman CH (2001). An ecological perspective on in-stream temperature: Natural heat dynamics and mechanisms of human-caused thermal degradation. Environ. Manage, 27(6):787–802. [DOI] [PubMed] [Google Scholar]
- Shope CL, Constantz JE, Cooper CA, Reeves DM, Pohll G, and McKay WA (2012). Influence of a large fluvial island, streambed, and stream bank on surface water–groundwater fluxes and water table dynamics. Water Resour. Res, 48:W06512. doi: 10.1029/2011WR011564. [DOI] [Google Scholar]
- Singh HV, Faulkner BR, Keeley AA, Freudenthal J, and Forshay KJ (2018). Floodplain restoration increases hyporheic flow in the Yakima River Watershed, Washington. Ecol. Eng, 116:110–120. https://doi.org/10.1016Zj.ecoleng.2018.02.001. [DOI] [PMC free article] [PubMed] [Google Scholar]
- Stanford JA, Snyder EB, Lorang MN, Whited DC, Matson PL, and Chaffin JL (2002). The Reaches Project: Ecological and Geomorphic Studies Supporting Normative Flows in the Yakima River Basin, Washington). Project No. 1997–04700, 152 electronic pages (BPA Report DOE/BP-00005854–1). [Google Scholar]
- Torgersen CE, Ebersole JL, and Keenan DM (2012). Primer for In-dentifying Cold-Water Refuges to Protect and Restore Thermal Diversity in Riverine Landscapes. EPA 910-C-12–001. United States Environmental Protection Agency, Region 10, Seattle, WA: 78 pp. [Google Scholar]
- Uehlinger U, Malard F, and Ward JV (2003). Thermal patterns in the surface waters of a glacial river corridor (Val Roseg, Switzerland). Freshwater Biol, 48:284–300. [Google Scholar]
- U.S Environmental Protection Agency (2003). EPA Region 10 Guidance for Pacific Northwest State and Tribal Temperature Water Quality Standards. EPA 910-B-03–002. Region 10 Office of Water, Seattle, WA. [Google Scholar]
- Wallick JR, Grant GE, Lancaster ST, Bolte JP, and Denlinger RP (2007). Patterns and controls on historical channel change in the Willamette River, Oregon, USA, chapter 23, pages 491–516. Large Rivers: Geomorphology and Management. John Wiley & Sons, Ltd., New York: Gupta A (Ed.). [Google Scholar]
- Western Regional Climate Center (2018). Cooperative Climatological Data Summaries. Retrieved from http://www.wrcc.dri.edu/. Last accessed 10/23/2018.
- Wyrick JR. and Klingeman PC. (2011). Proposed fluvial island classification scheme and its use for river restoration. River Res. Applic, 27:814–825. DOI: 10.1002/rra.1395. [DOI] [Google Scholar]


