

Abstract
Exocytosis plays crucial roles in regulating the distribution and functions of plasma membrane and extracellular matrix proteins. However, measuring the exocytosis rate of a specific protein by conventional methods is very difficult due to exocytosis-independent trafficking such as endocytosis, which also affects membrane protein distribution. Here we describe a novel method, corrected Fluorescence Recovery after Photoconversion, in which exocytosis-dependent and independent trafficking events are measured simultaneously to accurately determine exocytosis rate. In this method, the protein-of-interest is tagged with Dendra2, a green-to-red photoconvertible fluorescent protein. Following the photoconversion of plasma membrane-localized Dendra2, both the recovery of the green signal and the changes in the photoconverted red signal are measured, and the rate of exocytosis is calculated from the changing rates of these two signals.
Keywords: exocytosis, membrane proteins, photoconversion, Fluorescence Recovery after Photobleaching, confocal microscopy, photoconvertible fluorescent protein
Exocytosis participates in a wide range of cellular processes such as cell growth, polarization and morphogenesis by targeting proteins to the plasma membrane (PM) and the extracellular matrix. The precise temporal and spatial regulation of exocytosis is critical for the localization and function of the cargo proteins. To visualize and measure exocytosis, a variety of methods have been developed, such as labeling exocytic vesicles using fluorescent dyes or marker proteins, monitoring the accumulation of vesicle cargo proteins on the cell surface and various advanced microscopy techniques including DIC (Differential Interference Contrast), TIRF (Total Internal Reflection Fluorescence) and STED (Stimulated Emission Depletion) microscopy (1–5), However, these methods are either not suitable for measuring the exocytosis of a specific membrane protein or rapid exocytosis of a large population of vesicles, and they require specific equipment and techniques that are often not accessible. Furthermore, the results obtained by measuring the amount of secreted proteins on the cell surface may be inaccurate due to the interference of exocytosis-independent trafficking processes such as endocytosis.
Pollen tubes elongate rapidly by tip growth, which relies on rapid exocytosis of a large population of vesicles to the apical region of the cells (6–8), and thus provides a favorite system for the study of exocytosis. Most previous studies to visualize exocytosis in pollen tubes monitor the secretion of cargo molecules, including FM dyes, cell wall material, fluorescently labeled PM or cell wall proteins such as pectin methylesterase (PME) (5, 9–12). These methods could conveniently reveal the distribution and dynamics of exocytosis, but lack quantitative power. A Fluorescence Recovery After Photobleaching (FRAP)-based method was developed to quantify exocytosis in pollen tubes (7, 13–15). FRAP is a commonly used technique to quantify protein movement, especially the lateral diffusion of membrane proteins (16, 17): After photobleaching the fluorescently labeled protein-of-interest in a specific region of the PM (Region of interest, ROI), the fluorescent signal in the ROI recovers with time due to the movement of unbleached protein from the surrounding area. The time course of the recovery is used to compute the rate of movement (17, 18). If the labeled molecule is targeted to the PM or the extracellular matrix by exocytosis, fluorescence intensity in the ROI recovers mainly due to the incorporation of the unbleached protein from the cytoplasm via exocytosis, and therefore, the rate of recovery represents the rate of exocytosis. However, this method failed to consider the internalization of the recovered fluorescent signal on the PM back to the cytoplasm via endocytosis. In addition, in growing cells the dilution caused by the insertion of nascent cell membrane will also reduce the fluorescent intensity in the ROI. Therefore, in conventional FRAP experiments, the observed fluorescence recovery rate may underestimate the actual rate of exocytosis.
Here we describe a FRAP-based novel method, corrected Fluorescence Recovery after Photoconversion (cFRAPc), which is performed on an ordinary confocal laser scanning microscope, to measure rapid exocytosis of specific protein-of-interest. In this method, exocytosis-dependent and independent trafficking events are measured simultaneously, so the exocytosis rate can be accurately determined.
In cFRAPc, the protein-of-interest that is targeted to the PM via exocytosis is tagged with Dendra2, a green-to-red photoconvertible variant of GFP (19). Before photoconversion, all of the Dendra2-tagged molecules in the cell emit green fluorescence when irradiated with a 488 nm laser. When a ROI on the PM is irradiated with a UV laser, the green fluorescence is irreversibly converted to red fluorescence. The red signal reduces with time due to endocytosis or dilution, which together are referred to as signal reduction factors from here onwards (Figure 1). The red signal will not be increased by exocytosis, since the concentration of red Dendra2 in the cytoplasmic pool remains nearly zero. Therefore, the fluorescent intensity of the ROI in the red channel serves as a real-time measurement of the rate of signal reduction on the PM. On the other hand, the green signal in the ROI is affected by two processes: Exocytosis that targets the unconverted green Dendra2 from the cytoplasm to the PM and the simultaneous reduction of the green Dendra2 on the PM due to the signal reduction factors (Figure 1). Since the rate of the latter is measured by the reduction of the red signal, the rate of exocytosis can be computed based on the time course of the green signal.
Figure 1. cFRAPc imaging of PRK1-Dendra2 in Arabidopsis pollen tubes.
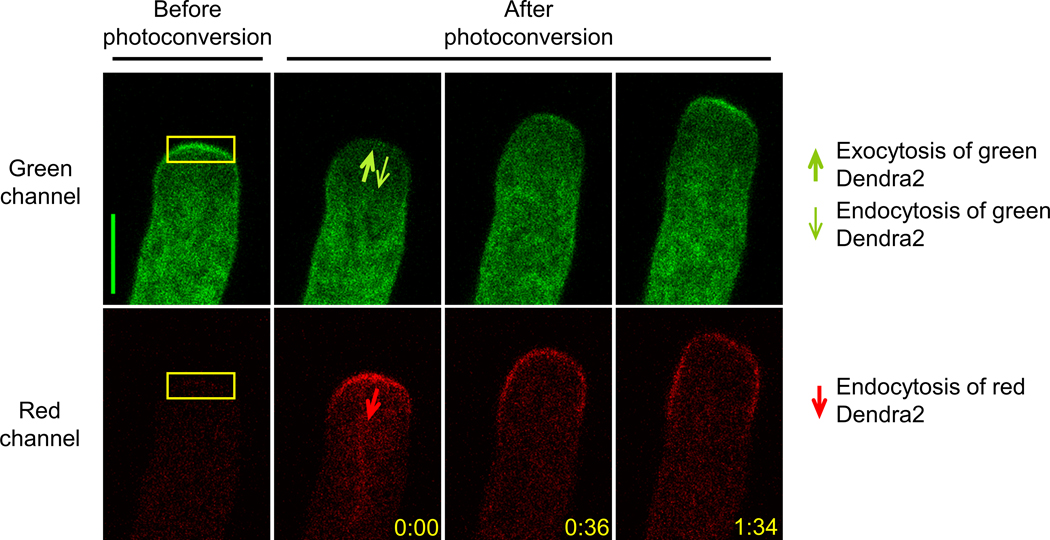
Representative confocal images in a typical cFRAPc experiment with Arabidopsis pollen tubes expressing PRK1-Dendra2. The apical region of the pollen tube (shown by yellow boxes) is photoconverted from green to red. The arrows indicate the directions of membrane trafficking that affect each signal. Numbers show time after photoconversion (min:sec). Scale bars, 5 μm.
In this work, we describe the full procedure of the preparation, imaging and data analysis of cFRAPc experiments. To demonstrate and validate our method, we performed cFRAPc to measure the exocytosis rate of a transmembrane receptor-like kinase expressed in Arabidopsis thaliana pollen tubes, PRK1 (AT5G35390), which shows a strong PM signal and preferentially localizes to the tip of pollen tubes (13). The comparison of cFRAPc with other methods as well as its applications and limitations are discussed.
Results and Discussion
Experimental preparation
To prepare for the experiments, a construct encoding the protein-of-interest fused to Dendra2 needs to be introduced into cells or organisms of choice. The protein-of-interest can be a PM protein or an extracellular matrix protein. If the research is focused on the general level of exocytosis instead of a particular protein, constitutive PM proteins containing the PM-anchoring domains only could be considered. In this study, to measure the exocytosis rate of PRK1 in Arabidopsis pollen tubes, a construct with a pollen tube specific promoter, LAT52, and PRK1 fused with Dendra2 at the C terminus was transformed into Arabidopsis.
cFRAPc measures a relative rather than an absolute rate of exocytosis, therefore at least two parallel experiments should be performed for comparison. For example, to study exocytosis in different genetic backgrounds, the construct encoding the Dendra2-tagged protein needs to be introduced into both wild-type and mutant cells. In this study, to investigate the effects of drugs on exocytosis, pollen tubes treated with mock solutions were included as the control group; to analyze the spatial distribution of exocytosis in pollen tubes, results of cFRAPc performed on different regions of the PM were compared.
cFRAPc imaging
Arabidopsis pollen tubes expressing PRK1-Dendra2 construct were cultured on solid pollen tube medium for cFRAPc imaging using a confocal laser-scanning microscope. The imaging involves three steps: (1) taking a pre-conversion image of a selected cell, (2) photoconverting PRK1-Dendra2 in a selected region on the PM and (3) taking post-conversion time-lapse images of this cell. The pre- and post-conversion images should be taken in both green and red channels, and the imaging settings of each channel should be kept the same throughout the experiment. The green state Dendra2 was excited by a 488 nm laser and detected with the commonly used GFP settings. Photoconversion of Dendra2 is efficiently induced by 405 nm UV light. Pilot experiments were performed to optimize the laser intensity and the scanning time to achieve maximum conversion without photo-toxicity or bleaching of the red signal. The photoconverted red Dendra2 was scanned by a 543 nm laser and detected at 550–670nm. The green and the red signals were detected separately using the sequential scanning mode to avoid crosstalk between these two channels. After photoconverting PRK1-Dendra2 at the pollen tube tip, the green signal recovered and the red signal reduced rapidly, indicating active exocytosis and endocytosis in this region (Figure 1, Movie S1).
To evaluate the possible photo-toxicity of UV in cFRAPc experiments, we observed 30 pollen tubes before and after UV irradiation using the same settings as in cFRAPc imaging. The growth rate and the cell width of pollen tubes reduced slightly after UV irradiation, but the difference is insignificant (Figure S2A, B). There is no observable change in the morphology of the cells (Figure S2C).
Factors that may bias the results of cFRAPc include lateral diffusion and photobleaching. Previous study showed that the lateral diffusion of membrane proteins in Arabidopsis pollen tubes was negligible (13). To evaluate the level of photobleaching, cFRAPc imaging with the same settings was performed on entire ungerminated pollen grains (Figure S1A). Based on the average time-courses of the fluorescent signal, the photobleaching rates in the green and the red channels were estimated to be 0.13% and 0.00% per second, respectively (Figure S1B). The signal loss due to photobleaching is added to the measured fluorescent signal when analyzing the cFRAPc data.
Image processing and quantification
The cFRAPc images were analyzed using ImageJ (http://rsb.info.nih.gov/ij/) to obtain the data for calculation. Before being measured, images were enhanced using ImageJ processing functions including smoothing and background subtraction. For every frame in the image series, the average fluorescent intensity in the photoconverted PM region was measured to obtain the time courses of both the green and the red signals (Figure 2). According to the rationale of the calculations discussed below, the area of the photoconverted region and the average cytoplasmic green signal intensity were also measured.
Figure 2. Data analysis of cFRAPc images of PRK1-Dendra2 in Arabidopsis pollen tubes.
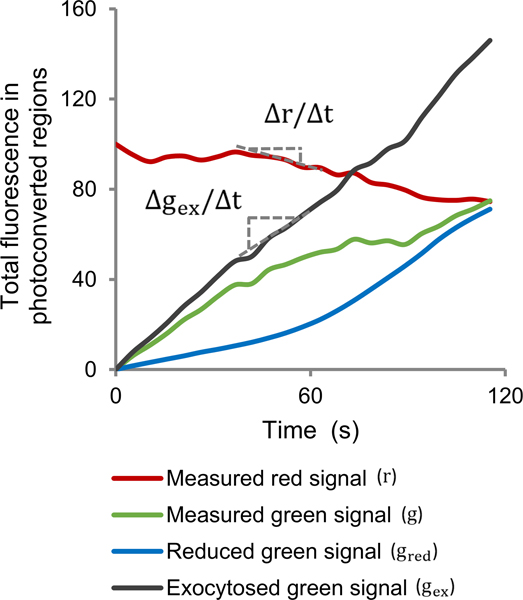
Average time-courses of measured total red or green signal and calculated reduced or exocytosed green signal in the photoconverted regions of 21 cells. As shown in the graph, the changing rate of the total red signal () and the exocytosed green signal () at a certain time point is obtained by calculating the slope of the corresponding curve.
Calculation of exocytosis rate
In exocytosis, proteins are transported from exocytic vesicles in the cytoplasm to the PM. The amount of protein (denoted by ) being exocytosed to a certain region of the PM with an area of during time period is given by
| [1] |
where is the number of vesicles fusing with the PM per unit area per unit time and is the amount of protein carried by each vesicle. Here only is dependent on the rate of exocytosis, therefore, we define the absolute rate of exocytosis as
| [2] |
or: the rate of exocytosis is the number of exocytic vesicles fusing with the PM per unit area per unit time. According to Equation [1],
| [3] |
However, it is difficult to obtain the absolute rate of exocytosis, since we are not able to directly measure , the protein amount in a single vesicle. Instead, since is proportional to , which is the average concentration of this protein in the cytoplasm, we define the relative rate of exocytosis as
| [4] |
On the other hand, the amount of protein is proportional to the intensity of fluorescence (20, 21). Therefore,
| [5] |
where is the increase of total green fluorescence in the photoconverted region on the PM and is the average green fluorescence of the cytoplasm.
The red signal of photoconverted Dendra2 on the PM decreases due to endocytosis and the dilution effect caused by membrane insertion. In all these processes the amount of reduced fluorescence on the PM is proportional to the average fluorescence on the PM, so the rate of signal reduction, , can be expressed by an equation similar with Equation [5]:
| [6] |
where and are the reduction of total red fluorescence and the average red fluorescence in the photoconverted region on the PM. Therefore, we can calculate the signal reduction rate directly from the decreasing rate of the red signal. Note that the recycling of red Dendra2 back to the PM by exocytosis is negligible since the cytoplasm provides a much larger pool than the small area of PM photoconverted by UV, and the red signal in the cytoplasm remains nearly 0. In actual experiments, we measure the total red signal in the photoconverted area, , and plot it against time. of a given time point is the slope of this curve at this time point (Figure 2). and can be measured, so by Equation [6), we can obtain .
The green signal in the photoconverted area on the PM, however, is affected by both exocytosis and the signal reduction factors. The exocytosed amount minus the reduced amount represents the net increase of the protein on the PM. If we denote the increase of total green fluorescence due to exocytosis as , the decrease of total green fluorescence due to the signal reduction factors as , and the net increase of total green fluorescence as , we have
| [7] |
Equation [6] can be translated to the green channel and we have
or
| [8] |
According to Equation [5], the relative exocytosis rate, , is given by
So we have
| [9] |
Substitute [8] and [9] into [7], we have
or
| [10] |
Again, we can plot the total green signal in the photoconverted area, , against time. The slope of this curve at time point gives (Figure 2). and can be measured. Substitute into Equation [10], we obtain .
In conventional FRAP method, the signal reduction factors are not considered, therefore in Equation [10] is ignored. For the same dataset obtained using PRK1-Dendra2 pollen tubes, we calculated the average exocytosis rates using cFRAPc method and the conventional FRAP method. As expected, the conventional FRAP method significantly underestimated the rate of exocytosis (Figure S2).
To validate our method, we first measured the exocytosis rate of pollen tubes treated with chemicals that disrupt exocytosis including Brefeldin A (BFA) and Latrunculin B (LatB) (Figure 3). If calculated by the conventional FRAP method, the exocytosis rates of cells treated with drugs are negative (Figure 4). The results obtained by the cFRAPc method, however, suggest that treatment by 2 ng/ml BFA for 45 min or 5 nM LatB for 45 min significantly reduced the exocytosis rate in pollen tubes to 11% and 20% of that in DMSO-treated cells, respectively (Figure 4).
Figure 3. cFRAPc imaging of PRK1-Dendra2 in Arabidopsis pollen tubes treated with exocytosis-disrupting drugs.
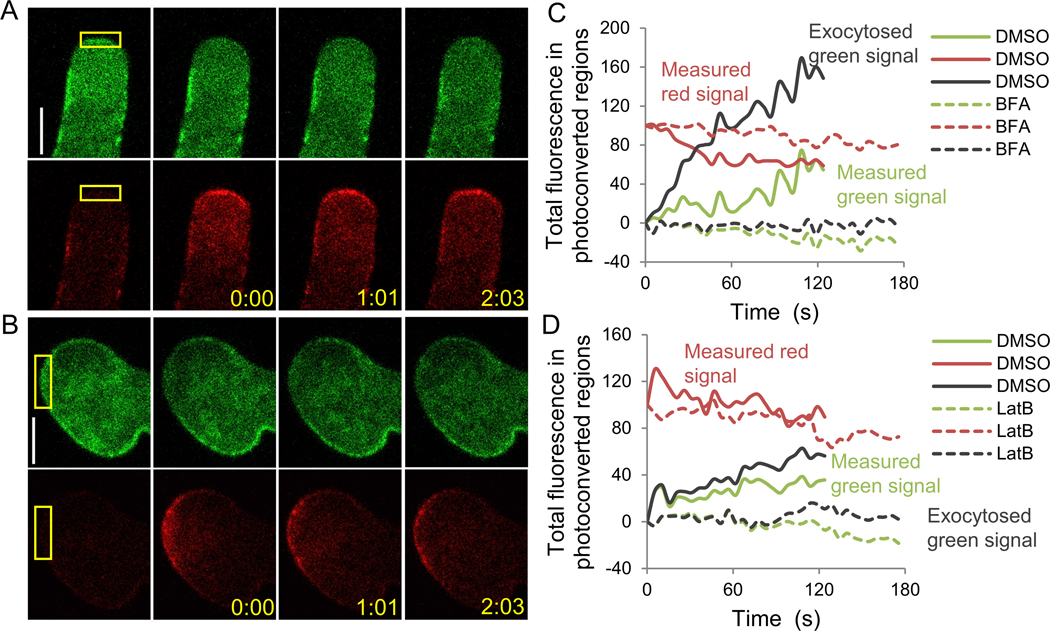
Shown are results of pollen tubes treated with 2 ng/ml BFA for 45 min (A, C) or 5 nM LatB for 45 min (B, D). (A, B) Representative cFRAPc images of drug treated pollen tubes (control cells treated with DMSO were not shown). Numbers show time after photoconversion (min:sec). Scale bars, 5μm. (C, D) Time-courses of measured total red signal, measured total green signal and exocytosed total green signal in the photoconverted regions of the representative cells in (A, B).
Figure 4. Average exocytosis rates of PRK1-Dendra2 in Arabidopsis pollen tubes treated with exocytosis-disrupting drugs.
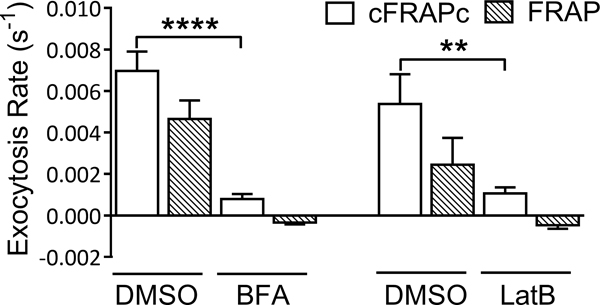
Results obtained by cFRAPc method and the conventional FRAP method are compared. Error bars show S.E.M.. ** P ≤ 0.01, **** P ≤ 0.0001 (unpaired Student’s t-test).
We then used this method to study the spatial distribution of exocytosis on the PM of pollen tubes. Results show that exocytosis at the extreme apex of pollen tubes is much more active than at the subapical region (Figure 5), agreeing with the reported apically-focused localization of exocytic machinery, the maximum cell wall thickness and strain rates at the tip, and the apical accumulation of PME in various pollen tubes (9, 11, 22, 23). However, the results are in conflict with several previous reports. By pulse-chase labeling with FM dyes and DIC microscopy, Zonia and Munnik (2008) reported exocytic vesicle fusion events at the subapical region of pollen tubes, where the vesicles were relatively sparse (5). They also observed massive exocytic vesicles accumulated at the apex of pollen tubes. However it is unclear whether the dynamic events observed by DIC microscopy indeed reflected exocytic activities, because this light microscopy technique is unable to resolve the high density and small size of vesicles in the extreme apex. Bove and Vaillancourt et al., (2008) also proposed that exocytosis is located at the sub-apex, based on the results of FRAP analysis with FM dye-stained pollen tubes (7). As discussed in our current work, active endocytosis and rapid cell membrane extension at the tip of pollen tubes may obscure the fluorescence recovery resulting from exocytosis. The rapid reduction of the red signal of photoconverted Dendra2 in cFRAPc experiments showed that this is indeed the case. Therefore, the results obtained by conventional FRAP may not be accurate.
Figure 5. Average exocytosis rates of PRK1-Dendra2 at the apex and the sub-apical region of Arabidopsis pollen tubes.
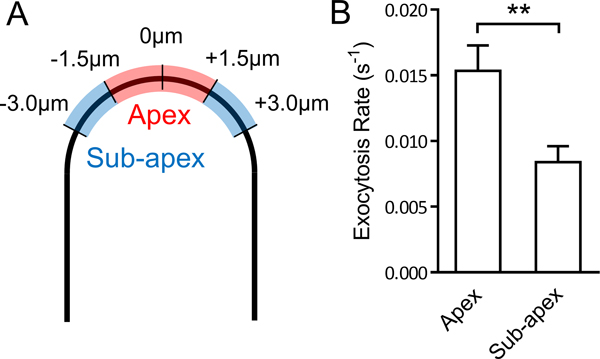
(A) A schematic diagram defining of the apex and the sub-apex on the PM of the tip of a pollen tube. Numbers show the distance to the vertex of the pollen tube. (B) Average exocytosis rates of PRK1-Dendra2 at the apex and the sub-apex of 12 pollen tubes. ** P ≤ 0.01 (unpaired Student’s t-test).
Previous studies suggest that elevated membrane trafficking at the tip of pollen tubes is associated with higher growth rate and growth reorientation (7, 8, 10). We plotted the exocytosis rate measured by cFRAPc versus the growth rate at the corresponding time points. Linear regression indicates that there is a positive correlation between the rate of exocytosis and growth, consistent with the role of exocytosis in delivering cell membrane and wall materials to the growing tip (Figure S4). However, the correlation is relatively weak, possibly resulting from roles of other factors in the regulation of pollen tube growth such as endocytosis that internalizes the secreted materials, and the time lag between the deposition and the expansion of cell wall.
Comparison with other methods
Other conventional methods for the quantification of exocytosis include electrophysiological approaches such as capacitance measurement and amperometric measurement, and optical approaches involving advanced microscopy techniques (1–3, 24, 25).
Fusion of exocytic vesicles to the PM results in a stepwise increase of cell surface area, which is proportional to cell capacitance. Measurement of cell membrane capacitance using the patch-clamp technique can therefore be used to monitor vesicle fusion events (26, 27). However, since the cell surface area is affected by endocytosis as well, the exocytosis rate measured by this method is biased. Additional bias could result from changes in capacitance independent of changes in the cell surface area. Another method, amperometry, detects the vesicle contents secreted to the medium using microelectrodes, but the major limitation of this method is that it requires the exocytosed substance to be electrochemically active and does not work for membrane proteins that are not discharged into the extracellular space (28–30). These electrophysiological methods have high temporal resolution, but lack spatial information of exocytosis and are not suitable to measure the exocytosis of a specific membrane protein.
One category of optical techniques for studying exocytosis relies on the visualization of exocytic vesicles. Differential Interference Contrast (DIC) microscopy is suited to observe large secretory vesicles in systems such as acinar cells (31–33). But in most cell types, vesicles are too small to be observed by DIC microscopy and have to be labeled by fluorescent styryl dyes such as FM1–43 (4, 5, 7, 15), or by vesicular proteins with fluorescent tags (11, 34). One of the commonly used fluorescent imaging techniques to observe exocytosis is Total Internal Reflection Fluorescence (TIRF) microscopy, which illuminates fluorescently labeled vesicles approaching the PM, and the abrupt disappearance of the vesicles indicates fusion events (2, 25, 35). Stimulated Emission Depletion (STED) microscopy with subdiffraction resolution far beyond that of conventional optical microscopy has recently been used to observe the components and behavior of exocytic vesicles in neuron cells (3, 36, 37). Since single exocytic events can be directly observed, these powerful techniques provide abundant information far beyond exocytosis rate and are used to reveal the molecular mechanisms of exocytosis.
Optical microscopy can also be used to observe the accumulation of cargo molecules from exocytic vesicles on the cell surface. For example, the secretion of fluorescently labeled PME to the cell wall was used to show exocytosis in the tip of pollen tubes (9, 11). In pollen tubes, the thickness and the strain rates of cell wall also reflect the level of exocytosis, as it secrets wall material and enzymes that results in cell wall extension (9, 23). In particular, a study has developed a method to calculate the number of exocytic events in pollen tubes and root hairs from the increase of cell wall volume and the volume of individual exocytic vesicles, which is measured from transmission electron microscopic (TEM) images (38). The main restriction of this method is that it can only be applied to walled-cells in which the cell wall materials are entirely secreted via exocytosis.
Comparing to methods developed in the previous studies, our method has several key advantages. Firstly, in addition to visualizing the process of exocytosis, our method is capable of accurately quantifying the rate of exocytosis. Very few of studies on exocytosis have developed algorithms to determine exocytosis rate from imaging data. Secondly, the results of other methods may be interfered by cellular activities that counterbalance the effect of exocytosis. For example, marker proteins of exocytic vesicles deposited to the cell surface may be internalized by endocytosis. In contrast, our method simultaneously visualizes these exocytosis-independent processes, thereby greatly improved the accuracy of the measurement. Thirdly, unlike the TIRF or STED-based method, the procedure of cFRAPc does not rely on detecting individual exocytic vesicles, and therefore can be used for measuring rapid exocytosis of a large population of vesicles. Finally, cFRAPc can be used to measure both the overall level of exocytosis in the cell and the exocytosis rate of a specific cell membrane protein or cell wall component.
Applications and limitations
In addition to accurate measurement of exocytosis, cFRAPc can be used to measure the endocytosis rate, if the reduction of the red Dendra2 signal caused by cell growth and lateral diffusion is proved to be negligible, in which case the signal reduction almost solely results from endocytosis. The dynamics of exocytosis and endocytosis measured simultaneously from the same cell will help understanding how these two counteracting processes are coordinated.
This method could be applied to various cell types with suitable protein-of-interest. However, for cells displaying high lateral diffusion rates of membrane proteins, the results would be unreliable. Pilot experiments are therefore needed to assess the level of lateral diffusion. These can be performed by a cFRAPc experiment upon treatment of cells with membrane trafficking-blocking chemicals (13). In general, this method works better in plant cells than in animal cells, since lateral diffusion of PM proteins is more restrained in plant cells due to the presence of a cell wall (39).
The cFRAP method determines a relative value of exocytosis rate, which is related to the nature of the protein of interest itself; more specifically, the amount of this protein carried by each exocytic vesicle. Therefore, it cannot be used to compare the exocytosis rate of different proteins, but is suitable for studying the exocytosis of one protein at different regions of cell membrane, under different cell culture conditions or in different genetic backgrounds. For example, we used cFRAPc to measure the exocytosis rates of PRK1 in Arabidopsis pollen tubes in the presence and absence of drugs such as BFA and LatB to study their effect on exocytosis. However, caution should be taken when one draws conclusions from the exocytosis of one protein to the general level of exocytosis of the cell, since different cargo proteins might be carried by different populations of exocytic vesicles. If cells have mutations or are treated by chemicals that only affect one specific type of exocytic vesicles, the changes in the overall exocytosis rate under these conditions cannot be represented by the measures obtained from a protein of interest by cFRAPc.
Materials and Methods
Generation of transgenic Arabidopsis plants
The cDNA of PRK1 [At5g35390, named RLK in (13)] was subcloned from pLAT52::RLK-GFP described in (13), and fused with Dendra2 (19) at the C terminus. The PRK1-Dendra2 fragment was then subcloned into a binary vector, pCL, which was constructed by inserting the pollen tube specific LAT52 promoter into pCAMBIA1300 using SalI and XbaI restriction sites. pCL::PRK1-Dendra2 was introduced to wild-type Arabidopsis thaliana Col-0 plants using Agrobacterium-mediated floral-dip method (40).
Pollen tube culture preparation
Transgenic Arabidopsis thaliana plants were grown at 22°C in growth rooms under a light regime of 16h of light and 8 h of dark. Pollen tubes were germinated on a solid pollen culture medium containing 18% (w/v) sucrose (Sigma-Aldrich), 0.01% (w/v) boric acid (Fisher), 1 mM CaCl2 (Sigma-Aldrich), 1 mM Ca(NO3)2 (Sigma-Aldrich), 1 mM MgSO4 (Sigma-Aldrich), and 0.5% (w/v) agar (Sigma-Aldrich). Pollen tubes were incubated at 28°C for 3 hours before cFRAPc imaging. For drug treatment, BFA (Sigma-Aldrich) or LatB (Sigma-Aldrich) dissolved in DMSO was added to liquid pollen culture medium (same as solid pollen culture medium except without agar) to a final concentration of 2 ng/ml or 5 nM, respectively. The liquid medium with drugs was then added to pollen tubes 45 minutes before imaging.
cFRAPc imaging
cFRAPc imaging was performed on an inverted laser scanning confocal microscope (Leica TCS SP5 DMI6000) equipped with image acquisition software Leica LAS AF. The green form of Dendra2 was excited by a 488 nm Argon laser line with 5% laser power and detected at 500–535nm; the red form was excited by a HeNe 543 nm laser line with 40% laser power and detected at 555–620 nm. Photoconversion of Dendra2 was performed by scanning the region-of-interest with 3% UV laser twice. Post-conversion time-lapse videos were taken immediately after photoconversion, with 5.16 s time interval between frames.
Image quantification
Image quantification was performed using the ImageJ software (version 1.45s). Before quantification, the images were smoothed using the “Smooth” function of ImageJ. The cFRAPc image series acquired by confocal laser scanning microscope are imported into ImageJ and analyzed mostly in the form of “Image Sequence”. To measure the average fluorescence intensity on the PM, a segmented line was drawn along the photoconverted PM region. To measure the average fluorescence intensity in the cytoplasm, a polygon was draw to cover most of the cytoplasm.
For each cell, the following quantities were measured: Firstly, the average background green and red signal intensity on the PM () were measured from the first frame of the post-conversion green channel image stack and the pre-conversion red channel image, respectively. Secondly, the length () and the average green and red signal intensity () of the photoconverted regions over time after photoconversion were measured from every frame of the post-conversion image stack. Finally, the average green signal intensity of the cytoplasm () was measured from the first frame of the post-conversion green channel image stack.
Data processing and calculation
For small datasets, the calculation of exocytosis rate was performed in Excel by the following procedure:
- Calculating total GFP () and total RFP (): at each time point, the total GFP and total RFP in the converted region on the PM are given by
where and are the corresponding values of each time point. - Calculating the signal reduction rate at : Plot the total RFP () versus time . Obtain the slope of the curve at , by creating a regression line using the data points nearby in Excel. According to Equation [6],
- Calculating exocytosis rate at : Plot the total GFP () versus time . Obtain the slope of the curve at , by creating a regression line using the data points nearby in Excel. According to Equation [10],
High-throughput calculation for large datasets was performed in MatLab. The MatLab M-file and a user guide for cFRAPc calculation are available from the Yang laboratory upon request.
Supplementary Material
Synopsis:
An optical method is developed to measure the exocytosis rate of plasma membrane or extracellular matrix proteins. In this method, the protein-of-interest is tagged with a green-to-red photoconvertible fluorescent protein; after photoconverting a region-of-interest on the cell surface, exocytosis-dependent and independent trafficking events are tracked simultaneously for accurate determination of exocytosis rate.
Acknowledgments
We thank members of the Yang laboratory for stimulating discussion of this work. The work is supported by the U.S. National Institute of General Medical Sciences to Z.Y. (GM100130).
References
- 1.Keighron JD, Ewing AG, Cans AS. Analytical tools to monitor exocytosis: a focus on new fluorescent probes and methods. Analyst 2012;137(8):1755–1763. [DOI] [PubMed] [Google Scholar]
- 2.Allersma MW, Wang L, Axelrod D, Holz RW. Visualization of regulated exocytosis with a granule-membrane probe using total internal reflection microscopy. Mol Biol Cell 2004;15(10):4658–4668. [DOI] [PMC free article] [PubMed] [Google Scholar]
- 3.Willig KI, Rizzoli SO, Westphal V, Jahn R, Hell SW. STED microscopy reveals that synaptotagmin remains clustered after synaptic vesicle exocytosis. Nature 2006;440(7086):935–939. [DOI] [PubMed] [Google Scholar]
- 4.Betz WJ, Bewick GS. Optical analysis of synaptic vesicle recycling at the frog neuromuscular junction. Science 1992;255(5041):200–203. [DOI] [PubMed] [Google Scholar]
- 5.Zonia L, Munnik T. Vesicle trafficking dynamics and visualization of zones of exocytosis and endocytosis in tobacco pollen tubes. J Exp Bot 2008;59(4):861–873. [DOI] [PubMed] [Google Scholar]
- 6.Cheung AY, Wu HM. Structural and signaling networks for the polar cell growth machinery in pollen tubes. Annu Rev Plant Biol 2008;59:547–572. [DOI] [PubMed] [Google Scholar]
- 7.Bove J, Vaillancourt B, Kroeger J, Hepler PK, Wiseman PW, Geitmann A. Magnitude and Direction of Vesicle Dynamics in Growing Pollen Tubes Using Spatiotemporal Image Correlation Spectroscopy and Fluorescence Recovery after Photobleaching. Plant Physiol 2008;147(4):1646–1658. [DOI] [PMC free article] [PubMed] [Google Scholar]
- 8.Parton RM, Fischer-Parton S, Watahiki MK, Trewavas AJ. Dynamics of the apical vesicle accumulation and the rate of growth are related in individual pollen tubes. J Cell Sci 2001;114(Pt 14):2685–2695. [DOI] [PubMed] [Google Scholar]
- 9.McKenna ST, Kunkel JG, Bosch M, Rounds CM, Vidali L, Winship LJ, Hepler PK. Exocytosis precedes and predicts the increase in growth in oscillating pollen tubes. Plant Cell 2009;21(10):3026–3040. [DOI] [PMC free article] [PubMed] [Google Scholar]
- 10.Coelho PC, Malho R. Correlative Analysis of [Ca](C) and Apical Secretion during Pollen Tube Growth and Reorientation. Plant Signal Behav 2006;1(3):152–157. [DOI] [PMC free article] [PubMed] [Google Scholar]
- 11.Bosch M, Cheung AY, Hepler PK. Pectin methylesterase, a regulator of pollen tube growth. Plant Physiol 2005;138(3):1334–1346. [DOI] [PMC free article] [PubMed] [Google Scholar]
- 12.Camacho L, Malho R. Endo/exocytosis in the pollen tube apex is differentially regulated by Ca2+ and GTPases. J Exp Bot 2003;54(380):83–92. [DOI] [PubMed] [Google Scholar]
- 13.Lee YJ, Szumlanski A, Nielsen E, Yang Z. Rho-GTPase-dependent filamentous actin dynamics coordinate vesicle targeting and exocytosis during tip growth. J Cell Biol 2008;181(7):1155–1168. [DOI] [PMC free article] [PubMed] [Google Scholar]
- 14.Yan A, Yang Z. FRAP-based analysis of Rho GTPase-dependent polar exocytosis in pollen tubes. Methods Mol Biol 2012;827:393–401. [DOI] [PubMed] [Google Scholar]
- 15.Moscatelli A, Idilli AI, Rodighiero S, Caccianiga M. Inhibition of actin polymerisation by low concentration Latrunculin B affects endocytosis and alters exocytosis in shank and tip of tobacco pollen tubes. Plant Biol (Stuttg) 2012;14(5):770–782. [DOI] [PubMed] [Google Scholar]
- 16.Axelrod D, Koppel DE, Schlessinger J, Elson E, Webb WW. Mobility measurement by analysis of fluorescence photobleaching recovery kinetics. Biophys J 1976;16(9):1055–1069. [DOI] [PMC free article] [PubMed] [Google Scholar]
- 17.Day CA, Kraft LJ, Kang M, Kenworthy AK. Analysis of protein and lipid dynamics using confocal fluorescence recovery after photobleaching (FRAP). Curr Protoc Cytom 2012;Chapter 2:t2–t19. [DOI] [PMC free article] [PubMed] [Google Scholar]
- 18.Carnell M, Macmillan A, Whan R. Fluorescence recovery after photobleaching (FRAP): acquisition, analysis, and applications. Methods Mol Biol 2015;1232:255–271. [DOI] [PubMed] [Google Scholar]
- 19.Chudakov DM, Lukyanov S, Lukyanov KA. Using photoactivatable fluorescent protein Dendra2 to track protein movement. Biotechniques 2007;42(5):553, 555, 557. [DOI] [PubMed] [Google Scholar]
- 20.Furtado A, Henry R. Measurement of green fluorescent protein concentration in single cells by image analysis. Anal Biochem 2002;310(1):84–92. [DOI] [PubMed] [Google Scholar]
- 21.Lorenzen A, Kennedy SW. A fluorescence-based protein assay for use with a microplate reader. Anal Biochem 1993;214(1):346–348. [DOI] [PubMed] [Google Scholar]
- 22.Hala M, Cole R, Synek L, Drdova E, Pecenkova T, Nordheim A, Lamkemeyer T, Madlung J, Hochholdinger F, Fowler JE, Zarsky V. An exocyst complex functions in plant cell growth in Arabidopsis and tobacco. Plant Cell 2008;20(5):1330–1345. [DOI] [PMC free article] [PubMed] [Google Scholar]
- 23.Rojas ER, Hotton S, Dumais J. Chemically mediated mechanical expansion of the pollen tube cell wall. Biophys J 2011;101(8):1844–1853. [DOI] [PMC free article] [PubMed] [Google Scholar]
- 24.Thorn P. Measuring calcium signals and exocytosis in tissues. Biochim Biophys Acta 2012;1820(8):1179–1184. [DOI] [PubMed] [Google Scholar]
- 25.Steyer JA, Horstmann H, Almers W. Transport, docking and exocytosis of single secretory granules in live chromaffin cells. Nature 1997;388(6641):474–478. [DOI] [PubMed] [Google Scholar]
- 26.Penner R, Neher E. The patch-clamp technique in the study of secretion. Trends Neurosci 1989;12(4):159–163. [DOI] [PubMed] [Google Scholar]
- 27.Fernandez JM, Neher E, Gomperts BD. Capacitance measurements reveal stepwise fusion events in degranulating mast cells. Nature 1984;312(5993):453–455. [DOI] [PubMed] [Google Scholar]
- 28.Albillos A, Dernick G, Horstmann H, Almers W, Alvarez DTG, Lindau M. The exocytotic event in chromaffin cells revealed by patch amperometry. Nature 1997;389(6650):509–512. [DOI] [PubMed] [Google Scholar]
- 29.Leszczyszyn DJ, Jankowski JA, Viveros OH, Diliberto EJ, Near JA, Wightman RM. Nicotinic receptor-mediated catecholamine secretion from individual chromaffin cells. Chemical evidence for exocytosis. J Biol Chem 1990;265(25):14736–14737. [PubMed] [Google Scholar]
- 30.Wightman RM, Jankowski JA, Kennedy RT, Kawagoe KT, Schroeder TJ, Leszczyszyn DJ, Near JA, Diliberto EJ, Viveros OH. Temporally resolved catecholamine spikes correspond to single vesicle release from individual chromaffin cells. Proc Natl Acad Sci U S A 1991;88(23):10754–10758. [DOI] [PMC free article] [PubMed] [Google Scholar]
- 31.Mooney J, Thakur S, Kahng P, Trapani JG, Poccia D. Quantification of exocytosis kinetics by DIC image analysis of cortical lawns. J Chem Biol 2014;7(2):43–55. [DOI] [PMC free article] [PubMed] [Google Scholar]
- 32.Campos-Toimil M, Edwardson JM, Thomas P. Real-time studies of zymogen granule exocytosis in intact rat pancreatic acinar cells. J Physiol 2000;528 Pt 2:317–326. [DOI] [PMC free article] [PubMed] [Google Scholar]
- 33.Chen Y, Warner JD, Yule DI, Giovannucci DR. Spatiotemporal analysis of exocytosis in mouse parotid acinar cells. Am J Physiol Cell Physiol 2005;289(5):C1209–C1219. [DOI] [PubMed] [Google Scholar]
- 34.Szumlanski AL, Nielsen E. The Rab GTPase RabA4d regulates pollen tube tip growth in Arabidopsis thaliana. Plant Cell 2009;21(2):526–544. [DOI] [PMC free article] [PubMed] [Google Scholar]
- 35.Lang T, Wacker I, Steyer J, Kaether C, Wunderlich I, Soldati T, Gerdes HH, Almers W. Ca2+-triggered peptide secretion in single cells imaged with green fluorescent protein and evanescent-wave microscopy. Neuron 1997;18(6):857–863. [DOI] [PubMed] [Google Scholar]
- 36.Sieber JJ, Willig KI, Kutzner C, Gerding-Reimers C, Harke B, Donnert G, Rammner B, Eggeling C, Hell SW, Grubmuller H, Lang T. Anatomy and dynamics of a supramolecular membrane protein cluster. Science 2007;317(5841):1072–1076. [DOI] [PubMed] [Google Scholar]
- 37.Westphal V, Rizzoli SO, Lauterbach MA, Kamin D, Jahn R, Hell SW. Video-rate far-field optical nanoscopy dissects synaptic vesicle movement. Science 2008;320(5873):246–249. [DOI] [PubMed] [Google Scholar]
- 38.Ketelaar T, Galway ME, Mulder BM, Emons AM. Rates of exocytosis and endocytosis in Arabidopsis root hairs and pollen tubes. J Microsc 2008;231(2):265–273. [DOI] [PubMed] [Google Scholar]
- 39.Martiniere A, Lavagi I, Nageswaran G, Rolfe DJ, Maneta-Peyret L, Luu DT, Botchway SW, Webb SE, Mongrand S, Maurel C, Martin-Fernandez ML, Kleine-Vehn J, Friml J, Moreau P, Runions J. Cell wall constrains lateral diffusion of plant plasma-membrane proteins. Proc Natl Acad Sci U S A 2012;109(31):12805–12810. [DOI] [PMC free article] [PubMed] [Google Scholar]
- 40.Clough SJ, Bent AF. Floral dip: a simplified method for Agrobacterium-mediated transformation of Arabidopsis thaliana. Plant J 1998;16(6):735–743. [DOI] [PubMed] [Google Scholar]
Associated Data
This section collects any data citations, data availability statements, or supplementary materials included in this article.