

Supplemental Digital Content is available in the text.
Keywords: apolipoprotein B-100; atherosclerosis; autoimmunity; T-lymphocytes; T-lymphocytes, regulatory
Background:
Throughout the inflammatory response that accompanies atherosclerosis, autoreactive CD4+ T-helper cells accumulate in the atherosclerotic plaque. Apolipoprotein B100 (apoB), the core protein of low-density lipoprotein, is an autoantigen that drives the generation of pathogenic T-helper type 1 (TH1) cells with proinflammatory cytokine secretion. Clinical data suggest the existence of apoB-specific CD4+ T cells with an atheroprotective, regulatory T cell (Treg) phenotype in healthy individuals. Yet, the function of apoB-reactive Tregs and their relationship with pathogenic TH1 cells remain unknown.
Methods:
To interrogate the function of autoreactive CD4+ T cells in atherosclerosis, we used a novel tetramer of major histocompatibility complex II to track T cells reactive to the mouse self-peptide apo B978-993 (apoB+) at the single-cell level.
Results:
We found that apoB+ T cells build an oligoclonal population in lymph nodes of healthy mice that exhibit a Treg-like transcriptome, although only 21% of all apoB+ T cells expressed the Treg transcription factor FoxP3 (Forkhead Box P3) protein as detected by flow cytometry. In single-cell RNA sequencing, apoB+ T cells formed several clusters with mixed TH signatures that suggested overlapping multilineage phenotypes with pro- and anti-inflammatory transcripts of TH1, T helper cell type 2 (TH2), and T helper cell type 17 (TH17), and of follicular-helper T cells. ApoB+ T cells were increased in mice and humans with atherosclerosis and progressively converted into pathogenic TH1/TH17-like cells with proinflammatory properties and only a residual Treg transcriptome. Plaque T cells that expanded during progression of atherosclerosis consistently showed a mixed TH1/TH17 phenotype in single-cell RNA sequencing. In addition, we observed a loss of FoxP3 in a fraction of apoB+ Tregs in lineage tracing of hyperlipidemic Apoe–/– mice. In adoptive transfer experiments, converting apoB+ Tregs failed to protect from atherosclerosis.
Conclusions:
Our results demonstrate an unexpected mixed phenotype of apoB-reactive autoimmune T cells in atherosclerosis and suggest an initially protective autoimmune response against apoB with a progressive derangement in clinical disease. These findings identify apoB autoreactive Tregs as a novel cellular target in atherosclerosis.
Clinical Perspective.
What Is New?
This is the first report to characterize CD4+ T cells recognizing apolipoprotein (apo) B in the mouse with a combination of a novel major histocompatibility complex II tetramer and single-cell transcriptomics, immunoreceptor sequencing, and functional evaluation.
In healthy mice, we detect a natural population of apoB-specific T cells with a mixed T-helper cell type (TH) 17/regulatory T cell phenotype and a regulatory, anti-inflammatory transcriptome.
Under hypercholesterolemic conditions, we observe a transformation of apoB-reactive T cells into pathogenic effector-like TH1/TH17 cells with inflammatory cytokine secretion.
We identify human apoB-reactive CD4+ T cells in the blood of patients with coronary artery disease that secrete TH1 and TH17 cytokines.
What Are the Clinical Implications?
We demonstrate a novel single-cell tool to characterize the role of apoB-reactive T cells in cellular autoimmunity and atherosclerosis.
Circulating apoB-reactive CD4+ T cells are more frequent in humans with clinically relevant atherosclerosis.
The instability of apoB-specific regulatory T cells has great implications for the future design of immunomodulatory strategies, such as preventative vaccination and the therapeutic transfer of genetically engineered chimeric antigen receptor regulatory T cells.
We present a cellular biomarker assay for the detection of circulating apoB-reactive cells. This type of assay may, in the future, allow us to estimate the individual immune risk in cardiovascular patients.
Atherosclerosis is a chronic inflammatory disease with an autoimmune component.1,2 Rupture of atherosclerotic plaques in arteries precipitates myocardial infarction and stroke.3 In the atherosclerotic plaque from mice and humans, autoreactive CD4+ T cells accumulate4,5 and specifically respond to peptides from apolipoprotein B (apoB), the core protein of low-density lipoprotein (LDL), in a major histocompatibility complex II (MHC-II)–dependent manner.4,6–8 Whether this immune response is pathogenic or protective is controversial: Some CD4+ T cells in the plaque are pathogenic T-helper type 1 (TH1) cells that secrete the proatherogenic cytokine interferon-γ (IFN-γ).1,9 However, vaccination with self-peptides from apoB induces atheroprotective regulatory T cells (Tregs) that secrete the immunosuppressive cytokine interleukin (IL)-10.10 Genetic absence of MHC-II aggravates de novo atherosclerosis, suggesting that autoimmunity is partially atheroprotective.11,12 However, antigen specificity and the relationship of atheroprotective apoB-specific Tregs13–15 with proatherogenic apoB-specific TH1 cells are unknown.6,8,16 Tregs represent a subset of CD4+ T cells that express the transcription factor FoxP3 (Forkhead Box P3) and the high-affinity IL-2 receptor (CD25). Tregs are immunosuppressive and control pathogenic effector T cells (Teffs) in autoimmune disease17.Tregs in young mice consistently protect against atherosclerosis.13,14 However, TH1 and other Teffs in late atherosclerosis show a substantial phenotypic and transcriptional overlap with Tregs.16,18 We recently reported the existence of a Treg population recognizing 1 human apoB epitope, p18, in women without atherosclerosis that was replaced by proatherogenic TH17/TH1 cells in women with subclinical atherosclerosis.15 These observations suggest that Tregs confer atheroprotection initially, but give rise to a proatherogenic immune response in later stages of disease.1,12
Methods
An expanded methods section is available in the Data Supplement.
Data Availability
Raw and processed sequencing data are available at the National Center for Biotechnology Information Gene Expression Omnibus repository (GSE149070). All other data, methods, and materials that support the findings of this study are available from the corresponding author on reasonable request.
Mouse Experiments
All mouse studies were approved by an institutional review board. All experiments were performed according to institutional guidelines. All mice were female. Apoe–/– mice were fed a standard chow diet (CD) or, to induce atherosclerosis, with a Western diet (WD; 42% kcal from fat, 0.2% cholesterol, Envigo, No. TD.88137). Atherosclerotic lesions were visualized by Sudan-IV.
Adoptive Transfer Studies
ApoB-specific CD4+ T-cell subsets were flow sorted from lymph nodes from CD45.1 Apoe–/– mice. T cells pooled from 3 donor mice were used per recipient. Cells were injected retro-orbitally (2×10⁵) into 8-week-old CD45.2 Apoe–/– mice. WD feeding started simultaneously and was continued for 12 weeks.
Fate Mapping of Tregs
Foxp3-YFP-Cre crossed to Rosa26-fl-STOP-fl-RFP Apoe–/– mice were used to display historic/current FoxP3 expression (RFP+) in conjunction with current expression of FoxP3-YFP.
Flow Cytometry
Cell suspensions were incubated with fluorochrome-coupled antibodies against the indicated antigens. If not otherwise indicated, the term T cell refers to CD45+L/D–dump-TCR-β+CD8-CD4+ cells not further gated for CD44.
ApoB:MHC-II Multimers
ApoB:MHC monomers were expressed as previously described19 and coupled to streptavidin-phycoerythrin or streptavidin-allophycocyanin to generate tetramers. Alternatively, biotinylated monomers were coupled to streptavidin-phycoerythrin or streptavidin-allophycocyanin labeled dextran backbones by Immudex (Copenhagen, Denmark) for the isolation of apoB-reactive CD4+ T cells used in adoptive transfer studies.
Peptide:MHC Multimer Staining
CD4+ T cells were enriched by a negative magnetic bead separation eliminating CD11b+/CD11c+/F4/80+/Nk1.1+/CD19+/B220+/Ter-119+/CD8+ cells followed by an incubation with apoB:MHC-streptavidin-phycoerythrin and apoB:MHC-streptavidin-allophycocyanin tetramers or dextramers for 1 hour at room temperature.
RNA Sequencing
RNA sequencing of CD4+ T-cell subsets was performed after flow sorting. After isolation of RNA, libraries were prepared with a SMART-Seq v4 Ultra Low Input RNA Kit by Clontech and the Nextera XT Kit (Illumina). Samples were sequenced in pools of 7 to 8 samples on a HiSeq 4000.
Single-Cell RNA Sequencing
Suspensions of sorted T cells were isolated and single-cell gene expression was quantified by drop sequencing (10×Genomics).20 Single-cell RNA sequencing data sets were processed using the Cell Ranger software suite and analyzed by the analysis package SEURAT.
Identification of Human MHC-II Restricted ApoB Peptides
The human apoB sequence was screened for MHC-II-peptide binding motifs in silico. Candidate sequences were tested in affinity measurements of purified MHC-II molecules with apoB peptides using a classical competitive inhibition assay with high-affinity radio-labeled MHC-II ligands.
Clinical Study
This study was approved by the local Institutional Review Board at the University of Freiburg, Germany. All participants gave informed consent. Patients undergoing coronary angiography at an age of 43 to 90 years at the University Heart Center in Freiburg, Germany, were included in the ANIMATE trial (Adaptive Immunity in Human Atherosclerosis). Patients were divided in groups with stenotic coronary artery disease (CAD) and without coronary atherosclerosis (no CAD). Whole-blood samples were stimulated with a pool of 30 human apoB peptides, irrelevant control peptides, phorbol myristate acetate/ionomycin, staphylococcal enterotoxin B, or a blocking anti–MHC-II antibody in the presence of a stimulating anti-CD28 antibody for 6 hours before intracellular cytokines (CD40 ligand [CD40L], tumor necrosis factor-α, interferon-γ [IFN-γ]) and the surface markers CD69, CD25, CD38, and HLA-DR were quantified by flow cytometry. For the measurements of IL-17 and IL-10, peripheral blood mononuclear cells were isolated and restimulated with apoB peptides in vitro. After 5 days, IL-2 was added to the cell culture media, and cells were cultured for an additional 5 days, followed by intracellular cytokine staining and flow cytometry.
Statistical Analyses
The number of mice in the experimental groups was based on power analysis. Data are expressed as mean±SEM throughout the article. Statistical tests are indicated in each figure.
Results
ApoB-Reactive CD4+ T Cells (apoB+) Reside in Lymph Nodes of Healthy Mice
ApoB is an immunogen capable of inducing an antigen-specific CD4+ T-cell response.4,6–8 Binding of apoB peptides to MHC-II on antigen-presenting cells is a requirement for antigen recognition by CD4+ T cells.21 To generate a map of the autoreactive peptidome (Figure 1A), we screened mouse apoB for sequences with a high binding affinity to mouse MHC-II (I-Ab) by computational prediction and competitive binding assays.22 Among all potential apoB self-peptides identified, 6 peptides have previously been shown to be functionally relevant in peptide-based immunization of atherosclerosis-prone mice15,22,23 (Table I in the Data Supplement). The apoB peptide p6 (apo B978-993, sequence TGAYSNASSTESASY) is located in the surface region of apo B48 and apo B100 at the interface of the amphipathic core region and induces an antigen-specific T-cell response with cellular proliferation and cytokine secretion.22 ApoB:p6-reactive T cells generated by immunization have been shown to promote24 or prevent22 atherosclerosis in mice and are therefore ideal to study the function of apoB-reactive T cells.
Figure 1.

A population of oligoclonal apoB-reactive CD4+ T cells (apoB+) resides in lymph nodes of healthy C57Bl/6 mice.
A, MHC-II peptide binding map of mouse apoB. The binding affinity of apoB peptides spanning the whole apoB sequence was predicted in silico and expressed as percentile relative to all other predicted values (gray, left y axis). Measured binding affinity of peptides (right y axis) in a competitive binding assay is shown in white. Peptides with proven relevance in the Apoe–/– mouse model of atherosclerosis are shown in green. B, Design of the apo B978-993:MHC tetramer. APC and PE were used in separate batches of tetramers. C, Confocal microscopy of mouse lymph node CD4+ T cells after incubation with PE- and APC-labeled apoB:MHC tetramers and anti-TCR-β-FITC. D, Gating strategy in flow cytometry to identify apoB+ CD4+ T cells with a positive signal for apoB:MHC tetramers in both colors (PE and APC). Percentage of apoB+ cells among all CD4+ T cells indicated in the graph (red). CD4+ T cells negative for the apoB:MHC tetramer were termed apoBneg. E, Eight-week-old wild-type C57BL6/J or MHC-II–mismatched BALBc mice immunized with mouse apo B978-993 in adjuvant CFA subcutaneously. The adjuvant CFA alone (adjuvant) or saline (none) served as controls (n=4–8 mice per group). F, Expression of the TCR-signaling intermediate Nur77 in all or CD44+ apoBneg and apoB+ cells from Nur77-GFP reporter mice in response to vaccination with apo B978-993 (n=3 mice per group). G, Parallel DNA sequencing of the TCR β-chain. Percentage of the 10 most abundant unique TCR-clonotypes (coded in colors) within all apoBneg and apoB+ cells from 3 pooled mice per group. H, Fractional TCRβ V-chain usage among all apoBneg and apoB+ cells.; All bars indicate mean values per group. **P<0.01, ****P<0.001 by ANOVA with Dunnett multiple comparison test (E) and an unpaired, 2-sided t test (F). Representative pictures shown in C and D. apoB indicates apolipoprotein B; APC, allophycocyanin; CFA, complete Freund's adjuvant; FITC, fluorescein isothiocyanate; FSC, forward scatter; GFP, green fluorescent protein; IDL, intermediate-density lipoprotein; L/D, live/dead viability stain; LDL, low-density lipoprotein; LDLR, low-density lipoprotein receptor; Lin., lineage-defining antibodies against CD19/B220/CD11b/CD11c/Nk1.1/TER-119/CD8; MFI, mean fluorescent intensity; MHC-II, major histocompatibility complex II; PE, phycoerythrin; SSC, side scatter; TCR, T-cell receptor; and VLDL, very low density lipoprotein.
To characterize apoB-reactive T cells (apoB+) at the single-cell level, we designed a fluorochrome-coupled tetramer of recombinant MHC-II from C57Bl/6 mice (I-Ab) fused to the apoB-peptide p6 (p6:MHC) (Figure 1B). Fluorochrome-labeled p6:MHC bound to CD4+ T cells, colocalized with the T-cell receptor (TCR; Figure 1C), and defined an apoB-reactive T-cell population (apoB+) in flow cytometry that mostly represented activated CD44+ T cells (Figure 1D). We found apoB-reactive T cells in the lymph nodes (cervical, axillary, mesenteric, para-aortic, and inguinal), but not in the spleen, of 8-week-old female wild-type (WT) mice on a C57BL/6J background (Figure 1E, Figure I in the Data Supplement). These results indicate the existence of a naturally occurring population of apoB-reactive T cells in healthy mice that is predominantly located in lymph nodes draining the aorta and other large arteries. We validated the specificity of cells detected by p6:MHC. First, the number of apoB+ cells was elevated after a single immunization with p6 and the adjuvant complete Freund's adjuvant, but not with the complete Freund's adjuvant alone (Figure 1E). Second, we detected no apoB+ T cells in BALBc mice, which express an MHC-II-allele (I-Ae) different from I-Ab in C57BL/6J mice. Third, binding of apoB p6:MHC correlated with a higher signal of green fluorescent protein in Nur77-GFP transgenic reporter mice in activated CD44+ apoB+ cells after vaccination with apo B978-993, which indicates enhanced TCR signaling after binding of the cognate antigen (Figure 1F). Fourth, apoB+ cells secreted the cytokine IL-17 in an ELISPOT assay after restimulation with p6 (Figure II in the Data Supplement). Fifth, TCR-β sequencing showed that apoB+ cells were oligoclonal with the top 10 clones accounting for >70% of all unique TCR-β sequences (Figure 1G, Data Files I and II in the Data Supplement) with an overrepresentation of the TCR-β V-chain segments Vβ02-01 and Vβ13-02 (Figure 1H). The clonality index was 0.32 in 5168 sequenced apoB+ cells in comparison with 0.05 in 411 397 apoBneg cells (Figure III in the Data Supplement). Therefore, our findings suggest the existence of a natural population of clonally expanded apoB+ CD4+ T cells in lymph nodes of mice.
Pool of ApoB-Reactive (apoB+) Antigen-Experienced Memory CD4+ T Cells Exists in Atherosclerosis-Prone Apoe–/– Mice
Atherosclerosis-prone Apoe–/– mice have increased numbers of antigen-experienced memory CD4+ T cells in late disease,25 but it is unknown whether this T-cell memory is antigen specific. Therefore, we asked how apoB+ T cells were affected in Apoe–/– mice that exhibit increased levels of circulating LDL and, thus, of the autoantigen apoB. Using flow cytometry of CD4+ T cells from peripheral lymph nodes of 8-week-old WT mice, we found that the apoBneg cell population, which represents the bulk of non–apoB-specific cells, mainly consisted of naive, antigen-unexperienced T cells (CD62L+CD44–) and only small fractions of effector memory T cells (TEM, CD62L–CD44+) and central-memory T cells (TCM, CD62L+CD44+). The proportion of TEM and TCM in apoB+ T cells from WT mice was larger than in bulk CD4+ T cells (Figure 2A) but similar to CD4+ T cells recognizing the M25-peptide from murine cytomegalovirus (MCMV), suggesting an enhanced baseline memory status of MHC-II tetramer–selected T cells rather than an antigen-specific activation of apoB+ cells in WT mice. In contrast, the fraction of apoB+ memory T cells was higher in Apoe–/– (82%) than in WT mice (42%; Figure 2A). This increase was antigen specific. First, atherosclerosis-irrelevant MHC-II tetramer–selected CD4+ T cells recognizing the autoantigens 2W1S (Eα protein), MOG (myelin oligodendrocyte glycoprotein), and the foreign MCMV-peptide M9 contained smaller proportions of memory T cells than apoB+ cells in Apoe–/– mice (Figure IV in the Data Supplement). Second, the lack of apoE alone did not cause activation of M25-specific cells, which showed a similar degree of activation in WT and Apoe–/– mice (Figure 2A). Third, M25-specific cells reached a comparably strong TEM/CM commitment only after infection with MCMV, their cognate antigen (Figure 2A). Collectively, these findings suggest that apoB+ cells are increasingly activated under conditions of hyperlipidemia in Apoe–/– mice. Accordingly, numbers of apoB+ cells, but not of MCMV-reactive T cells (Figure V in the Data Supplement), increased to 1232±299 in young Apoe–/– mice in comparison with 368±72 apoB+ cells in WT mice (Figure 2B). This increase in hyperlipidemic Apoe–/– mice may be caused by an antigen-induced proliferation as previously shown for plaque CD4+ T cells that proliferate after restimulation with LDL.8 Indeed, we found enhanced proliferation of apoB+ cells in mice consuming a proatherogenic WD as assessed by bromodeoxyuridine incorporation (Figure 2C): 7% of the apoBneg cells in lymph nodes but >21% of apoB+ cells proliferated (bromodeoxyuridine+) and expressed higher amounts of the proliferation marker Ki-67 (Figure 2D through 2F). These results were consistent even when proliferation was quantified in the CD44+ fraction of cells (Figure 2E and 2F). Collectively, our data demonstrate that the generation of apoB-reactive memory T cells precedes relevant atherosclerotic disease.
Figure 2.
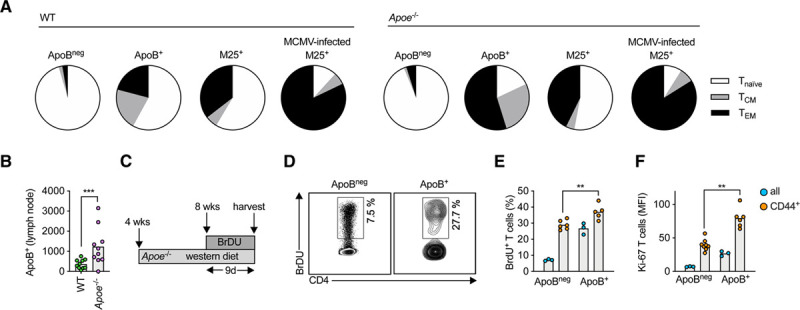
Lymph node apoB-reactive T cells acquire a proliferating and memory phenotype in atherosclerosis-prone Apoe–/– mice.
A, The fraction of antigen-unexperienced Tnaive (CD44– CD62L+, white), antigen-experienced T-effector memory (TEM, CD44+CD62L–, black), and T central memory (TCM, CD44+CD62L+, gray) cells among all antigen-specific T cells of the specificity shown (apoB+ or MCMV-specific M25+) was quantified in flow cytometry and expressed as percent of all cells. T cells were isolated from 8-week-old wild-type (WT) or Apoe–/–mice (n=5 mice per group). M25+ indicates T cells binding a MCMV:MHC-II tetramer. If indicated, Apoe–/– mice were infected with MCMV to induce antigen-specific T cells (n=5 mice). B, Number of apoB+ T cells in pooled lymph nodes of 4- to 8-week-old WT and atherosclerosis-prone Apoe–/– mice on a chow diet (CD). Numbers expressed as total numbers per mouse (n=10 mice per group). C, Four-week-old, female Apoe–/– mice consumed a Western diet (WD) for 4 weeks. BrDU was incorporated in the drinking water for an additional 9 days (n=3–8 mice per group). D, Proliferating CD4+ T cells (% all CD4+ T cells or CD44+ CD62L– T cells) were identified by binding of an anti-BrDU FITC antibody in flow cytometry. Representative gating for all cells is shown in D. E, Quantification of proliferating T cells (BrdU+) within indicated populations. F, Quantification of the mean fluorescence intensity of a Ki-67-BV786 antibody. All bars indicate mean values per group. **P<0.01, ***P<0.001 by an unpaired, 2-sided t test (B, E, and F). BrdU indicates bromodeoxyuridine; FITC, fluorescein isothiocyanate; MCMV, murine cytomegalovirus; MFI, mean fluorescent intensity; MHC-II, major histocompatibility complex II; and WT, wild-type.
ApoB-Reactive T Cells Coexpress Marker Proteins and Transcripts of Treg, TH1, TH17, and TFH cells
CD4+ T cells may differentiate into distinct T-helper cell types with specific transcription factors, cytokines, and functional outcomes: IL-10+ FoxP3+ Tregs are atheroprotective, whereas IFN-γ+T-bet+ TH1 cells are proatherogenic. The role of TH2 (IL-4+GATA3+), TH17 (IL-17+RORγT+), and TFH (CXCR5+Bcl-6+) cells is less clear.1 We systematically determined the phenotype of apoB+ cells in flow cytometry (Figure VI in the Data Supplement): About 70% of all apoB+ cells isolated from lymph nodes of 8-week-old Apoe–/– mice expressed the TH17 transcription factor RORγT (Figure 3A). The fraction of RORγT+ was similar in activated CD44+ and in naive CD44neg cells (Figure 3B, Figure VII in the Data Supplement). In the CD44+ fraction ≈5% of apoB+ cells were Tregs and expressed FoxP3 alone, whereas ≈16% coexpressed FoxP3 and RORγT (Figure 3B and 3C), indicative of TH17/Treg cells that may be in transition from 1 TH lineage to another. In the corresponding apoBneg population, the only substantially expressed transcription factor was FoxP3 in ≈25% of CD44+ apoBneg cells (Figure 3C). Additional transcription factors in apoBneg cells became detectable after prolonged feeding with a WD in Apoe–/– mice (Figure VIII in the Data Supplement). M25+ and M09+ MCMV-reactive cells mainly expressed Bcl-6 and RORγT+ after MCMV infection (Figure IX in the Data Supplement). These results demonstrate that MHC-II tetramers do not selectively select a particular TH type. Second, we interrogated the transcriptome of apoB+ cells by performing RNA sequencing and gene set enrichment analysis against transcriptomes of the mouse T-cell atlas.26 This strategy revealed the strongest transcriptional overlap of apoB+ cells with Tregs despite the predominant expression of RORγT (RAR-related orphan receptor) in flow cytometry (Figure 3D). In accord, apoB+ cells expressed intermediate levels of Treg genes, such as Foxp3, Il2ra, Ctla4, and Il10 in comparison with apoBneg cells. ApoB+ cells also expressed high levels of TH17 (Rora, Il21, Il17a), TH1 (Ifng, Tbx21, Cxcr3), and TFH (Cxcr5, Bcl6) marker genes (Figure 3E, Data File III in the Data Supplement). In direct comparison with distinct Treg and Teff transcriptomes, apoB+ cells were closer to the previously reported atherosclerosis-specific CCR5+ Teffs, which express FoxP3 and T-box expressed in T cells (T-bet) simultaneously,16 than to Tregs in principal component analysis and gene set enrichment analysis (Figures X and XI in the Data Supplement). Third, apoB+ cells expressed the cytokines IL-17, IFN-γ, and IL-10 after in vitro stimulation with phorbol myristate acetate/ionomycin (Figure 3F). Collectively, these data indicate an unexpected mixed Treg-Teff phenotype of apoB+ cells.
Figure 3.

ApoB-reactive CD4+ T cells simultaneously express cellular markers and transcripts of regulatory and TH1, TH17, and TFH cells.
A and B, Expression of the TH-lineage–defining transcription factors FoxP3, RORγT, GATA3, T-bet, and Bcl-6 (TFH) by flow cytometry. Lymph node CD4+ T cells from 8-week-old Apoe–/– mice (n=5 per group) were stained with apoB:MHC. C, Expression of TFs shown as frequency distribution with RORγT in the inner and FoxP3 in the outer circle. D, Gene-set enrichment of a Treg gene signature in apoB+ versus apoBneg non-Treg genes. Gene expression was quantified in RNA sequencing of sorted CD4+ T cells from pooled lymph nodes of 3 replicates of 8-week-old female Apoe–/– mice on a chow diet (each pooled from lymph nodes of 10 mice): apoBnegCD25+FR4+ (apoBneg Treg), apoBneg non-Treg (apoBnegCD25-FR4-), and apoB+ (10 mice pooled per replicate). Gene expression is displayed as log10(RPKM). E, Gene expression of TH-defining genes displayed in a heat map as log10(RPKM) and column min.-max. expression. F, Cytokine expression (% cytokine+ among all T cells) in intracellular flow cytometry from 3 to 5 mice per group. G, scRNAseq of sorted apoBneg and apoB+ cells from 3 individual mice. Single-cell transcriptomes were analyzed with a dimensionality reduction algorithm to identify groups of cells with similar gene expression. H, Average cluster gene expression (transcripts/cell) is displayed as heat map with column min.-max. expression (transcripts per cluster). All bars indicate mean values per group. *P<0.05, ***P<0.001, ****P<0.001 by an unpaired, 2-sided t test. Representative pictures are shown in B and D. 10x Gen. indicates 10x Genomics; apoB, apolipoprotein B; ES, enrichment score; FACS, fluorescence-activated cell sorting; FoxP3, Forkhead Box P3; IL-10, interleukin-10; IL-17, interleukin-17; IFN-γ, interferon γ; MHC, major histocompatibility complex; min.-max., minimum-maximum; Mix., clusters that are equally populated by apoBneg and apoB+ T cells; RORγT, RAR-related orphan receptor γ; RPKM, reads per kilobase per million; scRNAseq, single-cell RNA sequencing; Seq., sequencing; T-bet, T-box expressed in T cells; TFs, transcription factors; TH, T-helper cell type; Treg, regulatory T cell; and tSNE, t-distributed stochastic neighbor embedding.
We next performed single-cell RNA sequencing to directly test the existence of mixed Treg/TH17/TH1/TFH phenotypes at the single-cell level (Figure 3G). We therefore prefiltered the transcriptomes of apoB+ and apoBneg T cells positive for at least 1 lineage-defining gene (transcription factors and cytokines) and allowed these to cluster in an unsupervised multidimensionality reduction by t-distributed stochastic neighbor embedding. Most of the apoB+ T cells clustered separately from apoBneg T cells. Of the overall 13 clusters, we detected several classical Treg clusters (1/4/5/8) with high or intermediate expression of Foxp3 and Il2ra (CD25), which were dominated by apoBneg T cells with a relative enrichment of apoBneg T cells 5- to 10-fold higher than apoB+ cells. In contrast, apoB+ cells selectively accumulated in clusters with gene expression indicative of Treg/TH17 cells, such as Rorc and Foxp3 (cluster 12, 3-fold enrichment) or TH17/TH1 cells (IL17f, Tbx21, cluster 6, 8.9-fold enrichment), or Treg/TH1/TFH cells (Il10, Ifng, cluster 3, 2.7-fold enrichment; Figure 3H, Table II in the Data Supplement). These data demonstrate the existence of single apoB+ cells with simultaneous expression of Treg/TH17/TH1 genes, a phenotype that was only incompletely reflected by a predominant RORγT protein expression in flow cytometry.
ApoB-Reactive CD4+ Tregs Acquire a Proinflammatory Phenotype Over Time
We next aimed to clarify the temporal relationship of the Treg-like transcriptome of apoB+ T cells in healthy mice and the reported proinflammatory phenotype in established disease and old Apoe–/– mice7,16. The proportion of TEM/TCM within the pool of apoB+ cells did not change with an age beyond 8 weeks or the feeding with an atherosclerosis promoting WD (Figure XII in the Data Supplement). However, we found that cells exclusively expressing FoxP3 (Tregs) in flow cytometry disappeared among apoB+ T cells in CD-consuming 20-week-old Apoe–/– mice. While the proportion of FoxP3+RORγT+ cells (TH17/Treg) remained constant, a novel apoB+ subpopulation expressing T-bet and RORγT, indicative of proinflammatory TH1/TH17 cells, was formed in 20-week-old mice (Figure 4A). At 20 weeks, most of the apoB+ cells expressed RORγT+ (70.5±1.8 versus 95±3.1% in 8- versus 20-week-old mice, respectively).We consistently observed an upregulation of several pathways associated with the proinflammatory cytokines IL-6, IL-1β, tumor necrosis factor-α, and with TH17 and TH1 genes in apoB+ cells from 20- versus 8-week-old mice in RNA sequencing (Figure 4B, Data File III in the Data Supplement). Gene set enrichment analysis of TH-gene signatures indicated a selective rise of TH1 and TH17 (false discovery rate<0.2) transcriptomes in apoB+ cells from older mice (Figure 4C). We consistently observed a gradual increase of several genes indicating TH17-, TH1-, and cholesterol-associated pathways in apoB+ cells from 20-week-old mice (Figure 4D). Collectively, these findings corroborate that the Treg-dominated transcriptome of young apoB+ cells undergoes a gradual proinflammatory transformation over time.
Figure 4.

ApoB-reactive CD4+ T-regulatory cells acquire a proinflammatory TH1-TH17 phenotype in the course of atherosclerosis.
A, Expression of the TH-lineage–defining transcription factors (TFs) T-bet, FoxP3, RORγT among apoB+ cells by intracellular flow cytometry (%) in five 8- and 20-week-old female Apoe–/– mice consuming chow diet (CD). All CD4+ T cells were gated as parent population. B, Changes in the expression of pathways assigned to transcriptional master regulators in 4- and 20-week-old female Apoe–/– mice on CD determined in bulk RNA sequencing of apoB+ cells and ingenuity pathways analysis (IPA) from 2 to 3 replicates with cells from 10 pooled mice each. A positive activation z-score indicated an upregulation of the pathway in 20-week-old animals. C, Gene set enrichment analysis (GSEA) of TH-gene signatures on apoB+ T cells from 20- versus 4-week-old mice. An false discovery rate of <0.2 is considered significant. D, Differentially expressed genes in apoB+ cells displayed in a heat map with minimum and maximum values in a heat map. Values were log10 normalized. E, T cells from Foxp3-YFP-Cre/ROSA26-RFP/Apoe–/–lineage tracker mice express a FoxP3-YFP-fusion protein exclusively in current Tregs, whereas the RFP transgene is permanently expressed in cells in which FoxP3 was ever expressed. RFP+YFP–T cells were termed exTregs. F, Percentage of exTregs and current Tregs in aortic CD4+ T cells. G and H, Percentage of exTregs among apoB+ and apoBneg cells (%) in lymph nodes of female Apoe–/– Treg lineage tracer mice after a CD or Western diet for 20 weeks (n=3–8 mice per group). All bars indicate mean values per group. *P<0.05, **P<0.01, ***P<0.001, ****P<0.001 by an unpaired, 2-sided t test. Representative pictures are shown in H. apoB indicates apolipoprotein B; RFP, red fluorescent protein; RORγT, RAR-related orphan receptor γ; RPKM, reads per kilobase million; TH, T-helper type; Treg, regulatory T cell; and YFP, yellow fluorescent protein.
A loss of protective gene expression could be caused by the outgrowth of proinflammatory cell clones1 or a transformation of single cells driven by the loss of FoxP3.18,27 To monitor the expression of FoxP3 in apoB+ cells, we used a Foxp3-YFP-Cre/ROSA26-RFP mouse on an Apoe–/– background, in which current Tregs (YFP+RFP+) are distinguishable from exTregs that lost FoxP3 (YFP–RFP+; Figure 4E). Consistent with previous reports,27 more than one-fourth of T cells from atherosclerotic aortas were exTregs (Figure 4F), supporting that the switch of Tregs into alternative phenotypes frequently occurs in the setting of atherosclerosis. In flow cytometry, bulk exTregs produced significantly more IFN-γ (Figure XIII in the Data Supplement), which argues for a TH1-like proinflammatory phenotype of exTregs. We found an increased fraction of exTregs in apoB+ cells from lymph nodes of WD-consuming Apoe–/– mice, but not in control cells or under CD (Figure 4G and 4H). These data indicate that FoxP3 is preferentially lost in apoB+ cells in hypercholesterolemia. Bulk FoxP3+ Tregs from 8-week-old Apoe–/– transferred into 24-week-old Apoe–/– mice mostly lost FoxP3 and consistently started expressing RORγT and T-bet after 6 weeks, depending on organ homing (Figure XIV in the Data Supplement). These findings propose that the proinflammatory environment of atherosclerosis favors the conversion of apoB+ Tregs into Teffs.
Disease Progression Induces a Selective Expansion of TH17/TH1 Cells in the Atherosclerotic Plaque
Because of the coexisting TH17/TH1 transcriptome of apoB+ cells in lymph nodes, we asked how this phenotype was related to T cells in the atherosclerotic plaque. Therefore, we performed single-cell RNA sequencing of aortic T cells from Apoe–/– mice fed a CD or a WD for 12 weeks20 (Figure 5A). Among Cd3e+Cd4+Cd8a– cells from CD- and WD-fed animals, we identified 4 distinct CD4+ T-cell clusters that each contained cells from CD- and WD-fed animals (Figure 5B) and expressed cluster-specific genes that were regulated between clusters independent of the diet (Figure 5C, Figure XV in the Data Supplement, Data File IV in the Data Supplement). Two aortic clusters were regulated between moderate (CD-fed) and aggravated (WD-fed) atherosclerosis (Figure 5D): Cluster 1 coexpressed TH1, TH17, and residual Treg genes and increased >2-fold in mice on WD, whereas cluster 4 coexpressed Treg/TH2/TFH genes and decreased on WD (Table III in the Data Supplement). Cluster 2 expressed TH1 and Treg genes and did not vary between CD and WD (Figure 5E). These data establish TH1 and TH17 as the predominant transcriptional programs in lesional T cells. Because apoB+ cells detected by the apoB tetramer are rare and only detect cells specific for 1 single apoB peptide, we performed a transcriptional estimation of the proportion of all apoB+ T cells in aortic plaques. Therefore, we overlaid the enrichment of the apoB+ gene signature from bulk RNA sequencing (Table IV in the Data Supplement) on cells in the t-distributed stochastic neighbor embedding reduction (Figure 5F). This approach demonstrated a strong enrichment of apoB+ transcriptomes within the TH17/TH1 and the TH1/Treg clusters, suggesting that these, which account for 50% of all lesional T cells, share features with antigen-specific cells. Finally, we validated the presence of apoB-reactive IL-17–expressing T cells in atherosclerotic plaques after a restimulation with apo B978-993 (Figure 5G).
Figure 5.

Aortic CD4+ T cells have mixed TH17/TH1/Treg transcriptomes in scRNAseq.
A, Single-cell RNA-sequencing (scRNAseq) of aortic CD4+ T cells after cell isolation of aortic leukocytes from Apoe–/– mice (n=10) after a control chow diet (CD) or a Western diet (WD) for 12 weeks, flow sorting, drop sequencing, and filtering of Cd3e+Cd4+Cd8a- cellular events. B, Single-cell transcriptomes were analyzed with an unsupervised dimensionality reduction algorithm (tSNE) to identify groups of cells with similar gene expression. The 4 resulting clusters are shown in the Left, the origin (WD/CD) is overlaid on the tSNE plot (Right). C, Differentially expressed genes in the 4 clusters in a single-cell heat map. D, Fraction of the 4 found clusters among all aortic CD4+ T cells. E, Expression of TH-lineage–defining genes in the 4 clusters (average transcripts/cell) displayed as heat map with column min.-max. expression. F, Color-coded enrichment scores indicating the similarity of each single-cell transcriptome with genes overexpressed in apoB+ T cells was overlaid on the tSNE projection of aortic T cells. G, Cytokine secretion in explanted atherosclerotic aortas after stimulation with the apo B978-993 (p6) peptide or a control with the carrier dimethyl sulfoxide alone (n=6–9 per group). Cytokines were quantified in the supernatant with a cytometric bead array. Cytokine secretion shown as % of the unstimulated control. All bars indicate mean values per group. *P<0.05. apoB indicates apolipoprotein B; DE, differentially expressed; FACS, fluorescence-activated cell sorting; IL-5, interleukin-5; IL-10, interleukin-10; IL-17, interleukin-17; max., maximum; min., minimum; TH, T-helper type; TNF-α, tumor necrosis factor α; Treg, regulatory T cell; and tSNE, t-distributed stochastic neighbor embedding.
ApoB+ Tregs Fail to Protect From Atherosclerosis
Tregs are known to protect from de novo atherosclerosis.13,14 This raised the question as to whether apoB-specific FoxP3+ Treg-like cells in healthy animals were atheroprotective. Therefore, we tested the therapeutic efficacy of an adoptive transfer of either apoB+ or apoBneg Tregs into Apoe–/– mice (Figure 6A). In this assay, more than half of all initially transferred cells lost expression of the Treg markers CD25 and FR4, which was consistent with the proposed loss of FoxP3 (Figure 6B). Both transferred cell types showed a successful engraftment but failed to limit en face atherosclerotic lesion size in the aorta after 12 weeks feeding with a WD (Figure 6C and 6D). Only the number of small, developing lesions in the aorta was reduced by a transfer of apoB+ but not of apoBneg Tregs (Figure 6E). Collectively, these findings suggest that unstable apoB+ Tregs may only protect from very early atherosclerosis after an adoptive transfer.
Figure 6.

Transferred apoB+ Tregs fail to protect from atherosclerosis.
A, Transfer of 2×10⁵ CD45.1+ apoB+ or apoBneg Tregs, or no cells into 8-week-old, female CD45.2+ Apoe–/– mice (n=5–6 per group). B, After 12 weeks, lymph nodes were harvested and fractions of Tregs (CD25+FR4+) and Tconv (conventional T cells; remaining cells) were quantified among all CD45.1+ T cells in lymph nodes of CD45.2+ donor mice. C, Atherosclerotic lesions in the thoracic/abdominal aorta were visualized by a Sudan-IV stain (D) and quantified as area (% aortic area) or the number of distinct atherosclerotic lesions in the thoracic/suprarenal aorta per mouse (E). All bars indicate mean values per group. Statistical significance was tested by a 1-way ANOVA with the Holm-Sidak multiple comparison test (D and E). *P<0.05. Representative pictures shown in C. apoB indicates apolipoprotein B; and Treg, regulatory T cell.
Numbers of ApoB-Reactive T Cells With a Predominant TH17 and TH1 Phenotype Increase in Humans With CAD
To establish a relationship of apoB-reactive T cells with angiographically documented atherosclerosis in humans, we quantified apoB-reactive T cells in the blood of 23 patients with coronary artery atherosclerosis (CAD) and 11 controls (no CAD; Table). Circulating T cells were restimulated with a set of 30 human apoB self-peptides (Table V in the Data Supplement), which were identified in an in silico prediction screen of the apoB sequence and direct MHC-II affinity measurements, for 6 hours. This pool of apoB self-peptides sufficiently binds about 80% of MHC-II variants found in the White population (Figure 7A, Tables VI and VII in the Data Supplement). Unlike the detection of apoB-reactive T cells with MHC-II tetramers, this screening approach was designed to track T cells recognizing several epitopes of apoB simultaneously. ApoB-reactive T cells were identified by de novo intracellular expression of the immediate activation marker CD40L in CD3+CD4+ T cells in flow cytometry (Figure 7B). It is notable that CD40L was superior to other markers of T-cell activation, such as CD25 or CD69 (Figure XVI in the Data Supplement). Before stimulation, we observed on average ≈0.29% preactivated CD40L+ T cells. After apoB restimulation, 0.32% and 1.25% of T cells from patients without and with CAD, respectively, expressed CD40L, which indicates that 0.03% of all circulating CD4+ T cells in patients without CAD and 0.96% in patients with CAD (apoB stimulation minus background) respond to apoB (Figure 7D). A partial TCR cross-linking with staphylococcal enterotoxin B served as positive control in this assay (Figure XVII in the Data Supplement). The increase in patients with CAD was consistent across age- and sex-matched groups (Figure XVIII in the Data Supplement). We did not detect changes in the expression of the T-cell activation markers CD25, HLA-DR, and CD38 (Figure XIX in the Data Supplement). These data indicate that a relevant fraction of circulating CD4+ T cells recognizes apoB in patients with CAD. We observed an increased fraction of effector-memory T cells, CD25+ FoxP3+ Tregs, TH17, and TH17/Treg cells in patients with CAD (Table VIII in the Data Supplement), which is consistent with our hypothesis that functionally deranged Tregs increase in the setting of atherosclerosis. Accordingly, we documented several key cytokines expressed by CD4+ T cells after a restimulation with apoB in patients with CAD, but not in controls, including the proinflammatory cytokines tumor necrosis factor-α, IL-17, and IFN-γ. In contrast, the immune-suppressive cytokine IL-10 was already reduced at baseline in patients with CAD and not further regulated in apoB-reactive T cells (Figure 7E to 7F, Figure XVII in the Data Supplement). These observations support a predominant TH1 and TH17 phenotype of an expanded pool of apoB-reactive T cells in patients with CAD.
Figure 7.

Coronary atherosclerosis in humans is accompanied by a population of circulating apoB-reactive T cells that secrete TH1 and TH17 cytokines.
A, Human apoB was screened in silico for peptide sequences with a high binding affinity to human MHC-II variants. The affinity of the 30 top-binding self-peptides was confirmed in a competitive MHC-II binding assay against radiolabeled cognate ligands. Heat map of the IC50 of peptides to MHC-II alleles. Band C, ApoB-reactive CD4+ T cells (CD3+CD4+CD8-L/D–) were identified by the intracellular expression of CD40L in flow cytometry. Human whole-blood samples (Dand E) or density gradient–isolated, IL-2–activated peripheral blood mononuclear cells (F) from individuals without (n=11) or with (n=23) stenotic coronary artery disease (CAD) were coincubated with the pool of human apoB-peptides (apoB), the carrier dimethyl sulfoxide alone (control), or the positive control staphylococcal enterotoxin B (SEB) for 6 hours (Dand E) or 10 days (F). Cytokine expression in human T cells was expressed as % cytokine+ CD4+ T cells. All bars indicate mean values per group. Statistical significance was calculated by a Mann-Whitney U test (D through F). *P<0.05. apoB indicates apolipoprotein B; FSC, forward scatter; IFN-γ, interferon γ; IL-2, interleukin-2; IL-10, interleukin-10; IL-17, interleukin-17; L/D, live/dead viability stain; SSC, side scatter; and TNF-α, tumor necrosis factor α.
Table 1.
Clinical Study Participants Baseline Characteristics

Discussion
T cells recognizing apoB/LDL in humans and mice were first proposed in 1995.8 The dynamics and consequences of this response have remained enigmatic, because tools to detect apoB-reactive T cells at a single-cell level were not available. Using a tetramer of MHC-II to detect mouse CD4+ T cells that recognize the peptide apo B978-993 (p6), we demonstrate that apoB+ cells with a Treg transcriptome exist in healthy WT and Apoe–/– mice. Already in 8-week-old CD-consuming Apoe–/– mice, in the absence of relevant atherosclerosis, apoB+ T cells have formed a stable pool of TEM/CM cells (82% of all apoB+ cells) with no further changes in older or atherosclerotic mice. Although apoE deficiency is known to be proinflammatory,7,25 numbers and TEM/CM fractions were similar in MCMV-specific M25+ T cells in Apoe–/– and WT mice. The observed baseline of TEM/CM commitment of up to 42% in T cells recognizing apoB and other antigens at baseline in WT mice may be attributable to homeostatic proliferation in early development or to cross-reactivity to environmental antigens.28 Thus, at least 40% of all memory apoB+ cells observed in Apoe–/– mice seem to be atherosclerosis specific and likely maintained by the continuous presentation of self-peptides from apoB/LDL by antigen-presenting cells in the setting of increased LDL-cholesterol levels in Apoe–/– mice. Our observation that apoB+ cells are predominately found in aorta-draining lymph nodes additionally argues for an increased homing to sites where vascular- or plaque-derived lipoproteins are presented by antigen-presenting cells. Collectively, these data suggest that the formation of a T-cell memory precedes disease development in mice. A limitation of our functional evaluation is the enrichment of CD44+ TEM/CM cells within the pool of apoB+ T cells, which may introduce a bias for more activated T cells where no direct adjustment for the CD44+ fraction of apoBneg T cells was done. However, the functional capacity of apoB+ T cells may be understated because of a possible downregulation of TCR abundance and signaling after ligation of the tetramer.
We suggest that hypercholesterolemia drives a transcriptional and phenotypic conversion of apoB+ cells into pathogenic TH17/TH1 cells over time. Despite less frequent (protein) expression of FoxP3 in only 21% of all apoB+ cells and more abundant expression of RORγT in 70%, the transcriptome of apoB-reactive CD4+ T cells in 8-week-old Apoe–/– mice remains close to that of Tregs. In 20-week-old Apoe–/– mice, however, no FoxP3 single-positive cells indicative of classical Tregs were found any more. In addition, apoB+ transcriptomes and protein marker expression (RORγT and T-bet) mostly overlap with TH17 and TH1 cells, which suggests a loss of the initial Treg phenotype. In fate-mapping experiments we show that antigen specificity drives Treg instability. About 40% of transferred Tregs lost FoxP3 after an adoptive transfer consistent with earlier reports.18,27 Whether these switching Tregs or the uncommitted ≈25% of apoB+ cells negative for transcription factors at 8 weeks give rise to cells of the larger population of RORγT+ solo expressors or TH17/TH1 cells is unknown. Yet, it is possible that TH17 cells may represent an intermediate phenotype between FoxP3+ T cells and TH17/TH1 cells in older animals. The low fraction of exTregs among all apoB+ T cells (≈7%) suggests that not all TH17 originate from TH17/Treg. It is notable that the converted cells seem to be highly proinflammatory with expression levels of IFN-γ and IL-17 in the range of Teff cells. This proinflammatory phenotype in apoB+ Tregs may explain their inability to protect from atherosclerosis. The concept that Tregs transform into pathogenic T cells is supported by other recent studies: We have recently shown that about half of all CD4+ T cells in atherosclerotic aortas of Apoe–/– mice express FoxP3 and T-bet (CCR5+ Teffs).16 These were unable to dampen the proliferation of Teff and exhibited a large transcriptional overlap with apoB+ cells. Although we did not directly test the suppressive capacity of apoB+ T cells, an experiment limited by the overall low numbers of Foxp3+ apoB+ T cells, our results allow the speculation that apoB+ cells may be proatherogenic. Here, we confirmed the existence of the unique CCR5+ Teff population at the single-cell level in atherosclerotic aortas: About 40% of CD4+ T cells in one of the cell clusters (cluster 2) expressed the gene transcripts Foxp3 and Tbx21 (T-bet). The coexpression of both transcription factors suggests that CCR5+ Teffs develop from Tregs. This is also supported by another study from Butcher et al,18 who demonstrated a direct conversion of Tregs into TH1-like Tregs. In addition, a recent study from Gistera et al29 showed that a monoclonal population of CD4+ T cells recognizing human apoB from a TCR-transgenic mouse switched into TFH cells after an adoptive transfer and protected from atherosclerosis in a humanized model. Gistera et al29 used in vitro selected cell clones that originated from oxidized LDL–specific T cells from human apoB-transgenic mice after vaccination that expressed the TCR-β V segment TCRBV31. These methodological differences are the most likely cause for the overall low frequency of TCR-β V31-usage in apoB+ T cells (<1%) in our study.
Our results will be helpful to define preventative strategies to boost protective autoimmunity and apoB-reactive T cells by immunization.10 The development of apoB-specific tetramers will allow monitoring and validating these responses. Our most striking clinical observation is that apoB-reactive T cells are detectable in the circulation of patients with angiographically documented CAD. More T cells from patients with CAD than from patients without CAD expressed the proatherogenic cytokines tumor necrosis factor-α, IFN-γ, and IL-173 in response to a restimulation with apoB, rendering it likely that circulating apoB+ cells represent already transformed pathogenic clones. Our clinical pilot study, however, does not clarify the role of exTregs in humans: cell surface markers specific for (ex-)Tregs compatible with restimulation assays will have to be developed to clarify these questions in the future. We have previously demonstrated the existence of FoxP3-expressing and T-bet/RORγT–expressing T cells that recognized 1 specific peptide epitope in women without and with subclinical atherosclerosis.15 Here, we present an increased fraction of bulk Tregs and TH17/Treg cells in humans with CAD, which allows the speculation that Tregs may be more inflammatory and committed to several TH lineages in the setting of CAD. Our findings will have to be validated by larger, prospective clinical trials that substantiate their predictive value and that also test for subclinical atherosclerotic disease other than CAD in patients who are apparently without CAD, which was not done in the current study. The ability to quantify cellular autoimmunity in atherosclerosis will allow us to test cellular links between cardiovascular disease and other autoimmune disorders, such as systemic lupus erythematosus, in future. Our novel tetramer tool holds great promise to develop novel cellular biomarkers to precisely identify high-risk patients for autoimmune-mediated complications of atherosclerosis. In addition, our findings help to define a novel conceptual framework for atheroprotective vaccination strategies to stabilize the protective phenotype of apoB-specific Tregs and the therapeutic transfer with genetically modified, protective T cells that express chimeric antigen receptors specific for apoB.
Sources of Funding
This work was supported by grants to Dr Wolf from the Deutsche Forschungsgemeinschaft (DFG WO1994/1), and by a fellowship to Dr Wolf from the Berta-Ottenstein-Program for Advanced Clinician Scientists at the Faculty of Medicine, University of Freiburg. This project has received funding from the European Research Council (ERC) under the European Union’s Horizon 2020 research and innovation program (grant agreement No. 853425). Dr Gerhardt has received a fellowship from the Boehringer Ingelheim Foundation and from the Berlin Institute of Health (BIH), Berlin, Germany. Dr Ley was supported by grants HL115232, HL88093, and HL121697 from the National Heart, Lung, and Blood Institute. Dr Benedict was supported by the National Institutes of Health (NIH) grant AI139749. The FACS-Aria used for flow sorting the cells was purchased through a Shared Instrumentation Grant from NIH: S10 RR027366 for the Flow Cytometry Facility at the La Jolla Institute.
Disclosures
None.
Supplemental Materials
Expanded Methods
Data Supplement Tables I–VIII
Data Supplement Figures I–XIX
Data Supplement Files I–IV
References 30–55
Supplementary Material
Footnotes
Drs Wolf and Gerhardt contributed equally.
The full author list is available on page 1291.
Sources of Funding, see page 1291
The Data Supplement is available with this article at https://www.ahajournals.org/doi/suppl/10.1161/CIRCULATIONAHA.119.042863.
References
- 1.Wolf D, Ley K. Immunity and inflammation in atherosclerosis. Circ Res. 2019;124:315–327. doi: 10.1161/CIRCRESAHA.118.313591 [DOI] [PMC free article] [PubMed] [Google Scholar]
- 2.Kobiyama K, Ley K. Atherosclerosis. Circ Res. 2018;123:1118–1120. doi: 10.1161/CIRCRESAHA.118.313816 [DOI] [PMC free article] [PubMed] [Google Scholar]
- 3.Libby P, Lichtman AH, Hansson GK. Immune effector mechanisms implicated in atherosclerosis: from mice to humans. Immunity. 2013;38:1092–1104. doi: 10.1016/j.immuni.2013.06.009 [DOI] [PMC free article] [PubMed] [Google Scholar]
- 4.Jonasson L, Holm J, Skalli O, Bondjers G, Hansson GK. Regional accumulations of T cells, macrophages, and smooth muscle cells in the human atherosclerotic plaque. Arteriosclerosis. 1986;6:131–138. doi: 10.1161/01.atv.6.2.131 [DOI] [PubMed] [Google Scholar]
- 5.Galkina E, Kadl A, Sanders J, Varughese D, Sarembock IJ, Ley K. Lymphocyte recruitment into the aortic wall before and during development of atherosclerosis is partially L-selectin dependent. J Exp Med. 2006;203:1273–1282. doi: 10.1084/jem.20052205 [DOI] [PMC free article] [PubMed] [Google Scholar]
- 6.Hermansson A, Ketelhuth DF, Strodthoff D, Wurm M, Hansson EM, Nicoletti A, Paulsson-Berne G, Hansson GK. Inhibition of T cell response to native low-density lipoprotein reduces atherosclerosis. J Exp Med. 2010;207:1081–1093. doi: 10.1084/jem.20092243 [DOI] [PMC free article] [PubMed] [Google Scholar]
- 7.Koltsova EK, Garcia Z, Chodaczek G, Landau M, McArdle S, Scott SR, von Vietinghoff S, Galkina E, Miller YI, Acton ST, et al. Dynamic T cell-APC interactions sustain chronic inflammation in atherosclerosis. J Clin Invest. 2012;122:3114–3126. doi: 10.1172/JCI61758 [DOI] [PMC free article] [PubMed] [Google Scholar]
- 8.Stemme S, Faber B, Holm J, Wiklund O, Witztum JL, Hansson GK. T lymphocytes from human atherosclerotic plaques recognize oxidized low density lipoprotein. Proc Natl Acad Sci U S A. 1995;92:3893–3897. doi: 10.1073/pnas.92.9.3893 [DOI] [PMC free article] [PubMed] [Google Scholar]
- 9.Wolf D, Zirlik A, Ley K. Beyond vascular inflammation–recent advances in understanding atherosclerosis. Cell Mol Life Sci. 2015;72:3853–3869. doi: 10.1007/s00018-015-1971-6 [DOI] [PMC free article] [PubMed] [Google Scholar]
- 10.Kimura T, Tse K, Sette A, Ley K. Vaccination to modulate atherosclerosis. Autoimmunity. 2015;48:152–160. doi: 10.3109/08916934.2014.1003641 [DOI] [PMC free article] [PubMed] [Google Scholar]
- 11.Wigren M, Rattik S, Yao Mattisson I, Tomas L, Grönberg C, Söderberg I, Alm R, Sundius L, Ljungcrantz I, Björkbacka H, et al. Lack of ability to present antigens on major histocompatibility complex class II molecules aggravates atherosclerosis in ApoE–/– mice. Circulation. 2019;139:2554–2566. doi: 10.1161/CIRCULATIONAHA.118.039288 [DOI] [PubMed] [Google Scholar]
- 12.Ley K. 2015 Russell Ross Memorial Lecture in Vascular Biology: protective autoimmunity in atherosclerosis. Arterioscler Thromb Vasc Biol. 2016;36:429–438. doi: 10.1161/ATVBAHA.115.306009 [DOI] [PMC free article] [PubMed] [Google Scholar]
- 13.Ait-Oufella H, Salomon BL, Potteaux S, Robertson AK, Gourdy P, Zoll J, Merval R, Esposito B, Cohen JL, Fisson S, et al. Natural regulatory T cells control the development of atherosclerosis in mice. Nat Med. 2006;12:178–180. doi: 10.1038/nm1343 [DOI] [PubMed] [Google Scholar]
- 14.Klingenberg R, Gerdes N, Badeau RM, Gisterå A, Strodthoff D, Ketelhuth DF, Lundberg AM, Rudling M, Nilsson SK, Olivecrona G, et al. Depletion of FOXP3+ regulatory T cells promotes hypercholesterolemia and atherosclerosis. J Clin Invest. 2013;123:1323–1334. doi: 10.1172/JCI63891 [DOI] [PMC free article] [PubMed] [Google Scholar]
- 15.Kimura T, Kobiyama K, Winkels H, Tse K, Miller J, Vassallo M, Wolf D, Ryden C, Orecchioni M, Dileepan T, et al. Regulatory CD4+ T cells recognize major histocompatibility complex class II molecule-restricted peptide epitopes of apolipoprotein B. Circulation. 2018;138:1130–1143. doi: 10.1161/CIRCULATIONAHA.117.031420 [DOI] [PMC free article] [PubMed] [Google Scholar]
- 16.Li J, McArdle S, Gholami A, Kimura T, Wolf D, Gerhardt T, Miller J, Weber C, Ley K. CCR5+T-bet+FoxP3+ effector CD4 T cells drive atherosclerosis. Circ Res. 2016;118:1540–1552. doi: 10.1161/CIRCRESAHA.116.308648 [DOI] [PMC free article] [PubMed] [Google Scholar]
- 17.Sakaguchi S. Naturally arising CD4+ regulatory t cells for immunologic self-tolerance and negative control of immune responses. Annu Rev Immunol. 2004;22:531–562. doi: 10.1146/annurev.immunol.21.120601.141122 [DOI] [PubMed] [Google Scholar]
- 18.Butcher MJ, Filipowicz AR, Waseem TC, McGary CM, Crow KJ, Magilnick N, Boldin M, Lundberg PS, Galkina EV. Atherosclerosis-driven treg plasticity results in formation of a dysfunctional subset of plastic IFNγ+ Th1/Tregs. Circ Res. 2016;119:1190–1203. doi: 10.1161/CIRCRESAHA.116.309764 [DOI] [PMC free article] [PubMed] [Google Scholar]
- 19.Moon JJ, Chu HH, Pepper M, McSorley SJ, Jameson SC, Kedl RM, Jenkins MK. Naive CD4(+) T cell frequency varies for different epitopes and predicts repertoire diversity and response magnitude. Immunity. 2007;27:203–213. doi: 10.1016/j.immuni.2007.07.007 [DOI] [PMC free article] [PubMed] [Google Scholar]
- 20.Winkels H, Ehinger E, Vassallo M, Buscher K, Dinh HQ, Kobiyama K, Hamers AAJ, Cochain C, Vafadarnejad E, Saliba Atlas of the immune cell repertoire in mouse atherosclerosis defined by single-cell RNA-sequencing and mass cytometry. Circ Res. 2018;122:1675–1688. doi: 10.1161/CIRCRESAHA.117.312513 [DOI] [PMC free article] [PubMed] [Google Scholar]
- 21.Adler R. Janeway’s immunobiology. Choice: Curr Rev Acad Libraries. 2008;45:1793–1794 [Google Scholar]
- 22.Tse K, Gonen A, Sidney J, Ouyang H, Witztum JL, Sette A, Tse H, Ley K. Atheroprotective vaccination with MHC-II restricted peptides from ApoB-100. Front Immunol. 2013;4:493 doi: 10.3389/fimmu.2013.00493 [DOI] [PMC free article] [PubMed] [Google Scholar]
- 23.Kimura T, Tse K, McArdle S, Gerhardt T, Miller J, Mikulski Z, Sidney J, Sette A, Wolf D, Ley K. Atheroprotective vaccination with MHC-II-restricted ApoB peptides induces peritoneal IL-10-producing CD4 T cells. Am J Physiol Heart Circ Physiol. 2017;312:H781–H790. doi: 10.1152/ajpheart.00798.2016 [DOI] [PMC free article] [PubMed] [Google Scholar]
- 24.Shaw MK, Tse KY, Zhao X, Welch K, Eitzman DT, Thipparthi RR, Montgomery PC, Thummel R, Tse HY. T-cells specific for a self-peptide of ApoB-100 exacerbate aortic atheroma in murine atherosclerosis. Front Immunol. 2017;8:95 doi: 10.3389/fimmu.2017.00095 [DOI] [PMC free article] [PubMed] [Google Scholar]
- 25.Maganto-García E, Tarrio ML, Grabie N, Bu DX, Lichtman AH. Dynamic changes in regulatory T cells are linked to levels of diet-induced hypercholesterolemia. Circulation. 2011;124:185–195. doi: 10.1161/CIRCULATIONAHA.110.006411 [DOI] [PMC free article] [PubMed] [Google Scholar]
- 26.Stubbington MJ, Mahata B, Svensson V, Deonarine A, Nissen JK, Betz AG, Teichmann SA. An atlas of mouse CD4+ T cell transcriptomes. Biol Direct. 2015;10:14 doi: 10.1186/s13062-015-0045-x [DOI] [PMC free article] [PubMed] [Google Scholar]
- 27.Gaddis DE, Padgett LE, Wu R, McSkimming C, Romines V, Taylor AM, McNamara CA, Kronenberg M, Crotty S, Thomas MJ, et al. Apolipoprotein AI prevents regulatory to follicular helper T cell switching during atherosclerosis. Nat Commun. 2018;9:1095 doi: 10.1038/s41467-018-03493-5 [DOI] [PMC free article] [PubMed] [Google Scholar]
- 28.Su LF, Kidd BA, Han A, Kotzin JJ, Davis MM. Virus-specific CD4+ memory-phenotype T cells are abundant in unexposed adults. Immunity. 2013;38:373–383. doi: 10.1016/j.immuni.2012.10.021 [DOI] [PMC free article] [PubMed] [Google Scholar]
- 29.Gisterå A, Klement ML, Polyzos KA, Mailer RKW, Duhlin A, Karlsson MCI, Ketelhuth DFJ, Hansson GK. Low-density lipoprotein-reactive T cells regulate plasma cholesterol levels and development of atherosclerosis in humanized hypercholesterolemic mice. Circulation. 2018;138:2513–2526. doi: 10.1161/CIRCULATIONAHA.118.034076 [DOI] [PMC free article] [PubMed] [Google Scholar]
- 30.Piedrahita JA, Zhang SH, Hagaman JR, Oliver PM, Maeda N. Generation of mice carrying a mutant apolipoprotein E gene inactivated by gene targeting in embryonic stem cells. Proc Natl Acad Sci U S A. 1992;89:4471–4475. doi: 10.1073/pnas.89.10.4471 [DOI] [PMC free article] [PubMed] [Google Scholar]
- 31.Rubtsov YP, Rasmussen JP, Chi EY, Fontenot J, Castelli L, Ye X, Treuting P, Siewe L, Roers A, Henderson WR., Jr Regulatory T cell-derived interleukin-10 limits inflammation at environmental interfaces. Immunity. 2008;28:546–558. doi: 10.1016/j.immuni.2008.02.017 [DOI] [PubMed] [Google Scholar]
- 32.Jin HS, Park Y, Elly C, Liu YC. Itch expression by Treg cells controls Th2 inflammatory responses. J Clin Invest. 2013;123:4923–4934. doi: 10.1172/JCI69355 [DOI] [PMC free article] [PubMed] [Google Scholar]
- 33.Wolf D, Hohmann JD, Wiedemann A, Bledzka K, Blankenbach H, Marchini T, Gutte K, Zeschky K, Bassler N, Hoppe N, et al. Binding of CD40L to Mac-1’s I-domain involves the EQLKKSKTL motif and mediates leukocyte recruitment and atherosclerosis–but does not affect immunity and thrombosis in mice. Circ Res. 2011;109:1269–1279. doi: 10.1161/CIRCRESAHA.111.247684 [DOI] [PMC free article] [PubMed] [Google Scholar]
- 34.Daugherty A, Tall AR, Daemen MJAP, Falk E, Fisher EA, García-Cardeña G, Lusis AJ, Owens AP, 3rd, Rosenfeld ME, Virmani R; American Heart Association Council on Arteriosclerosis, Thrombosis and Vascular Biology; and Council on Basic Cardiovascular Sciences. Recommendation on design, execution, and reporting of animal atherosclerosis studies: a scientific statement from the American Heart Association. Arterioscler Thromb Vasc Biol. 2017;37:e131–e157. doi: 10.1161/ATV.0000000000000062 [DOI] [PubMed] [Google Scholar]
- 35.Verma S, Weiskopf D, Gupta A, McDonald B, Peters B, Sette A, Benedict CA. Cytomegalovirus-specific CD4 T cells are cytolytic and mediate vaccine protection. J Virol. 2016;90:650–658. doi: 10.1128/JVI.02123-15 [DOI] [PMC free article] [PubMed] [Google Scholar]
- 36.Weiskopf D, Yauch LE, Angelo MA, John DV, Greenbaum JA, Sidney J, Kolla RV, De Silva AD, de Silva AM, Grey H, et al. Insights into HLA-restricted T cell responses in a novel mouse model of dengue virus infection point toward new implications for vaccine design. J Immunol. 2011;187:4268–4279. doi: 10.4049/jimmunol.1101970 [DOI] [PMC free article] [PubMed] [Google Scholar]
- 37.Massilamany C, Upadhyaya B, Gangaplara A, Kuszynski C, Reddy J. Detection of autoreactive CD4 T cells using major histocompatibility complex class II dextramers. BMC Immunol. 2011;12:40 doi: 10.1186/1471-2172-12-40 [DOI] [PMC free article] [PubMed] [Google Scholar]
- 38.Trapnell C, Pachter L, Salzberg SL. TopHat: discovering splice junctions with RNA-Seq. Bioinformatics. 2009;25:1105–1111. doi: 10.1093/bioinformatics/btp120 [DOI] [PMC free article] [PubMed] [Google Scholar]
- 39.Schmieder R, Edwards R. Quality control and preprocessing of metagenomic datasets. Bioinformatics. 2011;27:863–864. doi: 10.1093/bioinformatics/btr026 [DOI] [PMC free article] [PubMed] [Google Scholar]
- 40.Li H, Handsaker B, Wysoker A, Fennell T, Ruan J, Homer N, Marth G, Abecasis G, Durbin R; 1000 Genome Project Data Processing Subgroup. The Sequence Alignment/Map format and SAMtools. Bioinformatics. 2009;25:2078–2079. doi: 10.1093/bioinformatics/btp352 [DOI] [PMC free article] [PubMed] [Google Scholar]
- 41.Wang L, Wang S, Li W. RSeQC: quality control of RNA-seq experiments. Bioinformatics. 2012;28:2184–2185. doi: 10.1093/bioinformatics/bts356 [DOI] [PubMed] [Google Scholar]
- 42.Krämer A, Green J, Pollard J, Jr, Tugendreich S. Causal analysis approaches in Ingenuity Pathway Analysis. Bioinformatics. 2014;30:523–530. doi: 10.1093/bioinformatics/btt703 [DOI] [PMC free article] [PubMed] [Google Scholar]
- 43.Reich M, Liefeld T, Gould J, Lerner J, Tamayo P, Mesirov JP. GenePattern 2.0. Nat Genet. 2006;38:500–501. doi: 10.1038/ng0506-500 [DOI] [PubMed] [Google Scholar]
- 44.Newman AM, Liu CL, Green MR, Gentles AJ, Feng W, Xu Y, Hoang CD, Diehn M, Alizadeh AA. Robust enumeration of cell subsets from tissue expression profiles. Nat Methods. 2015;12:453–457. doi: 10.1038/nmeth.3337 [DOI] [PMC free article] [PubMed] [Google Scholar]
- 45.Zheng GX, Terry JM, Belgrader P, Ryvkin P, Bent ZW, Wilson R, Ziraldo SB, Wheeler TD, McDermott GP, Zhu J, et al. Massively parallel digital transcriptional profiling of single cells. Nat Commun. 2017;8:14049 doi: 10.1038/ncomms14049 [DOI] [PMC free article] [PubMed] [Google Scholar]
- 46.Dobin A, Davis CA, Schlesinger F, Drenkow J, Zaleski C, Jha S, Batut P, Chaisson M, Gingeras TR. STAR: ultrafast universal RNA-seq aligner. Bioinformatics. 2013;29:15–21. doi: 10.1093/bioinformatics/bts635 [DOI] [PMC free article] [PubMed] [Google Scholar]
- 47.Satija R, Farrell JA, Gennert D, Schier AF, Regev A. Spatial reconstruction of single-cell gene expression data. Nat Biotechnol. 2015;33:495–502. doi: 10.1038/nbt.3192 [DOI] [PMC free article] [PubMed] [Google Scholar]
- 48.Liu X, Dai S, Crawford F, Fruge R, Marrack P, Kappler J. Alternate interactions define the binding of peptides to the MHC molecule IA(b). Proc Natl Acad Sci U S A. 2002;99:8820–8825. doi: 10.1073/pnas.132272099 [DOI] [PMC free article] [PubMed] [Google Scholar]
- 49.Wang P, Sidney J, Dow C, Mothé B, Sette A, Peters B. A systematic assessment of MHC class II peptide binding predictions and evaluation of a consensus approach. PLoS Comput Biol. 2008;4:e1000048 doi: 10.1371/journal.pcbi.1000048 [DOI] [PMC free article] [PubMed] [Google Scholar]
- 50.Wang P, Sidney J, Kim Y, Sette A, Lund O, Nielsen M, Peters B. Peptide binding predictions for HLA DR, DP and DQ molecules. BMC Bioinformatics. 2010;11:568 doi: 10.1186/1471-2105-11-568 [DOI] [PMC free article] [PubMed] [Google Scholar]
- 51.Sidney J, Southwood S, Moore C, Oseroff C, Pinilla C, Grey HM, Sette A. Measurement of MHC/peptide interactions by gel filtration or monoclonal antibody capture. Curr Protoc Immunol. 2013;Chapter 18:Unit 18.3 doi: 10.1002/0471142735.im1803s100 [DOI] [PMC free article] [PubMed] [Google Scholar]
- 52.Cohen GB, Kaur A, Johnson RP. Isolation of viable antigen-specific CD4 T cells by CD40L surface trapping. J Immunol Methods. 2005;302:103–115. doi: 10.1016/j.jim.2005.05.002 [DOI] [PubMed] [Google Scholar]
- 53.Frentsch M, Arbach O, Kirchhoff D, Moewes B, Worm M, Rothe M, Scheffold A, Thiel A. Direct access to CD4+ T cells specific for defined antigens according to CD154 expression. Nat Med. 2005;11:1118–1124. doi: 10.1038/nm1292 [DOI] [PubMed] [Google Scholar]
- 54.Bacher P, Schink C, Teutschbein J, Kniemeyer O, Assenmacher M, Brakhage AA, Scheffold A. Antigen-reactive T cell enrichment for direct, high-resolution analysis of the human naive and memory Th cell repertoire. J Immunol. 2013;190:3967–3976. doi: 10.4049/jimmunol.1202221 [DOI] [PubMed] [Google Scholar]
- 55.Abadier M, Pramod AB, McArdle S, Marki A, Fan Z, Gutierrez E, Groisman A, Ley K. Effector and regulatory T cells roll at high shear stress by inducible tether and sling formation. Cell Rep. 2017;21:3885–3899. doi: 10.1016/j.celrep.2017.11.099 [DOI] [PMC free article] [PubMed] [Google Scholar]
Associated Data
This section collects any data citations, data availability statements, or supplementary materials included in this article.
Supplementary Materials
Data Availability Statement
Raw and processed sequencing data are available at the National Center for Biotechnology Information Gene Expression Omnibus repository (GSE149070). All other data, methods, and materials that support the findings of this study are available from the corresponding author on reasonable request.