Abstract
Background:
We recently developed a classification system to assess skeletal maturity by scoring proximal humeral ossification in a similar way to the canonical Risser sign. The purpose of the present study was to determine whether our system can be used to reliably assess radiographs of the spine for modern patients with idiopathic scoliosis, whether it can be used in combination with the Sanders hand system, and whether the consideration of patient factors such as age, sex, and standing height improves the accuracy of predictions.
Methods:
We retrospectively reviewed 414 randomized radiographs from 216 modern patients with scoliosis and measured reliability with use of the intraclass correlation coefficient (ICC). We then analyzed 606 proximal humeral radiographs for 70 children from a historical collection to determine the value of integrating multiple classification systems. The age of peak height velocity (PHV) was predicted with use of linear regression models, and performance was evaluated with use of tenfold cross-validation.
Results:
The proximal humeral ossification system demonstrated excellent reliability in modern patients with scoliosis, with an ICC of 0.97 and 0.92 for intraobserver and interobserver comparisons, respectively. The use of our system in combination with the Sanders hand system yielded 7 categories prior to PHV and demonstrated better results compared with either system alone. Linear regression algorithms showed that integration of the proximal part of the humerus, patient factors, and other classification systems outperformed models based on canonical Risser and triradiate-closure methods.
Conclusions:
Humeral head ossification can be reliably assessed in modern patients with scoliosis. Furthermore, the system described here can be used in combination with other parameters such as the Sanders hand system, age, sex, and height to predict PHV and percent growth remaining with high accuracy.
Clinical Relevance:
The proximal humeral ossification system can improve the prediction of PHV in patients with scoliosis on the basis of a standard spine radiograph without a hand radiograph for the determination of bone age. This increased accuracy for predicting maturity will allow physicians to better assess patient maturity relative to PHV and therefore can help to guide treatment decision-making without increasing radiation exposure, time, or cost. The present study demonstrates that assessment of the proximal humeral physis is a viable and valuable aid in the determination of skeletal maturity as obtained from radiographs of the spine that happen to include the shoulder in adolescent patients with idiopathic scoliosis.
The creation of accurate markers for skeletal maturity has been of substantial interest to orthopaedic surgeons for at least a century. This interest has led to the development of landmarks such as the well-known Greulich and Pyle atlas of the hand1-3 as well as the Tanner-Whitehouse III (TW-III) system4,5. These systems are widely used in the treatment of adolescent idiopathic scoliosis6-8, slipped capital femoral epiphysis9,10, and growth modulation with an epiphysiodesis.
We recently developed a classification system to assess skeletal maturity by scoring proximal humeral ossification in a similar way to the canonical Risser grading system of the iliac apophysis11. We described how the lateral margin of the physis of the proximal part of the humerus ossifies in a consistent manner that can be defined by 5 distinct stages. The advantages of the system are the ability to classify growth into narrow intervals in a reliable manner while being far simpler than many existing systems12. In addition, our system contributes to a growing body of work on assessing the timing of maximum growth, the peak height velocity (PHV), from any available radiograph13-16.
The purpose of the present study was to determine whether our novel proximal humeral ossification classification system can be used to reliably assess radiographs of the spine for modern patients with idiopathic scoliosis, whether it can be used in combination with the Sanders hand system17-19, and whether the consideration of patient factors such as age, sex, and standing height improves the accuracy of predictions for maturity relative to PHV.
Materials and Methods
Institutional review board approval was obtained to retrospectively review radiographic data from patients who presented with adolescent idiopathic scoliosis between 2007 and 2017. Patients were included if they had been followed at least every 6 months through either surgical stabilization or discharge from care after skeletal maturity. When possible, we evaluated radiographs that had been made with the arms by the sides with palms facing forward; however, radiographs that had been made in other positions were included as long as the humerus could be staged. These criteria yielded 216 patients with a combined total of 414 radiographs. The average age of the patients was 12 years and 5 months. Nineteen percent of the patients were male, and 81% were female. Each radiograph was deidentified, randomized, assigned a number, and placed in a slide deck. These slides were subsequently classified according to the proximal humeral ossification staging system by 8 investigators, including 2 medical students, 4 orthopaedic residents, and 2 senior attending surgeons. The reliability of evaluation of the humeral physis on these spine radiographs was determined by calculating an intraclass correlation coefficient (ICC). This data set was used primarily to validate that the classification system could be applied unambiguously to modern patients as the prior study had involved historical patients11.
As concerns about radiation exposure preclude obtaining comprehensive sequential radiographic series in modern patients, the value of combining multiple systems was determined by studying historical patients from the Brush Inquiry, which was conducted in Cleveland between 1926 and 1942 and followed 4,435 children through skeletal maturity20. Those children were between 3 and 18 years of age and had no major confounding medical conditions. They were predominantly white and were equally distributed between males and females. The value of that data set is that it includes comprehensive radiographs of the shoulder, elbow, wrist, hand, hip, knee, and foot at every time point20,21. Furthermore, those radiographs are accompanied by accurate documentation of patient factors, including standing height and weight. While there are concerns about the applicability of that historical data set to modern patients, it should be noted that the collection was used for the development of landmark classification systems such as the one described by Greulich and Pyle20,22.
For consistency, we selected the same sets of radiographs that were used to initially develop our proximal humeral ossification system11. We then evaluated 606 sets of radiographs from 70 developing children who had complete data for all of the variables that could be reasonably examined on a single radiograph in a patient with scoliosis, including height, sex, and age, as well as views of the pelvis and proximal part of the humerus. The PHV for these children could be accurately calculated to a single time point by applying a cubic spline method that was validated in a previous study on the subject21.
For analysis, we first sorted each radiograph by humeral stage and Sanders hand stage. For example, a patient who was humeral stage 2 and Sanders stage 3 during a particular visit would be sorted into the H2, S3, and H2S3 groups. After sorting radiographs into groups, we calculated the mean and standard deviation for the number of years to PHV for each group. These calculations were performed in Microsoft Excel, which was also used to generate the corresponding figures. All reliability analyses were conducted with use of the publicly available Mangold Intraclass Correlation Coefficient Calculator.
We next sought to predict the number of years to PHV quantitatively with use of multiple linear regression analyses, which were performed with use of the lm() function in the R programming language. The independent variables used in these regression analyses were the Risser sign, triradiate closure, humeral stage, Sanders hand stage, age (rounded to the nearest year), sex (used as a binary variable), and current height (rounded to the nearest centimeter). The lm() function in R then calculated a coefficient for each independent variable. Each prediction model was then built as a linear equation with PHV as the dependent variable and with the previously determined coefficients multiplying each independent variable. For example, a model including the humeral stage, age, and sex would appear as follows:
PHV = Coefficient1 × Humeral Stage + Coefficient2 × Age + Coefficient3 × Sex + Intercept
In order to evaluate the predictive performance of these models, we used the process of tenfold cross-validation. In this form of validation, 10% of the data (60 sets of radiographs) were excluded from the linear regression analysis so that the statistical software could not use it while generating coefficients. The linear equation model was then constructed with use of these coefficients and was asked to predict the number of years to PHV for the excluded data. The error for each prediction was calculated as the absolute value of (True PHV as measured from the patients – Predicted PHV from the linear equation). The process was iterated with a different 10% of data being excluded from the linear regression calculation each time. Mean absolute errors were calculated by determining the arithmetic mean of all of the prediction errors for each model.
Results
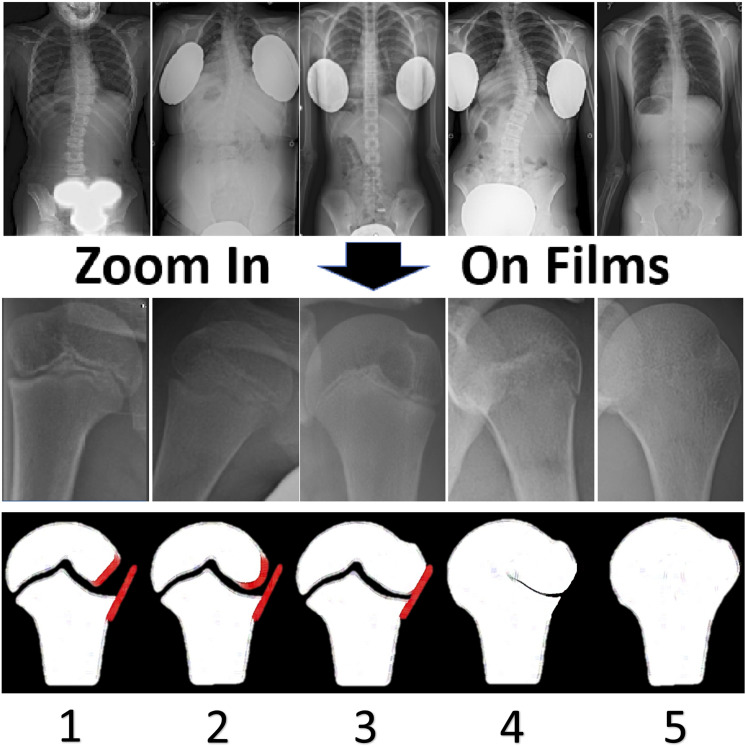
We applied our novel 5-stage humeral head classification system to all 414 spine radiographs from modern patients with scoliosis with use of the zoom function to enlarge the humeral head. The lateral epiphysis is incompletely ossified during Stage 1, leaving an oblique lateral margin. This pattern results in a radiolucent triangular gap between the epiphyseal and metaphyseal margins. Stage 2 is characterized by increased ossification, leading to a rounded epiphyseal margin. In Stage 3, the metaphyseal and epiphyseal lateral margins are colinear or capped. In Stage 4, the lateral portion of the physis thins and begins to partially fuse, starting medially; however, the fusion is not complete and the most lateral portion remains open. Finally, Stage 5 is analogous to Risser 5, with complete fusion. Representative images of the 5 stages are shown in Figure 1.
Fig. 1.
Evaluation of humeral head stage on spine radiographs. Representative images from spine radiographs that were collected between 2007 and 2017 are shown in the top row. The zoom function that was built into the Visage visualization software used by our institution was used to magnify the humeral head, as shown in the middle row. Schematic illustrations depicting the relevant features of the humeral head during each stage are shown in the bottom row. In Stage 1, the lateral epiphysis is incompletely ossified, leaving an oblique lateral margin; this results in a radiolucent triangular gap between the epiphyseal and metaphyseal margins. In Stage 2, increased ossification leads to a rounded epiphyseal margin. In Stage 3, the metaphyseal and epiphyseal lateral margins are colinear or capped. In Stage 4, the lateral part of the physis thins and begins partial fusion starting medially; however, the fusion is not complete and the most lateral portion remains open. Finally, Stage 5 is analogous to Risser 5, with complete fusion.
We found that this system remains reliable when applied to spine radiographs, with excellent intraobserver and interobserver correlation coefficients of 0.97 and 0.92, respectively, among 8 investigators. No differences in reliability were observed when earlier radiographs in which the shoulder/arm position was not controlled were compared with later radiographs. This correlation is broadly comparable with the coefficients of 0.96 and 0.95 found previously from historical patients11. The remainder of the results were thus calculated from the historical patients with more complete radiographic data.
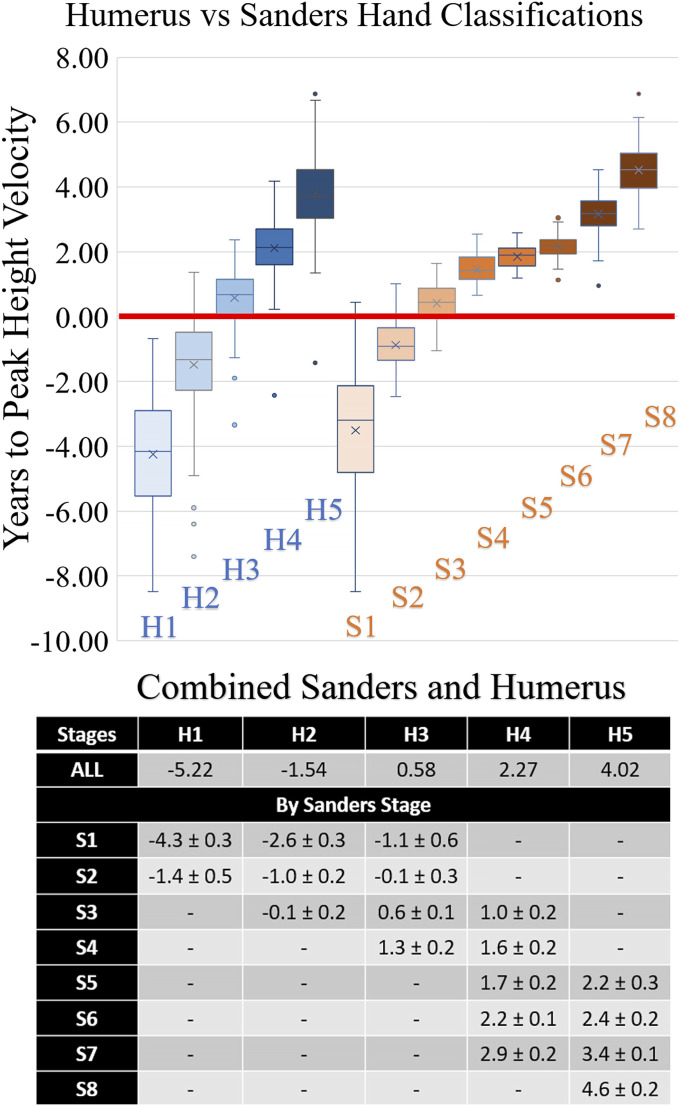
With use of the historical data, we first analyzed the relationship of each stage with regard to PHV of both the Sanders and humerus staging systems separately and in combination with one another. We found that using the humeral head system alone significantly stratified patients by time from PHV. Using the systems in combination significantly improved the ability to distinguish subtle differences in age relative to PHV (Fig. 2). As the 18 different combinations that were analyzed made a box plot that was too cluttered for clinical use, we have summarized the timing and the 95% confidence levels for each combination of stages in Figure 2.
Fig. 2.
Top: Box-and-whisker plots depicting the relationship of both the humeral and Sanders systems to PHV. The top and bottom of a box indicate the interquartile range (IQR), the line within the box indicates the median, the X indicates the mean, the whiskers indicate values within 1.5 IQR of the box, and the circles represent outliers. The systems were then combined into pairs of stages that had sufficient data to make an accurate prediction. All graphs depict the same set of data that was used in this analysis. The stages represent the humeral system alone (H1, H2, H3, H4, H5), the Sanders system alone (S1, S2, S3, S4, S5, S6, S7, S8), and the combined system (H1S1, H2S1, H1S2, H3S1, H2S2, H3S2, H2S3, H3S3, H4S3, H3S4, H4S4, H4S5, H5S5, H4S6, H5S6, H4S7, H5S7, H5S8). The horizontal red line represents PHV. Bottom: In the accompanying table, the mean and 95% confidence levels for each combination of humeral and Sanders stages were calculated relative to PHV in years. All data that had a complete set of information for all 3 variables were included in these calculations. A dash indicates that insufficient radiographs fell into these categories for accurate predictions and therefore the data were removed from the analysis.
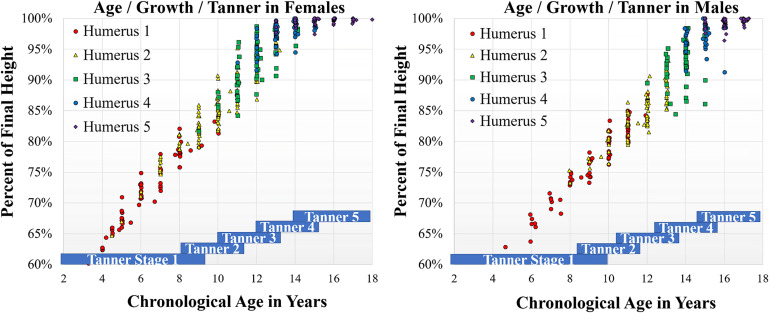
To determine the accuracy of the humeral head system, we linked each radiograph to the demographic variables that were collected at the same office visit, including sex, age, and current standing height. The performance of a linear regression model with these 4 independent variables in predicting PHV showed an adjusted r2 value of 0.97. Each variable was independently significant, with p values of <0.0001 indicating that additional value was provided by each component. The relationship of humeral stage to chronological age, percent of final height, and Tanner stage is shown graphically in Figure 3. Tanner stage boxes were depicted on the basis of previously published means and standard deviations23-25.
Fig. 3.
Charts demonstrating the relationship between chronological age and percentage of final height for males and females. Each radiograph was assessed for humeral stage and was plotted with regard to the chronological age and percent of final height of the patient during that presentation. The radiographs were color-coded by humeral stage as depicted. Both charts are on the same scale and use the same color scheme. Tanner stages were depicted on the basis of the means and standard deviations established in previous literature as described in the Results section.
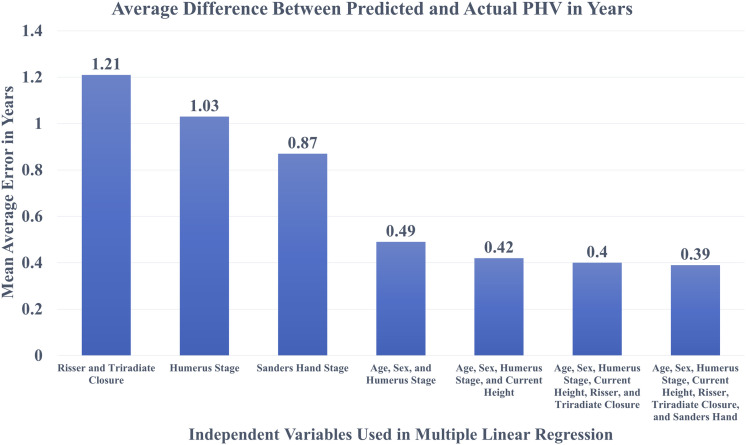
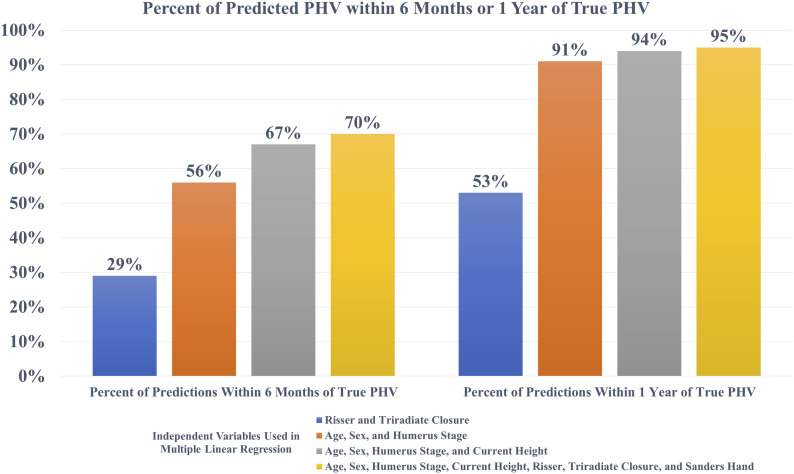
Finally, we conducted multiple linear regression with PHV as the dependent variable to be predicted and skeletal staging systems as well as demographic characteristics as the independent variables. We used the resulting linear equations as a model to calculate a predicted PHV for each case. We assessed the performance of each linear regression model by calculating the difference between the PHV predicted by the model and the real PHV measured from patients. The average error between the predicted and real PHV values was called the mean absolute error and is plotted for each model in Figure 4. We also calculated the percentage of predicted PHV values that were accurate to within 6 months or a year of the real PHV and plotted the results in Figure 5. We found that the model using only the Risser sign and triradiate closure was the least accurate, with only 29% of predictions accurate to within 6 months and 53% of predictions accurate to within 1 year. Incorporating the humeral head staging method as well as age and sex into the linear regression improved this performance to 56% accuracy within 6 months and 91% accuracy within 1 year. Finally, the incorporation of standing height and the Sanders hand system into the linear regression yielded the best performance.
Fig. 4.
Bar graph comparing mean absolute errors between each linear regression equation, with smaller absolute errors indicating better predictions from the corresponding model. For example, a model that consistently made predictions that were 1 year off from the true PHV would have a mean absolute error of 1.00, whereas a model that made perfectly accurate predictions would have a mean absolute error of 0.00. Risser sign, triradiate closure, humeral stage, age, sex, current height, and Sanders hand stage are the independent variables that were included in the indicated combinations for the models.
Fig. 5.
Bar graph showing the percentage of predictions that were accurate to within 6 months or 1 year of the true PHV measured from the patient. The height of the bar indicates the percentage of predictions that were accurate within the given time frame. For example, a model that was perfectly accurate would have a value of 100%. Risser sign, triradiate closure, humeral stage, age, sex, current height, and Sanders hand stage are the independent variables that were included in the indicated combinations for the models.
Discussion
Although many tools for assessing maturity have been described, the key questions are whether these tools can be applied to modern patients reliably and whether these metrics yield improved assessments of PHV compared with current gold standards. We demonstrated that proximal humeral ossification can be assessed accurately on radiographs showing the shoulders in patients with scoliosis. The reliability of assessment of these radiographs was similar to that observed in dedicated radiographs from the historical Brush Collection. Furthermore, we suggest that the humerus can be staged in many positions, although we suggest that a spine radiograph with the hands by the sides and the palms facing forward is optimal for this purpose. We found that, in some radiographs, lead shielding or artificial cropping eliminated the humerus from the field of view; however, minor adjustments easily allowed for visualization of the humerus.
With regard to the increasing use of EOS systems (EOS Imaging) for the evaluation of scoliosis, we believe that adequate assessment of the humerus can be obtained while still allowing for sagittal visualization. Our recommended positioning is with the arms positioned down with slight forward flexion of the shoulder such that the hands are at least in front of the thighs. With EOS imaging, we believe that this slight forward shoulder flexion will permit adequate visualization of the spine in the sagittal plane. Therefore, all of the relevant information can be obtained from a single shot.
An important and reasonable concern is whether historical patients can be accurately compared with modern patients. Some of these suggested limitations are the difference in age of puberty between historical and modern patients, the reliability of current height measurements compared with historical controls, and the ethnicities of modern and historical patients. Taking each of these limitations in turn, we believe that we have adequately controlled for children reaching puberty at an earlier age because we normalized our system to PHV rather than chronological age. Furthermore, if there is a largely uniform shift in the age of puberty, such an effect would be expected to uniformly change the relationship between the stages and chronological age but not affect their reliability or predictive accuracy. These relationships between chronological age, growth, height, and sex are best illustrated in Figure 3, which shows how the humeral stages remain well differentiated in both males and females. Notably, the pattern of stages occurs in chronologically older males but the relationship to percent of growth remains consistent.
We acknowledge the limitation that modern techniques and average heights may be different from historical controls. To determine how big such an effect might be, we calculated models both with and without current height. We found that when current height was excluded as a variable, the mean absolute error was 0.49 year and 91% of predictions were accurate within a year. Incorporation of height marginally improved the performance to a mean absolute error of 0.42 year and 94% accuracy within 1 year. Therefore, although height has an important role, excluding this variable yielded a model that generated excellent results.
With regard to the power of this analysis, we found that, on average, each humeral stage differed from the surrounding stages by 2.01 years and the normalized standard deviations were 1.24 years per group. Therefore, we would have required 84 patients to achieve a power of 0.99. With 216 patients, we had a power of >0.9999 to detect the average predicted difference between stages. Therefore, we believe that our study was sufficiently powered to validate the humeral classification system in modern patients.
Regarding differences between the largely white suburbanite population of the Brush Collection and modern patients, we believe that our comparison of modern versus historical staging shows that osteology is remarkably consistent in humans. Specifically, the same team was able to unambiguously assign a humeral stage with high interobserver reliability (ICC = 0.92 for modern patients, compared with 0.95 for historical patients) even though the modern patients came from a very diverse urban environment and practice. Furthermore, standards such as the Greulich and Pyle system were derived from the same historical data set.
In terms of the comparison between the proximal humeral ossification system and the Sanders hand system, we found that the Sanders hand system remains the gold standard for accuracy in terms of growth prediction; however, we noted that our system merits consideration for several reasons. First, our method dramatically improves on the canonical Risser/triradiate cartilage assessment system (mean absolute error, 1.03 compared with 1.21) and involves the use of the same spine radiograph that is routinely obtained at scoliosis visits. Therefore, it allows for the extraction of additional information without increasing radiation exposure, time, or cost. Second, our system can subdivide the Sanders hand system into narrower growth intervals such that there are 7 combinations prior to PHV compared with 2 when either system is used alone. This allows for far greater capacity to distinguish which patients have not yet reached their PHV. Finally, we note that our system is extremely simple to remember and has 2 combinations (H2S3) and (H3S2) that correspond nearly exactly to the time of PHV.
We believe that the present study establishes the merit of the proximal humeral ossification system for the evaluation of patients with scoliosis. We believe that this method will be of wide interest to surgeons because scoliosis is a common condition affecting between 1% to 5% of children26-28 and because surgery for scoliosis is a major intervention that can cost up to $100,000 and alter the life of patients29,30. We believe that developing tools for assessing maturity to guide the treatment of scoliosis and to inform families of the risk of curve progression—particularly during PHV—is an important pediatric orthopaedic imperative19. Finally, we expect that this method of evaluating the amount of growth remaining may be combined with the Cobb angle to prospectively create a treatment algorithm that can be used to improve the ability of physicians to accurately determine which patients will progress to a surgical range.
Footnotes
Don T. Li, MS, and George C. Linderman, PhD, contributed equally to the preparation of this article.
Investigation performed at the Department of Orthopaedics and Rehabilitation, Yale School of Medicine, New Haven, Connecticut
Disclosure: The authors acknowledge a 2018 POSNA Start Up Research Grant that was awarded to Dr. Brian G. Smith and now transferred to Dr. Daniel R. Cooperman on “Guiding Scoliosis Evaluation with a Humeral Head Ossification Algorithm.” On the Disclosure of Potential Conflicts of Interest forms, which are provided with the online version of the article, one or more of the authors checked “yes” to indicate that the author had a relevant financial relationship in the biomedical arena outside the submitted work (http://links.lww.com/JBJS/F483).
References
- 1.Pyle SI, Mann AW, Dreizen S, Kelly HJ, Macy IG, Spies TD. A substitute for skeletal age (Todd) for clinical use: the red graph method. J Pediatr. 1948. February;32(2):125-36. [DOI] [PubMed] [Google Scholar]
- 2.Pyle SI, Reed RB, Stuart HC. Patterns of skeletal development in the hand. Pediatrics. 1959. November;24:886-903. [PubMed] [Google Scholar]
- 3.Pyle SI, Waterhouse AM, Greulich WW. Attributes of the radiographic standard of reference for the National Health Examination Survey. Am J Phys Anthropol. 1971. November;35(3):331-7. [DOI] [PubMed] [Google Scholar]
- 4.Tanner JM, Davies PS. Clinical longitudinal standards for height and height velocity for North American children. J Pediatr. 1985. September;107(3):317-29. [DOI] [PubMed] [Google Scholar]
- 5.Tanner JM, Whitehouse RH, Takaishi M. Standards from birth to maturity for height, weight, height velocity, and weight velocity: British children, 1965. II. Arch Dis Child. 1966. December;41(220):613-35. [DOI] [PMC free article] [PubMed] [Google Scholar]
- 6.Lonstein JE, Carlson JM. The prediction of curve progression in untreated idiopathic scoliosis during growth. J Bone Joint Surg Am. 1984. September;66(7):1061-71. [PubMed] [Google Scholar]
- 7.Peterson LE, Nachemson AL. Prediction of progression of the curve in girls who have adolescent idiopathic scoliosis of moderate severity. Logistic regression analysis based on data from The Brace Study of the Scoliosis Research Society. J Bone Joint Surg Am. 1995. June;77(6):823-7. [DOI] [PubMed] [Google Scholar]
- 8.Ylikoski M. Growth and progression of adolescent idiopathic scoliosis in girls. J Pediatr Orthop B. 2005. September;14(5):320-4. [DOI] [PubMed] [Google Scholar]
- 9.Popejoy D, Emara K, Birch J. Prediction of contralateral slipped capital femoral epiphysis using the modified Oxford bone age score. J Pediatr Orthop. 2012. Apr-May;32(3):290-4. [DOI] [PubMed] [Google Scholar]
- 10.Stasikelis PJ, Sullivan CM, Phillips WA, Polard JA. Slipped capital femoral epiphysis. Prediction of contralateral involvement. J Bone Joint Surg Am. 1996. August;78(8):1149-55. [DOI] [PubMed] [Google Scholar]
- 11.Li DT, Cui JJ, DeVries S, Nicholson AD, Li E, Petit L, Kahan JB, Sanders JO, Liu RW, Cooperman DR, Smith BG. Humeral head ossification predicts peak height velocity timing and percentage of growth remaining in children. J Pediatr Orthop. 2018. October;38(9):e546-50. [DOI] [PMC free article] [PubMed] [Google Scholar]
- 12.Hackman L, Black S. The reliability of the Greulich and Pyle atlas when applied to a modern Scottish population. J Forensic Sci. 2013. January;58(1):114-9. Epub 2012 Oct 12. [DOI] [PMC free article] [PubMed] [Google Scholar]
- 13.Li SQ, Nicholson AD, Cooperman DR, Liu RW. Applicability of the calcaneal apophysis ossification staging system to the modern pediatric population. J Pediatr Orthop. 2019. January;39(1):46-50. [DOI] [PubMed] [Google Scholar]
- 14.Knapik DM, Sanders JO, Gilmore A, Weber DR, Cooperman DR, Liu RW. A quantitative method for the radiological assessment of skeletal maturity using the distal femur. Bone Joint J. 2018. August;100-B(8):1106-11. [DOI] [PMC free article] [PubMed] [Google Scholar]
- 15.Garcia MR, Nicholson AD, Nduaguba AM, Sanders JO, Liu RW, Cooperman DR. Ossification of the phalanges of the foot and its relationship to peak height velocity and the calcaneal system. J Child Orthop. 2018. February 1;12(1):84-90. [DOI] [PMC free article] [PubMed] [Google Scholar]
- 16.Nicholson AD, Sanders JO, Liu RW, Cooperman DR. The relationship of calcaneal apophyseal ossification and Sanders hand scores to the timing of peak height velocity in adolescents. Bone Joint J. 2015. December;97-B(12):1710-7. [DOI] [PubMed] [Google Scholar]
- 17.Sanders JO, Browne RH, McConnell SJ, Margraf SA, Cooney TE, Finegold DN. Maturity assessment and curve progression in girls with idiopathic scoliosis. J Bone Joint Surg Am. 2007. January;89(1):64-73. [DOI] [PubMed] [Google Scholar]
- 18.Sanders JO, Khoury JG, Kishan S, Browne RH, Mooney JF, 3rd, Arnold KD, McConnell SJ, Bauman JA, Finegold DN. Predicting scoliosis progression from skeletal maturity: a simplified classification during adolescence. J Bone Joint Surg Am. 2008. March;90(3):540-53. [DOI] [PubMed] [Google Scholar]
- 19.Vira S, Husain Q, Jalai C, Paul J, Poorman GW, Poorman C, Yoon RS, Looze C, Lonner B, Passias PG. The Interobserver and intraobserver reliability of the Sanders classification versus the Risser stage. J Pediatr Orthop. 2017. June;37(4):e246-9. [DOI] [PubMed] [Google Scholar]
- 20.Nelson S, Hans MG, Broadbent BH, Jr, Dean D. The Brush Inquiry: an opportunity to investigate health outcomes in a well-characterized cohort. Am J Hum Biol. 2000. January;12(1):1-9. [DOI] [PubMed] [Google Scholar]
- 21.Nicholson AD, Liu RW, Sanders JO, Cooperman DR. Relationship of calcaneal and iliac apophyseal ossification to peak height velocity timing in children. J Bone Joint Surg Am. 2015. January 21;97(2):147-54. [DOI] [PubMed] [Google Scholar]
- 22.Laowansiri U, Behrents RG, Araujo E, Oliver DR, Buschang PH. Maxillary growth and maturation during infancy and early childhood. Angle Orthod. 2013. July;83(4):563-71. Epub 2012 Nov 13. [DOI] [PMC free article] [PubMed] [Google Scholar]
- 23.Sanders JO, Qiu X, Lu X, Duren DL, Liu RW, Dang D, Menendez ME, Hans SD, Weber DR, Cooperman DR. The uniform pattern of growth and skeletal maturation during the human adolescent growth spurt. Sci Rep. 2017. December 1;7(1):16705. [DOI] [PMC free article] [PubMed] [Google Scholar]
- 24.Goddings AL, Mills KL, Clasen LS, Giedd JN, Viner RM, Blakemore SJ. The influence of puberty on subcortical brain development. Neuroimage. 2014. March;88:242-51. Epub 2013 Oct 11. [DOI] [PMC free article] [PubMed] [Google Scholar]
- 25.Konforte D, Shea JL, Kyriakopoulou L, Colantonio D, Cohen AH, Shaw J, Bailey D, Chan MK, Armbruster D, Adeli K. Complex biological pattern of fertility hormones in children and adolescents: a study of healthy children from the CALIPER cohort and establishment of pediatric reference intervals. Clin Chem. 2013. August;59(8):1215-27. Epub 2013 May 1. [DOI] [PubMed] [Google Scholar]
- 26.Daruwalla JS, Balasubramaniam P, Chay SO, Rajan U, Lee HP. Idiopathic scoliosis. Prevalence and ethnic distribution in Singapore schoolchildren. J Bone Joint Surg Br. 1985. March;67(2):182-4. [DOI] [PubMed] [Google Scholar]
- 27.Konieczny MR, Senyurt H, Krauspe R. Epidemiology of adolescent idiopathic scoliosis. J Child Orthop. 2013. February;7(1):3-9. Epub 2012 Dec 11. [DOI] [PMC free article] [PubMed] [Google Scholar]
- 28.Soucacos PN, Soucacos PK, Zacharis KC, Beris AE, Xenakis TA. School-screening for scoliosis. A prospective epidemiological study in northwestern and central Greece. J Bone Joint Surg Am. 1997. October;79(10):1498-503. [DOI] [PubMed] [Google Scholar]
- 29.Daffner SD, Beimesch CF, Wang JC. Geographic and demographic variability of cost and surgical treatment of idiopathic scoliosis. Spine (Phila Pa 1976). 2010. May 15;35(11):1165-9. [DOI] [PubMed] [Google Scholar]
- 30.Yawn BP, Yawn RA. The estimated cost of school scoliosis screening. Spine (Phila Pa 1976).) 2000. September 15;25(18):2387-91. [DOI] [PubMed] [Google Scholar]


