ABSTRACT
MiR-324-5p is overexpressed in papillary thyroid carcinoma (PTC) with lymph node metastasis and promotes malignant phenotypes of KTC-1 cell line. However, the detailed regulatory mechanism remains unknown. Tumor microenvironment plays a key role in tumor progression. CCAAT enhancer-binding protein delta (CEBPD) is important in immune and inflammatory responses. In this study, we investigated the interaction between miR-324-5p/PTPRD/CEBPD axis and tumor microenvironment in PTC progression. K1 and KTC-1 were transfected by lenti-CEBPD or CEBPD-sh vectors. Supernatant from different groups was harvested and added into culture media of human macrophages and HUVEC. Cell viability, colony formation, invasive and migrated cell number, and gap closure rate were elevated in lenti-CEBPD group. Compared with the control, supernatant from lenti-CEBPD group contained more abundant levels of VEGF and IL-4/IL-13, which, respectively, induced higher HUVEC invasion/migration rates and more obvious M2 marker (CD206) and genes (PPAR-γ and MRC-1) expression in macrophages. By means of luciferase reporter assay and gene manipulation, we identified that CEBPD was negatively regulated in PTC by protein tyrosine phosphatase receptor delta (PTPRD) which was the target of miR-324-5p. CEBPD-shRNA was also proved to reverse the effect of PTPRD-sh1 or miR-324-5p mimic on IL-4/IL-13 expression and HUVEC invasion. These results suggested that miR-324-5p/PTPRD/CEBPD axis was involved in the progression of PTC by inducing HUVEC invasion/migration and macrophage M2 polarization via VEGF and IL4/IL13, respectively.
KEYWORDS: Tumor microenvironment, papillary thyroid carcinoma, progression, CCAAT enhancer binding protein delta, miR-324-5p
Introduction
Papillary thyroid carcinoma (PTC) is the most common histological type of thyroid cancer and the incidence has increased substantially.1-3 Lymph node metastasis (LNM) is the main factor for prognosis prediction and is directly related to the management. Ultrasound is the first choice of LNM detection. However, its sensitivity is low, especially in central compartment lymph node metastasis. Based on the genome-wide miRNAs expression profile analysis and identification, miR-324-5p is found to be significantly overexpressed in metastatic PTC tissue samples. Most LNM in unifocal intrathyroidal PTMC can be predicted by miR-324-5p detection in FNA lavage fluid, which makes up for the deficiency of conventional ultrasound to some extent.4
It has been proved that abnormal regulation of IL-4/miR-324-5p/CUEDC2 axis (CUEDC2 is a negative regulator of the JAK1-STAT3 pathway) leads to macrophages dysfunction, which is associated with the genesis and development of colon cancer.5 The axis also participates in invasion and migration of breast cancer via suppression of NF-kB.6 Kuo WT et al. reveal that overexpression of miR-324-5p/3p can inhibit growth and invasiveness of breast cancer, while upregulation of miR-324-5p can reduce the biological ability of colon cancer cells.7 Our previous experiments indicate that miR-324-5p promotes the invasion and migration of PTC cells.4 However, its mechanism remains unclear.
Tumor microenvironment generally refers to the special environment of tumor cell tumorigenesis and plays a key role in tumor progression and metastasis, which is composed of vascular endothelial cells, mesenchymal stem cells, adipocytes, fibroblasts, immune cells, and extracellular matrix.8 Tumor-associated macrophages (TAMs), important components of tumor microenvironment, have an M2 phenotype and are closely related to immune suppression, angiogenesis, invasion, and metastasis.9,10 Ryder M et al. report that high TAM density is positively correlated with high tumor invasiveness and low survival rate.11 Qing W et al. find that TAM density in PTC is related to lymph node metastasis and TNM staging. However, they have not found correlation between BRAF mutation and TAMs density, which suggests that other molecules might play a role in the mechanism related with TAMs.12
The objective of this study is to find out the downstream of miR-324-5p and elucidate the underlying mechanism in regulating PTC progression, thereby finding out potential therapeutic target or diagnostic biomarker to optimize preoperative risk stratification and realize personalized medication.
Results
PTPRD was a target of miR-324-5p and acted as tumor suppressor in PTC
Based on our previous research, we searched three publicly available miRNA target prediction tools and found that PTPRD was a potential target of miR-324-5p (Figure 1a). To confirm the hypothesis, luciferase reporter assay was carried out. We observed a significant loss of luciferase activity in wild type PTPRD group when KTC-1 was co-transfected with miR-324-5p mimic compared with the negative control (NC). When KTC-1 was co-transfected with luciferase reporters containing mutant type PTPRD, no statistical difference was observed between miR-324-5p mimic and NC in luciferase activity (Figure 1b). Moreover, we detected protein and mRNA levels of PTPRD in both K1 and KTC-1 with miR-324-5p overexpression or knockdown. The miR-324-5p mimic and inhibitor affected the expression of PTPRD protein without changing the PTPRD mRNA level (Figure 1c). Taken together, our research identified PTPRD as a target of miR-324-5p.
Figure 1.
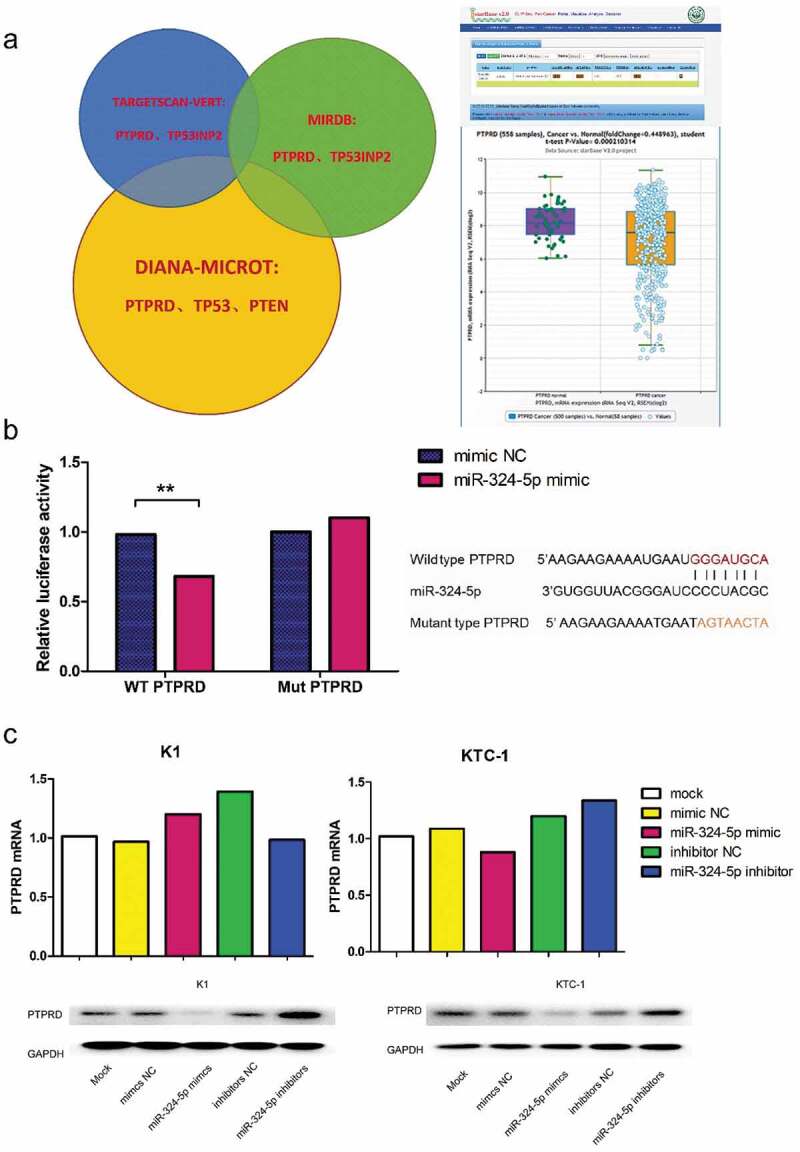
PTPRD was the target of miR-324-5p. (a) The left part exhibited the intersected target genes of miR-324-5p from databases including TargetScan, miRDB and DIANA microT. The right part showed data from starBase 2.0, which demonstrated that expression level of PTPRD was significantly declined in PTC compared with the normal group.13,14 (b) Luciferase activity of wild type PTPRD was significantly decreased when KTC-1 was cotransfected with miR-324-5p mimic. In mutant type group, no statistical difference was explored between miR-324-5p mimic and NC subgroup. Sequences of wide/mutant type PTPRD 3’UTR and the binding site of miR-324-5p was uncovered. Data were representative of experiments in quintuplicate. **P <.01. (c) The upper part exhibited quantification of PTPRD mRNA in miR-324-5p mimic or miR-324-5p inhibitor transfected K1 and KTC-1 presented relative to β-actin mRNA by qRT-PCR. Data were representative of experiments in triplicate. The lower part demonstrated PTPRD protein levels in miR-324-5p mimic or miR-324-5p inhibitor transfected K1 and KTC-1 with GAPDH as endogenous control by western blot analysis.
We further detected the function of PTPRD in PTC (Figure S1). PCR quantification revealed that PTPRD level was more highly expressed in KTC-1 compared to that in K1 (Figure 2a); therefore, we upregulated PTPRD in K1 and downregulated PTPRD in KTC-1. PTPRD overexpression dramatically inhibited cell viability and colony formation of K1. The cell viability and colony formation were promoted by PTPRD knockdown in KTC-1, which were reversed by miR-324-5p and PTPRD double knockdown. Cell cycle revealed that the proportion of cells in G1 stage was statistically larger in lenti-PTPRD group than in control group, while cells in G2 and S stage were statistically less in lenti-PTPRD group than in control group. The cell cycle results were reversible with PTPRD downregulated in KTC-1. Transwell assay and scratch assay disclosed that invasion and migration of K1 were restrained in lenti-PTPRD group. On the other hand, PTPRD knocked down in KTC-1 significantly enhanced cell invasion and migration. These data resulted in the consolidation of the tumor suppressive role of PTPRD in PTC.
Figure 2.
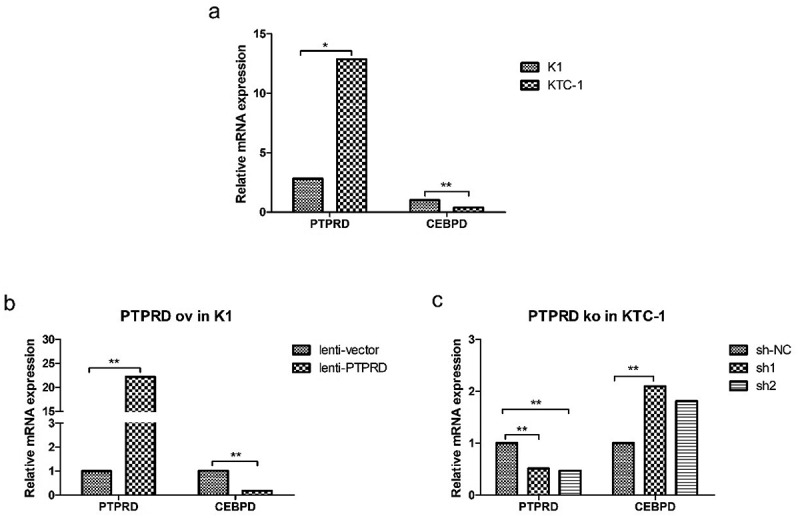
Negative correlation of PTPRD levels and CEBPD expression. (a) PTPRD and CEBPD expression in K1 and KTC-1 cells by qRT-PCR analysis. (b) CEBPD expression after PTPRD was overexpressed in K1 cell. (c) CEBPD expression after PTPRD was knocked down in KTC-1 cell. Data were representative of experiments in triplicate. *P <.05, **P <.01.
CEBPD was negatively regulated by PTPRD
Preceding microarray data contributed by Berenice Ortiz et al.15 disclosed that CEBPD was one of the downstream genes of PTPRD. CEBPD mRNA expression level was statistically higher in K1 than in KTC-1, which was opposite to the expression level of PTPRD (Figure 2a). Furthermore, PTPRD overexpression in K1 resulted in the decline of CEBPD expression (Figure 2b), while PTPRD knockdown in KTC-1 led to CEBPD upregulation (Figure 2c). These data indicated that CEBPD was negatively regulated by PTPRD, which was identified as the target of miR-324-5p.
CEBPD promoted malignant phenotypes in PTC cell lines
We examined the proliferation ability of K1 and KTC-1 by CCK8 analysis and colony formation assay. In CCK8 analysis, we found that cell viability was consistently high in lenti-CEBPD group and low in CEBPD-sh groups after cultivation for 48 h, 72 h and 96 h in both cell lines (Figure 3a). Colony formation assay showed that cell clones were more in lenti-CEBPD group than in the control group, while the clones in CEBPD-sh groups were less than in the control group (Figure 3b).
Figure 3.
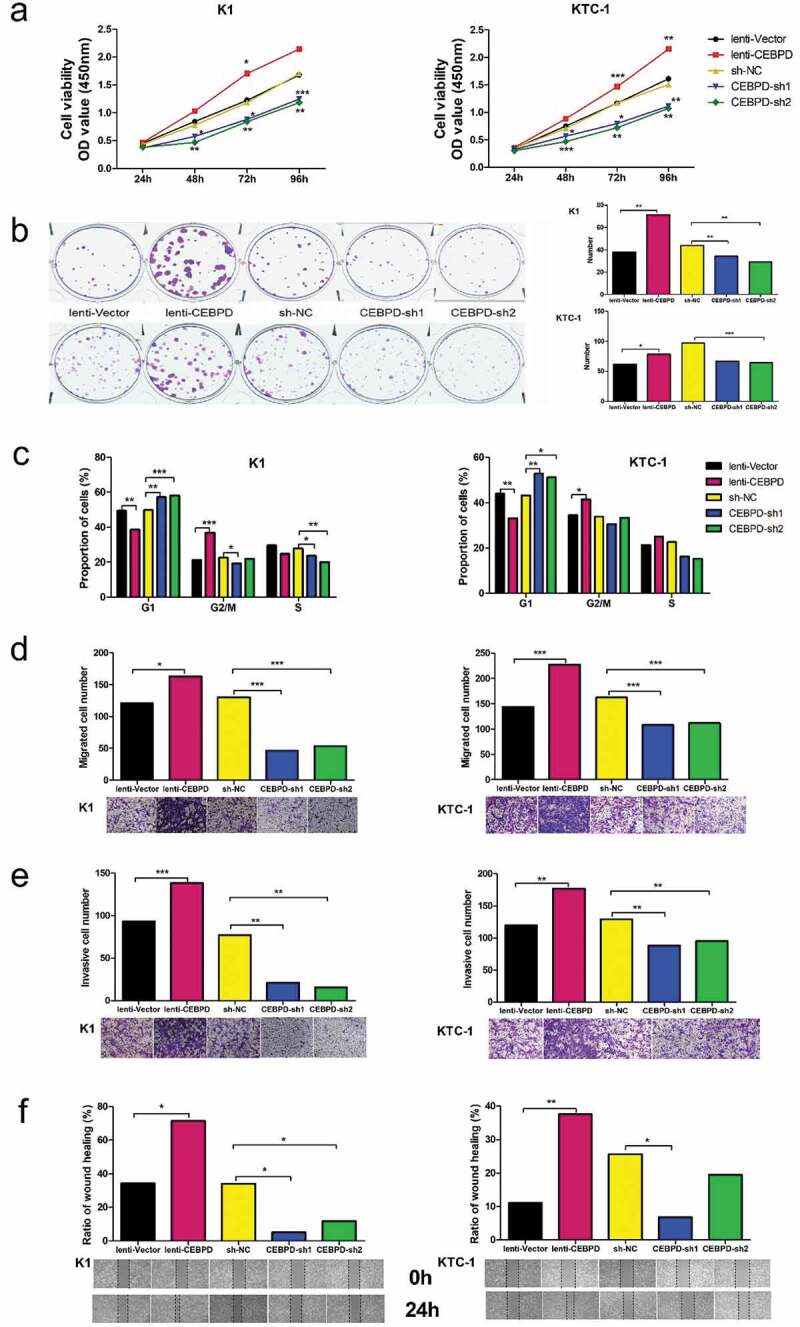
Effect of CEBPD on the proliferation, cell cycle, migration and invasion of K1 and KTC-1 cell lines. (a) CCK8 analysis of CEBPD overexpressed and knocked down both in K1 and KTC-1. (b) Colony formation assay of CEBPD overexpressed and knocked down both in K1 and KTC-1 (×100). (c) Cell cycle profiles for CEBPD overexpressed and knocked down both in K1 and KTC-1. (d) Transwell migration assay of CEBPD overexpressed and knocked down both in K1and KTC-1 (×100). (e) Transwell invasion assay of CEBPD overexpressed and knocked down both in K1 and KTC-1 (×100). (f) Scratch assay of CEBPD overexpressed and knocked down both in K1 and KTC-1 (×100). All the data were representative of experiments in triplicate or quintuplicate. *P <.05, **P <.01, ***P <.001.
Cell cycle analysis manifested that the proportion of cells in G1 stage was statistically smaller in lenti-CEBPD group than in the control group, and statistically larger in CEBPD-sh groups than in the control group (Figure 3c).
Transwell assay showed that invasive and migrated cells were more in lenti-CEBPD group and less in CEBPD-sh groups compared with the control group, respectively (Figure 3d,e). Scratch assay indicated that the defective gap closure ratio in PTC cells treated with lenti-CEBPD was higher, and was declined in CEBPD-sh groups compared with each control (Figure 3f). This finding was in line with the consequences of transwell assay.
The results corroborated that CEBPD enhanced PTC proliferation, migration and invasion.
CEBPD facilitated M2 polarization of macrophages via IL-4/IL-13
Since interleukin (IL)-4 and IL-13 are T(H)2-type cytokines and can stimulate the processes of M2 polarization,16,17 we measured the content of IL-4 and IL-13 released from K1 and KTC-1. The level of IL-4/IL-13 was increased in lenti-CEBPD group but decreased in CEBPD-sh groups compared with the control group, respectively (Figure 4a). The expression level of CEBPD was crucial for controlling cytokine production because CEBPD-sh1 markedly inhibited the effect of miR-324-5p on the cytokine expression (Figure 4b). As expected, group CEBPD-shNC + PTPRD-sh1 showed greater increase of cytokine content compared with group CEBPD-shNC + PTPRD-shNC. The content decreased dramatically after CEBPD and PTPRD double knockdown (Figure 4c).
Figure 4.
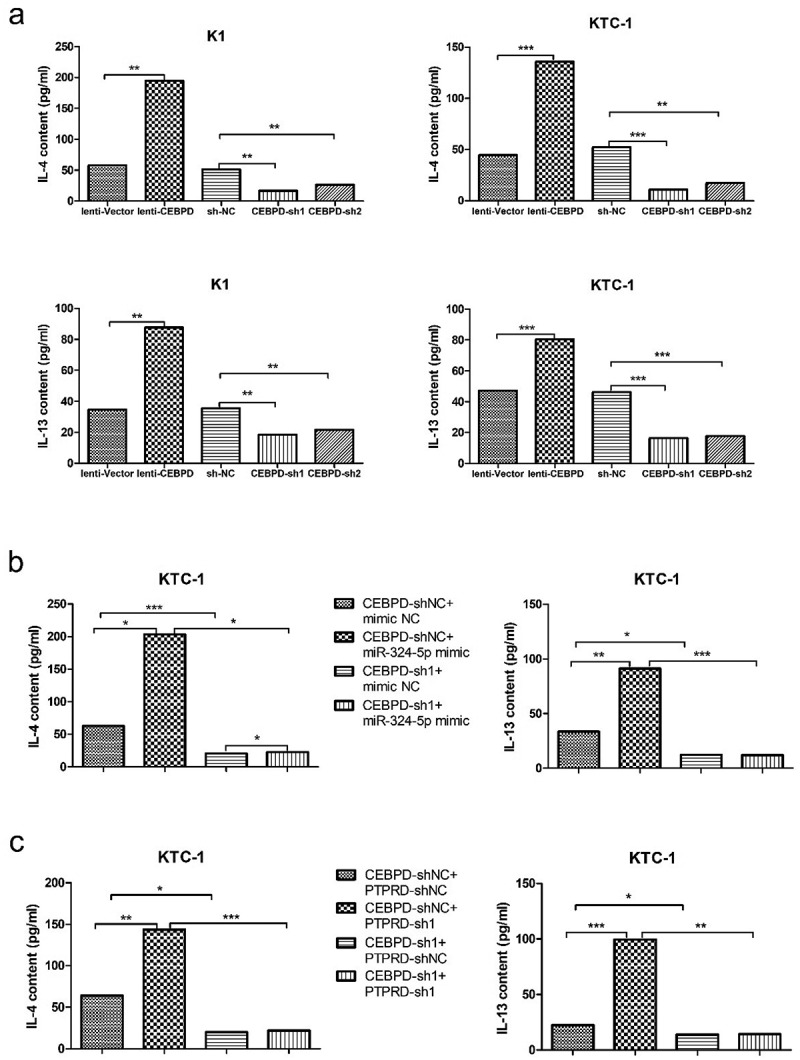
CEBPD was crucial for controlling cytokine IL-4 and IL-13 production in PTC cell lines. (a) IL-4 and IL-13 contents secreted by tumor cells manipulated with CEBPD up or down-regulated vectors. (b) IL-4 and IL-13 contents secreted by KTC-1 in group CEBPD-sh1 + miR-324-5p mimic and other indicated groups. (c) IL-4 and IL-13 contents secreted by KTC-1 in group CEBPD-sh1 + PTPRD-sh1 and other indicated groups. All the data were representative of experiments in triplicate. *P <.05, **P <.01, ***P <.001.
We then profiled M2 polarization marker (CD 206) and genes (MRC-1 and PPAR-γ) in human THP-1 differentiated macrophages cultivated with supernatant harvested from K1 and KTC-1 in different groups (lenti-CEBPD v.s. lenti–vector, CEBPD-sh1 and sh2 v.s. sh-NC). We found significantly high levels of CD206, MRC-1 and PPAR-γ in lenti-CEBPD group. In CEBPD-sh groups, expression levels of CD 206, MRC-1 and PPAR-γ were statistically lower compared with their levels in the control group (Figure 5).
Figure 5.
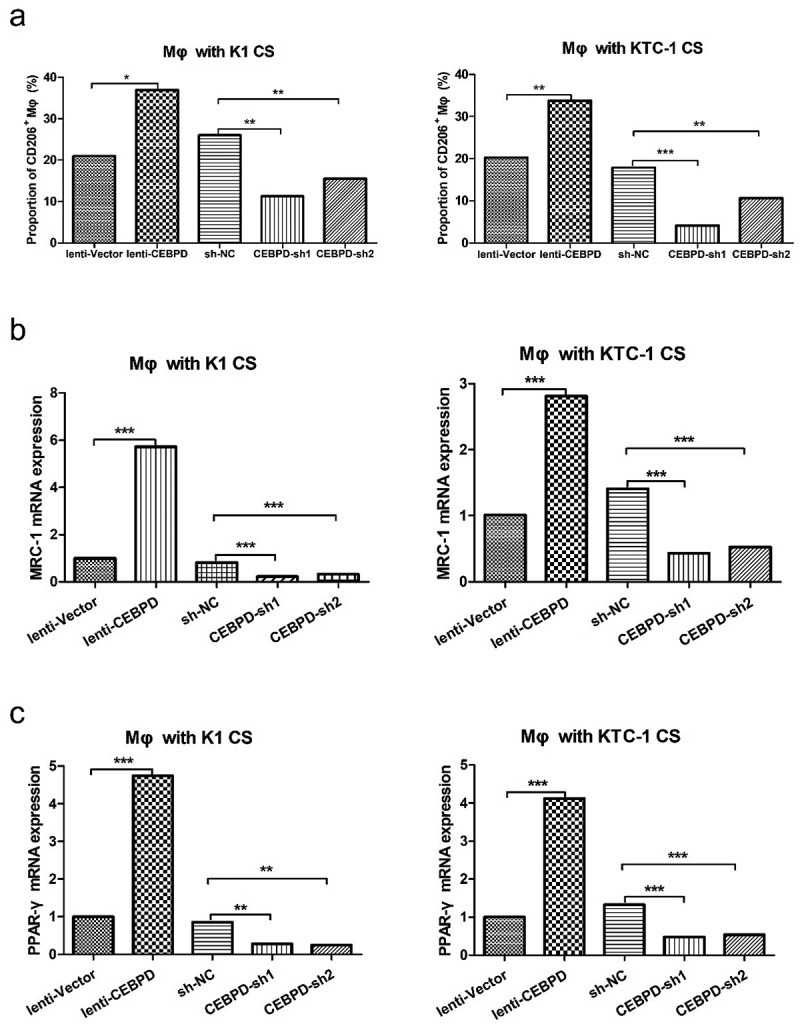
CEBPD facilitated M2 polarization of macrophages. (a) CD206+ macrophages were analyzed by flow cytometry. Macrophages were cultured with CS from K1 or KTC-1 manipulated with CEBPD up or down-regulated vectors. (b) Relative expression levels of MRC-1 and (c) PPAR-γ in macrophages cultured with CS from K1 or KTC-1 manipulated with CEBPD up or down-regulated vectors. All the data were representative of experiments in triplicate. *P <.05, **P <.01, ***P <.001; Mφ: macrophages; CS: cultural supernatant.
To sum up, these data suggested that CEBPD in PTC cell lines was critical for M2 polarization of macrophages via IL-4/IL-13.
CEBPD enhanced invasion and migration of HUVEC via VEGF
We measured the content of VEGF in K1 and KTC-1 cell culture supernatant. As depicted in Figure 6(a), the level of VEGF released by K1 and KTC-1 was higher in lenti-CEBPD group, while relatively lower in CEBPD-sh groups compared with the control group, respectively. Given the result that CEBPD enhanced the release of VEGF by K1 and KTC-1, we were encouraged to investigate the invasion ability of HUVEC when it was cultured with supernatant of CEBPD manipulated K1 and KTC-1 cell lines. Transwell assay showed that there were more invaded HUVECs in lenti-CEBPD group and less in CEBPD-sh groups compared with the control, respectively (Figure 6b). Furthermore, we used CEBPD-sh1 to test if it can reverse the effect of PTPRD-sh1 or miR-324-5p mimic. As expected, group CEBPD-shNC + PTPRD-sh1 showed more invaded HUVECs compared with group CEBPD-shNC + PTPRD-shNC. The invasive cell number decreased dramatically after CEBPD and PTPRD double knockdown. Accordingly, CEBPD-sh1 markedly reversed the promotive effect of miR-324-5p on invasive cell number of HUVEC cultured with KTC-1 CS (Figure 6c). Scratch assay was also conducted to access whether CEBPD might affect HUVEC migration. Accordantly, lenti-CEPBD group promoted gap closure faster (60%~) than CEBPD-sh groups did (~30%) after 24 h (Figure 6d). Collectively, these findings suggested that CEBPD facilitated invasion and migration of HUVEC via VEGF.
Figure 6.
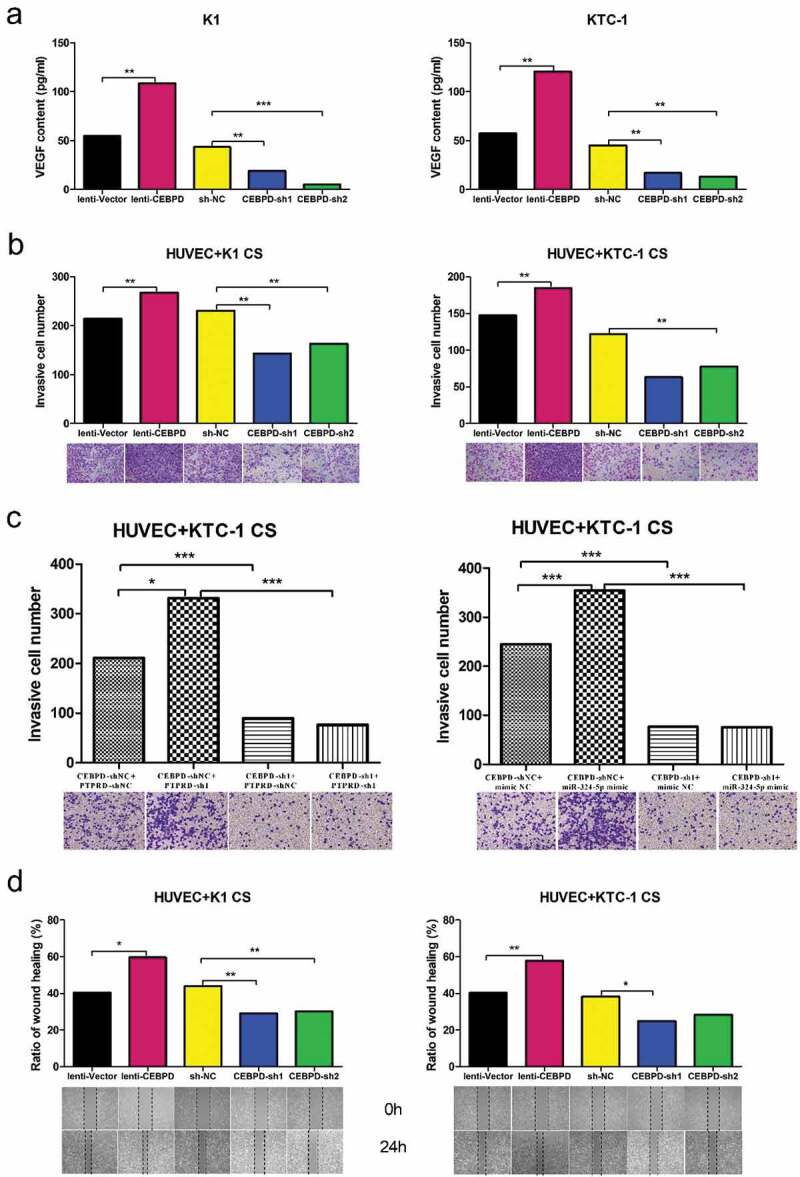
CEBPD enhanced invasion and migration of HUVEC via VEGF. (a) VEGF expression level in both K1 and KTC-1 with CEBPD up/down-regulated. (b) Transwell invasion assay performed to determine the invasion ability of HUVEC cultivated with supernatant from K1 or KTC-1 with CEBPD up/down-regulated (×100). (c) Transwell invasion assay of HUVEC cultivated with supernatant from KTC-1 in the indicated groups (×100). (d) Scratch assay performed to determine the migration ability of HUVEC cultivated with supernatant from K1 or KTC-1 with CEBPD up/down-regulated (×100). All the data were representative of experiments in triplicate. *P <.05, **P <.01, CS: cultural supernatant.
Discussion
PTPRD is one of the most frequently inactivated genes across human cancers. It is previously reported that the expression level of PTPRD is significantly decreased in PTC compared with normal group.13,14 However, the mechanistic basis of PTPRD function in PTC is unclear. Ortiz B et al. state that loss of PTPRD accelerates tumor formation through genomic analysis and a glioma mouse model. Specifically, they pinpoint PTPRD loss as a cause of aberrant STAT3 activation which alters pathways governing the macrophage response.15 In our study, we validate that PTPRD is a bona fide tumor suppressor in PTC and revealed that PTPRD is the target of mir-324-5p which acts as an oncogene in PTC metastasis.4 In our study, miR-324-5p affects the expression of PTPRD protein without changing the PTPRD mRNA level. It is possible that miR-324-5p regulates PTPRD expression at translational level.18
With the support of microarray analysis from Ortiz B et al.’s study, we find out that CCAAT enhancer-binding protein delta (CEBPD), an intron-free gene, is the downstream of PTPRD. CEBPD is important in immune and inflammatory responses. Min Y et al. report that CEBPD regulates VEGF-C autocrine signaling in lymphangiogenesis and metastasis of lung cancer through HIF-1 alpha.19 Wang WJ et al. establish that inhibition of the EGFR/STAT3/CEBPD axis reverses cisplatin cross-resistance with paclitaxel in the urothelial carcinoma of the urinary bladder.20 Ko CY et al. put forward that glycogen synthase kinase-3beta-mediated CEBPD phosphorylation in astrocytes promotes migration and activation of microglia/macrophages.21 In the current study, we find out that PTC originated CEBPD enhances invasion/migration of HUVEC via VEGF. VEGF is indispensable in the progression of angiogenesis.22 Furthermore, CEBPD in PTC is revealed to play a crucial role in M2 polarization of macrophages via IL-4/IL-13. IL-4 and IL-13 are found to induce ‘alternatively activated macrophage’ which is also named M2a.16,17 CEBPD-shRNA is also proved to reverse the effect of PTPRD-sh1 or miR-324-5p mimic on cytokine expression and HUVEC invasion. Thus, our results expand the regulatory mechanism of CEBPD, the downstream of miR-324-5p/PTPRD, in PTC microenvironment.
TAMs display M2 or ‘alternatively activated’ phenotype, which can stimulate angiogenesis and enhance tumor cell invasion, motility, and intravasation in the primary tumor.23 M2 macrophages are defined by their expression of CD206 and secretion of monocyte chemoattractant protein-1 and IL-10.24 CD206 is also termed as mannose receptor C-type 1 (MRC-1). We quantify both CD206 and MRC-1 as markers of M2 macrophages at cytokine and mRNA levels, respectively. The outcome reflects that the proportion of M2 macrophages in tumor microenvironment elevates as a result of upregulation of CEBPD in PTC.
The prior study also finds that the density of TAMs increases if thyroid cancer is in advanced stage.25 The presence of TAMs’ high density region correlates with tumor invasion positively and decreases cancer-related survival rate, which has not been proven to be BRAF related.12,26 Hence, the M2 polarization in macrophages induced by miR-324-5p/PTPRD/CEBPD axis in our paper bridges this research gap to some extent.
Transcription factor networks are important regulators of macrophage polarization. Peroxisome proliferator-activated receptor gamma (PPAR-γ) activation suppresses the production of proinflammatory cytokines and is critical for the formation, activation, and maintenance of alternatively activated macrophages.16 Elevated PPAR-γ expression in human macrophages is one of the biological markers of IL-4/IL-13-mediated alternative activation.27 Huang JT et al. report that IL-4 induces PPAR-γ expression and activity by generating natural PPAR-γ ligands via the 12/15-lipoxygenase pathway.28 Furthermore, IL-4 signaling enhances PPAR-γ activity through an interaction between PPAR-γ and the STAT6 on promoters of PPARγ-target genes.29 In the field of thyroid cancer, Wood WM et al. find that PPAR-γ promotes the growth and invasion of thyroid cancer cells,30 while Ohta K et al. reveal that PPAR-γ ligands inhibit PTC proliferation and induce apoptosis.31 Based on thyroid-specific PPAR-γ deleted mouse model, Yu J et al. illuminate that thyroid cell-derived PPAR-γ neither plays an important role in the development or function of the thyroid gland, nor does it have a tumor suppressive effect.32 There is no existing finding whether TAM-derived PPAR-γ is associated with thyroid cancer generation and metastasis or not. A positive feedback on PPAR-γ activity in TAM remains a question to be further studied.
In conclusion, data in this paper demonstrate pleiotropic effects of axis miR-324-5p/PTPRD/CEBPD in PTC progression via microenvironment alteration. The processes involve invasion/migration of HUVEC by VEGF as well as elevated TAM proportion by IL-4/IL-13 (Figure 7).
Figure 7.
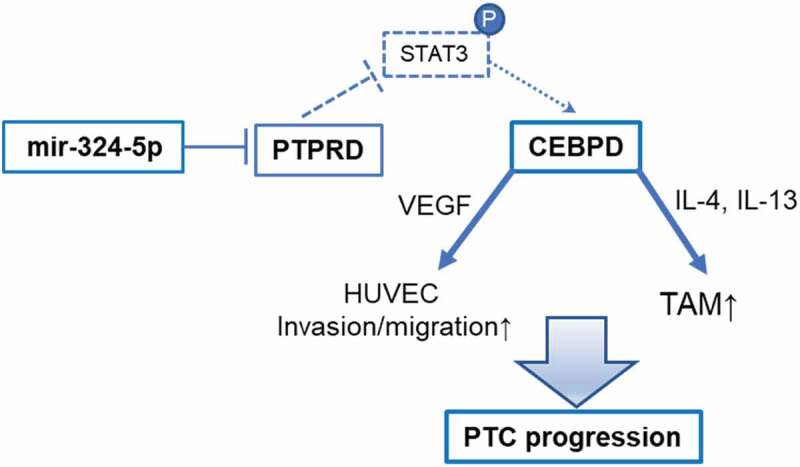
Diagram of miR-324-5p/PTPRD/CEBPD axis in PTC progression.
Materials and methods
Cell culture
The human PTC cell line KTC-1, human umbilical vein endothelial cell (HUVEC) and human monocytic THP-1 cells were purchased from Shanghai Institutes for Biological Sciences (Shanghai, China). The human PTC cell line K1 was purchased from Shanghai Lianmai biological engineering co. LTD (Shanghai, China). KTC-1 was cultured in RPMI 1640 Medium HEPES (Gibco) which was supplemented with 10% of FBS (Gibco, Carlsbad, CA, USA), 100 U/ml penicillin, and 100 μg/ml streptomycin. To differentiate macrophages, THP-1 cells were cultured in RPMI 1640 medium with 100 ng/ml PMA (Sigma, St. Louis, MO) for 48 h. HUVEC was maintained in DMEM-H (Gibco, Carlsbad, CA, USA) supplemented with 10% of FBS (Gibco) and 100 U/ml penicillin, 100 μg/ml streptomycin. K1 was cultured in DMEM (Gibco), MCDB (Sigma, Saint Louis, Missouri, USA), and F12 (Gibco) (2:1:1) medium supplemented with 10% of FBS (Gibco), 100 U/mL penicillin, and 100 μg/ mL streptomycin. Cell lines were incubated at 37°C in a humidified atmosphere of 5% CO2.
Target genes analysis and luciferase reporter assay
In this research, genes were collected from three publicly available miRNA target prediction tools and intersected to obtain the target genes of miR-324-5p. The databases included TargetScan (http://www.targetscan.org/), miRDB (http://mirdb.org/cgi-bin/search.cgi), and DIANA microT (http://diana.imis.athena-innovation.gr/). Along with data from starBase 2.0 (http://starbase.sysu.edu.cn/), PTPRD was determined as the best candidate.
To generate plasmids containing miR-324-5p binding sites for PTPRD, psiCHECK2 vector was digested by NotI and XhoI restriction enzymes. 3′-UTR of PTPRD was amplified from cDNA with primers for sense 5′- CCG CTC GAG CTT CTC TCC CTG AAA CAA T-3′ and antisense 5′- ATA AGA ATG CGG CCG CCA GTA AGA TTC CCG CAA-3′, and inserted into psiCHECK2 vectors according to the manufacturer’s protocol.
For luciferase activity assay, KTC-1 were cultured in 96-well plates for 24 h. Then, PTPRD 3′-UTR wild type or mutant type reporter plasmids were transiently co-transfected with synthetic miR-324–5p mimic or scramble sequences (NC) respectively, using Lipofectamine 2000 (Invitrogen). After 48 h, firefly and Renilla luciferase activities were measured in cell lysates by the Dual-Luciferase kit assay (Promega). Renilla luciferase activity was normalized to firefly luciferase activity in the lysates.
RNA extraction and quantitative reverse transcriptase-polymerase chain reaction PCR (qRT-PCR)
Total RNA was isolated from cells by using TRIZOL Reagent (#15596-026, Invitrogen, Carlsbad, CA, USA), according to the manufacture’s protocol. One microgram of total RNA was reversely transcribed into first-strand cDNA by Reverse Transcription Kit (Takara, Dalian, China), followed with PCR reaction by SYBR® Premix Ex TaqTM II Kit (Takara, Dalian, China), according to the instruction in VIIA7 system (Applied Biosystems, California, USA). All amplifications were normalized by β-actin. Data were analyzed by the comparison Ct (2−ΔΔCt) method and expressed as fold change compared to the negative control. Each sample was evaluated in triplicate. Gene primers were listed in Table S1.
Plasmid construction and transfection
CEBPD was knocked down and overexpressed both in K1 and KTC-1. For gene downregulation, shRNAs against CEBPD were purchased from GenePharma Co., Ltd (Shanghai, China). K1 and KTC-1 cells were transfected with lentiviral constructs expressing shRNAs or shNC (shRNA scramble sequences). For gene overexpression, CEBPD-coding region was amplified with PrimerSTAR polymerase kit. The PCR products were gel-purified and directly inserted into XbaI/NotI digested pCDH to generate the pCDH-CEBPD lentiviral expression vectors. Gibson reaction was used to recombine the vector and the gene fragment with Gibson Assembly Master Mix (E2611 L) of NEB company. K1 and KTC-1 cells were transfected with lentiviral constructs expressing pCDH-CEBPD vectors or pCDH-vectors according to the manufacturer’s protocol.
PTPRD was knocked down in KTC-1 and overexpressed in K1. ShRNAs against PTPRD were purchased from GenePharma Co., Ltd (Shanghai, China). KTC-1 cells were transfected with lentiviral constructs expressing shRNAs or shNC. PTPRD-coding region was amplified with PrimerSTAR polymerase kit. The PCR products were gel-purified and directly inserted into XbaI/NotI digested pCDH to generate the pCDH-PTPRD lentiviral expression vectors. Gibson reaction was used to recombine the vector and the gene fragment with Gibson Assembly Master Mix (E2611 L) of NEB company. K1 cells were transfected with lentiviral constructs expressing pCDH-PTPRD vectors or pCDH-vectors according to the manufacturer’s protocol.
MiR-324-5p mimics or inhibitors and their control oligonucleotides were synthesized by Shanghai Genepharma Co., Ltd. KTC-1 cells were transfected with Lipofectamine 2000 (Invitrogen, USA) following the manufacturer’s protocol.
CCK-8 analysis
Cells were seeded in 96-well plates at a density of 2000 cells/well and cultured in the appropriate medium 48 h after transfection. Numbers of viable cells were quantified using a cell counting kit-8 (CCK-8; Dojindo Molecular Technologies, Japan) at 24 h, 48 h, 72 h and 96 h. The absorbance was determined by TECAN infinite M200 plate reader at 450 nm. All experiments were performed in quintuplicate.
Colony formation assay
Cells were seeded into six-well plates at a density of 1000 cells/well in 2 ml culture medium and incubated at 37°C in a humidified atmosphere of 5% CO2. The cultured medium was replaced every the other day. On the 10th day, the medium was removed and the cells were washed twice with PBS. Finally, the cells were stained with crystal violet for 30 min at room temperature, washed again and photographed. All experiments were performed in triplicate.
Transwell assay
Transwell chambers (Millipore, USA) were used in the migration and invasion assays. In the migration assay, 100 μL serum-free medium and 1 × 10⁵ cells were added to the upper chamber, while 500 μL medium with 5% FBS was added to the lower chamber. In the invasion assay, matrigel (BD Biosciences, USA) was coated the top side of the insert membrane, then the cells and medium were added. The chambers were kept at 37°C and 5% CO2 for 24 h. After that, cells on the top side of the insert membrane were removed with the cotton swabs. Migrated or invaded cells on the bottom surface of the membrane were fixed in methanol for 15 min and stained with crystal violet for 30 min. Cells adhering to the bottom of the membrane were calculated and photographed by an inverted phase-contrast microscope. All experiments were performed in triplicate.
Scratch assay
Cells were seeded on six well plates with medium containing 10% FBS and grew to monolayer confluency. Each monolayer was scratched with a sterile pipette tip. The wound healing procedure was observed for 24 h, and images were photographed at 0 h and 24 h. All experiments were performed in triplicate.
Flow cytometry analysis
For cell cycle analysis, the cells were fixed in 75% ethanol overnight at 4°C. They were then stained by a Cell Cycle Analysis Kit (Beyotime Biotechnology, China), according to the manufacturer’s instructions. Cells were analyzed by Gallios Flow Cytometry (Beckman Coulter, USA) in order to calculate the proportion of cells in each stage of cell cycle (S, G1, G2/M).
For macrophage phenotyping, FITC-conjugated anti-mouse CD206 antibodies (MMR, #141704, Biolegend) were incubated with macrophages, followed by sorting with Gallios Flow Cytometry (Beckman Coulter, USA).
All experiments were performed independently three times.
Cytokine measurement
Twenty-four hours after transfection, supernatants from KTC-1 and K1 cell lines were assayed for levels of IL-4, IL-13 and VEGF using commercial enzyme-linked immunosorbent assay (ELISA) kits (1110402, 1110302 and 1117342 from Dakewe Biotech Co., Ltd.).
Western blot analysis
Protein lysates were generated using radioimmunoprecipitation assay lysis buffer (Thermo Fisher Scientific, Waltham, MA, USA); protein concentrations were determined using a BCA Protein Assay Kit (Pierce, Illinois, USA). Next, protein (10 mg) from each sample was loaded onto a 9% SDSPAGE gel and transferred to a PVDF membrane (Millipore, Billerica, MA, USA). After blocking with 5% nonfat milk, the membranes were incubated with primary antibodies against PTPRD (1:1000) and GAPDH (1:2000) (all from Abcam, Cambridge, MA, USA) and followed by secondary antibodies at room temperature for 1 h. Blots were processed using an ECL kit (Thermo Fisher Scientific, Waltham, MA, USA) and exposed to film.
Statistical analysis
Statistical analysis was carried out by SPSS 23.0 (SPSS, Chicago, IL, USA). Data were presented as mean. Two-tailed t-test was performed for comparing two groups. For CCK-8 test, ANOVA for repeated measurement followed by Bonferroni posttest was utilized. P < .05 was considered a statistically significant difference.
Supplementary Material
Acknowledgments
We express our gratitude for all involved in this study.
Funding Statement
The study was funded by the National Natural Science Foundation of China (81471668 and 81671688) and Medicine-Engineering Cooperation Program (YG2017QN56).
Authors’ Contributions
WWZ and LC designed the research; YHY, SJX, LZ and WHW performed experiments; YHY and SJX analyzed the data and wrote the manuscript.
Disclosure of Potential Conflicts of Interest
No potential conflicts of interest were disclosed.
Supplementary material
Supplemental data for this article can be accessed publisher’s website.
References
- 1.Lim H, Devesa SS, Sosa JA, Check D, Kitahara CM.. 2017. Trends in thyroid cancer incidence and mortality in the United States, 1974-2013. JAMA. 317:1338–1348. doi: 10.001/jama.2017.719. [DOI] [PMC free article] [PubMed] [Google Scholar]
- 2.Wang Y, Wang W. Increasing incidence of thyroid cancer in Shanghai, China, 1983-2007. Asia-Pac J Public Health. 2015;27:Np223–9. doi: 10.1177/1010539512436874. [DOI] [PubMed] [Google Scholar]
- 3.Kitahara CM, Sosa JA. The changing incidence of thyroid cancer. Nature Rev Endocrinol. 2016;12:646–653. doi: 10.1038/nrendo.2016.110. [DOI] [PMC free article] [PubMed] [Google Scholar]
- 4.Yang Y, Xia S, Ni X, Ni Z, Zhang L, Wang W, Kong Y, Wang Y, Ye L, Zhan W, et al. MiR-324-5p assists ultrasonography in predicting lymph node metastasis of unifocal papillary thyroid microcarcinoma without extracapsular spread. Oncotarget. 2017;8:83802–83816. eCollection 2017 Oct 13. doi: 10.18632/oncotarget.9717. [DOI] [PMC free article] [PubMed] [Google Scholar]
- 5.Chen Y, Wang SX, Mu R, Luo X, Liu ZS, Liang B, Zhuo H-L, Hao X-P, Wang Q, Fang D-F, et al. Dysregulation of the miR-324-5p-CUEDC2 axis leads to macrophage dysfunction and is associated with colon cancer. Cell Rep. 2014;7:1982–1993. doi: 10.1016/j.celrep.2014.05.007. [DOI] [PubMed] [Google Scholar]
- 6.Song L, Liu D, Zhao Y, He J, Kang H, Dai Z, Wang X, Zhang S, Zan Y. Sinomenine inhibits breast cancer cell invasion and migration by suppressing NF-kappaB activation mediated by IL-4/miR-324-5p/CUEDC2 axis. Biochem Biophys Res Commun. 2015;464:705–710. doi: 10.1016/j.bbrc.2015.07.004. [DOI] [PubMed] [Google Scholar]
- 7.Kuo WT, Yu SY, Li SC, Lam HC, Chang HT, Chen WS, Yeh C-Y, Hung S-F, LIU T-C, WU T, et al. MicroRNA-324 in human cancer: miR-324-5p and miR-324-3p have distinct biological functions in human cancer. Anticancer Res. 2016;36:5189–5196. doi: 10.21873/anticanres. [DOI] [PubMed] [Google Scholar]
- 8.Hui L, Chen Y. Tumor microenvironment: sanctuary of the devil. Cancer Lett. 2015;368:7–13. Epub Aug 11. doi: 10.1016/j.canlet.2015.07.039. [DOI] [PubMed] [Google Scholar]
- 9.Mantovani A, Sozzani S, Locati M, Allavena P, Sica A. Macrophage polarization: tumor-associated macrophages as a paradigm for polarized M2 mononuclear phagocytes. Trends Immunol. 2002;23:549–555. doi: 10.1016/S1471-4906(02)02302-5. [DOI] [PubMed] [Google Scholar]
- 10.Mantovani A, Sica A, Sozzani S, Allavena P, Vecchi A, Locati M. 2004. The chemokine system in diverse forms of macrophage activation and polarization. Trends Immunol. 25:677–686. doi: 10.1016/j.it.2004.09.015. [DOI] [PubMed] [Google Scholar]
- 11.Ryder M, Ghossein RA, Ricarte-Filho JC, Knauf JA, Fagin JA. Increased density of tumor-associated macrophages is associated with decreased survival in advanced thyroid cancer. Endocr Relat Cancer. 2008;15:1069–1074. Epub 2008 Aug 21. doi: 10.677/ERC-08-0036. [DOI] [PMC free article] [PubMed] [Google Scholar]
- 12.Qing W, Fang WY, Ye L, Shen LY, Zhang XF, Fei XC, Chen X, Wang W-Q, Li X-Y, Xiao J-C, et al. Density of tumor-associated macrophages correlates with lymph node metastasis in papillary thyroid carcinoma. Thyroid. 2012;22:905–910. doi: 10.1089/thy.2011.0452. [DOI] [PMC free article] [PubMed] [Google Scholar]
- 13.Yang JH, Li JH, Shao P, Zhou H, Chen YQ, Qu LH. starBase: a database for exploring microRNA-mRNA interaction maps from argonaute CLIP-seq and degradome-seq data. Nucleic Acids Res. 2011;39:D202–9. Epub 2010 Oct 30. doi: 10.1093/nar/gkq56. [DOI] [PMC free article] [PubMed] [Google Scholar]
- 14.Li JH, Liu S, Zhou H, Qu LH, Yang JH. starBase v2.0: decoding miRNA-ceRNA, miRNA-ncRNA and protein-RNA interaction networks from large-scale CLIP-Seq data. Nucleic Acids Res. 2014;42:D92–7. Epub 2013 Dec 1. doi: 10.1093/nar/gkt248. [DOI] [PMC free article] [PubMed] [Google Scholar]
- 15.Ortiz B, Fabius AW, Wu WH, Pedraza A, Brennan CW, Schultz N, Pitter KL, Bromberg JF, Huse JT, Holland EC, et al. Loss of the tyrosine phosphatase PTPRD leads to aberrant STAT3 activation and promotes gliomagenesis. Proc Natl Acad Sci USA. 2014;111:8149–8154. Epub 2014 May 19. doi: 10.1073/pnas.1401952111. [DOI] [PMC free article] [PubMed] [Google Scholar]
- 16.Martinez FO, Helming L, Gordon S. 2009. Alternative activation of macrophages: an immunologic functional perspective. Annu Rev Immunol. 27:451–483. doi: 10.1146/annurev.immunol.021908.132532. [DOI] [PubMed] [Google Scholar]
- 17.Gordon S. 2003. Alternative activation of macrophages. Nat Rev Immunol. 3:23–35. doi: 10.1038/nri978. [DOI] [PubMed] [Google Scholar]
- 18.Ambros V. The functions of animal microRNAs. Nature. 2004;431:350–355. doi: 10.1038/nature02871. [DOI] [PubMed] [Google Scholar]
- 19.Min Y, Ghose S, Boelte K, Li J, Yang L, Lin PC. C/EBP-delta regulates VEGF-C autocrine signaling in lymphangiogenesis and metastasis of lung cancer through HIF-1alpha. Oncogene. 2011;30:4901–4909. Epub Jun 13. doi: 10.1038/onc.2011.187. [DOI] [PMC free article] [PubMed] [Google Scholar]
- 20.Wang WJ, Li CF, Chu YY, Wang YH, Hour TC, Yen CJ, Chang W-C, Wang J-M. Inhibition of the EGFR/STAT3/CEBPD axis reverses cisplatin cross-resistance with paclitaxel in the urothelial carcinoma of the urinary bladder. Clin Cancer Res. 2017;23:503–513. Epub 2016 Jul 19. doi: 10.1158/078-0432.CCR-15-1169. [DOI] [PubMed] [Google Scholar]
- 21.Ko CY, Wang WL, Wang SM, Chu YY, Chang WC, Wang JM. Glycogen synthase kinase-3beta-mediated CCAAT/enhancer-binding protein delta phosphorylation in astrocytes promotes migration and activation of microglia/macrophages. Neurobiol Aging. 2014;35:24–34. Epub Aug 29. doi: 10.1016/j.neurobiolaging.2013.07.021. [DOI] [PubMed] [Google Scholar]
- 22.Albini A, Bertolini F, Bassani B, Bruno A, Gallo C, Caraffi SG, Maramotti S, Noonan DM. Biomarkers of cancer angioprevention for clinical studies. Ecancermedicalscience. 2015;9:600. eCollection. doi: 10.3332/ecancer.2015.600. [DOI] [PMC free article] [PubMed] [Google Scholar]
- 23.Noy R, Pollard JW. 2014. Tumor-associated macrophages: from mechanisms to therapy. Immunity. 41:49–61. doi: 10.1016/j.immuni.2014.06.010. [DOI] [PMC free article] [PubMed] [Google Scholar]
- 24.Enninga EAL, Chatzopoulos K, Butterfield JT, Sutor SL, Leontovich AA, Nevala WK, Flotte TJ, Markovic SN. CD206-positive myeloid cells bind galectin-9 and promote a tumor-supportive microenvironment. J Pathol. 2018;245:468–477. Epub 2018 Jun 28. doi: 10.1002/path.5093. [DOI] [PMC free article] [PubMed] [Google Scholar]
- 25.M R G, Fau R, Ricarte-Filho JCM, Ricarte-Filho JF, Knauf JA, Knauf JF, Fagin JA. Increased density of tumor-associated macrophages is associated with decreased survival in advanced thyroid cancer. Endocr Relat Cancer. 2008;15:1069–1074. doi: 10.1677/ERC-08-0036. [DOI] [PMC free article] [PubMed] [Google Scholar]
- 26.Cho JW, Kim WW, Lee YM, Jeon MJ, Kim WG, Song DE, Park Y, Chung K-W, Hong SJ, Sung T-Y, et al. Impact of tumor-associated macrophages and BRAF(V600E) mutation on clinical outcomes in patients with various thyroid cancers. Head Neck. 2019;41:686–691. Epub 2019 Jan 19. doi: 10.1002/hed.25469. [DOI] [PubMed] [Google Scholar]
- 27.Almeida PE, Carneiro AB, Ar S, Bozza PT. PPARgamma expression and function in mycobacterial infection: roles in lipid metabolism, immunity, and bacterial killing. PPAR Res. 2012;2012:383829. Epub 2012 Jul 17. doi: 10.1155/2012/383829. [DOI] [PMC free article] [PubMed] [Google Scholar]
- 28.Huang JT, Welch JS, Ricote M, Binder CJ, Willson TM, Kelly C, Witztum JL, Funk CD, Conrad D, Glass CK, et al. 1999. Interleukin-4-dependent production of PPAR-gamma ligands in macrophages by 12/15-lipoxygenase. Nature. 400:378–382. doi: 10.1038/22572. [DOI] [PubMed] [Google Scholar]
- 29.Szanto A, Balint BL, Nagy ZS, Barta E, Dezso B, Pap A, Szeles L, Poliska S, Oros M, Evans RM, et al. 2010. STAT6 transcription factor is a facilitator of the nuclear receptor PPARgamma-regulated gene expression in macrophages and dendritic cells. Immunity. 33:699–712. doi: 10.1016/j.immuni.2010.11.009. [DOI] [PMC free article] [PubMed] [Google Scholar]
- 30.Wood WM, Sharma V, Bauerle KT, Pike LA, Zhou Q, Fretwell DL, Schweppe RE, Haugen BR. PPARgamma Promotes Growth and Invasion of Thyroid Cancer Cells. PPAR Res. 2011;2011:171765. Epub 2011 Dec 12. doi: 10.1155/2011/171765. [DOI] [PMC free article] [PubMed] [Google Scholar]
- 31.Ohta K, Endo T, Haraguchi K, Hershman JM, Onaya T. 2001. Ligands for peroxisome proliferator-activated receptor gamma inhibit growth and induce apoptosis of human papillary thyroid carcinoma cells. J Clin Endocrinol Metab. 86:2170–2177. doi: 10.1210/jcem.86.5.7493. [DOI] [PubMed] [Google Scholar]
- 32.Yu J, Koenig RJ. 2018. Thyroid-specific PPARgamma deletion is benign in the mouse. Endocrinology. 159:1463–1468. doi: 10.210/en.2017-03163. [DOI] [PMC free article] [PubMed] [Google Scholar]
Associated Data
This section collects any data citations, data availability statements, or supplementary materials included in this article.


