

ABSTRACT
Circadian rhythm is essential for cellular regulation of physiological, metabolic, and immune functions. Perturbations of circadian rhythms have been correlated with increased susceptibility to cancer and poor prognosis in the cancer treatment. Our aim is to investigate the role of doxorubicin (DOX) treatment on clock genes expression and inflammation in intraperitoneal macrophages and the antitumoral response. Methods: Macrophages were extracted from intraperitoneal cavity of mice without or with Lewis lung carcinoma (LLC) and treated with DOX totaling four groups (CTL, LLC, LLC+DOX and DOX) and analyzes of clock genes in six time points (ZT02, ZT06, ZT10, ZT14, ZT18 AND ZT22). Intraperitoneal macrophages cell culture was stimulated with LPS and DOX and clock genes and inflammatory profile were analyzed. In tumor were analyzed macrophages markers. Results: The expression of F4/80 (ZT22) and CD11c (ZT06) tumor tissue was significantly differed between LLC and LCC+DOX groups. In the intraperitoneal macrophages, DOX increased Clock (ZT10), Rev-Erbα (ZT18 and ZT22) and Per2 expressions (ZT18); in the LLC+DOX group was increased Bmal1 (ZT10), Per2 (ZT18) and NF-kB (ZT22) expressions; IL-6 expression increased in the LCC group (ZT02). In intraperitoneal macrophages cell culture stimulated with DOX and LPS after 24 h decreased Clock and Per1. DOX causes depression after 6 and 24 h in TNF-α content and Per2 gene expression after 24 h IL-1β expression was reduced also. Conclusion: DOX treatment in vivo disrupted cytokine and clock genes expression in intraperitoneal macrophages suppressing immune response. Moreover, macrophages cultured with DOX had decreased expression of LPS-stimulated inflammatory cytokines.
KEYWORDS: Immune cell, circadian rhythms, chemotherapy, cancer, cytokines
Introduction
Cancer is a chronic disease promoted by uncontrolled cell proliferation that is often fatal.1 In the etiology of cancer, a cell type presents marked genomic instability leading to the formation of clones with a high degree of heterogeneity which generates an environment rich in several growth and chemoattraction factors that recruits different type cells. Thus, the tumor and surroundings can be considered a highly complex organ.1 Within this complexity, immune cells have an important role in recognition, death, or maintenance of tumor.
Macrophages are plastic immune cells that may be residents or derived from circulating monocytes and play an ambiguous role in cancer.2 Macrophages have the potential to kill tumor cells yet are also associated with sustained proliferative signals and tumor immune evasion by the production of growth factors and anti-inflammatory cytokines.3 There is evidence that clock genes regulate the inflammatory response in macrophages, in particular, via the anti-inflammatory role of BMAL-1 (brain and muscle Arnt-like protein 1) and pro-inflammatory activation by CLOCK (circadian locomotor output cycles kaput).4–6
Circadian rhythms are biological pulses that fluctuate around 24 h and can be biochemical, physiological, or behavioral events required to regulate the cell cycle.7The mechanism underlying circadian rhythmicity is composed by a set of interlocking transcription/translation feedback loops that results in cascades of gene expression within 24 h.8 In the core of this mechanism in mammals is the heterodimeric transcription factor complex of Clock and Bmal1. These proteins activate the transcription of the Period (Per) genes and Cryptochrome (Cry) genes via E-box enhancer elements in their promoters.9
Changes in circadian rhythms have been correlated with increased susceptibility to cancer and poor prognosis in humans.10–14 The expression of Per family genes is deregulated in breast cancer cells;10 however, Per1 and Per2 appear to function as tumor suppressors in mice.12 Moreover, Per2 acts as a liver tumor suppressor from initiation to progression,15 whereas its expression in cancer cell lines results in inhibition of cell growth, cell cycle arrest, and apoptosis.11 It is interesting to note that levels of Per2 mRNA are down regulated in various human lymphoma cell lines and tumor cells of patients with myeloid leukemia.11 The overexpression of Per1 can also suppress growth of human cancer cell lines. In addition, Per1 mRNA levels are down regulated in lung cancer compared to the corresponding normal tissues.12 These results point directly to a link between circadian rhythm disorders and cancer,13 even though the pattern that may explain this link is not clear.
Recently, the role of chemotherapeutic drugs such as 5-fluorouracil and adriamycin was investigated in modulation of the immune response in tumor-associated macrophages (increased in M1 or classically activated) with increased anti-tumoral ability.16 Doxorubicin (DOX) is an anthracycline developed from a metabolite of the bacterium Streptomyces peucetius var. Caesius.17 This drug is widely used for the treatment of solid tumors18 and is effective against tumor cells, but toxic to healthy tissues. Patients receiving chemotherapy commonly present sleeping disorders19 and alteration in circadian rhythms. Thus, our aim is to investigate the role of DOX treatment in clock gene expression in intraperitoneal macrophages and the correlation between clock genes and inflammation in macrophages and the antitumoral response.
From the data obtained, we characterized the perturbation of the circadian rhythm by DOX treatment (intraperitoneal application of DOX [2.5 mg/kg], twice a week, for 2 weeks). Moreover, we verified macrophage markers in tumors and then analyzed possible alterations of clock gene expression and cytokine expression in the intraperitoneal macrophages. Finally, we analyzed the relationship between clocks genes and inflammation in primary culture cell of intraperitoneal macrophages treated with DOX.
Methods
Animal procedure
Male C57BL/6J mice were maintained in a room with a light-dark cycle of 12 h (light cycle: zeitgeber (ZT) 0–12, dark cycle: ZT 12–24) and a temperature of 23±2°C under normal diet (Nuvital ration of Nuvilab, Colombo, PR) and water ad libitum. The mice started treatment at 8 to 10 weeks of age. All study procedures followed the ethical principles of animal experimentation and were submitted and approved by the Ethics Committee on Animal Experimentation of the University of São Paulo registered under n° 4541221117.
The mice were divided into four groups: control (CTL), tumor (LLC), tumor + doxorubicin (LLC+DOX), and doxorubicin (DOX). Mice were inoculated subcutaneously with Lewis lung carcinoma (LLC and LLC+DOX groups). After 7 days of tumor inoculation, the animals were submitted to doxorubicin chemotherapy (LLC+DOX and DOX groups) (2.5mg/kg body weight intraperitoneally). In order to analyze whether there were circadian changes promoted by the tumor and/or Doxorubicin, animals were euthanized every 4 h, until completing 24 h, with euthanasia at 8 o’clock (Zeitberg, ZT 02), 12 o’clock (ZT 06), 16 o’clock (ZT 10), 20 o’clock (ZT 14), 24 o’clock (ZT 18), and 4 o’clock (ZT 22).
Subcutaneous implantation of tumor cells
Lewis lung carcinoma cells were maintained in Dulbecco’s modified Eagle’s medium (DMEM, GIBCO, Invitrogen, NY) supplemented with penicillin (100U/ml), streptomycin (100μg/ml), and 10% fetal bovine serum (Atlanta Biological, Lawrenceville). Cells were cultured and maintained in tissue culture flasks at 37°C in a humidified atmosphere containing 5% CO2. 5 × 10⁵ viable cells were injected subcutaneously into the right flank of the mice (diluted in 0.9%saline). Control animals received the same volume of saline at 0.9%. Cell viability was assessed by Trypan Blue.
Body composition, weight gain, and tissue weight
Weight was monitored throughout the treatment. In the end, the following parameters were measured: wet weight of the soleus, gastrocnemius, and extensor digitorum longus (EDL) muscle, and weight of retroperitoneal, epididymal, and subcutaneous adipose. For the determination of the adiposity index and learn mass index, the sum of the adipose retroperitoneal, epididymal, and subcutaneous adipose and soleus, gastrocnemius, and EDL muscles were used.
Enzyme-linked immunosorbent assay (ELISA)
Tumor tissue samples (80–100 mg) were carefully homogenized in RIPA buffer (0.625% Nonidet P-40, 0.625% sodium deoxycholate, 6.25 mM sodium phosphate, and 1mM EDTA at pH 7.4) containing 10μg/ml of protease inhibitor cocktail (Sigma-Aldrich®, St. Louis, Missouri, USA). The supernatant of the homogenate was utilized to measure total protein concentration via a Bradford assay (Bio-Rad®, Hercules, CA, USA) and to determine the expression of IL-6, MCP-1, IL-10, and VEGF by ELISA (DuoSet ELISA®, R&D Systems, Minneapolis, MN, USA).
RNA isolation, reverse transcription, and real-time PCR
The expression of tumor and macrophage genes related to circadian rhythms was assessed by qRT-PCR with SYBR Green. Total RNA was extracted as described by Chomczynski and Sacchi 1987,20 quantified in a spectrophotometer (260 nm), and cDNA was synthesized from the total RNA using reverse transcriptase. The sequences of the primers are shown in Supplementary Table 1.Gene expression was quantified by the comparative method using the expression of GAPDH as a standard.21
Table 1.
Correlation of LLC (A) and LLC+DOX (B) groups between tumor weight and clock genes expression.
| (A) Correlation of LLC group between the tumor weight and clock genes expression |
(B) Correlation of LLC+DOX group between the tumor weight and clock genes expression |
||||
|---|---|---|---|---|---|
| R | P ≤ | R | P ≤ | ||
| Clock | −0.6052 | 0.0017** | Clock | −0.2221 | 0.3333 |
| Bmal1 | −0.5555 | 0.0039** | Bmal1 | −0.1348 | 0.5497 |
| Per1 | 0.5071 | 0.0096** | Per1 | −0.0077 | 0.9728 |
| Per2 | −0.3031 | 0.1409 | Per2 | −0.3288 | 0.1352 |
| Cry1 | −0.5940 | 0.0017** | Cry1 | −0.0997 | 0.6588 |
| Cry2 | −0.3863 | 0.0565 | Cry2 | −0.2996 | 0.1756 |
| Rev-erb-α | 0.4333 | 0.0304* | Rev-erb-α | 0.0037 | 0.9870 |
| Rev-erb-β | 0.6445 | 0.0005** | Rev-erb-β | 0.0078 | 0.9726 |
Correlation of tumor weight and clock genes with the group without treatment doxorubicin (table A) and with treatment doxorubicin (table B). Pearson correlation coefficients were used (*p < 0.05 and **p < 0.01).
Cell viability (MTT)
After the stimulation period, macrophages were incubated with MTT (bromide 3-(4,5-dimethylthiazol-2-il)-2,5-diphenyltetrazolium) solution (0.5 mg/ml) for 4 h. The formazan formed was resuspended with isopropanol/HCl (11 M) and the absorbance measured (595 nm) was utilized to calculate the cell viability in relation to the absorbance of the control group (100%). Cells were treated with 0.5 μM of doxorubicin.
Extraction and culture of intraperitoneal macrophages
Macrophages were extracted from the intraperitoneal cavity of C57BL6 mice with RPMI medium and counted in a hemocytometer using the Trypan Blue exclusion method. 2.5 × 10⁵/cm2 viable macrophages were plated, and after 2 h macrophages were collected for further analysis.
The macrophages were also extracted from the intraperitoneal cavity of C57BL6 mice without tumors with RPMI medium and counted in a hemocytometer using the TRIPAN Blue exclusion method. 2.5 × 10⁵/cm2 viable macrophages were exposed to PBS (control) or LPS (2.5 µg/ml, E. coli O111:B4) DMSO, or doxorubicin (0.5 µM). After 2, 6, and 24 h, the medium and macrophages were collected for further analysis.
Statistical methods
Normal distribution and variance homogeneity were tested, and the appropriate statistical test (two-way ANOVA) was employed. Statistical analysis was performed with the program GraphPad Prism 6.0, with significance being <5% (p < .05). Data are expressed as means±standard error of the mean.
Results
Doxorubicin induced weight loss regardless of tumor presence
Doxorubicin induced weight loss, with reduction on adipose and skeletal muscle mass, regardless of tumor presence. LLC mice did not show a reduction in these parameters 21 days after the inoculation. The tumor was significantly reduced by doxorubicin administration (Figure 1).
Figure 1.

Initial body weight (a), Final body weight (b) and Weight tumor (c). The tumor was inoculated into mice of the C57BL/6J background between 8 and 10 weeks old. After 7 days of tumor inoculation began treatment with doxorubicin (2.5 mg/kg twice weekly intraperitoneal). Data represent mean ± standard error of the mean of 22 to 26 animals per group. *p < 0.05, **p < 0.01 e ***p < 0.001 (Anova one way seguido por Tukey).
Correlation between tumor weight and clock genes expression
LCC group showed correlation between tumor weight and clock genes, CLOCK, BMAL-1 and CRY 1 showed negative correlation with tumor weight and PER-1, Rev-erb-α and Rev-erb-β showed positive correlation. Besides, the group treated with DOX did not showed correlation (Table 1).
M1 marker is highly expressed in DOX-treated tumor at 6 h
We observed that the expression of F4/80 did not differ between LLC and LLC+DOX groups during the light period (ZT 02, 06 and 10) but significantly differed at the end of the dark period (Figure 2a). CD11c expression significantly differed between the groups only during the middle of the light period (Figure 2b). We did not observe any difference in CD206 expression between the groups within the period (Figure 3c).
Figure 2.
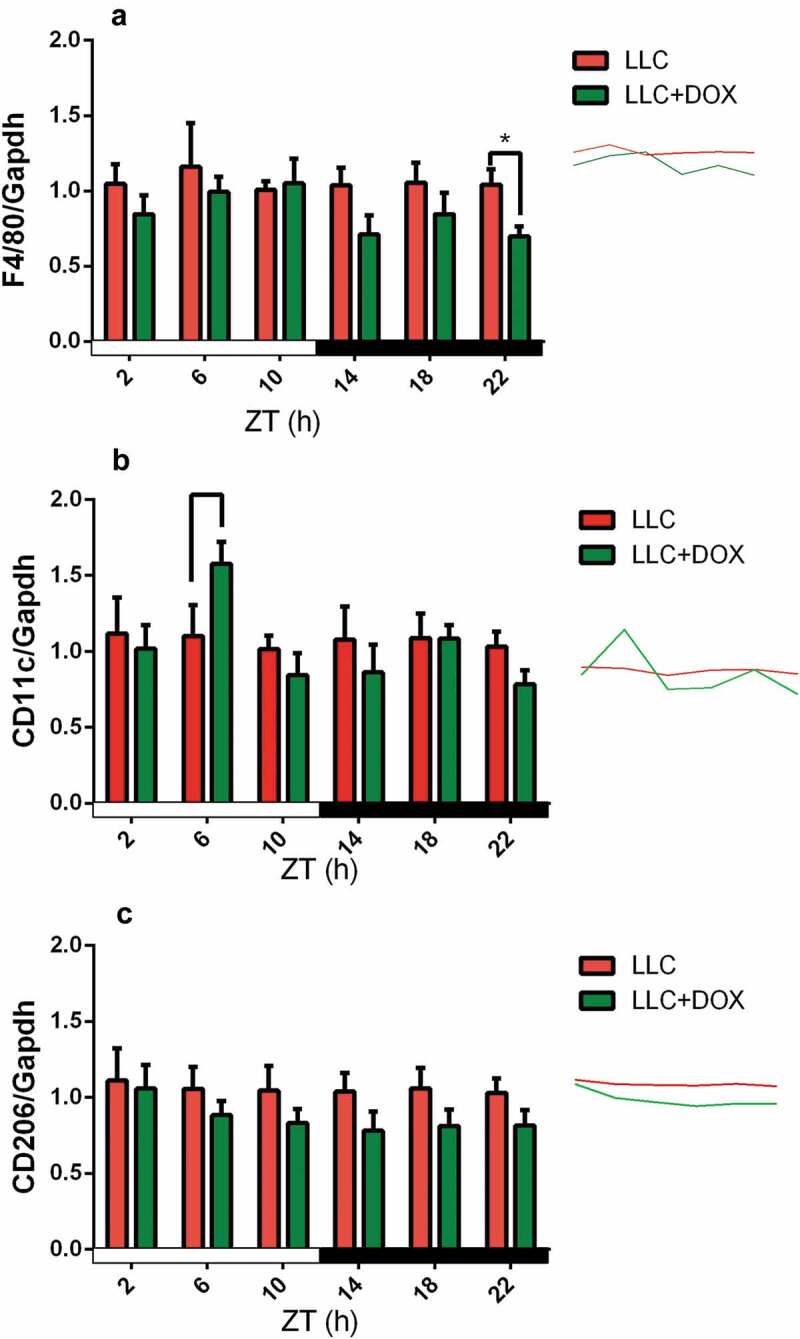
Gene Expression of F4/80 (a), CD11c (b) and CD206 (c) follows circadian rhythms in Tumor Tissue.
The tumor was inoculated into mice of the C57BL/6J background between 8 and 10 weeks of age. After 7 days, treatment with doxorubicin began (2.5 mg/kg twice weekly intraperitoneal). Data represent means ± standard error of the mean of 4 to 6 animals per group. *p < .05, **p < .01, and ***p < .001 (two-way ANOVA followed by Tukey’s posttest).
Figure 3.

Gene expression of CLOCK AND Bmal1 follows circadian rhythms in intraperitoneal macrophages.
The tumor was inoculated into mice of the C57BL/6J background between 8 and 10 weeks of age. After 7 days, treatment with doxorubicin began (2.5 mg/kg twice weekly intraperitoneal). Data represent means ± standard error of the mean of 4 to 6 animals per group. *p < .05, **p < .01, and ***p < .001 (two-way ANOVA followed by Tukey’s posttest).
Expression of the clock genes in intraperitoneal macrophages
Clock gene expression was discrete in the light period in the CTL, LLC, and LLC+DOX groups, with a great increase in the DOX group at the end light period (ZT 10). During the dark period, the expression of Clock continued low, increasing only at the last time point for all groups (Figure 3a). Bmal1 gene expression increased at the end of the light and dark periods in the LLC+DOX group (ZT 10 and 22). At the others ZTs, there was no difference in Bmal1 expression among the groups (Figure 3b).
The Per1 gene showed no change among the groups at any time (Figure 4a). Per2 gene expression increased at the beginning of the light period in the LCC group when compared with control. In the dark period, Per2 expression increased first in the LCC+DOX group (ZT14) and then in the LCC+DOX and DOX groups (ZT18) (Figure 4b). Per3 gene expression was only altered at the beginning of the dark period, in which there was an increase in Per3 expression for the CTL group when compared with the LLC+DOX group (Figure 4c).
Figure 4.

Gene expression of Per1 (a) Per 2 (b) and Per 3 (c) follows circadian rhythms in intraperitoneal macrophages.
The tumor was inoculated into mice of the C57BL/6J background between 8 and 10 weeks of age. After 7 days, treatment with doxorubicin began (2.5 mg/kg twice weekly intraperitoneal). Data represent means ± standard error of the mean of 4 to 6 animals per group. *p < .05, **p < .01, and ***p < .001 (two-way ANOVA followed by Tukey’s posttest).
Cry1 gene expression increased at the end of the light period for CTL, LLC, and DOX, and this increase was not observed in the LLC+DOX group (Figure 5a). Cry2 expression changed over time, but no differences were observed among the groups (Figure 5b).
Figure 5.

Gene expression of Cry1 (a) Cry2 (b) follows circadian rhythms in intraperitoneal macrophages.
The tumor was inoculated into mice of the C57BL/6J background between 8 and 10 weeks of age. After 7 days, treatment with doxorubicin began (2.5 mg/kg twice weekly intraperitoneal). Data represent means ± standard error of the mean of 4 to 6 animals per group. *p < .05, **p < .01, and ***p < .001 (two-way ANOVA followed by Tukey’s posttest).
Rev-Erbα interestingly showed increase in gene expression in the groups treated with doxorubicin in the middle and at the end of the dark period (Figure 6a). Rev-Erbβ expression increased in the CLT group at the beginning of the light period (Figure 6b).
Figure 6.

Gene expression of Rev-Erbα (a) Rev-Erbβ (b) follows circadian rhythms in intraperitoneal macrophages.
The tumor was inoculated into mice of the C57BL/6J background between 8 and10 weeks of age. After 7 days, treatment with doxorubicin began (2.5 mg/kg twice weekly intraperitoneal). Data represent means ± standard error of the mean of 4 to 6 animals per group. *p < .05, **p < .01, and ***p < .001 (two-way ANOVA followed by Tukey’s posttest).
Gene expression of NF-kB, IL-6, and IL-10 follows circadian rhythms in intraperitoneal macrophages
Gene expression of NF-kB increased at the end of dark period in the LLC+DOX group (Figure 7a). IL-6 expression increased in the LCC group at the beginning of the light period (Figure 7b). IL-10 expression was similar to NF-kB expression and increased only in the LLC+DOX group at the end of the dark period (Figure 7c).
Figure 7.

Gene expression of Nf-kB (a) IL-6 (b) IL-10 (c) follows circadian rhythms in intraperitoneal macrophages.
The tumor was inoculated into mice of the C57BL/6J background between 8 and10 weeks of age. After 7 days, treatment with doxorubicin began (2.5 mg/kg twice weekly intraperitoneal). Data represent means ± standard error of the mean of 4 to 6 animals per group. *p < .05, **p < .01, and ***p < .001 (two-way ANOVA followed by Tukey’s posttest).
Clock gene expression and MCP-1, TNF-α, il-1β, IL-6, and IL-10 protein expression in primary intraperitoneal macrophage cultures
Primary intraperitoneal macrophages were cultured stimulated with doxorubicin and LPS. These macrophages were collected after 2, 6, and 24 h to analyze the clock gene expression and MCP-1, TNF-α, IL-1β, IL-6, and IL-10 protein expression.
No differences was found in Clock and Per1 gene expression after 2 and 6 h of stimulus but after 24 h was observed a decrease of these genes in the DOX+LPS group (Figure8 A and B). Doxorubicin has been shown to lead a decrease in Per2 gene expression after 6 and 24 h (Figure 8c). The Per3 gene was affected by LPS after 24 h (Figure 8d).
Figure 8.

CLOCK Gene Expression in intraperitoneal macrophages comparing the circadian rhythm at each time between the groups (a) comparing the circadian rhythm of intra-group (b). Per1 Gene Expression in intraperitoneal macrophages comparing the circadian rhythm at each time between the groups (c) comparing the circadian rhythm of intra-group (d). Per2 Gene Expression in intraperitoneal macrophages comparing the circadian rhythm at each time between the groups (e) comparing the circadian rhythm of intra-group (f). Cry2 Gene Expression in intraperitoneal macrophages comparing the circadian rhythm at each time between the groups (g) comparing the circadian rhythm of intra-group (h).
2.5x10⁵/cm2 viable macrophages were exposed to PBS (control) or LPS (2.5 µg/mL, E. coli O111:B4) DMSO or doxorubicin (0.5 µM). After 2 h, 6 h and 24 h the macrophages were collected for further analysis. Data represent mean ± standard error of the mean of 4 to 6 animals per group. *p < 0.05, **p < 0.01 e ***p < 0.001 (Anova two-way seguido por Tukey).
After 24 h, doxorubicin increased Cry1 gene expression (Figure 8e). The expression of Cry2, Rev-Erbα, and Rev-Erbβ genes did not differ among the groups (figure 8f, G, and H). We showed that doxorubicin causes an immunodepression after 6 and 24 h in TNF-α expression and after 24 h in IL-1β expression (Figure 9).
Figure 9.
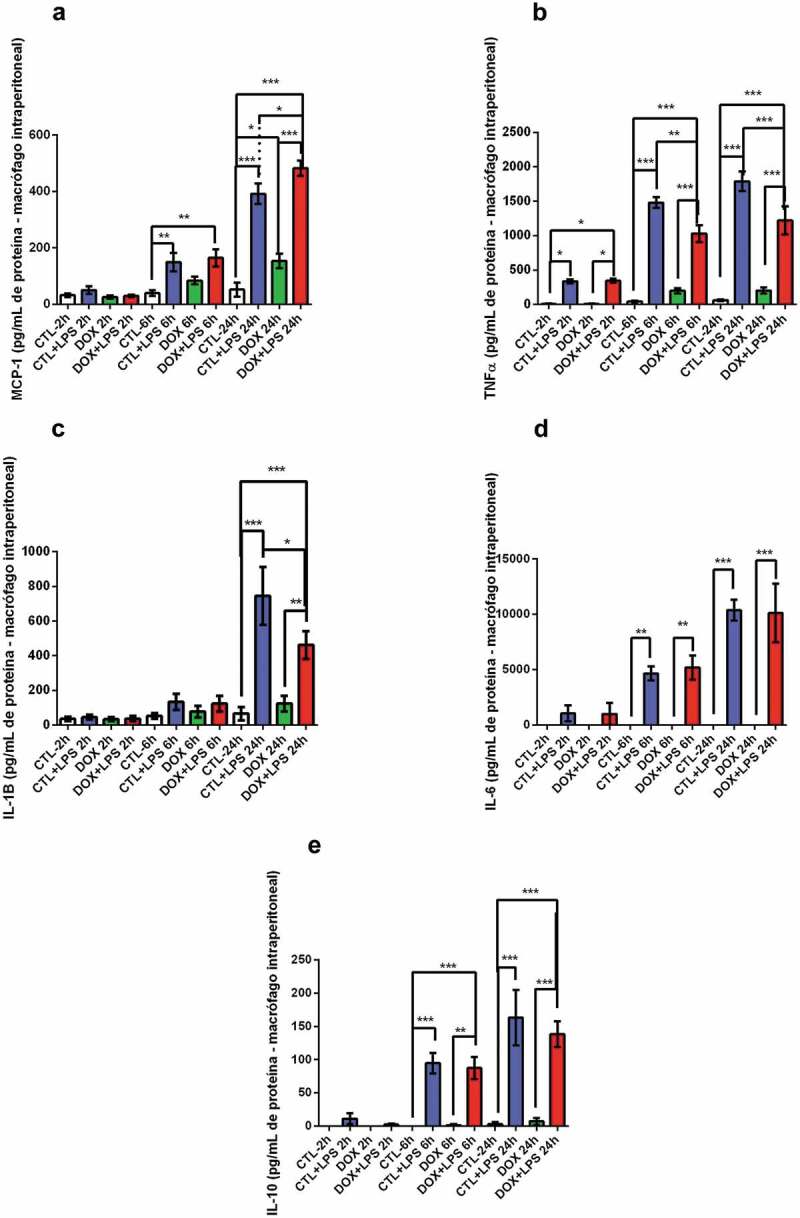
MCP-1 (a), TNF-α (b), IL-1β (c), IL-6 (d) and IL-10 (10) protein expression in intraperitoneal macrophages.
2.5x10⁵/cm2 viable macrophages were exposed to PBS (control) or LPS (2.5 µg/mL, E. coli O111:B4) DMSO or doxorubicin (0.5 µM). After 2 h, 6 h and 24 h the culture medium was collected for further analysis. Data represent mean ± standard error of the mean of 4 to 6 animals per group. *p < 0.05, **p < 0.01 e ***p < 0.001 (Anova two-way seguido por Tukey).
Discussion
Chemotherapy treatment reduced body weight regardless the presence of the tumor yet can also reduce the tumor mass in LLC tumor-bearing mice. The tumor weight presented a correlation with clock genes expression in tumor tissue of the LLC group. The group treated with doxorubicin did not show correlation with tumor weight and clock genes expression, besides that, it had a shorter survival, although this group did not show statistically significant differences in the expression of the clock genes in the tumor, there is a clear relationship between the expression of the clock genes and tumor weight. We suggest this relation between clock genes, tumor weight and tumor staging should be clarified in clinical practice.
The tumor tissue showed circadian alteration in the expression of macrophage surface markers as a reduction of F4/80 at the end of the dark period (ZT 22) and increased CD11c in the middle of the light period (ZT 6). Moreover, the mRNA levels of IL-10 and IL-6 were altered by chemotherapy in peritoneal macrophages. The clock genes are deep modified in the circadian expression of these macrophages. In culture, doxorubicin inhibits cytokine secretion after LPS stimulation in peritoneal macrophages and the expression of clock genes are also altered.
Macrophages have a dual role in immunity against tumor cells. The tumor-associated macrophages (TAM) can help the tumor sustain growth and evade or induce tumor suppression. The immunometabolic signature of the TAMs determines this process. In breast cancer, the presence of M2 is associated with a great reduction in the efficacy of doxorubicin response.22 Moreover, triple-negative breast cancer is characterized by a high proportion of TAM leading to reduced chemotherapy efficacy.
In our model, doxorubicin treatment was efficient in alteration the proportion of M1 macrophages observed in the LLC tumor, by increasing CD11c mRNA expression. Thus, increased immune cells surveillance can be associated with the reduction of tumor growth. Doxorubicin has been shown to reduce the myeloid-derived suppressor cells and consequently increase effective T lymphocytes.16,23 Furthermore, the induction of ATP levels caused by doxorubicin induces the chemoattraction of myeloid cells and differentiation of the myeloid cells in antigen-presenting cells.24
This increase in CD11c and F4/80 mRNA in the tumors of doxorubicin-treated mice shows the increased chemotaxis ratio of monocytes and differentiated in macrophages in tumor microenvironment.25 This could explain the difference between the response of TAMs and intraperitoneal macrophage in the mice treated with doxorubicin. Was observed an increase in IL-6 mRNA in tumor-bearing mice, with a reduction in mice treated with DOX in intraperitoneal macrophages. Moreover, tumor-bearing mice treated with DOX showed increased IL-10 mRNA expression in intraperitoneal macrophages. The increase in IL-10 is observed in M2 macrophages polarization.26However, the concomitant increase in NF-kB and IL-10 mRNA indicate an increased TLR response. The activation of TLR response in macrophages induces the ERK and MAPkinase pathways, and these routes lead to increased NF-kB and IL-10 mRNA. Moreover, the induction of NF-kB is a positive signal for IL-10 or IL-10 transcription. Thus, these results show an elevation of TLR downstream signaling.27 Furthermore, the intraperitoneal macrophages stimulated by LPS and treated with DOX showed the inhibition in TNF-α and IL-1β cytokines production and released after 24 h of LPS stimulation.
The effect of doxorubicin on immune cells stimulated with LPS is controversial. The increased ROS production in bone marrow-derived monocytes stimulated with LPS induced a robust increase in the inflammasome pathway.28 Conversely, Asmis et al. 2006 showed that mice treated with Dox had reduced resident intraperitoneal macrophages associated with a reduction in cytokine production.29 Our results show that incubation with a non-lethal dosage of DOX in intraperitoneal macrophages reduced cytokine production.
Finally, the mRNA expression of clock genes was deregulated in macrophages. The immune response and cytokine production in immune cells are influenced by clock gene expression. The CLOCK, BMAL-1, and Rev ErB family are the main clock genes related to the immune response.30
CLOCK is required for the transactivation of NF-kB by of the p65 isoform acetylation; thus the activation of CLOCK is important for stabilization of binding between NF-kB and a promoter region.6 Since BMAL-1 dimerizes with CLOCK and impairs the cross-activation of NF-kB, BAML-1 has anti-inflammatory effects.4 Intraperitoneal macrophages that did not express BMAL-1 showed increased cytokine production after LPS stimulation in comparison with wild type. Oishi et al. 2017 showed that the deletion of BMAL allowed higher acetylation of NF-kB, which resulted in higher production of pro-inflammatory cytokines together with the reduction in ReV-Erb, which realized a positive feedback loop with BMAL-1.31
Interestingly, our results showed higher expression of NF-kB in intraperitoneal macrophages in ZT22 in the LLC+DOX group, but in the same ZT, IL-10 expression increased in LLC+DOX. BMAL-1 and ReVErb alpha also presented higher expression. Elevation in the clock genes could explain the anti-inflammatory effects of doxorubicin treatment. Moreover, the treatment with DOX in intraperitoneal macrophages showed reduced IL-1b and TNF-α associated with the reduction of mRNA expression of CLOCK 24 h after the LPS stimulation.
Recently, Korkmaz et al. 2018 showed that the deletion of BMAL-1 in a breast cancer tumor cell line induces the apoptosis by doxorubicin. Thus, the deletion of BMAL-1 presented an anticancer effect, yet this modified cell line showed increased invasion properties.32 Few studies established the relationship between the molecular clock genes and tumors. BMAL-1 KO mice showed increased tumor burden in a pulmonary tumor model.33 Furthermore, the CLOCK or BMAL-1 deletion induced early aging phenotypes.34
Thus, we conclude that the doxorubicin treatment in vivo disrupts cytokine expression and clock genes expression in intraperitoneal macrophages to suppress the immune response. Moreover, the LPS-stimulated macrophages cultured with DOX had decreased expression of inflammatory cytokines. The LLC tumor only did not disrupt circadian rhythms in macrophages.
Supplementary Material
Acknowledgments
To the funding sources, Fundação de Amparo à Pesquisa do Estado de São Paulo (FAPESP, Brazil) and the Coordenação de Aperfeiçoamento de Pessoal de Nível Superior (CAPES, Brazil).
Funding Statement
This work was supported by the Fundação de Amparo à Pesquisa do Estado de São Paulo (FAPESP, Brazil) and the Coordenação de Aperfeiçoamento de Pessoal de Nível Superior (CAPES, Brazil) FAPESP [2015/16777-0]; FAPESP [2016/01409-8]; FAPESP [2018/24187-8]. FAPESP [2019/09854-9]
Disclosure of potential conflicts of interest
The authors declare that there is no conflict of interests regarding the publication of this paper.
Supplementary Material
Supplemental data for this article can be accessed on the publisher’s website.
References
- 1.Hanahan D, Weinberg RA.. Hallmarks of cancer: the next generation. Cell. [Internet] 2011; 144:646–674. Available from: http://www.ncbi.nlm.nih.gov/entrez/query.fcgi?cmd=Retrieve&db=PubMed&dopt=Citation&list_uids=21376230 doi: 10.1016/j.cell.2011.02.013. [DOI] [PubMed] [Google Scholar]
- 2.Mantovani A, Locati M.. Tumor-associated macrophages as a paradigm of macrophage plasticity, diversity, and polarization: lessons and open questions. Arter Thromb Vasc Biol. [Internet] 2013; 33:1478–1483. Available from. ;:. http://www.ncbi.nlm.nih.gov/entrez/query.fcgi?cmd=Retrieve&db=PubMed&dopt=Citation&list_uids=23766387 doi: 10.1161/ATVBAHA.113.300168. [DOI] [PubMed] [Google Scholar]
- 3.Bonavita E, Galdiero MR, Jaillon S, Mantovani A.. Phagocytes as corrupted policemen in cancer-related inflammation. Adv Cancer Res. [Internet] 2015; 128:141–171. Available from: http://www.ncbi.nlm.nih.gov/entrez/query.fcgi?cmd=Retrieve&db=PubMed&dopt=Citation&list_uids=26216632 [DOI] [PubMed] [Google Scholar]
- 4.Curtis AM, Fagundes CT, Yang G, Palsson-McDermott EM, Wochal P, McGettrick AF, Foley NH, Early JO, Chen L, Zhang H, et al. Circadian control of innate immunity in macrophages by miR-155 targeting Bmal1. Proc Natl Acad Sci U S A. [Internet] 2015; 112:7231–7236. Available from: http://www.ncbi.nlm.nih.gov/entrez/query.fcgi?cmd=Retrieve&db=PubMed&dopt=Citation&list_uids=25995365 doi: 10.1073/pnas.1501327112. [DOI] [PMC free article] [PubMed] [Google Scholar]
- 5.Early JO, Curtis AM. Immunometabolism: is it under the eye of the clock? Semin Immunol. [Internet] 2016; 28:478–490. Available from: http://www.ncbi.nlm.nih.gov/entrez/query.fcgi?cmd=Retrieve&db=PubMed&dopt=Citation&list_uids=27884543 doi: 10.1016/j.smim.2016.10.006. [DOI] [PubMed] [Google Scholar]
- 6.Spengler ML, Kuropatwinski KK, Comas M, Gasparian AV, Fedtsova N, Gleiberman AS, Gitlin II, Artemicheva NM, Deluca KA, Gudkov AV, et al. Core circadian protein CLOCK is a positive regulator of NF-kappaB-mediated transcription. Proc Natl Acad Sci U S A. [Internet] 2012; 109:E2457–65. Available from: http://www.ncbi.nlm.nih.gov/entrez/query.fcgi?cmd=Retrieve&db=PubMed&dopt=Citation&list_uids=22895791 doi: 10.1073/pnas.1206274109. [DOI] [PMC free article] [PubMed] [Google Scholar]
- 7.Stevens RG. Circadian disruption and breast cancer: from melatonin to clock genes. Epidemiology. [Internet] 2005; 16:254–258. Available from: http://www.ncbi.nlm.nih.gov/entrez/query.fcgi?cmd=Retrieve&db=PubMed&dopt=Citation&list_uids=15703542 doi: 10.1097/01.ede.0000152525.21924.54. [DOI] [PubMed] [Google Scholar]
- 8.Lowrey PL, Takahashi JS. Mammalian circadian biology: elucidating genome-wide levels of temporal organization. Annu Rev Genomics Hum Genet. [Internet] 2004; 5:407–441. Available from: http://www.ncbi.nlm.nih.gov/entrez/query.fcgi?cmd=Retrieve&db=PubMed&dopt=Citation&list_uids=15485355 doi: 10.1146/annurev.genom.5.061903.175925. [DOI] [PMC free article] [PubMed] [Google Scholar]
- 9.Albrecht U, Eichele G. The mammalian circadian clock. Curr Opin Genet Dev. [Internet] 2003; 13:271–277. Available from: http://www.ncbi.nlm.nih.gov/entrez/query.fcgi?cmd=Retrieve&db=PubMed&dopt=Citation&list_uids=12787789 doi: 10.1016/S0959-437X(03)00055-8. [DOI] [PubMed] [Google Scholar]
- 10.Chen ST, Choo KB, Hou MF, Yeh KT, Kuo SJ, Chang JG. Deregulated expression of the PER1, PER2 and PER3 genes in breast cancers. Carcinogenesis. [Internet] 2005; 26:1241–1246. Available from: http://www.ncbi.nlm.nih.gov/entrez/query.fcgi?cmd=Retrieve&db=PubMed&dopt=Citation&list_uids=15790588 doi: 10.1093/carcin/bgi075. [DOI] [PubMed] [Google Scholar]
- 11.Gery S, Gombart AF, Yi WS, Koeffler C, Hofmann WK, Koeffler HP. Transcription profiling of C/EBP targets identifies Per2 as a gene implicated in myeloid leukemia. Blood. [Internet] 2005; 106:2827–2836. Available from: http://www.ncbi.nlm.nih.gov/entrez/query.fcgi?cmd=Retrieve&db=PubMed&dopt=Citation&list_uids=15985538 doi: 10.1182/blood-2005-01-0358. [DOI] [PMC free article] [PubMed] [Google Scholar]
- 12.Gery S, Komatsu N, Baldjyan L, Yu A, Koo D, Koeffler HP. The circadian gene per1 plays an important role in cell growth and DNA damage control in human cancer cells. Mol Cell. [Internet] 2006; 22:375–382. Available from: http://www.ncbi.nlm.nih.gov/entrez/query.fcgi?cmd=Retrieve&db=PubMed&dopt=Citation&list_uids=16678109 doi: 10.1016/j.molcel.2006.03.038. [DOI] [PubMed] [Google Scholar]
- 13.Sahar S, Sassone-Corsi P. Circadian clock and breast cancer: a molecular link. Cell Cycle. [Internet] 2007; 6:1329–1331. Available from: http://www.ncbi.nlm.nih.gov/entrez/query.fcgi?cmd=Retrieve&db=PubMed&dopt=Citation&list_uids=17534151 doi: 10.4161/cc.6.11.4295. [DOI] [PubMed] [Google Scholar]
- 14.Nie SP, Chen H, Zhuang MQ, Lu M. Anti-diabetic medications do not influence risk of lung cancer in patients with diabetes mellitus: a systematic review and meta-analysis. Asian Pac J Cancer Prev. [Internet] 2014; 15:6863–6869. Available from: http://www.ncbi.nlm.nih.gov/entrez/query.fcgi?cmd=Retrieve&db=PubMed&dopt=Citation&list_uids=25169538 doi: 10.7314/APJCP.2014.15.16.6863. [DOI] [PubMed] [Google Scholar]
- 15.Mteyrek A, Filipski E, Guettier C, Okyar A, Levi F. Clock gene Per2 as a controller of liver carcinogenesis. Oncotarget. [Internet] 2016; 7:85832–85847. Available from: http://www.ncbi.nlm.nih.gov/entrez/query.fcgi?cmd=Retrieve&db=PubMed&dopt=Citation&list_uids=27494874 doi: 10.18632/oncotarget.11037. [DOI] [PMC free article] [PubMed] [Google Scholar]
- 16.Mantovani A, Allavena P. The interaction of anticancer therapies with tumor-associated macrophages. J Exp Med. [Internet] 2015; 212:435–445. Available from: http://www.ncbi.nlm.nih.gov/entrez/query.fcgi?cmd=Retrieve&db=PubMed&dopt=Citation&list_uids=25753580 doi: 10.1084/jem.20150295. [DOI] [PMC free article] [PubMed] [Google Scholar]
- 17.Richardson DS, Johnson SA. Anthracyclines in haematology: preclinical studies, toxicity and delivery systems. Blood Rev. [Internet] 1997; 11:201–223. Available from: http://www.ncbi.nlm.nih.gov/entrez/query.fcgi?cmd=Retrieve&db=PubMed&dopt=Citation&list_uids=9481450 doi: 10.1016/S0268-960X(97)90020-5. [DOI] [PubMed] [Google Scholar]
- 18.Lai HC, Yeh YC, Ting CT, Lee WL, Lee HW, Wang LC, Wang KY, Wu A, Liu TJ. Doxycycline suppresses doxorubicin-induced oxidative stress and cellular apoptosis in mouse hearts. Eur J Pharmacol. [Internet] 2010; 644:176–187. Available from: http://www.ncbi.nlm.nih.gov/entrez/query.fcgi?cmd=Retrieve&db=PubMed&dopt=Citation&list_uids=20655905 doi: 10.1016/j.ejphar.2010.07.010. [DOI] [PubMed] [Google Scholar]
- 19.Ratcliff CG, Lam CY, Arun B, Valero V, Cohen L. Ecological momentary assessment of sleep, symptoms, and mood during chemotherapy for breast cancer. Psychooncology. [Internet] 2014; 23:1220–1228. Available from: http://www.ncbi.nlm.nih.gov/entrez/query.fcgi?cmd=Retrieve&db=PubMed&dopt=Citation&list_uids=24706506 doi: 10.1002/pon.v23.11. [DOI] [PMC free article] [PubMed] [Google Scholar]
- 20.Chomczynski P, Sacchi N. Single-step method of RNA isolation by acid guanidinium thiocyanate-phenol-chloroform extraction. Anal Biochem. [Internet] 1987; 162:156–159. Available from: http://www.ncbi.nlm.nih.gov/entrez/query.fcgi?cmd=Retrieve&db=PubMed&dopt=Citation&list_uids=2440339 doi: 10.1016/0003-2697(87)90021-2. [DOI] [PubMed] [Google Scholar]
- 21.Livak KJ, Schmittgen TD. Analysis of relative gene expression data using real-time quantitative PCR and the 2(-Delta Delta C(T)) method. Methods. [Internet] 2001; 25:402–408. Available from: http://www.ncbi.nlm.nih.gov/entrez/query.fcgi?cmd=Retrieve&db=PubMed&dopt=Citation&list_uids=11846609 doi: 10.1006/meth.2001.1262. [DOI] [PubMed] [Google Scholar]
- 22.Litviakov N, Tsyganov M, Larionova I, Ibragimova M, Deryusheva I, Kazantseva P, Slonimskaya E, Frolova I, Choinzonov E, Cherdyntseva N, et al. Expression of M2 macrophage markers YKL-39 and CCL18 in breast cancer is associated with the effect of neoadjuvant chemotherapy. Cancer Chemother Pharmacol. 2018;82:99–109. doi: 10.1007/s00280-018-3594-8. [DOI] [PubMed] [Google Scholar]
- 23.Alizadeh D, Katsanis E, Larmonier N. Chemotherapeutic targeting of myeloid-derived suppressor cells. Oncoimmunology. 2014;3:e27359. doi: 10.4161/onci.27359. [DOI] [PMC free article] [PubMed] [Google Scholar]
- 24.Ma Y, Adjemian S, Yang H, Catani JPP, Hannani D, Martins I, Michaud M, Kepp O, Sukkurwala AQ, Vacchelli E, et al. ATP-dependent recruitment, survival and differentiation of dendritic cell precursors in the tumor bed after anticancer chemotherapy. Oncoimmunology. 2013;2:e24568. doi: 10.4161/onci.24568. [DOI] [PMC free article] [PubMed] [Google Scholar]
- 25.Chavez-Galan L, Olleros ML, Vesin D, Garcia I. Much more than M1 and M2 Macrophages, There are also CD169(+) and TCR(+) Macrophages. Front Immunol. 2015;6:263. [DOI] [PMC free article] [PubMed] [Google Scholar]
- 26.Makita N, Hizukuri Y, Yamashiro K, Murakawa M, Hayashi Y. IL-10 enhances the phenotype of M2 macrophages induced by IL-4 and confers the ability to increase eosinophil migration. Int Immunol. 2015;27:131–141. doi: 10.1093/intimm/dxu090. [DOI] [PubMed] [Google Scholar]
- 27.Rutz S, Ouyang W. Regulation of Interleukin-10 expression. Adv Exp Med Biol. 2016;941:89–116. [DOI] [PubMed] [Google Scholar]
- 28.Sauter KAD, Wood LJ, Wong J, Iordanov M, Magun BE. Doxorubicin and daunorubicin induce processing and release of interleukin-1beta through activation of the NLRP3 inflammasome. Cancer Biol Ther. 2011;11:1008–1016. doi: 10.4161/cbt.11.12.15540. [DOI] [PMC free article] [PubMed] [Google Scholar]
- 29.Asmis R, Qiao M, Rossi RR, Cholewa J, Xu L, Asmis LM. Adriamycin promotes macrophage dysfunction in mice. Free Radic Biol Med. 2006;41:165–174. doi: 10.1016/j.freeradbiomed.2006.03.027. [DOI] [PubMed] [Google Scholar]
- 30.Curtis AM, Fagundes CT. Understanding the role of cellular molecular clocks in controlling the innate immune response. Methods Mol Biol. 2016;1390:301–316. [DOI] [PubMed] [Google Scholar]
- 31.Oishi Y, Hayashi S, Isagawa T, Oshima M, Iwama A, Shimba S, Okamura H, Manabe I. Bmal1 regulates inflammatory responses in macrophages by modulating enhancer RNA transcription. Sci Rep. 2017;7:7086. doi: 10.1038/s41598-017-07100-3. [DOI] [PMC free article] [PubMed] [Google Scholar]
- 32.Korkmaz T, Aygenli F, Emisoglu H, Ozcelik G, Canturk A, Yilmaz S, Ozturk N. Opposite carcinogenic effects of circadian clock gene BMAL1. Sci Rep. 2018;8:16023. doi: 10.1038/s41598-018-34433-4. [DOI] [PMC free article] [PubMed] [Google Scholar]
- 33.Papagiannakopoulos T, Bauer MR, Davidson SM, Heimann M, Subbaraj L, Bhutkar A, Bartlebaugh J, Vander, Heiden MG, Jacks T. Circadian rhythm disruption promotes lung tumorigenesis. Cell Metab. [Internet] 2016; 24:324–331. Available from: http://www.ncbi.nlm.nih.gov/entrez/query.fcgi?cmd=Retrieve&db=PubMed&dopt=Citation&list_uids=27476975 [DOI] [PMC free article] [PubMed] [Google Scholar]
- 34.Yu EA, Weaver DR. Disrupting the circadian clock: gene-specific effects on aging, cancer, and other phenotypes. Aging (Albany NY). 2011;3:479–493. doi: 10.18632/aging.v3i5. [DOI] [PMC free article] [PubMed] [Google Scholar]
Associated Data
This section collects any data citations, data availability statements, or supplementary materials included in this article.