


Abstract
Obtaining phase information remains a formidable challenge for nucleic acid structure determination. The introduction of an X-ray synchrotron beamline designed to be tunable to long wavelengths at Diamond Light Source has opened the possibility to native de novo structure determinations by the use of intrinsic scattering elements. This provides opportunities to overcome the limitations of introducing modifying nucleotides, often required to derive phasing information. In this paper, we build on established methods to generate new tools for nucleic acid structure determinations. We report on the use of (i) native intrinsic potassium single-wavelength anomalous dispersion methods (K-SAD), (ii) use of anomalous scattering elements integral to the crystallization buffer (extrinsic cobalt and intrinsic potassium ions), (iii) extrinsic bromine and intrinsic phosphorus SAD to solve complex nucleic acid structures. Using the reported methods we solved the structures of (i) Pseudorabies virus (PRV) RNA G-quadruplex and ligand complex, (ii) PRV DNA G-quadruplex, and (iii) an i-motif of human telomeric sequence. Our results highlight the utility of using intrinsic scattering as a pathway to solve and determine non-canonical nucleic acid motifs and reveal the variability of topology, influence of ligand binding, and glycosidic angle rearrangements seen between RNA and DNA G-quadruplexes of the same sequence.
INTRODUCTION
The potential for the self-association of guanine G-rich and cytosine C-rich sequences to form higher-order nucleic acid structures provides unique opportunities for the design of ligands (1,2) to bind selectively, at either biologically relevant targets or with synthetic aptamers (3,4). An important example is the self-association of four guanines strands that facilitates nucleotide strand association, to form highly polymorphic structures, termed G-quadruplexes (G4s) (5). G4 topologies are varied and can be influenced by changes in strand stoichiometry, polarity, as well as by the intervening length of loops and G-runs (6). Similarly, the self-association of protonated cytosines results in the linking together of DNA or RNA strands, to form four-stranded topologies called i-motifs (7,8). Both these non-canonical motifs have been identified as molecular targets in telomeres (9), within regulatory domains and viruses (10), and selected for in vitro to bind fluorophores (11–14).
Making accurate structural predictions of G4s (15) and i-motifs (4), particularly when interacting with ligands, has so far proved elusive. The application of NMR or X-ray methods has been quite successful to explore DNA G4s (dG4) structures. However, this has been extremely limited for RNA G4s (rG4), with only 9 unique structures deposited in the PDB. This lack of structural diversity within the PDB is partly explained by the limitations of X-ray methodologies and tools available for phase determination and structure elucidation. Our inability to directly record the phase angle (αhkl) in a diffraction experiment requires its estimation via post collection methods, either through molecular replacement (MR), isomorphous replacement (IR) or anomalous dispersion (AD) (16). Currently, the lack of diversity of RNA G4s coordinate structures severely limits the routine use of molecular replacement methods. The use of isomorphous replacement and the introduction of extrinsic heavy atoms for phasing has been successful (17), but can often perturb the underlying structures, degrade resolution, and undermine crystal quality. While the introduction of modified nucleotide bases such as 5-bromo-2′-deoxyuracil, 5-iodo-2′-deoxyuracil atoms and 8-bromo-2′-deoxyguanosine, specifically for RNA, have proved useful although they have the disadvantage of being labile, making them light sensitive during crystallization and sensitive to X-ray exposure during data collection (18). Additionally, substitution points are typically located within flexible regions, not within G-tetrads, thus reducing occupancy levels and anomalous scattering contributions (19). Alternative strategies such as the inclusion of a selective binding site, for iridium (III) or cobalt (III) (20), in combination with single-wavelength dispersion (SAD) require additional planning and have yet to be fully exploited. However, these issues could be resolved by exploiting native intrinsic anomalous scattering elements that are integral to the structures under investigation, without the need to make modifications to sequences or crystallization conditions. This is particularly suited to study nucleic acids, as they have a negatively charged phosphate backbone. G4s have an additional advantage of coordinating monovalent cations via the O6 atoms of guanines within the central electronegative channel. They are considered an integral part of the structure and essential for the stabilization of any quadruplex topology (21).
A dedicated long-wavelength macromolecular crystallography beamline I23 at Diamond Light Source extends the accessible wavelengths far beyond other synchrotron facilities. Recent publications have so far focused on protein structure determinations with the use of the potassium edge, λ = 3.35 Å (K-SAD) to resolve the structure of a K+ channel or identify K+ by phased anomalous difference Fourier maps in ribosomes (22,23). This facility additionally provides an opportunity to exploit K+ ions, intrinsic to G4s, and other cations at long-wavelengths for the de novo structural determination of nucleic acid structures, such as i-motifs (Supplementary Figure S1). Pseudorabies virus (PRV) is a contagious herpesvirus that affects swine, cattle, dogs, cats, sheep, and goats, and that encodes a unique immediate early gene IE180. Recently, a G-quadruplex-forming sequence with two G-tetrads was identified in the 3′UTR of IE180 to regulate PRV replication by enhancing gene expression (24). Exploiting K-SAD we report here on the first de novo RNA G4 structural elucidation folded from this sequence r(GGCUCGGCGGCGGA) (Figure 1Ai). The data collected at λ = 3.35 Å allowed us to not only identify all three K+ ions held between the G-tetrad planes, but also provided sufficient phasing to reveal the all-parallel stranded RNA G4 bound to two TPMyP4 molecules (rPRV2L, Table 1). We next incorporated the use of anomalous scattering elements integral to the crystallization buffer Co-SAD (cobalt, λ = 1.59 Å) along with the potassium ions held between the G-tetrads (K-SAD) to solve the DNA equivalent sequence PRV d(GGCTCGGCGGCGGA) dG4 (dPRV) (Figure 1Aii). Finally, we extended these methods to include both modified bases containing anomalous scattering elements Br-SAD (bromine, λ = 0.92 Å) (Figure 1Aiv), and contributions from intrinsic scattering element phosphorus P-SAD (λ = 3.09 Å), to determine the telomeric i-motif structure containing the d(TAACCCTAA) sequence (Figure 1Aiii).
Figure 1.

Data collected at the different element edge can be used to determine phases for G4 and i-motif structures. (A) Folding topology observed for G4 (i and ii) and i-motif (iii and iv) structures determined together highlighting anomalous scattering elements used in this investigation. (B) Calculated anomalous contribution f″ to the scattering factor as function of energy at the K+ and Co K-absorption edge of DNA G4 (dPRV), at the K+ K-absorption edge of RNA G4 with ligand (rPRV2L), and the Br and near K-absorption edge that includes P of i-motif (tel-i-motif). Dashed lines represent the wavelengths at which datasets were collected.
Table 1.
Anomalous scatterers and peak heights
| Anomalous scatterers | Number of anomalous scatterers | Wavelength (Å) | Averaged peak height (σ) | f″ | |
|---|---|---|---|---|---|
| tel-i-motif | Br | 1 | 0.92 | 12.6 | 3.9 |
| d(TAACCCTAA) | P | 7 | 3.09 | 6.3 | 1.5 |
| dPRV | K | 3 | 3.35 | 12.4 | 3.7 |
| d(GGCTCGGCGGCGGA) | Co | 3 | 1.59 | 17.7 | 3.8 |
| rPRV2L | K | 3 | 3.35 | 16.4 | 3.7 |
| r(GGCUCGGCGGCGGA) |
Determining rPRV2L structure allowed us to use regular molecular replacement techniques to determine the structure and packing arrangement of a second crystal form of the folded rPRV bound here to one TPMyP4 molecule (rPRVL). We observe that both structures are folded in similar arrangements with an all-parallel stranded RNA G4 topology, which unusually has a top G-tetrad layer presenting exclusively a rG (syn) glycosidic arrangement. The remaining 3 G-tetrad stacks contain the expected rG (anti) conformation, typically observed for RNA G4s. This topology is quite different to the dPRV DNA G4, as it contains a mixed, parallel- and anti-parallel backbone arrangement, with a mixture of dG (syn) and dG (anti) arrangements appropriate to maintain a typical G-tetrad hydrogen bonding pattern. Additionally, we observe TMPyP4’s ability to bind and stabilize the rPRV RNA G4 sequences providing us with the first structural elucidation of an RNA G4/TMPyP4 complex that reveals TMPyP4 bound closely to the 3′ end of the RNA G-tetrad, secured by the additional stacking of adenines that also influences the conformation of the external loops.
MATERIALS AND METHODS
Preparation of materials
The DNA sequence 5′-d(GGCTCGGCGGCGGA)-3′ (for dPRV) and RNA sequence 5′-r(GGCUCGGCGGCGGA)-3′ for rPRVL and rPRV2L, were purchased from Tsingke biological technology (Beijing, China) purified by polyacrylamide gel electrophoresis (PAGE). Equilibrium dialysis was typically performed in 10 ml of the oligonucleotide solution placed inside the Spectra/Por Float-A-Lyzer G2 tube (Spectrum Laboratories, USA, Mw cutoff 500–1000 Da). After final dialysis, the dilute samples were concentrated using Amicon® Ultra Centrifugal Filters. Stock solutions were prepared at 2 mM in nuclease-free water (Ambion, Fisher Scientific, Illkirch, France). The concentrations were determined using the Beer–Lambert law by measuring the absorbance at 260 nm using DeNovix DS-11 Spectrophotometer (USA). The extinction coefficients were obtained from the IDT Web site (https://sg.idtdna.com/calc/analyzer). The extinction coefficient of DNA is ε260 = 131 000 M−1 cm−1. The extinction coefficient of RNA is ε260 = 129 700 M−1 cm−1. The starting oligonucleotide solution was annealed in the buffer (20 mM potassium cacodylate at pH 6.5, 50 mM potassium chloride) by heating to 95°C for 5 min, followed by gradual cooling to room temperature. The i-motif DNA sequence 5′-d(TAACCCTAA)-3′ (tel-i-motif) and 5′-d(TAACCCBrTAA)-3′ were purchased from Eurofins, HPLC purified and prepared for crystallization as previously described (25). Meso-Tetra (N-methyl-4-pyridyl) porphine tetrachloride (TMPyP4, CAS# 92739-63-4) was purchased from Frontier Scientific (Logan, UT, USA).
Crystallization
All crystallizations were achieved using the hanging-drop vapor diffusion method at 283 K. Typically the drops contained 1 μl of 1 mM DNA solution and 1 μl of the drop solution and equilibrated against a 45% MPD well solution. The DNA G4 crystal (dPRV) was grown in initial drop conditions: 50mM sodium cacodylate at pH6.5, 80 mM potassium chloride, 12 mM sodium chloride, 50 mM lithium chloride, 1 mM hexammine cobalt (III) chloride and 10% (v/v) (±)-2-methyl-2,4-pentanediol (MPD). The crystals grew over 2 weeks as large squares of dimensions 0.3 × 0.3 × 0.2 mm. Crystals were cryoprotected using 30% MPD and flash cooled in liquid nitrogen.
The RNA G4 and TMPyP4 complex crystal (rPRVL) was grown in initial drop conditions: 50mM sodium cacodylate at pH6.5, 20 mM potassium chloride, and 10% MPD, equilibrated against a well solution containing 50% MPD, and 50 mM sodium cacodylate at pH 6.5. The drop contained 1 μl of 0.35 mM RNA with 0.35 mM TMPyP4 at 1:1 ratio and 1 μl of well solution. The RNA G4 TMPyP4 complex crystal (rPRV2L) was grown in initial drop conditions: 50 mM sodium cacodylate at pH 6, 40 mM potassium chloride and 5% MPD. Crystals were cryoprotected using 40% MPD and flash cooled in liquid nitrogen. The drop contained 1 μl of 0.25 mM RNA with 0.5 mM TMPyP4 at a 1:2 ratio and 1 μl of well solution. Crystals for the tel-i-motif native and Br-C derivative were prepared as previously described (25).
Data collection and structure determination
In all cases crystals were harvested using loops and successfully cryo-protected by flash freezing in Nitrogen. X-ray data collections and screenings were conducted at either the Shanghai Synchrotron Radiation facility (SSRF) China, or the Diamond Light Source synchrotron facilities (Tables 1–5).
Table 2.
Data collection and refinement statistics
| dPRV | rPRVL | rPRV2L | tel-i-motif | |
|---|---|---|---|---|
| Ligand | — | TMPyP4 | TMPyP4 | — |
| PDB id | 6JJF | 6JJI | 6JJH | 6TQI |
| Data collection | ||||
| Beamline | Diamond I23 | SSRF 19U1 | Diamond I23 | Diamond I23 |
| Space group | C 2 | P 2 2 21 | P 2 | P 62 2 2 |
| Cell dimensions | ||||
| a, b, c (Å) | 45.37, 47.60, 37.73 | 23.54, 29.24, 57.61 | 29.85, 23.64, 31.05 | 31.90, 31.90, 81.88 |
| α, β, γ (°) | 90.00, 110.02, 90.00 | 90.00, 90.00, 90.00 | 90.00, 107.59, 90.00 | 90.00, 90.00, 90.00 |
| Resolution (Å) | 23.80–1.47 (1.52–1.47) | 50.00–3.11 (3.22–3.11) | 29.60–1.74 (1.80–1.74) | 27.63–2.90 (3.25-2.90) |
| R sym or Rmerge (%) | 3.6 (51.3) | 10.8 (40.3) | 2.1 (34.0) | 3.6 (4.4) |
| I / σI | 17.7 (1.1) | 12.9 (4.4) | 15.6 (1.76) | 80.0 (62.5) |
| Completeness (%) | 98.0 (86.6) | 97.6 (93.7) | 99.5 (98.6) | 99.7 (99.0) |
| CC1/2 (%) | 99.8 (64.4) | 99.8 (99.4) | 100 (84.2) | 99.9 (100) |
| Wavelength (Å) | 1.5895 | 0.9790 | 1.7712 | 1.000 |
| Refinement | ||||
| Resolution (Å) | 23.80–1.47 (1.52–1.47) | 16.04–3.10 (3.21–3.10) | 29.60–1.7(1.80–1.74) | 25.0–2.95 (3.25–2.95) |
| No. reflections | 12704 (1122) | 825 (78) | 4377 (431) | 647(37) |
| R work / Rfree (%) | 19.2/19.9 (32.9/31.9) | 19.2/24.9 (33.9/50.6) | 23.9/29.1 (32.9/27.7) | 23.38/22.6 (43.8/38.3) |
| No. atoms | ||||
| DNA/RNA | 622 | 303 | 303 | 178 |
| Ligands/ions | 25 | 55 | 107 | |
| Water | 67 | 11 | ||
| B-factors | ||||
| DNA/RNA | 32.04 | 71.12 | 43.97 | 49.4 |
| Ligands/ions | 50.68 | 70.59 | 44.30 | |
| Water | 39.21 | 41.65 | ||
| R.m.s. deviations | ||||
| Bond lengths (Å) | 0.009 | 0.003 | 0.008 | 0.011 |
| Bond angles (°) | 1.14 | 0.73 | 1.67 | 0.94 |
*Values in parentheses are for the highest-resolution shell.
Table 3.
Data collection and processing statistics for dPRV
| Dataset1 K edge | Dataset2 Co edge | |
|---|---|---|
| Data collection | ||
| Beamline | Diamond I23 | Diamond I23 |
| X-ray wavelength (Å) | 3.3509 | 1.5895 |
| Space group | C 2 | C 2 |
| Cell dimensions | ||
| a, b, c (Å) | 45.23, 47.51, 37.63 | 45.28, 47.51, 37.65 |
| α, β, γ (°) | 90.00, 110.10, 90.00 | 90.00, 110.04, 90.00 |
| Resolution (Å) | 35.34–2.19 (2.26–2.19) | 35.37–1.4 (1.42–1.4) |
| R sym or Rmerge (%) | 7.6 (16.3) | 6.4 (217.9) |
| I / σI | 36.7 (11.4) | 26.8 (1.0) |
| Completeness (%) | 98.6 (86.4) | 99.7 (95.4) |
| Multiplicity | 14.5 (5.7) | 30.2 (22.0) |
| CC1/2 (%) | 99.9 (97.5) | 100 (66.8) |
| No. of unique reflections | 3865 | 14880 |
| Anomalous completeness (%) | 96.2 (82.0) | 99.4 (92.7) |
| Anomalous multiplicity | 7.1 (3.0) | 14.5 (10.7) |
*Values in parentheses are for the highest-resolution shell.
Table 4.
Data collection and processing statistics for rPRV2L
| Dataset1 K edge | |
|---|---|
| Data collection | |
| Beamline | Diamond I23 |
| X-ray wavelength (Å) | 3.3509 |
| Space group | P 2 |
| Cell dimensions | |
| a, b, c (Å) | 29.87, 23.66, 31.06 |
| α, β, γ (°) | 90.00, 107.61, 90.00 |
| Resolution (Å) | 29.60–2.19 (2.31–2.19) |
| R sym or Rmerge (%) | 11.6 (33.8) |
| I / σI | 13.9 (3.8) |
| Completeness (%) | 92.1 (79.8) |
| Multiplicity | 7.8 (4.6) |
| CC1/2 (%) | 98.6 (91.5) |
| Total no. of reflections | 16101 (1166) |
| No. of unique reflections | 2065 (254) |
| Anomalous completeness (%) | 86.8 (77.2) |
| Anomalous multiplicity | 3.9 (2.4) |
*Values in parentheses are for the highest-resolution shell.
Table 5.
Data collection and processing statistics for tel-i-motif
| Dataset1 Br edge | Dataset2 P edge | |
|---|---|---|
| Data collection | ||
| Beamline | Diamond I02 | Diamond I23 |
| X-ray wavelength (Å) | 0.92007 | 3.0996 |
| Space group | P 62 2 2 | P 62 2 2 |
| Cell dimensions | ||
| a, b, c (Å) | 32.78, 32.78, 81.67 | 32.37, 32.37, 82.03 |
| α, β, γ (°) | 90.00, 90.00, 120.00 | 90.00, 90.00, 120.00 |
| Resolution (Å) | 40.83–2.78 (2.85–2.78) | 28.03–2.01 (2.13–2.01) |
| R sym or Rmerge (%) | 7.7 (309.5) | 8.4 (181.9) |
| I / σI | 19.5 (0.9) | 59.4 (2.0) |
| Completeness (%) | 98.2 (95.5) | 99.9 (99.2) |
| Multiplicity | 15.4 (15.8) | 129.9 (62.5) |
| CC1/2 (%) | 98.2 (34.6) | 100 (88.7) |
| Total no. of reflections | 12 504 (840) | 257 631 (18 500) |
| No. of unique reflections | 812 (53) | 1983 (296) |
| Anomalous completeness (%) | 98.8 (97.1) | 99.8 (99.1) |
| Anomalous multiplicity | 10.1 (9.6) | 73.5 (33.8) |
*Values in parentheses are for the highest-resolution shell.
The dPRV SAD dataset for crystals grown from the DNA sequence was collected on the long-wavelength beamline I23 at Diamond Light Source, UK, at a wavelength of 3.35 Å, close to the K absorption edge (3.44 Å) and consists of four merged datasets. The merging of data sets increases the signal to noise, a critical factor when measuring the small anomalous differences between the reflection Bijvoet pairs. The high-resolution dataset was collected at a wavelength of 1.58954 Å, consisting of two merged datasets, where the best crystals diffracted to a resolution limit of 1.47 Å, with 360° of data collected with an exposure of 0.1 sec per 0.1 degree rotation. Data were reduced with XDS (26) and scaled with Aimless (27). The I23 beamline was chosen as it provides an opportunity to derive initial phases from the anomalous scattering of potassium ions held in the central core of the stacked G-quartets. Although the anomalous signal at 3.7 keV (3.35 Å) at the K edge (K-SAD) was very strong, automated phasing was not sufficient to provide interpretable maps. By collecting above the cobalt edge (Co-SAD), at 7.8 keV (1.59 Å), initial phases with sufficient accuracy were derived to calculate interpretable Focalc maps, however it required the contribution of the anomalous scattering of both potassium and cobalt atoms. Phases were determined using the ShelxCDE pipeline in HKL2MAP (28), providing six sites which were searched using a resolution cutoff of 3 Å after 2000 trials. The initial Focalc electron density map revealed six discrete spherical peaks that were interpretable as the positions of three K+ ions within the quadruplex central channel and three Co3+ ions associated with the phosphate backbone. This combination enabled sufficient electron density and geometric restrains to position a core G-quadruplex in the asymmetric unit and complete a viable model. As water molecules do not generate a significant anomalous signal at the X-ray wavelength used for data collection, this method is able to experimentally discriminate between a superposition of Na+ ions and water molecules. The accuracy of the anomalous measurements can be seen in a phased anomalous difference map. Model refinement proceeded using iterative cycles of building in Coot program and refinement in REFMAC5 program (29) within the CCP4 package (30). The final R-work and R-free were 19.2% and 19.9%, respectively. There are two DNA strands in the ASU that folds into one quadruplex forming four stacked tetrads and three K+ ions. Crystal structure coordinates and structure factor data have been deposited in the Protein Data Bank with code 6JJF.
The structure of the RNA G4 and TMPyP4 complex (rPRV2L) was solved by K-SAD methods on data collected on I23 at Diamond Light Source at a wavelength of 3.3501 Å, close to the K absorption edge (3.44 Å). Data reduction followed the methods described above. The ShelxCDE pipeline in HKL2MAP was used to determine the positions of the anomalous scatters, which all lie on a crystallographic 2-fold axis. The data were phased using the potassium ions held in the central core of the stacked G-quartets, the first successful structure determination using K absorption edges. Although the initial phases were quite poor an initial model was sufficient using iterative cycles of building in Coot program and refinement in REFMAC5 program within the CCP4 package to complete the structure. The final R-work and R-free are 24.18% and 29.1%, respectively. Crystal structure coordinates and structure factor data have been deposited in the Protein Data Bank with code 6JJH.
The rPRVL dataset for the crystals containing a second RNA G4 and TMPyP4 complex was collected at Shanghai Synchrotron Radiation facility (SSRF) China and diffraction data were indexed, integrated, and scaled using HKL2000 (31) or HKL3000 (32) and were further processed using CrysalisPro (Agilent Technologies). rPRVL was solved by molecular replacement (MR) methods using the PHASER program (33) and the G-tetrad core structure from the rPRV2L model. Crystal structure coordinates and structure factor data have been deposited in the Protein Data Bank with code 6JJI.
The structure of the i-motif was solved by SAD methods on data collected on I02 at Diamond Light Source at a wavelength of 0.92007 Å, on the Br absorption edge (Br-SAD), and at I23 at a wavelength of 3.0996 Å on the K absorption edge (K-SAD). Data reduction, model building and refinement followed the methods described above. The ShelxCDE pipeline in HKL2MAP was used to determine the positions of the anomalous scatters Br and P. Crystal structure coordinates and structure factor data have been deposited in the Protein Data Bank with code 6TQI.
All figures were generated with PyMOL (http://www.pymol.org) (34) and Coot (35). Data collection and structural refinement statistics are summarized in Tables 1–5.
RESULTS
Intrinsic and extrinsic scattering elements for de novo structure determination
Long-wavelength macromolecular crystallography is a useful method for solving the crystallographic phase problem, using the small anomalous signals from lighter atoms, such as sulphur or phosphorus which are present in native protein or nucleic acids containing crystals. At longer wavelengths, the anomalous signal from these atoms is increased, which allows S-SAD or P-SAD methods to become routine techniques. Because of the increased absorption at longer wavelengths, dedicated beamlines (in vacuum or in helium) are necessary to perform these experiments. In addition, radiation damage is also more severe, but it can be avoided by using low-dose and high-multiplicity data collection strategies. Wherever possible, collecting multiple datasets from a single crystal will also benefit from different crystal orientations using a multi-axis goniometer to minimize systematic errors and cover more reciprocal space.
An investigation into using intrinsic scattering elements in DNA and RNA for de novo structure determination was undertaken at the Diamond Light Source long-wavelength in-vacuum beamline I23. For each crystal, multiple datasets of 360° with different kappa angles were collected at low dose. Our analysis was undertaken on well-characterized and well-diffracting crystals of both RNA/DNA G4s, containing PRV sequences and on an i-motif containing the human telomeric sequence. In both cases, phasing using molecular replacement, and/or Br-SAD had proved inadequate. Our experiments focused on utilizing SAD data collected at long wavelengths on both potassium and phosphorus for phase determination (Figure 1B and Tables 3–5). We planned to utilize the fact that G4s grown in the presence of potassium will intrinsically contain, in the central core, one potassium ion sandwiched between every two stacked G-tetrad. We also investigated combining P-SAD contributions with data available from Br-SAD to derive sufficient phasing for our structural determinations.
Determination of the RNA G4 in complex with TMPyP4 (rPRV2L) using long-wavelength K-SAD
To determine the structure of the RNA r(GGCUCGGCGGCGGA)/TMPyP4 complex, rPRV2L, SAD data were collected close to the potassium absorption edge (λ = 3.44 Å). Using the ShelxCDE pipeline (36), three anomalous scattering peaks oriented on a crystallographic 2-fold axis (Figure 2B) 3.4 Å apart, were identified as K+ ions (Table 1). The model was manually built over several cycles into K-SAD and 2Fobs – Fcalc maps using COOT (Supplementary Figure S2). Formed from just one RNA strand in the asymmetric unit (ASU) the four-stacked rG4 is generated through the operation of a crystallographic 2-fold axis with the three K+ ions (Figure 2A, C, D) sitting on the symmetry axis. Two independent TMPyP4 ligands are observed bound to the RNA, one intercalated at the 3′end of the rG4, layered between the G-tetrad plane and an A-diad formed from A14:A14* bases, and one external to the rG4 (Figure 2D and Tables 2 and 4). The external TMPyP4 is held in place adjacent to the RNA G4 in a stacked arrangement between a pair of uracils (U4:U4*) and a pair of cytosines (C11:C11*). A crystallographic 2-fold symmetry element is aligned exactly through the center of TMPyP4 in alignment with the C2 symmetry of the molecule and rG4. This is in contrast to the intercalated TMPyP4 where the molecule has two distinct positions 1.5 Å from the crystallographic 2-fold symmetry axis that runs through the center of the rG4 structure. An omit map generated by excluding TMPyP4 shows clearly two positions in the Fo-Fc electron density. Refinement of TMPyP4 with half-occupancy into two of these distinct positions reduces the overall R and Rfree. We attribute this static disorder to the constricted environment adjacent to the G4-tetrad and the extended plane formed by the A14:A14* pairing. The larger surface area can accommodate the ligand TMPyP4 in the two positions, and as expected it sits 0.2 Å further away from the G4-tetrad than the adenine diad plane.
Figure 2.

Schematic and ribbon images showing the HA locations and subsequent anomalous difference map, initial SAD map calculated using positions of the anomalous scatters, together with density-modification procedures, and 2Fobs– Fcalc maps, for rPRV2L. (A) Overall topology with direction of backbone, parallel (green) and anti-parallel (orange), and glycosidic torsion angles anti- (gray) and syn- (orange) highlighted. (B) SAD map, in gray (2σ), based on phases derived from HA positions determined from K+ ions, (C) 2Fo – Fc map, contoured at 2σ, shows the accuracy of the anomalous difference measurements. (D) Ribbon diagram crystal structure rPRV2L with chain A and chain B shown as cartoon style (gray), overlain composite of K+ (Fanom(calc) map (magenta, 2σ, 3.7 keV)).
Determination of the DNA G4 (dPRV) combining long-wavelength K-SAD and Co-SAD
In the structural determination of the DNA d(GGCTCGGCGGCGGA) dG4 (dPRV), we combined the use of K-SAD, from the contribution from K+ ions, and Co-SAD from Co3+ ions stabilized in the crystal lattice. Initially, K-SAD data collected at 3.7 keV (λ = 3.35 Å) close to the K absorption edge was used for phasing. Using the automated ShelxCDE pipeline three anomalous peaks were identified as the K+ ions (Figure 3B), although this proved insufficient to generate interpretable maps (Supplementary Figure S3). Additional anomalous scattering was observed. Since 1 mM cobalt hexamine was present in the crystallization buffer, cobalt could be used as an additional scattering element. Data were subsequently collected above the cobalt absorption edge at 7.8 keV (λ = 1.59 Å) (Figure 3C, Supplementary Figure S4). This, when combined with anomalous scattering from potassium ions provided phases with sufficient accuracy to calculate interpretable SAD maps (Figure 3D). The anomalous difference Fourier maps calculated for two wavelengths, shown in Figure 3B–D, clearly identify the cobalt (cyan, 2σ, 7.8 keV,) and potassium ions (magenta, 2σ, 3.7 keV). Interestingly, the anomalous phosphorus scattering (blue) is just visible at 3.7 keV, but, at this wavelength, it is not sufficient for phasing (Figure 3D). The DNA coordinate model was manually built into density using COOT over several cycles of refinement. A high-resolution dataset at a wavelength of 1.5895 Å was used for refinement and coordinate deposition at the PDB as dPRV (Figure 3E and Tables 2 and 3).
Figure 3.

Schematic and ribbon images showing the HA locations and subsequent anomalous difference map (Fanom(calc)), initial SAD map calculated using positions of the anomalous scatters, together with density-modification procedures, and 2Fobs – Fcalc maps for dPRV. (A) Overall topology with direction of backbone, parallel (green) and anti-parallel (orange), and glycosidic torsion angles anti- (gray) and syn- (orange) highlighted. (B) SAD map in gray (1.5σ) based on phases derived from HA positions determined from K+ ions, (C) SAD map (gray, 1.5σ) based on phases derived from HA positions determined from Co3+ and K+ ions. (D) (2Fo – Fc) map contoured at 2σ shows the accuracy of the data collected on beamline I23. (E) Ribbon diagram of dPRV crystal structure with chain A and chain B shown as cartoon style (gray) and K+ ions (magenta), Co (III) hexamine (cyan), Na+ ions (red) and P (blue) atoms as small spheres. Strong anomalous difference peaks corresponding to the K+ (magenta, 2σ, 3.7 keV), Co3+ (cyan, 2σ, 7.8 keV) ions and P (blue, 2σ, 3.7 keV) atoms.
Crystallographic determination of the human telomeric i-motif (tel-i-motif), combining long-wavelength P-SAD and Br-SAD
In an attempt to use our intrinsic scattering method for the determination of other non-canonical DNA structures we focused on the i-motif derived from human telomeric sequences. This approach followed on from our unsuccessful MR attempts using equivalent NMR models containing telomeric sequences (PDB id 1EL2, 1ELN) and trials using a halogen bromine derivative, substituting C3 with C3Br (Figure 4A). Our initial Br-SAD data provided a partial SAD map and indicated the locations of the bromine atoms (Figure 4B, E, green density). However, it was not sufficient to accurately build a model. A long-wavelength data collection (λ = 3.0996 Å) at I23 beamline provided a robust data set (Tables 2 and 5) with a strong phosphorous anomalous contribution (Table 1). Using the Bromine data as external phases in phenix. autosol (37), seven of the eight phosphorus atoms were identified (Figure 4C, F, blue density, D) and provided well-defined electron density suitable for model building (Supplementary Figure S5). The probability of solving the structure directly by P-SAD was challenging since it is related to the ratio of the number of reflections over the number of anomalous scatterers (38). Here because of the small unit cell, the number of reflections is low, while the number of phosphorous atoms is high (∼1 per nucleotide). Additionally, the apparent mobility of the phosphates in DNA/RNA structures, either static or dynamic, conspires to reduce the strength of anomalous scattering (39). In this analysis, there was an insufficient P-SAD anomalous contribution which required us to combine the use of both intrinsic (P-SAD) and extrinsic (Br-SAD) anomalous scattering for a successful structural determination (Figure 4G–J).
Figure 4.

Schematic and ribbon images showing the HA locations and subsequent anomalous difference Fourier (Fanom(calc)) maps, initial SAD map calculated using positions of the anomalous scatters, together with density-modification procedures, and 2Fobs– Fcalc maps, for tel-i-motif. Overall topology with direction of backbone, parallel (green) and anti-parallel (yellow), and glycosidic torsion angles anti- (gray) and syn- (orange) highlighted. (A) Positions of C3Br substitutions within the tel-i-motif. (B) Fanom(calc) map (green) showing Br heavy atoms, 13.47 keV data (Br absorption edge). (C) Fanom(calc) map (blue) showing P atoms positions, 4.01 keV data. (D) Schematic showing P atoms within tel-i-motif. (E) SAD map in gray (2σ) based on phases derived from Br positions. (F) SAD map in gray (2σ) based on phases derived from P positions. (g-h) Ribbon images showing overall tel-i-motif topology, backbone (gray), cytosine (green), adenine (yellow), thymine (orange). (I) Stick representation showing phosphorus scattering positions (blue) and bromine (green). (J) Final 2Fobs– Fcalc maps, for tel-i-motif and final model.
Determination of RNA G4 in complex with TMPyP4 (rPRVL) using MR
Multiple attempts of molecular replacement (MR) using known arrangements of stacked G-tetrads, including dPRV proved unsuccessful. We were only successful using the G4 central core of the newly determined structure of rPRV2L complex as an MR model, highlighting the need for highly accurate models for the determination of nucleic acid structures. Similar to rPRV2L, the ASU contains one RNA strand aligned along a crystallographic 2-fold axis, which folds into an all-parallel stranded bimolecular rG4 consisting of four stacked G-tetrads with three K+ ions sitting on a 2-fold axis with half occupancy. The structure displays the same syn, anti rG-quartet stacking arrangement as rPRV2L (Supplementary Table S4). This crystal contains only one TMPyP4 ligand bound to the RNA, similarly, intercalated at the 3′ end of the rG4 layered between the G-tetrad plane and an A-diad formed from rA14:A14* bases (Figure 5C). The TMPyP4 binding site between the G-tetrads and paired adenines is similar to rPRV2L, with stacking 0.2 Å further from the G-tetrad plane than the paired adenines, but here binds in a single and more ordered orientation.
Figure 5.

Comparison of PRV RNA and DNA structures drawn as cartoons. (A) DNA G4 (dPRV), (B) RNA G4 (rPRVL), (C) RNA G4 (rPRV2L), (D) Structure alignment of dPRV between chains A and B, (E) Structure alignment between rPRVL and rPRV2L, (F) Structure alignment between dPRV (chain B) and rPRVL. Potassium ions are shown as magenta spheres. Sodium ion is shown as red sphere. Chains A and B are shown as different colors. TMPyP4 ligands are shown as magenta sticks and brown for the alternative conformations.
Comparison of DNA and RNA G4 Structures from PRV
A comparison between the PRV DNA and RNA G4 structures reveals differences in G-tetrad stacking, backbone orientations, and syn anti-conformations, as illustrated in Figures 2, 3 and 5F. The DNA (d(GGCTCGGCGGCGGA)) (dPRV) has two strands in the ASU (28nt) which associate together to form a parallel/anti-parallel mixed bimolecular dG4 (Figure 5A), while the RNA G4s are formed from one independent strand in the ASU, that associates through crystallographic symmetry to form an all-parallel bimolecular rG4, where with the top G-tetrad layer containing a rG (syn) glycosidic arrangement (Figure 5B, C). Despite these differences, both the DNA and RNA G4s have similar topologies consisting of four stacked G-tetrads separated by three linkers, L1 the longest with 3-nt triplet (CTC), and two single bases (C) forming propeller loops (L2, L3). The DNA G-tetrads are linked by a lateral loop (L1), and two propeller loops (L2, L3) (Figure 3A) with three K+ ions, as confirmed by anomalous scattering, and one Na+ ion in the center of the channel (Figure 3D, E). In contrast to the RNA motif, all four G-tetrads are linked through a parallel topology and three propeller loops (Figure 2A) with three K+ ions in the center of the channel (Figure 2B, D) but lacking the sodium ion as it is not as stabilizing and more easily displaced by TMPyP4. The effects of loop length on two-quartet dG4s DNA (G2-DNA), as determined by biophysical and NMR methods, show that a loop length of 1 promotes the formation of a parallel conformation, while loop lengths of three preferentially adopt the antiparallel conformation (40), consistent with our observed mixed topologies, with a lateral loop in DNA and propeller loops in RNA.
When we compare the root mean square (rms) deviations between the two DNA chains (A, B), there is very little difference between the central G-quartets (206 atoms, 0.242 Å), except for dG6 (Figure 5D, Supplementary Figure S6A). Step parameters and base-pair parameters for both DNA and RNA G4s are provided in Supplementary Tables S1–S3, S4–S6. A comparison of nucleotide backbone torsion angles and sugar puckers (3DNA-DSSR) (41) also shows minor differences associated with the dG4 core with variability primarily centered on loop L1 (CTC) (Supplementary Figures S6A and S7A, D). Here the L1 loop connects the top two G-tetrads and supports a mixed parallel and anti-parallel topology, with dG1−dG2 pointing up, while all other phosphate backbones point down, including loop L2 linking together the top and lower two G-tetrads and loop L3. Loop L1 helps stabilize the top G-tetrad with a trinucleotide stack (Supplementary Figure S7A, D) consisting of a C5A–C5B base-pair, hydrogen bonded to T4B. The remaining bases, C3A, C3B and T4A, form multiple interactions away from the dG4 core (Supplementary Figure S7A, D) (42). Different from the DNA topology, the RNA G4 loop L1 (CUC) connects the top G-tetrad rG1–rG2 in a parallel arrangement stabilized by the contribution of the O2′-sugars, generating an unusual all syn-glycosidic quartet (43). A direct comparison of RNA G4s strands (A) between the two structures (rPRVL and rPRV2L) reveals little difference in either topology or conformation (rms all atoms, 0.424 Å), even when crystallized in different space groups (Figure 5e and Supplementary Figure S7b-d). This similarity also extends to the backbone dihedrals, even for loops L1 and L3 which require only modest changes to accommodate the additional TMPyP4 for rPRV2L (Supplementary Figure S6b). The largest difference occurs for rA14 which accommodates the TMPyP4 binding 1.5 Å off the central axis for rPRV2L. Despite the sequences being identical, the structural differences between the DNA and RNA topologies become obvious when they are superimposed (Figure 5F). These differences extend through sugar puckers and the G-tetrad syn anti arrangements, although they still maximize the favorable syn-anti and anti-anti steps, based on a simplified two-quartet [d(GG)]4 model (44). Additionally, we observe both C3′- and C2′-endo puckering in the ribose sugars in the G-tetrads, which appears to be linked to the syn or anti glycosidic torsion angles RNA:r(syn–syn–syn–syn), r(anti–anti–anti–anti), r(anti–anti–anti–anti), r(anti–anti–anti–anti). This arrangement is unlike the DNA G4, where all deoxyribose sugar puckers are in the C2′-endo conformation and form a pattern: d(anti–syn–anti–syn), d(syn–anti–syn–anti), d(anti–anti–anti–anti), d(anti–anti–anti–anti) (C3′-endo’s sugar puckers highlighted in bold).
In a crystalline lattice, the G4s pack together via stacking arrangements taking advantage of available unpaired nucleotides. We observe that dPRV is organized in 3′-to-3′ orientation where the terminal residue dA14 is available to contribute to overall stacking. This generates a A•A•A•A tetrad with non-canonical pairing (45), adopting alternative conformations (Supplementary Figure S8A, D) (46). Both the rPRVL and rPRV2L are organised differently, arranged in a stacked 3′-to-′ arrangement associated, in this case with TMPyP4 (Supplementary Figure S8B, C, E, F). Native gel electrophoresis of equilibrated rPRVs shows a very broad band, which we interpret as a complex mixture of multimeric arrangements in the buffer that shift with varying TMPyP4 concentrations (Supplementary Figure S10). Our crystal structures capture two of these substates. The first substate has TMPyP4 bound as a sandwich between the A-dimer and the G-tetrad (rPRVL). This then provides rU4 and rC11 the necessary conformational flexibility (Supplementary Tables S4–S6, Figure S8) to stack with a second TMPyP4 (rPRV2L) as the second substate (47,48). CD analysis is consistent with the crystallographic model where the addition of nucleotides to the 5′end of the DNA G4 (Supplementary Table S7) increases the instability of the observed conformation by shifting to alternative topologies through steric hindrance (Supplementary Figure S9) (49,50). This may be enhanced by its proximity to the longer L1 lateral loop, thus allowing for more conformational flexibility and access to the G-tetrad surface.
A structural description of the i-motif from human telomeric DNA
The importance of i-motifs within promoters and telomeric (3′-strand) regions was recently highlighted using an antibody fragment (iMab) that recognizes i-motif structures in vivo (51). Our tel-i-motif structure is typical of other intermolecular i-motifs, here formed from four telomeric strands associated with crystallographic symmetry to generate six C:C+ pairs. The AAT 5′ and TAA 3′ head and tail sequences base pair through symmetry-related partners, forming characteristic DNA duplex secondary motifs. The tel-i-motif structure is comparable to the NMR derived structure of similar sequence (52), and other i-motif tetramers, where the strands pair with planar hemi- protonated C:C+ bases. A comparison between the NMR and X-ray derived structures shows that the base pair deviations are less than 4°, while the average intercalated stacking interval is similar at 3.1 Å, with the cytidines in the (χ) anti-conformation. However, the average P–P distance for Tel-i-motif is wider by 1 Å, at 15.2 Å across the wide grooves, and narrower by 2 Å at 7 Å across the narrow grooves. The major difference is that the cytosine stack register is shifted by one nucleotide step. In this and other crystal structures, we observe that C1 sits below C3. This is different from the NMR structure, where the methyl modified cytosine base CM1 (residue 7) is stacked on top of C3 pulling the cytosine stack up by one register in the 5′ direction (+1) (Figure 6). Subtle base modifications or changes to telomeric sequence length have been observed to play a decisive role in the stabilization of the topology observed. The introduction of these two modifications in the NMR determined structure might have helped provide a new stabilized but 5′ shifted i-motif topology. While these structural changes might not appear significant, they will impede successful MR determinations.
Figure 6.
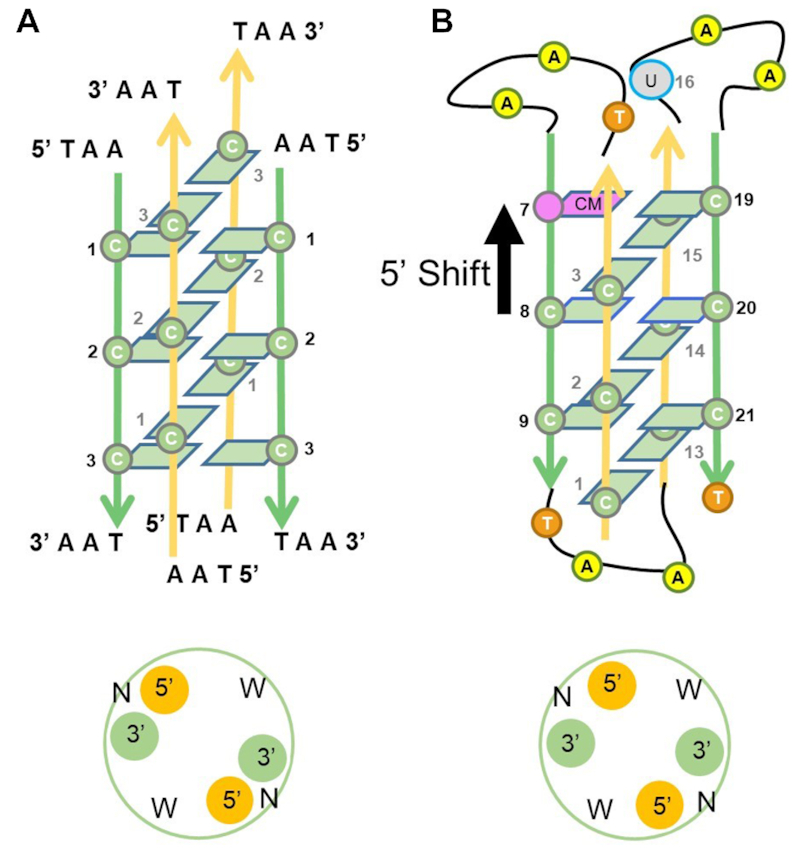
Comparison of topologies between the X-ray determined one-repeat d(TAACCCTAA) (tel-i-motif) and the NMR determined four-repeat human telomeric modified sequence d(CCCTAA(5mC) CCTAACCCUAACCCT), folded as an i-motif (1EL2). Direction of backbone shown parallel (green), and anti-parallel (yellow). (A) Changes in groove widths are shown with strand orientations, Narrow (N) and Wide (W). (B) Sequence mutations are shown with cytosine to 5-methylcytosine substitution (pink), at position 7, and the thymine to uracil substitution (gray), at position 16. The arrow indicates a shift of C:C+ base pairs in the 5′ direction.
DISCUSSION
Advances and challenges for automated SAD nucleic acid structure determinations
We have confirmed here the utility of using long-wavelength crystallography based on intrinsic scattering elements for experimental phasing and de novo structure determination of DNA and RNA G4s, along with its ability to unambiguously assign metal ions in the lattice. Access to long-wavelength X-ray diffraction provides opportunities to tune the wavelength to identify lighter anomalous scatterers for the characterization of structures containing mixed ions, currently challenging using conventional structure determination techniques.
This work shows the opportunities beamline I23 provides for nucleic acid structural determinations and characterization, and we hope that this approach will be adopted more widely. A remaining challenge is the implementation of equivalent protein automated software tools for model building and phase extension of nucleic acid structures. Currently, automated pipelines for phasing and model building are not as robust for nucleic acids as for proteins. This is particularly relevant to advance the effective incorporation of P-SAD methods (39,53) in phase determination. However, at this stage, we have shown the general utility of using intrinsic scattering to aid in the identification of metal ions, such as K+. We observe that they are more robust than utilizing the incorporation of modified bases (Br-U) commonly associated with diminished occupancy or using phosphorus where dinucleotide phosphate backbones are frequently observed to have multiple conformations especially in non-canonical DNA and RNA G4 motifs. This type of anomalous scattering analysis is useful as it also allows for the clear identification of ions in the G4 core channel, independent of their atomic scattering intensity, something challenging when using standard NMR resources. Looking more broadly we expect this technique to be applied more widely in ever more complex molecular settings.
The utility of TMPyP4 as a G4 interacting ligand and its selectivity for rG4s over dG4s
Our focus on non-canonical nucleic acids relates to their biological relevance in a variety of structural, regulatory, and catalytic roles, as well as for their potential therapeutic applications, both as targets and as drugs. Here we selected the cationic porphyrin TMPyP4 ligand as it shows a high affinity to G4s, has good inhibitory activity on telomerase, and on the expression of oncogenes (54). Additionally, it shows anti-tumor activity in several tumor cells in high concentrations but negatively enhances translation in eukaryotic cells at lower concentrations (55). TMPyP4 has a strong preference for dimer interfaces (56,57), while its interaction to RNA via a G-tetrad base stacking is sterically unexpected. Our crystal structures help explain the observed association of TMPyP4 to these two RNA motifs, highlighting a sandwich type arrangement formed from a 3′ G-tetrad surface and a second platform generated from the dimerization of an adenine pair. This arrangement is similar to that observed in for a DNA G4, (PDB id 2A5R) in a snap-back 3+1 arrangement, except here the platform is formed on the 5′ G-tetrad surface. Our equivalent PRV DNA sequence is folded in the crystal lattice such that an adenine tetramer is formed on the 3′ end, removing the preferred dimer interface, and thus preventing TMPyP4 binding to the 3′ terminal G-tetrad. The major factor affecting topology between our DNA and RNA sequences is the presence of sugar ribose 2′-hydroxyl group, which promotes the formation of an all parallel stranded rG4 and could be related to functional differences (43). An understanding of folding preferences, G4 architecture, and ligand selectivity between RNA and DNA G4s will be important for the future design of selective functional nucleic acids targeting agents.
Use of long wavelength scattering as an aid to nucleic acid structure determination
Despite the sequence similarity between the G4 DNA (dPRV) and RNA (rPRV) structures, the nucleotide arrangements (syn, anti) and strand orientation differed sufficiently to impede the routine application of MR to solve the structure. The rms deviation between the two structures is comparable where the overall core nucleotide arrangement appears similar in both rise and twist, except for the small, localized regions where the bases are flipped into alternative syn-, anti- arrangements. It required the application of both intrinsic scattering K-SAD and elements in the crystallization buffer like Cobalt (Co-SAD) to derive accurate phases to obtain the structure solution. This is in contrast to the rG4 rPRV2L and rPRVL structures which were sufficiently similar in the central G4 core to allow for MR to work, despite the binding of a second ligand with an associated distortion of the loop regions. Similarly, the i-motif search models selected manually for MR methods were insufficient and/or inaccurate. Our initial use of halogen derivatives for SAD phasing, as discussed above, proved insufficient and required the complementary use of intrinsic scattering from the phosphorus in the DNA backbone (P-SAD) for the generation of interpretable maps. The use of P-SAD could have been extended further to include the anomalously scattering element potassium (K-SAD), available within G4s. Clearly, challenges currently exist in the implementation of this technique for routine complex nucleic acids de novo structure determinations, particularly for twinned crystals or G4s with inherent global pseudo-symmetry.
DATA AVAILABILITY
PyMOL is an open source collaborative initiative available in the Schrodinger (https://pymol.org/2/). OriginPro is an open source collaborative initiative available in the OriginLab Corporation (https://www.originlab.com/). Atomic coordinates and structure factors for the reported crystal structures have been deposited with the Protein Data bank under accession numbers 6JJF, 6JJH, 6JJI and 6TQI.
Supplementary Material
ACKNOWLEDGEMENTS
Dara Akerewusi, who assisted in the crystallisations. Diamond Light Source supported this project under the mx12305 grant. We thank the Zeyuan Guan and Xuhui Yan for data collection, Ping Yin and Delin Zhang for technical support of the native data. We are grateful to the staff of National Center for Protein Sciences Shanghai (NCPSS) at the Shanghai Synchrotron Radiation Facility for assistance during data collection and at the Centre for Protein Research, Huazhong Agricultural University, for technical support. Dr. Julia Viladoms Claverol, for crystal growth and MAD data collections of the tel-i-motif structures while at UCL SoP.
Contributor Information
Yashu Zhang, State Key Laboratory of Agricultural Microbiology, Huazhong Agricultural University, Wuhan 430070, China; College of Plant Science and Technology, Huazhong Agricultural University, Wuhan 430070, China; College of Science, Huazhong Agricultural University, Wuhan 430070, China.
Kamel El Omari, Diamond Light Source, Harwell Science and Innovation Campus, Chilton, Didcot OX11 0DE, UK.
Ramona Duman, Diamond Light Source, Harwell Science and Innovation Campus, Chilton, Didcot OX11 0DE, UK.
Sisi Liu, State Key Laboratory of Agricultural Microbiology, Huazhong Agricultural University, Wuhan 430070, China; College of Science, Huazhong Agricultural University, Wuhan 430070, China.
Shozeb Haider, UCL School of Pharmacy, University College London, London WC1N 1AX, UK.
Armin Wagner, Diamond Light Source, Harwell Science and Innovation Campus, Chilton, Didcot OX11 0DE, UK.
Gary N Parkinson, UCL School of Pharmacy, University College London, London WC1N 1AX, UK.
Dengguo Wei, State Key Laboratory of Agricultural Microbiology, Huazhong Agricultural University, Wuhan 430070, China; College of Science, Huazhong Agricultural University, Wuhan 430070, China.
SUPPLEMENTARY DATA
Supplementary Data are available at NAR Online.
FUNDING
National Natural Science Foundation of China [31672558, 21732002, 21502060]; Huazhong Agricultural University Scientific & Technological Self-innovation Foundation [2015RC013, 2662017PY113, 2662015PY208]; Open fund of the State Key Laboratory of Bio-organic and Natural Products Chemistry, Chinese Academy of Sciences [SKLBNPC16343]. Funding for open access charge: National Natural Science Foundation of China [31672558].
Conflict of interest statement. None declared.
REFERENCES
- 1. Cammas A., Millevoi S.. RNA G-quadruplexes: emerging mechanisms in disease. Nucleic Acids Res. 2017; 45:1584–1595. [DOI] [PMC free article] [PubMed] [Google Scholar]
- 2. Niu K., Zhang X., Deng H., Wu F., Ren Y., Xiang H., Zheng S., Liu L., Huang L., Zeng B. et al.. BmILF and i-motif structure are involved in transcriptional regulation of BmPOUM2 in Bombyx mori. Nucleic Acids Res. 2018; 46:1710–1723. [DOI] [PMC free article] [PubMed] [Google Scholar]
- 3. Tucker W.O., Shum K.T., Tanner J.A.. G-quadruplex DNA aptamers and their ligands: structure, function and application. Curr. Pharm. Des. 2012; 18:2014–2026. [DOI] [PubMed] [Google Scholar]
- 4. Abou A.H., Garavis M., Gonzalez C., Damha M.J.. i-Motif DNA: structural features and significance to cell biology. Nucleic Acids Res. 2018; 46:8038–8056. [DOI] [PMC free article] [PubMed] [Google Scholar]
- 5. Wang Y., Patel D.J.. Solution structure of a parallel-stranded G-quadruplex DNA. J. Mol. Biol. 1993; 234:1171–1183. [DOI] [PubMed] [Google Scholar]
- 6. Lightfoot H.L., Hagen T., Tatum N.J., Hall J.. The diverse structural landscape of quadruplexes. FEBS Lett. 2019; 593:2083–2102. [DOI] [PubMed] [Google Scholar]
- 7. Day H.A., Pavlou P., Waller Z.A.. i-Motif DNA: structure, stability and targeting with ligands. Bioorg. Med. Chem. 2014; 22:4407–4418. [DOI] [PubMed] [Google Scholar]
- 8. Leroy J.L., Gueron M.. Solution structures of the i-motif tetramers of d(TCC), d(5methylCCT) and d(T5methylCC): novel NOE connections between amino protons and sugar protons. Structure. 1995; 3:101–120. [DOI] [PubMed] [Google Scholar]
- 9. Neidle S., Parkinson G.. Telomere maintenance as a target for anticancer drug discovery. Nat. Rev. Drug Discov. 2002; 1:383–393. [DOI] [PubMed] [Google Scholar]
- 10. Rhodes D., Lipps H.J.. G-quadruplexes and their regulatory roles in biology. Nucleic Acids Res. 2015; 43:8627–8637. [DOI] [PMC free article] [PubMed] [Google Scholar]
- 11. Paige J.S., Wu K.Y., Jaffrey S.R.. RNA mimics of green fluorescent protein. Science. 2011; 333:642–646. [DOI] [PMC free article] [PubMed] [Google Scholar]
- 12. Feng G., Luo C., Yi H., Yuan L., Lin B., Luo X., Hu X., Wang H., Lei C., Nie Z. et al.. DNA mimics of red fluorescent proteins (RFP) based on G-quadruplex-confined synthetic RFP chromophores. Nucleic Acids Res. 2017; 45:10380–10392. [DOI] [PMC free article] [PubMed] [Google Scholar]
- 13. Neubacher S., Hennig S.. RNA Structure and Cellular Applications of Fluorescent Light-Up Aptamers. Angew. Chem. Int. Ed. Engl. 2019; 58:1266–1279. [DOI] [PMC free article] [PubMed] [Google Scholar]
- 14. Zhai Q., Gao C., Ding J., Zhang Y., Islam B., Lan W., Hou H., Deng H., Li J., Hu Z. et al.. Selective recognition of c-MYC Pu22 G-quadruplex by a fluorescent probe. Nucleic Acids Res. 2019; 47:2190–2204. [DOI] [PMC free article] [PubMed] [Google Scholar]
- 15. Dvorkin S.A., Karsisiotis A.I., Webba D.S.M.. Encoding canonical DNA quadruplex structure. Sci Adv. 2018; 4:t3007. [DOI] [PMC free article] [PubMed] [Google Scholar]
- 16. Wagner A., Duman R., Henderson K., Mykhaylyk V.. In-vacuum long-wavelength macromolecular crystallography. Acta Crystallogr D Struct Biol. 2016; 72:430–439. [DOI] [PMC free article] [PubMed] [Google Scholar]
- 17. Trachman R.J., Demeshkina N.A., Lau M.W.L., Panchapakesan S.S.S., Jeng S.C.Y., Unrau P.J., Ferré-D’Amaré A.R.. Structural basis for high-affinity fluorophore binding and activation by RNA Mango. Nat. Chem. Biol. 2017; 13:807–813. [DOI] [PMC free article] [PubMed] [Google Scholar]
- 18. Egli M., Pallan P.S.. Insights from crystallographic studies into the structural and pairing properties of nucleic acid analogs and chemically modified DNA and RNA oligonucleotides. Annu. Rev. Biophys. Biomol. Struct. 2007; 36:281–305. [DOI] [PubMed] [Google Scholar]
- 19. Campbell N.H., Parkinson G.N.. Crystallographic studies of quadruplex nucleic acids. Methods. 2007; 43:252–263. [DOI] [PubMed] [Google Scholar]
- 20. Batey R.T., Kieft J.S.. Soaking hexammine cations into RNA crystals to obtain derivatives for phasing diffraction Data. Methods Mol. Biol. 2016; 1320:219–232. [DOI] [PMC free article] [PubMed] [Google Scholar]
- 21. Sen D., Gilbert W.. Guanine quartet structures. Methods Enzymol. 1992; 211:191–199. [DOI] [PubMed] [Google Scholar]
- 22. Langan P.S., Vandavasi V.G., Weiss K.L., Afonine P.V., El Omari K., Duman R., Wagner A., Coates L.. Anomalous X-ray diffraction studies of ion transport in K+ channels. Nat. Commun. 2018; 9:4540. [DOI] [PMC free article] [PubMed] [Google Scholar]
- 23. Rozov A., Khusainov I., El O.K., Duman R., Mykhaylyk V., Yusupov M., Westhof E., Wagner A., Yusupova G.. Importance of potassium ions for ribosome structure and function revealed by long-wavelength X-ray diffraction. Nat. Commun. 2019; 10:2519. [DOI] [PMC free article] [PubMed] [Google Scholar]
- 24. Zhang Y.S., Liu S.S., Jiang H., Deng H., Dong C., Shen W., Chen H.F., Gao C., Xiao S.B., Liu Z.F. et al.. G2-quadruplex in the 3′UTR of IE180 regulates Pseudorabies Virus replication by enhancing gene expression. Rna Biol. 2020; 17:816–827. [DOI] [PMC free article] [PubMed] [Google Scholar]
- 25. Viladoms J., Parkinson G.N.. HELIX: a new modular nucleic acid crystallization screen. J. Appl. Crystallogr. 2014; 47:948–955. [Google Scholar]
- 26. Kabsch W. XDS. Acta Crystallogr. D. Biol. Crystallogr. 2010; 66:125–132. [DOI] [PMC free article] [PubMed] [Google Scholar]
- 27. Evans P.R., Murshudov G.N.. How good are my data and what is the resolution. Acta Crystallogr. D. Biol. Crystallogr. 2013; 69:1204–1214. [DOI] [PMC free article] [PubMed] [Google Scholar]
- 28. Pape T., Schneider T.R.. HKL2MAP: a graphical user interface for macromolecular phasing with SHELX programs. J. Appl. Crystallogr. 2004; 37:843–844. [Google Scholar]
- 29. Murshudov G.N., Vagin A.A., Dodson E.J.. Refinement of macromolecular structures by the maximum-likelihood method. Acta Crystallogr. D. Biol. Crystallogr. 1997; 53:240–255. [DOI] [PubMed] [Google Scholar]
- 30. Winn M.D., Ballard C.C., Cowtan K.D., Dodson E.J., Emsley P., Evans P.R., Keegan R.M., Krissinel E.B., Leslie A.G., McCoy A. et al.. Overview of the CCP4 suite and current developments. Acta Crystallogr. D. Biol. Crystallogr. 2011; 67:235–242. [DOI] [PMC free article] [PubMed] [Google Scholar]
- 31. Otwinowski Z., Minor W.. Processing of X-ray diffraction data collected in oscillation mode. Methods Enzymol. 1997; 276:307–326. [DOI] [PubMed] [Google Scholar]
- 32. Minor W., Cymborowski M., Otwinowski Z., Chruszcz M.. HKL-3000: the integration of data reduction and structure solution–from diffraction images to an initial model in minutes. Acta Crystallogr. D. Biol. Crystallogr. 2006; 62:859–866. [DOI] [PubMed] [Google Scholar]
- 33. McCoy A.J., Grosse-Kunstleve R.W., Adams P.D., Winn M.D., Storoni L.C., Read R.J.. Phaser crystallographic software. J. Appl. Crystallogr. 2007; 40:658–674. [DOI] [PMC free article] [PubMed] [Google Scholar]
- 34. Yuan S., Chan H., Filipek S., Vogel H.. PyMOL and Inkscape bridge the data and the data visualization. Structure. 2016; 24:2041–2042. [DOI] [PubMed] [Google Scholar]
- 35. Emsley P., Cowtan K.. Coot: model-building tools for molecular graphics. Acta Crystallogr. D. Biol. Crystallogr. 2004; 60:2126–2132. [DOI] [PubMed] [Google Scholar]
- 36. Sheldrick G.M. A short history of SHELX. Acta Crystallogr. A. 2008; 64:112–122. [DOI] [PubMed] [Google Scholar]
- 37. Terwilliger T.C., Adams P.D., Read R.J., McCoy A.J., Moriarty N.W., Grosse-Kunstleve R.W., Afonine P.V., Zwart P.H., Hung L.W.. Decision-making in structure solution using Bayesian estimates of map quality: the PHENIX AutoSol wizard. Acta Crystallogr. D. Biol. Crystallogr. 2009; 65:582–601. [DOI] [PMC free article] [PubMed] [Google Scholar]
- 38. Terwilliger T.C., Bunkoczi G., Hung L.W., Zwart P.H., Smith J.L., Akey D.L., Adams P.D.. Can I solve my structure by SAD phasing? Anomalous signal in SAD phasing. Acta Crystallogr. D Struct. Biol. 2016; 72:346–358. [DOI] [PMC free article] [PubMed] [Google Scholar]
- 39. Harp J.M., Pallan P.S., Egli M.. Phosphorus SAD phasing for nucleic acid structures: limitations and potential. Crystals. 2016; 6:125. [Google Scholar]
- 40. Qin M., Chen Z., Luo Q., Wen Y., Zhang N., Jiang H., Yang H.. Two-quartet G-quadruplexes formed by DNA sequences containing four contiguous GG runs. J. Phys. Chem. B. 2015; 119:3706–3713. [DOI] [PubMed] [Google Scholar]
- 41. Lu X.J., Olson W.K.. 3DNA: a versatile, integrated software system for the analysis, rebuilding and visualization of three-dimensional nucleic-acid structures. Nat. Protoc. 2008; 3:1213–1227. [DOI] [PMC free article] [PubMed] [Google Scholar]
- 42. Ray A., Panigrahi S., Bhattacharyya D.. A comparison of four different conformations adopted by human telomeric G-quadruplex using computer simulations. Biopolymers. 2016; 105:83–99. [DOI] [PubMed] [Google Scholar]
- 43. Fay M.M., Lyons S.M., Ivanov P.. RNA G-quadruplexes in biology: principles and molecular mechanisms. J. Mol. Biol. 2017; 429:2127–2147. [DOI] [PMC free article] [PubMed] [Google Scholar]
- 44. Cang X., Sponer J., Cheatham T.R.. Explaining the varied glycosidic conformational, G-tract length and sequence preferences for anti-parallel G-quadruplexes. Nucleic Acids Res. 2011; 39:4499–4512. [DOI] [PMC free article] [PubMed] [Google Scholar]
- 45. Kuryavyi V., Phan A.T., Patel D.J.. Solution structures of all parallel-stranded monomeric and dimeric G-quadruplex scaffolds of the human c-kit2 promoter. Nucleic Acids Res. 2010; 38:6757–6773. [DOI] [PMC free article] [PubMed] [Google Scholar]
- 46. Chu B., Zhang D., Hwang W., Paukstelis P.J.. Crystal structure of a tetrameric DNA Fold-Back quadruplex. J. Am. Chem. Soc. 2018; 140:16291–16298. [DOI] [PubMed] [Google Scholar]
- 47. Morris M.J., Wingate K.L., Silwal J., Leeper T.C., Basu S.. The porphyrin TmPyP4 unfolds the extremely stable G-quadruplex in MT3-MMP mRNA and alleviates its repressive effect to enhance translation in eukaryotic cells. Nucleic Acids Res. 2012; 40:4137–4145. [DOI] [PMC free article] [PubMed] [Google Scholar]
- 48. Zamiri B., Reddy K., Macgregor R.J., Pearson C.E.. TMPyP4 porphyrin distorts RNA G-quadruplex structures of the disease-associated r(GGGGCC)n repeat of the C9orf72 gene and blocks interaction of RNA-binding proteins. J. Biol. Chem. 2014; 289:4653–4659. [DOI] [PMC free article] [PubMed] [Google Scholar]
- 49. Yang D., Okamoto K.. Structural insights into G-quadruplexes: towards new anticancer drugs. Future Med Chem. 2010; 2:619–646. [DOI] [PMC free article] [PubMed] [Google Scholar]
- 50. Bielskute S., Plavec J., Podbevsek P.. Impact of oxidative lesions on the human telomeric G-Quadruplex. J. Am. Chem. Soc. 2019; 141:2594–2603. [DOI] [PMC free article] [PubMed] [Google Scholar]
- 51. Zeraati M., Langley D.B., Schofield P., Moye A.L., Rouet R., Hughes W.E., Bryan T.M., Dinger M.E., Christ D.. I-motif DNA structures are formed in the nuclei of human cells. Nat Chem. 2018; 10:631–637. [DOI] [PubMed] [Google Scholar]
- 52. Phan A.T., Gueron M., Leroy J.L.. The solution structure and internal motions of a fragment of the cytidine-rich strand of the human telomere. J. Mol. Biol. 2000; 299:123–144. [DOI] [PubMed] [Google Scholar]
- 53. Luo Z., Dauter M., Dauter Z.. Phosphates in the Z-DNA dodecamer are flexible, but their P-SAD signal is sufficient for structure solution. Acta Crystallogr. D. Biol. Crystallogr. 2014; 70:1790–1800. [DOI] [PMC free article] [PubMed] [Google Scholar]
- 54. Hurley L.H., Wheelhouse R.T., Sun D., Kerwin S.M., Salazar M., Fedoroff O.Y., Han F.X., Han H., Izbicka E., Von Hoff D.D.. G-quadruplexes as targets for drug design. Pharmacol. Ther. 2000; 85:141–158. [DOI] [PubMed] [Google Scholar]
- 55. Zheng X.H., Nie X., Liu H.Y., Fang Y.M., Zhao Y., Xia L.X.. TMPyP4 promotes cancer cell migration at low doses, but induces cell death at high doses. Sci. Rep. 2016; 6:26592. [DOI] [PMC free article] [PubMed] [Google Scholar]
- 56. Parkinson G.N., Ghosh R., Neidle S.. Structural basis for binding of porphyrin to human telomeres. Biochemistry-US. 2007; 46:2390–2397. [DOI] [PubMed] [Google Scholar]
- 57. Kim M.Y., Gleason-Guzman M., Izbicka E., Nishioka D., Hurley L.H.. The different biological effects of telomestatin and TMPyP4 can be attributed to their selectivity for interaction with intramolecular or intermolecular G-quadruplex structures. Cancer Res. 2003; 63:3247–3256. [PubMed] [Google Scholar]
Associated Data
This section collects any data citations, data availability statements, or supplementary materials included in this article.
Supplementary Materials
Data Availability Statement
PyMOL is an open source collaborative initiative available in the Schrodinger (https://pymol.org/2/). OriginPro is an open source collaborative initiative available in the OriginLab Corporation (https://www.originlab.com/). Atomic coordinates and structure factors for the reported crystal structures have been deposited with the Protein Data bank under accession numbers 6JJF, 6JJH, 6JJI and 6TQI.