

Abstract
Colon cancer is one of the most common malignancies causing death worldwide. It is well known that the cells of the tumor microenvironment contribute to the progression and prognosis of colon cancer. However, the gene alterations and potential remodeling mechanisms in the tumor microenvironment of colon cancer remain largely unknown. In this study, immune scores from the ESTIMATE algorithm were used to discriminate between patients with high or low immune-cell infiltration. There were 42 immune differentially expressed genes (DEGs) of prognostic value identified in this study. Among them, KCNJ5 is a key factor in promoting M2 macrophage recruitment and tumor immune infiltration in colon cancer. These findings may provide novel insights for decoding the complicated interplay between cancer cells and the tumor microenvironment as well as for developing new avenues for therapeutic intervention in colon cancer.
Keywords: KCNJ5, tumor microenvironment, M2 macrophages, colon cancer, TCGA
Graphical Abstract
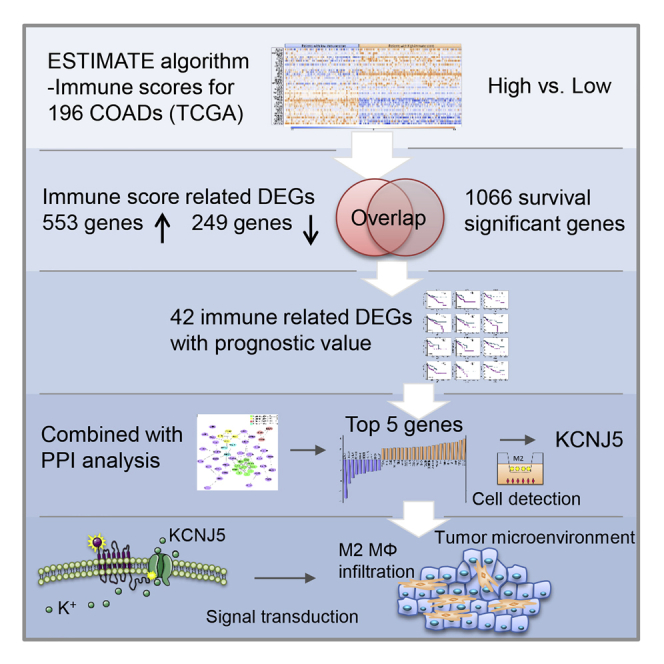
The complicated interplay between the tumor and its microenvironment is essential for colon cancer progression. Wang et al. provide a mechanistic insight into the immune microenvironment regulator KCNJ5 promoting M2 macrophage recruitment and tumor immune infiltration, presenting a novel possibility for decoding the regulation of immune cells in colon cancer.
Introduction
Colon cancer is one of the most common malignancies causing death worldwide. It results in approximately 148,000 new cases and 53,200 deaths per year in the United States according to Cancer Statistics 2020.1 The tumor microenvironment is essential in colon cancer progression, accounting for its roles in tumor metastasis, development, immune evasion, and resistance to therapies.2,3 The tumor microenvironment is composed of multiple subpopulations of myeloid-derived immune cells: dendritic cells, macrophages, neutrophils, myeloid-derived suppressor cells, and so on.4. Investigating the effects of tumor gene composition on the tumor microenvironment will help us decode the modulation of the microenvironment by the tumor.
To solve that problem, several algorithms have been developed for analyzing cell purity in the tumor microenvironment by applying gene-expression data.5,6 Among them, the estimation of stromal and immune cells in malignant tumor tissues using expression data (ESTIMATE) algorithm, which was compiled by Yoshihara et al.5, generates an immune cell infiltration-related score for each patient, which is calculated according to specific expression signatures for immune cells in malignant tumors.
Tumor-infiltrating immune cells are critical in promoting tumor progression and maintaining malignant phenotype.7,8 Our research team has proven that colon-cancer-associated macrophages confer chemoresistance and reduced oxaliplatin (LOHP)-induced apoptosis of colon cancer cells by secreting interleukin 6 (IL-6).9 Among all kinds of cancers, colon cancer is special because the colon harbors a large population of diverse immune cells that it uses to maintain the homeostasis of the gut. In colon cancer, those cells no longer have tight and well-organized modulation. Of those cells, M2 macrophages are particularly important in cell invasion, intravasation, and immune escape and in attenuating the cell attack from natural killer (NK) and T cells.10, 11, 12 According to gene expression profiles, there were 5 types of immune cells constituting a tumor-infiltration cell signature in colon cancer: resting memory CD4+ T cells; M0, M1, and M2 macrophages; and activated mast cells. However, M2 macrophages are the only cell type that significantly predicts overall survival and has a hazard ratio (HR) > 100 for colon cancer.13 Thus, we chose M2 macrophages for our cell model in our verification study.
To our knowledge, this is the first report that screens a series of microenvironments with the correlated genes for predicting poor prognosis in colon cancer and further identifies a key regulator, K+ inwardly rectifying channel subfamily J member 5 (KCNJ5), in the recruitment and infiltration of tumor-associated macrophages (TAMs). Revealing the modulation between a tumor and its microenvironment will provide novel insights that can be used to make prognostic assessments and to provide therapeutic regimens in the development of clinical interventions.
Results
Immune, Stromal, and ESTIMATE Scores Are Significantly Correlated with Colon Cancer Subtypes
The gene expression profiles, demographics, and clinical characteristics of 471 colon adenocarcinoma (COAD) samples (512 samples in all, 471 COADs; 41 adjacent non-cancerous tissues) were downloaded from The Cancer Genome Atlas Program (TCGA) (https://www.cancer.gov/about-nci/organization/ccg/research/structural-genomics/tcga) and University of California, Santa Cruz (UCSC) Xena (https://xenabrowser.net/datapages/) databases. The data were collected from 1998 to 2013. Among the cases, 220 (46.7%) were female, 249 (52.9%) were male, and 2 (0.4%) were of unknown gender. Clinicopathological analysis indicated that 399 (84.7%) cases were adenocarcinoma, 69 (14.7%) were mucinous adenocarcinoma, and 3 (0.6%) were epithelial neoplasms. Following the ESTIMATE algorithm, immune, stromal, and ESTIMATE scores were generated for 263 COAD cases (Figure 1). The immune scores were distributed between −1,131.91 and 1,893.64, stromal scores varied from −2,053.75 to 1,030.85, and ESTIMATE scores ranged from 3,143.54 to 2,924.49 (Figures 2A and 2B). The ESTIMATE algorithm provided information concerning tumor purity, stromal cell level, and the extent of infiltration by immune cells based on their expression profiles. For tumor staging, the immune scores were lower in stage I than they were in stage II, although not statistically significant (n.s., not significant; ∗p < 0.05, ∗∗p < 0.01) (Figure 2A). However, cases with adenocarcinoma subtype had the lowest immune scores (p = 0.0136). The rank orders across pathological subtypes were also listed as adenocarcinoma < mucinous adenocarcinoma < epithelial neoplasms for stromal (p = 0.0064) and ESTIMATE scores (p = 0.0043), suggesting that immune, stromal, and ESTIMATE scores are significant in discriminating pathological subtypes of colon cancer (Figure 2B).
Figure 1.

Flow Diagram of This Investigation
Figure 2.

Immune, Stromal, and ESTIMATE Scores Are Associated with Colon Cancer Subtypes and Overall Survival
(A) Violin plots for relationship among different scores and the TNM stage (n = 196). (B) Violin plots for correlation among different scores and colon cancer subtypes (n = 196). (C) Kaplan-Meier curves of the high and low scores of patients with colon cancer. Patients with colon cancer were categorized into high- or low-score groups according to their immune, stromal, and ESTIMATE scores. The median survival of the low immune score group was longer than that of high immune score group. Although it was not significant (p = 0.072) in the log-rank test, the immune score is available to predict those patients with poor prognoses. ns, not significant.
Moreover, we evaluated the potential association between overall survival and immune scores; 196 COAD cases with both immune scores and survival data were categorized to high- and low-score groups (high, score ≥ 0; low, score < 0). Kaplan-Meier curves depicted the median overall survival of the high immune score group as being longer than that of the low immune score group (1,965 days versus 1,910 days, p = 0.072 by log-rank test). In agreement, the lower stromal score group showed longer median overall survival in comparison to that of high stromal score group (2,513 days versus 1,385 days, p = 0.098), although it was not statistically significant. A similar survival curve was observed using the ESTIMATE scores (Figure 2C).
Differentiated Expression, Functional Enrichment, and PPI Analysis for Immune-Microenvironment-Related Gene Signatures in Colon Cancer
To assess the relationship between the global gene-expression profile and immune scores, the gene microarray data of 196 colon cancer cases were compared across high and low immune score groups. The hierarchical cluster heatmap indicated the expression profiles of the top 20 up- and downregulated genes in the high versus low immune scores group model (Figure 3A). Among all the differentially expressed genes (DEGs), 553 genes, including PRSS2, HIST1H1D, CCL25, CLEC2A, and NLRP4, showed evident upregulation, whereas 249 genes, such as CTNNA2, CALCA, and KCNE1B, exhibited marked downregulation (fold change [FC] > 2, p < 0.05). We further performed the subsequent analyses to illuminate the potential function of the immune-microenvironment-related DEGs (immune DEGs). The enrichment factor of GO and pathway analyses referred to the significance of specific functions. In the GO analysis, immune DEGs were notably enriched in 3 categories: (1) biological process (BP): antimicrobial humoral response (GO: 0019730), humoral immune response (GO: 0006959), and cell killing (GO: 0001906); (2) cellular component (CC): extracellular region (GO: 0005576) and extracellular space (GO: 0005615); and (3) molecular function (MF): serine-type endopeptidase activity (GO: 0004252). For the Kyoto Encyclopedia of Genes and Genomes (KEGG) pathway analysis, immune DEGs were significantly enriched in taste transduction, protein digestion and absorption, activation of matrix metalloproteinases, and G-protein-coupled receptor (GPCR) ligand binding (Figures 3B and 3C). Gene set enrichment analysis (GSEA) analysis mainly showed chemokine signaling and leukocyte trans-endothelial and tricarboxylic acid (TCA) cycle pathways (Figure 3D).
Figure 3.

DEGs, GO, KEGG, and GSEA Results for Immune Scores of Patients with Colon Cancer
(A) Hierarchical cluster profiles of immune DEGs in colon-cancer-discriminate patients with high immune scores from patients with low immune scores (low: n = 82, high: n = 114). Up- and downregulated genes are shown in orange and blue, respectively. (B) GO analysis of immune DEGs. The y axis refers to GO categories. The x axis shows the enrichment false discovery rate (FDR). (C) The KEGG pathway analysis of immune DEGs. The y axis refers to pathway terms. The x axis is the rich factor. (D) The major pathways in GSEA enrichment analyses.
To better study the interaction between these immune DEGs, we constructed a protein-protein interaction (PPI) network using STRING online tools (https://string-db.org/) and Cytoscape 3.7.1 software. The network was composed of 8 modules, including 194 nodes and 226 edges (Figures 4A and 4B). Average node degree was 2.33, and average local clustering coefficient was 0.405 (PPI enrichment, p < 1.0e−16). The top 4 significant modules were selected for the next analysis. In module 1, there were 46 edges and 9 nodes, such as TAS2R30, TAS2R31, TAS2R50, TAS2R60, INSL5, CCL25, CXCL13, DRD2, and CXCL9. INSL5 was the seed node. The MCODE_score of nodes in module 1 were all greater than 8. They had the most connections in the PPI network for immune DEGs. The expression FC of CCL25 in immune DEGs module 1 was the biggest, 8.80 (Figures 4C and 4D). In modules 1–4, several pivotal immune response genes occupied the core position of these modules containing CD8A, TLR8, HIST1H2AB, TNFSF13B, CSF3R, CXCL9, and MMP9. We evaluated the prognosis value of key genes with the highest degree of regulation in the gene network of immune DEGs and found it not statistically significant in overall survival (Figure S1). However, the function of these immune-microenvironment-related crucial genes deserves deep exploration. This finding might shed light on the role of taste-receptor genes INSL5 and DRD2 in the regulation of immune cell infiltration and deterioration in colon cancer.
Figure 4.

The PPI Network Analysis of Immune DEGs in Colon Cancer
(A) The PPI Network analysis using STRING online tools. Modules 1–4 have been circled in rose red. (B) PPI analysis by Cytoscape 3.7.1 software. Interacting genes with the highest M_CODE scores were clustered in module 1, which is indicated as red round nodes. Modules 2–6 are shown in green, cyan, purple, dark green, and pink nodes, respectively. (C) The characteristics of the genes in module 1. (D) The expression FC (fold change) of genes in module 1.
Venn Diagram and Advanced Analysis of Immune DEGs of Prognostic Value
To further obtain immune-cell-associated genes of prognostic value, we performed intersection set analysis of immune DEGs and survival significant genes: (1) 802 immune DEGs were screened according to the criterion of FC > 2 (p > 0.05), in the comparison of high- versus low-immune-score group; (2) in batch survival-data analysis, there were 1,066 survival significant genes selected from 19,645 mRNA genes in microarray raw data (Figure 5A); and (3) a total of 42 immune DEGs were identified to significantly predict the survival for patients with colon cancer (Table 1).
Figure 5.

GO, KEGG, and PPI Network Analyses for Immune DEGs of Prognostic Value in Colon Cancer
(A) Venn diagram showing the number of intersecting genes from all the immune DEGs and the survival-significant genes in colon cancer. (B) Circle plot depicting the important signal pathways associated with those genes. (C) GO analysis for immune DEGs of prognostic value. The y axis refers to GO categories. The x axis is enrichment FDR. (D) KEGG pathway analysis. The y axis refers to pathway terms. The x axis is the rich factor. (E) PPI Network analysis using STRING online tools. Modules 1–4 have been circled in rose red. (F) PPI analysis by Cytoscape 3.7.1 software. Modules 1–4 are shown in green, yellow, pink, and cyan, respectively.
Table 1.
The 42 DEGs Found to Be Significant in Overall Survival from Colon Cancer (as Identified from TCGA)
| Gene ID | HR exp(coefficient) | Coefficient | 95% CI (Lower) | 95% CI (Upper) | Z | p Valuea |
|---|---|---|---|---|---|---|
| AC011462.1 | 1.355770861 | 0.30437 | 0.090795 | 0.517945 | 2.793183 | 0.005219 |
| APOE | 1.128330911 | 0.120739 | 0.011963 | 0.229516 | 2.17552 | 0.029591 |
| CALB1 | 1.086615399 | 0.083068 | 0.024556 | 0.141579 | 2.782529 | 0.005394 |
| CCNA1 | 1.183650808 | 0.168604 | 0.01039 | 0.326817 | 2.088674 | 0.036737 |
| CILP | 1.092210577 | 0.088204 | 0.010193 | 0.166214 | 2.216067 | 0.026687 |
| CTAG2 | 1.112128275 | 0.106276 | 0.001813 | 0.210738 | 1.993975 | 0.046155 |
| CX3CL1 | 1.199095269 | 0.181567 | 0.041988 | 0.321146 | 2.549561 | 0.010786 |
| EPHB6 | 1.112545586 | 0.106651 | 0.012878 | 0.200423 | 2.229134 | 0.025805 |
| GJA3 | 1.166885834 | 0.154339 | 0.042959 | 0.265718 | 2.715918 | 0.006609 |
| GPR83 | 1.12192511 | 0.115046 | 0.001274 | 0.228818 | 1.981916 | 0.047489 |
| HAMP | 1.210844647 | 0.191318 | 0.066206 | 0.31643 | 2.997126 | 0.002725 |
| HIST1H3A | 1.126551555 | 0.119161 | 0.00612 | 0.232203 | 2.066072 | 0.038822 |
| HOXC13 | 1.16659893 | 0.154093 | 0.065426 | 0.242759 | 3.406215 | 6.59E-04 |
| HOXD10 | 1.101383793 | 0.096567 | 0.007384 | 0.185751 | 2.122237 | 0.033818 |
| INSL4 | 0.764526501 | −0.2685 | −0.50357 | −0.03343 | −2.23871 | 0.025175 |
| IRX4 | 1.298357205 | 0.2611 | 0.086567 | 0.435632 | 2.9321 | 0.003367 |
| ISM2 | 1.084043284 | 0.080698 | 8.21E-04 | 0.160574 | 1.980114 | 0.047691 |
| KCNJ5 | 1.144945763 | 0.135357 | 0.017241 | 0.253474 | 2.246053 | 0.024701 |
| KCNT1 | 1.144981767 | 0.135389 | 0.043124 | 0.227654 | 2.876032 | 0.004027 |
| MAGEA10 | 1.176557676 | 0.162593 | 0.020828 | 0.304358 | 2.247922 | 0.024581 |
| MYH7B | 1.120944819 | 0.114172 | 0.005026 | 0.223318 | 2.050216 | 0.040343 |
| NEUROD2 | 1.163204955 | 0.151179 | 0.012337 | 0.290021 | 2.134118 | 0.032833 |
| NFATC1 | 1.201414941 | 0.1835 | 0.037279 | 0.329721 | 2.459663 | 0.013907 |
| OSR1 | 1.111573394 | 0.105776 | 5.45E-04 | 0.211008 | 1.970118 | 0.048825 |
| PAGE1 | 1.138114679 | 0.129373 | 0.029835 | 0.228911 | 2.547428 | 0.010852 |
| PKD2L1 | 1.197337769 | 0.180101 | 0.027205 | 0.332996 | 2.308711 | 0.02096 |
| PNLDC1 | 1.215088332 | 0.194817 | 0.057797 | 0.331837 | 2.786704 | 0.005325 |
| PRSS48 | 1.109188573 | 0.103629 | 0.010855 | 0.196403 | 2.189281 | 0.028576 |
| RAMP1 | 1.101516293 | 0.096688 | 0.008051 | 0.185324 | 2.137996 | 0.032517 |
| S100A12 | 0.852534321 | −0.15954 | −0.28684 | −0.03224 | −2.45635 | 0.014035 |
| SFRP2 | 1.097608883 | 0.093134 | 0.021851 | 0.164417 | 2.560759 | 0.010444 |
| SLC11A1 | 1.153395066 | 0.14271 | 0.017599 | 0.26782 | 2.235671 | 0.025373 |
| SLC6A15 | 1.141758607 | 0.13257 | 0.009892 | 0.255247 | 2.118006 | 0.034175 |
| SLC7A10 | 1.115914874 | 0.109675 | 4.10E-04 | 0.218939 | 1.967326 | 0.049146 |
| SPINK4 | 0.939319215 | −0.0626 | −0.12165 | −0.00355 | −2.07792 | 0.037717 |
| TMIGD3 | 1.180937342 | 0.166308 | 0.016206 | 0.316411 | 2.171568 | 0.029888 |
| TNNT1 | 1.086090701 | 0.082585 | 0.007399 | 0.15777 | 2.152846 | 0.031331 |
| TRIB2 | 1.168281544 | 0.155534 | 0.004844 | 0.306224 | 2.022968 | 0.043076 |
| VAX1 | 1.14237505 | 0.133109 | 0.03223 | 0.233989 | 2.586149 | 0.009706 |
| WIPF3 | 1.151464922 | 0.141035 | 0.042121 | 0.239948 | 2.794598 | 0.005196 |
| WNT3A | 1.207475225 | 0.188532 | 0.011685 | 0.365379 | 2.089462 | 0.036666 |
| ZFR2 | 1.33253373 | 0.287082 | 0.134717 | 0.439447 | 3.692909 | 2.22E-04 |
Abbreviations: 95% CI, 95% confidence interval; HR, hazard ratio.
All results were significant at p < 0.05.
Next, we focused on the potential function of the 42 intersection genes. To clarify that issue, we conducted advanced analysis. Pathway analysis showed that the 42 genes were mainly enriched in cellular senescence and p53 and T cell receptor signaling (Figures 5B and 5D). In the GO report, the 3 enriched categories were (1) BP (G1/S transition of mitotic cell cycle [GO: 0000082], positive regulation of endocytosis [GO: 0045807], and macromolecule metabolic process [GO: 0010604]); (2) CC (cyclin-dependent protein kinase holoenzyme [GO: 0000307], low-density lipoprotein particle [GO: 0034362], PCNA-p21 complex [GO: 0070557]; and (3) MF (cyclin-dependent serine/threonine kinase [GO: 0016538], calcitonin gene-related peptide activity [GO: 0001635], and G-protein-coupled peptide receptor activity [GO:0008528]) (Figure 5C).
Moreover, the PPI network analysis indicated the protein interactions of the 42 intersection genes. There were 4 dominating modules, with 34 nodes and 53 edges (Figures 5E and 5F). Average node degree was 4.55. Average local clustering coefficient was 0.604 (PPI enrichment, p = 5.43e−09). For module 1, there were 48 edges and 10 nodes, such as CCNA1, CDKN1A, CCND1, CCND2, and CCNE1. CCNA1 was the seed node. The MCODE_score of them were greater than 8. In modules 1–4, the key immune response genes that occupied the core positions of the modules were CCNA1, APOE, GPR83, and NFATC1.
Association of Expression of 42 Intersection Genes and Overall Survival
To depict the potential roles of 42 intersection genes in overall survival, the HR and P values were calculated (Table 1). The Kaplan-Meier survival curves for several important genes were plotted in Figure 6. Among the 42 immune DEGs of prognostic value (IDPVs), 39 immune-microenvironment-related genes significantly predicted poor survival in a log-rank test (HR > 1, p < 0.05). For instance, the high expression of CCNA1, CX3CL1, NFATC1, KCNJ5, EPHB6, and CLIP significantly predicted poor overall survival of patients with colon cancer.
Figure 6.

Kaplan Meier Analyses of Patients with Colon Cancer and Low or High Expression Levels for Several Immune DEGs of Prognosis Value
KCNJ5 Identified as a Key Factor of Tumor Microenvironment in Colon Cancer
To confirm the key factor involved in tumor immune infiltration, we selected 5 important genes for the PPI analysis among the top 20 upregulated IDPVs to perform advanced study. These genes were CX3CL1, CCNA1, NFATC1, KCNJ5, and SFRP2. To verify the gene expression, we induced M2 macrophages using phorbol 12-myristate-13-acetate (PMA), IL-4, and IL-13. The M2 marker CD206 labeling was greater than 80% in induced M2 macrophages (Figures 7B, 7C, and 7E). In HCT-8 cells co-cultured with M2 macrophages, KCNJ5 was the most highly expressed among the 5 key genes in quantitative real-time PCR examination (Figures 7A and 7D; Table 2). Then, we chose KCNJ5 for functional tests. KCNJ5 is also known as Kir3.4 and GIRK4. It is a G-protein-coupling signal-transduction molecule. The somatic mutation in KCNJ5 has been implicated in the pathogenesis process of familial adenomatous polyposis.14 Per our study, KCNJ5 might have a pivotal role in tumor immune infiltration and, thus, tumor progression. To explore the chemotaxis effect of KCNJ5, we performed the transwell assay. As presented in Figures 7F and 7G, the vertical migration ability of M2 macrophages was significantly dampened after co-cultured with KCNJ5-depleted HCT-8 cells, compared with the control (siKCNJ5-1/siKCNJ5-1 versus negative control [NC]: 189 ± 16/99 ± 29 versus 489 ± 34 cells, p = 0.000/0.000). In addition, we used a chemotaxis test to confirm the promoting role of KCNJ5 in M2 macrophages recruitment. We constructed a cell chemotaxis model using FALCON 8.0 μm pore size cell chambers (353097, Corning Life Sciences, Corning, NY, USA). As shown in Figure 7I, it can be put in a corner of the well, away from the center. HCT-8 cells were added, and the M2 macrophages were seeded in the opposite corner. As a result, the recruitment of M2 macrophages was notably reduced in siKCNJ5 groups (siKCNJ5-1/siKCNJ5-1 versus NC: 67 ± 12/69 ± 14 versus 126 ± 16 cells, p = 0.006/0.009) (Figures 7I and 7H). Collectively, these findings revealed that KCNJ5 is a key regulator in M2 macrophages recruitment and tumor-microenvironment remodeling for colon cancer.
Figure 7.

KCNJ5 Promotes Chemotaxis of M2 Macrophages to Colon Cancer Cells In Vitro
(A) The corresponding FCs of immune DEGs of prognostic value (IDPV). (B) Schematic model of M2 macrophage induction system. (C) The morphological differences in THP-1, M0, and M2 cells under a light field. Scale bar: 100 μm. (D) qPCR analysis of several IDPVs pivotal in PPI analysis. (E) Cell-marker identification of M2 macrophages by flow cytometry. (F) Quantitative analysis of transwell cells. (G) Transwell assay of M2 macrophages to HCT-8 cells transfected with NC or siKCNJ5. Scale bar: 200 μm. (H) Quantification of recruitment cells. (I) Left: schematic model for chemotaxis of M2 macrophages to HCT-8 cells. Right: representative fluorescence-microscopy graphs for chemotaxis of M2 macrophages to HCT-8 cells transfected with NC or siKCNJ5. Red, Dill-prestained M2 macrophages. Scale bar: 100 μm. ∗p < 0.05, ∗∗p < 0.01.
Table 2.
Primers of Immune DEGs of Prognostic Value in Real-Time PCR Assay
| Gene | Species | Primer Sequence | Amplicon size (bp) |
|---|---|---|---|
| 18S | Human | Forward: 5′-GTAACCCGTTGAACCCCATT-3′ | 151 |
| Reverse: 5′-CCATCCAATCGGTAGTAGCG-3′ | |||
| CX3CL1 | Human | Forward: 5′-CACCACGGTGTGACGAAATG-3′ | 245 |
| Reverse: 5′-ATCTGCTTCTCGAAGGTGCC-3′ | |||
| CCNA1 | Human | Forward: 5′-GTCACTTGGGATGGAGACCG-3′ | 123 |
| Reverse: 5′-TGCTGCTGGAAGACGAAATCT-3′ | |||
| KCNJ5 | Human | Forward: 5′-CGATCTCAACAACATCCCAGC-3′ | 265 |
| Reverse: 5′-CAGGGTGGTGAAGAGGTCAC-3′ | |||
| NFATC1 | Human | Forward: 5′-AGACTCAGAGGCTCCGAAC-3′ | 157 |
| Reverse: 5′-GAAAGTCATCGAGGGGCGTG-3′ | |||
| SFRP2 | Human | Forward: 5′-GGCTCAAAGACAGCTTGCAG-3′ | 242 |
| Reverse: 5′-ATCCCGGAGCAGAAATGGTC-3′ |
KCNJ5 Promote M2 Macrophages Infiltration and Xenograft Growth In Vivo
An animal model was generated to investigate the KCNJ5 tumor-immune infiltration in vivo. Nude mice were classified into 2 groups bearing scramble or shKCNJ5 lentivirus-transduced colon cancer cells xenografts, respectively. In immunofluorescence slides of the xenograft tumor, M2 macrophages infiltration was obviously abrogated by KCNJ5 depletion (shKCNJ5 versus Scramble: 9757 ± 1674 versus 27038 ± 1342 pixels, p = 0.000) (Figures 8D and 8E). The flow cytometry data further manifested that shKCNJ5 dramatically decrease the percentage of infiltrated M2 macrophages in xenograft tumor (shKCNJ5 versus Scramble: 18.2 ± 0.85 versus 7.0 ± 0.49%, p = 0.000) (Figures 8F and 8G). Moreover, shKCNJ5 also inhibited the growth of xenograft tumors obviously (30th day: shKCNJ5 versus Scramble: 1529.4 ± 169.3 versus 3465.0 ± 350.4, p = 0.001) (Figures 8A and 8C). However, no significant alteration was observed in body weights between the 2 groups (Figure 8B). These data consolidated the regulation role of KCNJ5 on M2 macrophages infiltration and tumor microenvironment remodeling in vivo.
Figure 8.

KCNJ5 Facilitates M2 Macrophage Recruitment and Tumor Growth In Vivo
(A) Representative images of nude mice xenograft tumors using HCT-8 cells transduced with scramble or shKCNJ5 lentivirus. (B) Body weights of xenograft mice models in scramble or shKCNJ5 groups. (C) Tumor volumes in scramble or shKCNJ5 groups. (D) Representative fluorescence-microscopy graphs of immunostaining for CD206 in specimens from xenograft tumors in scramble or shKCNJ5 groups. Red, CD206; blue, DAPI. Scale bar: 100 μm. (E) Quantitative comparison of CD206 average integral optical density of xenograft tumors in scramble or shKCNJ5 groups. (F) Quantification of infiltrated M2 macrophages percentage. (G) The flow cytometry detection of M2 macrophages percentage in different xenograft tumors: (a) side and forward scatter (SSC/FSC) scatterplot for cell gating; (b) negative control, (c) scramble, and (d) shKCNJ5. ∗p < 0.05, ∗∗p < 0.01; ns, not significant.
Discussion
In this study, we identified a tumor microenvironment regulating factor KCNJ5 which contributed to colon cancer overall survival via TCGA database mining and experimental verification.
First, using ESTIMATE algorithm, we generated immune scores for 263 COAD patients and evaluated the potential association between overall survival and immune scores. In Kaplan-Meier curves between high and low immune score group, the result is not significant. Because so many data dots were aggregated in the patients’ section with follow-up time less than 90 days. These dots affected the true role of immune scores on patients’ survival. After removing these cases, the survival analyses showed a significant difference between the high and low score group (p = 0.035).
According to the global gene expression profile comparison in 196 patients with high versus low immune scores, we extracted 802 genes involved in immune infiltration of colon cancer. Thus, the 802 DEGs were subjected to GO and KEGG pathway analysis. Most genes, such as CCL25, CLEC2A, NLRP4, CTNNA2, CALCA, and KCNE1B were reported participating in tumor microenvironment modulating15, 16, 17, 18. Consistently, GO term also revealed that these genes were interacted with immune cells in remodeling immune microenvironment of colon cancer: Antimicrobial humoral response (GO: 0019730), humoral immune response (GO: 0006959), cell killing (GO: 0001906). So as KEGG pathway analysis: activation of matrix metalloproteinases, and GPCR ligand binding. GSEA analysis: chemokine signaling, leukocyte trans-endothelial, and TCA cycle pathways (Figures 3B–3D).
Then, we performed intersection set analysis of 802 immune DEGs and 1066 survival significant genes, which were screened from 19645 mRNA genes in microarray raw data using batch overall survival analysis (Figure 5A). Finally, a total of 42 IDPVs were identified (Table 1). Among them, 39 genes significantly predicted poor survival for colon cancer patients (CCNA1, CX3CL1, NFATC1, KCNJ5, EPHB6, CLIP etc.). But how about the potential function of the 42 IDPVs? With GO report, there were G1/S transition of mitotic cell cycle (GO:0000082), Macromolecule metabolic process (GO:0010604), G protein-coupled peptide receptor activity (GO:0008528) and so on. Pathway enrichment was primarily in cellular senescence and p53 and T cell receptor signaling (Figures 5B–5D). Furthermore, we constructed 4 PPI modules of 42 IDPVs, with 34 nodes and 53 edges (Figures 5E and 5F). Highly interplayed nodes in modules center, including CCNA1, APOE, GPR83, and NFATC1, were involved in regulating immune cells, evading immunosurveillance, increasing intrinsic oncogenic and invasive potential for tumors19, 20, 21, 22, 23, 24. To our surprise, GPR83 is the cell surface marker of T reg. Its role in altering immune cell infiltration of colon cancer might be another interesting story. The 42 IDPVs were composed of 24 upregulated and 18 downregulated genes. We selected 5 key genes in PPI analysis among the top 20 upregulated IDPVs to perform experimental verification. These genes were CX3CL1, CCNA1, NFATC1, KCNJ5, and SFRP2.
In verification of the gene expression, we observed that KCNJ5 cells were the highest expressed in M2 macrophages co-cultured with colon cancer cells among the 5 key genes. We, therefore, chose KCNJ5 for a functional test. KCNJ5 is a G-protein-coupling signal transduction factor. The somatic mutation in KCNJ5 is associated with the pathogenesis of familial adenomatous polyposis.14 Adenomatous polyposis predisposes patients toward colon cancer. Combined with our former analysis and prediction, we found that KCNJ5 is an IDPV in colon cancer and might be a pivotal factor in tumor immune infiltration and tumor progression. Next, in a transwell assay, we found that KCNJ5 was positive in its migration of M2 macrophages to colon cancer cells. Simultaneously, a similar phenomenon was observed in a chemotaxis test (Figures 8F–8I). These findings consolidated the role of KCNJ5 in promoting M2 macrophages recruitment, suggesting KCNJ5 might be a key regulator in tumor-microenvironment remodeling for colon cancer.
Another intriguing finding was the function of KCNJ5 in vivo. In the xenograft tumor, M2 macrophage infiltration was remarkably abrogated by KCNJ5 knockdown. Flow cytometry data further authenticated the decreased percentage of infiltrated M2 macrophages (Figures 8D–8G). Of note, that decrease seemed to have a blocking effect on tumor proliferation (Figures 8A and 8C). TAMs have complicated roles in regulating cancer progressiveness.21 Our study confirms the relationship between KCNJ5 and TAMs in facilitating tumor immune infiltration and progressiveness. KCNJ5, a G-protein-coupling K+ inwardly rectifying channel protein, transduces molecular signals by affecting the direction and concentration of K+ and Ga2+ flows, thus facilitating the phosphorylation of PKC,25 which may further enhance chemotactic factors production and M2 macrophages recruitment, significantly accelerating the deterioration of the tumor microenvironment and the progression of colon cancer (Figure 9).
Figure 9.

Schematic Diagram Indicating the Potential Role of KCNJ5 in Modulating the Tumor Microenvironment of Colon Cancer
(A–C) KCNJ5 might promote phospholipase C (PLC) activation by affecting the inwardly rectifying K+ channel, thus, facilitating the binding of PKC and diacylglycerol (DAG), and PKC phosphorylation. Subsequently, it further enhances relative chemotactic-factor production and M2 macrophage recruitment, which significantly accelerates the deterioration of the tumor microenvironment and the progression of colon cancer.
In conclusion, we demonstrated, for the first time, that KCNJ5 functions as a tumor immune infiltration regulator and a tumor promoter in colon cancer. We extracted a list of immune-microenvironment-related genes of prognostic value for colon cancer via TCGA data mining and the ESTIMATE algorithm. In addition, we identified a key factor—KCNJ5—and confirmed the influence of KCNJ5 on M2 macrophages infiltration and tumor microenvironment remodeling.
Limitations of Study
The detailed mechanisms for KCNJ5-regulated inward K+ flux modulating immune cells need to be verified. For instance, (1) the relation between KCNJ5-regulated inward K+ flux and proinflammatory or anti-inflammatory factor generation should be evaluated in further studies, using patch clamp technique and ELISA, among others; and (2) a K+ flux antagonist should be used to demonstrate the modulation role of KCNJ5 on macrophages infiltration.
These findings may provide novel insights for decoding the complicated interaction between cancer cells and the tumor microenvironment. The study will also be of benefit in the surveillance and prognostic prediction of colon cancer as well as in targeting therapy development for the malignancy. Therefore, the correlation of KCNJ5 and lymphocyte recruitment in the progression of colon cancer is encouraging enough to warrant advanced exploration.
Materials and Methods
Data Extraction
The gene expression profiles and clinical information, including gender, age, histopathological type, and survival data of patients with COAD were downloaded from The Cancer Genome Atlas Program (TCGA) (https://www.cancer.gov/about-nci/organization/ccg/research/structural-genomics/tcga) and the UCSC Xena (https://xenabrowser.net/datapages/) databases. The RNA sequencing platform was from Illumina (July 19, 2019; Illumina, San Diego, CA, USA). Data are presented as log2(count + 1). Immune, stromal, and ESTIMATE scores for patients with COAD were generated according to the ESTIMATE algorithm5 (https://bioinformatics.mdanderson.org/estimate/rpackage.html).
Identification of DEGs
DEG calculation was conducted using R software (https://www.r-project.org/) and edgeR package (http://www.bioconductor.org/packages/release/bioc/html/edgeR.html). The cutoff for screening of DEGs was FC ≥ 2, p < 0.05.
Enrichment Analysis and PPI Network Construction of DEGs
GO term and KEGG pathway-enrichment analyses were run online using the STRING database (https://string-db.org/). These protein-interaction data were imported to Cytoscape 3.7.1 for PPI network construction. Molecular complex detection (M_CODE) scores were evaluated by searching closely connected gene clusters via a topological algorithm.
Transwell Assay and Chemotaxis Test
On day 1, 1 × 10⁴ HCT-8 cells (colon cancer cell line ordered from ATCC [Manassas, VA, USA]) were transfected with NC or siKCNJ5 and seeded in lower chamber. On day 2, 1 × 10³ M2 macrophages in 100 μL of complete DMEM were added to the upper insert (8.0 μm pore; 24-well Transwell, Corning). With incubating at 37°C and 5% CO2 for 24 h, the non-migrated cells in the insert were wiped away, and the migrated cells were stained with DAPI for 30 min. The transwell membranes were removed and pasted on microslides. Finally, the fluorescence graphs from the slides were captured with an Upright metallurgical microscope (BX53, Olympus, Tokyo, Japan). Each experiment was conducted in triplicate. The cell chemotaxis model was constructed with FALCON (8.0 μm pore size cell chambers, 353097). The chamber loaded with HCT-8 cells was put in a corner of the lower chamber, whereas 5 × 10³ M2 macrophages were seeded in the opposite corner (Figure 7I). Cell chemotaxis potential on the flat surface was detected using this model. First, M2 macrophages were marked with the bioactive fluorescence probe, Dil (Beyotime, Shanghai, China); 24 h later, the images of chemotactic accumulation of M2 macrophages to HCT-8 cells were observed with the Upright metallurgical microscope. Cell counting was performed with ImageJ software (NIH, Bethesda, MD, USA).
Xenograft Tumor Model Construction for Colon Cancer Cells
A total of 1 × 10⁷ scramble or shKCNJ5 lentivirus stably transduced HCT-8 cells were injected into the flank of 8-week-old nude mice (n = 9 for each group). All mice were measured for body weight, tumor volume, and activity once every 5 days. Male nude mice were ordered from the laboratory animal center of Soochow University (Soochow, China). The animal experiment was approved by the ethics committee of the Affiliated Hospital of Jiangnan University. Lentivirus plasmids, including pCDH-CMV-MCS-EF1-copGFP, psPAX2, and pMD2.G, were purchased from System Biosciences (System Biosciences, Mountain View, CA, USA). The packaging, purification, and transduction of lentivirus were performed according to the manufacturer’s instructions. Animal experiments were approved by Institutional Review Board (IRB), Affiliated Hospital of Jiangnan University.
Immunofluorescence Characterization of Xenograft Tumors
To assess the M2 macrophage infiltration of xenograft tumors, frozen microtome sections (5 μm) were prepared for immunofluorescence analysis. They were fixed, washed, and blocked with PBS with 1% BSA and 3% fetal bovine serum (FBS). Sections were immunostained with a CD206 antibody (1:500, Abcam, Cambridge, UK) and goat anti-mouse IgG heavy and light chain (H&L; 1:1,000, Alexa Fluor 594, Abcam). Fluorescence was photographed on the Upright metallurgical microscope (Olympus BX53) and quantitatively analyzed for average integral optical density with ImageJ.
Flow Cytometry for Cell Marker Assessment
Cells in different groups were digested with 0.25% trypsin, washed with PBS, and fixed with 70% cold ethanol for 2 h. Then, the cells were resuspended in 300 μL of PBS and stained with Alexa-Fluor-488-labeled CD206 antibody (1:100, Santa Cruz Biotechnology, Santa Cruz, CA, USA) for 30 min (in the dark at 37°C). After washing and resuspension, cells were detected with a FACSCanto II flow cytometer (BD Biosciences, San Jose, CA, USA). M2 macrophage percentage was calculated with FlowJo 7.6 software (Tree Star, Ashland, OR, USA).
Statistical Analysis
Data are presented as means ± SD. Differences between groups were evaluated by Student’s t test (2 groups) or one-way ANOVA. All the statistical tests were two-sided and conducted with SPSS software (version 18.0, IBM, Armonk, NY, USA). Statistical significance was set at p < 0.05.
Author Contributions
Ying Wang and Yu Wang designed the study. Ying Wang and Y.H. Liu performed the bioinformatic analyses and experiments. C.H. Xu provided assistance for clinical information analysis. Ying Wang, Yu Wang, and Z.H. Huang wrote the manuscript and graphed the figures. All authors reviewed and proofed the final manuscript.
Conflicts of Interest
The authors have no competing interests.
Acknowledgments
This work is supported by grants from Wuxi Health Committee Scientific Research Project (Q201947), the National Natural Science Foundation of China (81672328 and 81972220), the Social Development Key Project of Jiangsu Province (BE2019632), the Medical Key Professionals Program of Jiangsu Province (AF052141), the Medical Innovation Team Program of Wuxi (ZDRCB2016017), the National First-class Discipline Program of Food Science and Technology (JUFSTR20180101), the Six Talent Peaks Projects of Jiangsu Province (WSW-196), and Fundamental Research Funds for the Central Universities (JUSRP51710A). The Foundation had no role in the experimental design, the data analysis, or the writing of the paper.
Footnotes
Supplemental Information can be found online at https://doi.org/10.1016/j.omtn.2020.08.029.
Contributor Information
Ying Wang, Email: wangying8108@suda.edu.cn.
Zhaohui Huang, Email: hzhwxsy@jiangnan.edu.cn.
Supplemental Information
References
- 1.Siegel R.L., Miller K.D., Jemal A. Cancer statistics, 2020. CA Cancer J. Clin. 2020;70:7–30. doi: 10.3322/caac.21590. [DOI] [PubMed] [Google Scholar]
- 2.Maley C.C., Aktipis A., Graham T.A., Sottoriva A., Boddy A.M., Janiszewska M., Silva A.S., Gerlinger M., Yuan Y., Pienta K.J. Classifying the evolutionary and ecological features of neoplasms. Nat. Rev. Cancer. 2017;17:605–619. doi: 10.1038/nrc.2017.69. [DOI] [PMC free article] [PubMed] [Google Scholar]
- 3.Tauriello D.V.F., Batlle E. Targeting the microenvironment in advanced colorectal cancer. Trends Cancer. 2016;2:495–504. doi: 10.1016/j.trecan.2016.08.001. [DOI] [PubMed] [Google Scholar]
- 4.Kiss M., Van Gassen S., Movahedi K., Saeys Y., Laoui D. Myeloid cell heterogeneity in cancer: not a single cell alike. Cell. Immunol. 2018;330:188–201. doi: 10.1016/j.cellimm.2018.02.008. [DOI] [PubMed] [Google Scholar]
- 5.Yoshihara K., Shahmoradgoli M., Martínez E., Vegesna R., Kim H., Torres-Garcia W., Treviño V., Shen H., Laird P.W., Levine D.A. Inferring tumour purity and stromal and immune cell admixture from expression data. Nat. Commun. 2013;4:2612. doi: 10.1038/ncomms3612. [DOI] [PMC free article] [PubMed] [Google Scholar]
- 6.Carter S.L., Cibulskis K., Helman E., McKenna A., Shen H., Zack T., Laird P.W., Onofrio R.C., Winckler W., Weir B.A. Absolute quantification of somatic DNA alterations in human cancer. Nat. Biotechnol. 2012;30:413–421. doi: 10.1038/nbt.2203. [DOI] [PMC free article] [PubMed] [Google Scholar]
- 7.Ye L., Zhang T., Kang Z., Guo G., Sun Y., Lin K., Huang Q., Shi X., Ni Z., Ding N. Tumor-infiltrating immune cells act as a marker for prognosis in colorectal cancer. Front. Immunol. 2019;10:2368. doi: 10.3389/fimmu.2019.02368. [DOI] [PMC free article] [PubMed] [Google Scholar]
- 8.Yang L., Pang Y., Moses H.L. TGF-beta and immune cells: an important regulatory axis in the tumor microenvironment and progression. Trends Immunol. 2010;31:220–227. doi: 10.1016/j.it.2010.04.002. [DOI] [PMC free article] [PubMed] [Google Scholar]
- 9.Yin Y., Yao S., Hu Y., Feng Y., Li M., Bian Z., Zhang J., Qin Y., Qi X., Zhou L. The immune-microenvironment confers chemoresistance of colorectal cancer through macrophage-derived IL6. Clin. Cancer Res. 2017;23:7375–7387. doi: 10.1158/1078-0432.CCR-17-1283. [DOI] [PubMed] [Google Scholar]
- 10.Yahaya M.A.F., Lila M.A.M., Ismail S., Zainol M., Afizan N.A.R.N.M. Tumour-associated macrophages (TAMs) in colon cancer and how to reeducate them. J. Immunol. Res. 2019;2019:2368249. doi: 10.1155/2019/2368249. [DOI] [PMC free article] [PubMed] [Google Scholar]
- 11.Feng Q., Chang W., Mao Y., He G., Zheng P., Tang W., Wei Y., Ren L., Zhu D., Ji M. Tumor-associated macrophages as prognostic and predictive biomarkers for postoperative adjuvant chemotherapy in patients with stage ii colon cancer. Clin. Cancer Res. 2019;25:3896–3907. doi: 10.1158/1078-0432.CCR-18-2076. [DOI] [PubMed] [Google Scholar]
- 12.Salmaninejad A., Valilou S.F., Soltani A., Ahmadi S., Abarghan Y.J., Rosengren R.J., Sahebkar A. Tumor-associated macrophages: role in cancer development and therapeutic implications. Cell Oncol. (Dordr.) 2019;42:591–608. doi: 10.1007/s13402-019-00453-z. [DOI] [PMC free article] [PubMed] [Google Scholar]
- 13.Zhang X., Quan F., Xu J., Xiao Y., Li X., Li Y. Combination of multiple tumor-infiltrating immune cells predicts clinical outcome in colon cancer. Clin. Immunol. 2020;215:108412. doi: 10.1016/j.clim.2020.108412. [DOI] [PubMed] [Google Scholar]
- 14.Vouillarmet J., Fernandes-Rosa F., Graeppi-Dulac J., Lantelme P., Decaussin-Petrucci M., Thivolet C., Peix J.L., Boulkroun S., Clauser E., Zennaro M.C. Aldosterone-producing adenoma with a somatic KCNJ5 mutation revealing APC-dependent familial adenomatous polyposis. J. Clin. Endocrinol. Metab. 2016;101:3874–3878. doi: 10.1210/jc.2016-1874. [DOI] [PubMed] [Google Scholar]
- 15.Fu H., Jangani M., Parmar A., Wang G., Coe D., Spear S., Sandrock I., Capasso M., Coles M., Cornish G. A subset of CCL25-induced gut-homing T cells affects intestinal immunity to infection and cancer. Front. Immunol. 2019;10:271. doi: 10.3389/fimmu.2019.00271. [DOI] [PMC free article] [PubMed] [Google Scholar]
- 16.Goncalves-Maia M., Gache Y., Basante M., Cosson E., Salavagione E., Muller M., Bernard F., Avril M.F., Schaub S., Sarasin A. NK cell and fibroblast-mediated regulation of skin squamous cell carcinoma invasion by CLEC2A is compromised in xeroderma pigmentosum. J. Invest. Dermatol. 2020;140:1723–1732. doi: 10.1016/j.jid.2020.01.021. [DOI] [PubMed] [Google Scholar]
- 17.Poli G., Cochetti G., Boni A., Egidi M.G., Brancorsini S., Mearini E. Characterization of inflammasome-related genes in urine sediments of patients receiving intravesical BCG therapy. Urol. Oncol. 2017;35:674.e619–674.e624. doi: 10.1016/j.urolonc.2017.08.004. [DOI] [PubMed] [Google Scholar]
- 18.El Hage F., Durgeau A., Mami-Chouaib F. TAP expression level in tumor cells defines the nature and processing of MHC class I peptides for recognition by tumor-specific cytotoxic T lymphocytes. Ann. N Y Acad. Sci. 2013;1283:75–80. doi: 10.1111/j.1749-6632.2012.06777.x. [DOI] [PubMed] [Google Scholar]
- 19.Garrido C., Paco L., Romero I., Berruguilla E., Stefansky J., Collado A., Algarra I., Garrido F., Garcia-Lora A.M. MHC class I molecules act as tumor suppressor genes regulating the cell cycle gene expression, invasion and intrinsic tumorigenicity of melanoma cells. Carcinogenesis. 2012;33:687–693. doi: 10.1093/carcin/bgr318. [DOI] [PubMed] [Google Scholar]
- 20.Gui X., Deng M., Song H., Chen Y., Xie J., Li Z., He L., Huang F., Xu Y., Anami Y. Disrupting LILRB4/APOE interaction by an efficacious humanized antibody reverses T-cell suppression and blocks AML development. Cancer Immunol. Res. 2019;7:1244–1257. doi: 10.1158/2326-6066.CIR-19-0036. [DOI] [PMC free article] [PubMed] [Google Scholar]
- 21.Zheng P., Luo Q., Wang W., Li J., Wang T., Wang P., Chen L., Zhang P., Chen H., Liu Y. Tumor-associated macrophages-derived exosomes promote the migration of gastric cancer cells by transfer of functional Apolipoprotein E. Cell Death Dis. 2018;9:434. doi: 10.1038/s41419-018-0465-5. [DOI] [PMC free article] [PubMed] [Google Scholar]
- 22.Hansen W., Westendorf A.M., Buer J. Regulatory T cells as targets for immunotherapy of autoimmunity and inflammation. Inflamm. Allergy Drug Targets. 2008;7:217–223. doi: 10.2174/187152808786848360. [DOI] [PubMed] [Google Scholar]
- 23.Heim L., Friedrich J., Engelhardt M., Trufa D.I., Geppert C.I., Rieker R.J., Sirbu H., Finotto S. NFATc1 promotes antitumoral effector functions and memory CD8+ T-cell differentiation during non-small cell lung cancer development. Cancer Res. 2018;78:3619–3633. doi: 10.1158/0008-5472.CAN-17-3297. [DOI] [PubMed] [Google Scholar]
- 24.Klein-Hessling S., Muhammad K., Klein M., Pusch T., Rudolf R., Flöter J., Qureischi M., Beilhack A., Vaeth M., Kummerow C. NFATc1 controls the cytotoxicity of CD8+ T cells. Nat. Commun. 2017;8:511. doi: 10.1038/s41467-017-00612-6. [DOI] [PMC free article] [PubMed] [Google Scholar]
- 25.Nishikido A., Okamura T., Nakajima Y., Ishida E., Miyamoto T., Toki A.K., Matsumoto S., Yoshino S., Horiguchi K., Saito T. Regulation of the KCNJ5 gene by SF-1 in the adrenal cortex: Complete genomic organization and promoter function. Mol. Cell. Endocrinol. 2020;501:110657. doi: 10.1016/j.mce.2019.110657. [DOI] [PubMed] [Google Scholar]
Associated Data
This section collects any data citations, data availability statements, or supplementary materials included in this article.