

Abstract
Objective
Salivary gland (SG) progenitor cells (SGPCs) maintain SG homeostasis. We have previously shown that in primary Sjögren’s syndrome (pSS), SGPCs are likely to be senescent, and may underpin SG dysfunction. This study assessed the extent of senescence of cells in a SGPC niche in pSS patients’ SGs, and its correlation with functional and clinical parameters.
Methods
The expression of p16 and p21 as markers of senescence in both total SG epithelium and a SGPC niche (basal striated duct cells, BSD) was examined in SGs of pSS (n = 35), incomplete pSS (n = 13) (patients with some signs of pSS, but not fulfilling all classification criteria) and non-SS sicca control (n = 21) patients. This was correlated with functional and clinical parameters.
Results
pSS patient SGs contained significantly more p16+ cells both in the epithelium in general (P <0.01) and in the BSD layer (P <0.001), than non-SS SGs. Significant correlations were found in pSS patients between p16+ BSD cells and secretion of unstimulated whole saliva, stimulated whole saliva, stimulated parotid saliva, CD45+ infiltrate, ultrasound total score and ACR-EULAR classification score, but not with EULAR Sjögren’s syndrome disease activity index (ESSDAI) and EULAR Sjögren’s Syndrome Patient Reported Index (ESSPRI) scores. Correlations with total epithelium p16+ cells were weaker. Incomplete pSS patients also had increased numbers of p16+ epithelial and BSD cells. Based on protein and mRNA expression, p21+ appears not to play a significant role in the SG in pSS.
Conclusion
These findings suggest SGPC senescence may be an early feature of primary Sjögren’s syndrome and may contribute to defective SG function in pSS but not to systemic disease activity.
Keywords: primary Sjögren’s syndrome, salivary gland progenitor cells, senescence, salivary gland, p16
Rheumatology key messages
Increase of p16+ cells in pSS patient salivary gland progenitor-cell-niche reflects premature salivary gland senescence.
Proportion of progenitor-cell-niche p16+ cells correlates with salivary gland function and pathology in pSS patients.
Senescence marker p21 does not appear to play a role in glandular senescence in pSS.
Introduction
Primary Sjögren’s syndrome (pSS) is a systemic autoimmune disease, featuring dysfunction of the salivary glands (SGs) and presence of lymphocytic infiltrates and autoantibodies, amongst many other symptoms. pSS is the second most common autoimmune rheumatic disease, with prevalence ranging from 0.01% to 3% of the general population [1]. Knowledge related to pSS pathogenesis remains limited, and as a consequence, the diagnosis and treatment of pSS are challenging.
Inflammation is a hallmark of pSS. Levels of pro-inflammatory cytokines (e.g. IFN-α, IFN-γ, IL-6, TNFα) and chemokines (e.g. CCL2, CCL3, CCL4, CXCL8, CXCL10) are elevated in the SG, accompanying B and T lymphocytic infiltrates in the glandular tissue [2–7]. Although reduced saliva flow is characteristic of pSS, there is a poor relationship between saliva flow and degree of SG infiltration as well as that the mechanism behind hyposalivation development in pSS remains elusive [8–10].
Saliva is produced by acinar cells of the SG. Coordinated by myoepithelial cells, primary saliva is transported into intercalated ducts, then striated ducts and excretory ducts, and finally into the oral cavity. During its transport, the primary saliva is modified by secretion and absorption of electrolytes as well as the secretion of proteins. Of these ductal types, the striated duct is made up of two cell layers: a basal layer and a luminal layer. The basal striated duct (BSD) layer has been proposed to represent a progenitor cell niche in SG [11]. SG progenitor cells (SGPCs) that potentially reside in this niche maintain SG homeostasis by self-renewal and differentiation into other terminal and functional cell types in SGs, namely saliva producing acinar cells, saliva modifying ductal cells and myoepithelial cells [12–14].
Cellular senescence is a process in which cells undergo cell-cycle arrest, in response to, for example, replicative stress, activated oncogenes or irradiation [15]. Senescent cells characteristically express p16 (an inhibitor of cell division kinase 4, CDK4) and/or p21 (an inhibitor of cell division kinase 2, CDK2). These cells often additionally express many nonspecific pro-inflammatory cytokines, chemokines, growth factors and proteases, together with p16/p21, collectively termed the senescence-associated secretory phenotype (SASP) [16, 17]. SASP expression by senescent cells is sufficient to spread cellular senescence to neighboring cells and cause dysfunction of tissues [18].
Senescence of immune system cells has been examined in several autoimmune diseases including autoimmune diabetes and rheumatoid arthritis [19–21]. These studies have demonstrated prematurely aged immune cells, with telomeric shortening, proliferation defects, oxidative stress and impaired DNA damage repair. Studies of the aged parenchyma in autoimmune diseases are scarce. We showed recently that SGPCs from pSS patients had dramatically reduced proliferative and differentiation properties [11]. These pSS SGPCs also maintained shorter telomere lengths, implying probable replicative senescence. Healthy donor SGPCs furthermore could be induced to proliferate using pro-inflammatory cytokines. Previously, we theorized that persistent hyposalivation in pSS may be in part attributed to premature ageing of SGPCs, mediated by the cytokine-induced proliferation [11]. Within the context of the SG, older murine SGs, representing a presumably aged and potentially senescent phenotype, have been demonstrated to display an age-dependent regenerative potential decline [22]. No studies to date, however, within the SG or otherwise, have extensively examined the senescent state of parenchymal cell types in autoimmune diseases, or been able to link this with clinical presentation. The aim of this study was to characterize the degree of senescence of SGPCs in pSS by analysing p16 and p21 expression in their potential niche in the basal striated duct layer.
Methods
Human subjects
Parotid gland biopsies obtained from consecutive patients were taken during routine biopsy for pSS diagnosis work-up trajectory between 2013 and 2016. Institutional review board (IRB) approval was obtained (METc2013.066), and informed consent was provided by patients involved in this cohort. pSS patients fulfilled the 2016 ACR-EULAR classification criteria [23]. Incomplete pSS patients were displaying indications for potential development into pSS (i.e. presence of foci and/or anti-SSA autoantibodies), but without fulfilling the ACR-EULAR criteria. The definition of ‘incomplete pSS’ in this study is shown in supplementary Table S1, available at Rheumatology online. Non-SS sicca control patients were defined as patients with sicca symptoms, without foci and anti-SSA autoantibodies, and comprised, for example, patients taking medication affecting salivary gland function.
Twelve out of 13 incomplete pSS patients were seropositive for ANAs. Within this group, two patients displayed SSA-positivity. Autoantibodies associated with other autoimmune diseases (dsDNA, SSA, SSB, Smith, RNP, Scl70, CenpB, Jo1) were not detected. Patients from pSS, incomplete pSS and non-SS sicca control groups were age-matched and female dominated. Unstimulated whole saliva (UWS), stimulated whole saliva (SWS) and stimulated parotid saliva (SPS) secretions were measured [24]. Ultrasonographic changes of parotid and submandibular salivary glands (SGs) were examined according to the score developed by Hocevar et al. [25]. As part of the diagnostic work-up, patient ACR-EULAR classification score was calculated by assigning the following points to clinical criteria: labial or parotid SG with a focus score of ≥ 1 foci/4mm2 =3 points, anti-SSA/SSB (anti-Ro/La) autoantibodies =3 points, ocular staining score ≥ 5 =1 point, Schirmer’s test ≤ 5 mm/5 min =1 point, UWS ≤0.1 ml/min =1 point. The EULAR Sjögren’s syndrome disease activity index (ESSDAI) score and the EULAR Sjögren’s Syndrome Patient Reported Index (ESSPRI) score were also evaluated. When biopsies were taken and measurements were performed, patients involved in this study were not taking any immunomodulatory drugs.
Histological evaluation of parotid gland
Haematoxylin and eosin staining and p16/p21 immunostaining were performed according to standard protocols (see supplementary material, section Methods, available at Rheumatology online).
qPCR
qPCR checking RNA expression of p16/p21 in the parotid gland was performed according to standard protocols (see supplementary material, section Methods, available at Rheumatology online, and primer sequences are in supplementary Table S2, available at Rheumatology online).
Results
Increased p16+ BSD cells and up-regulated p16 and p21 mRNA in pSS patient parotid glands
We employed immunohistochemistry staining to visualize the senescence markers p16 and p21 in patient SGs. Characteristics of the patients from whom SG biopsies were harvested are shown in Table 1 and Supplementary Fig. S1A and S1B, available at Rheumatology online. There was no significant difference in age of the patients in the non-SS sicca control (n = 21), incomplete pSS (n = 13) and pSS (n = 35) groups, implying that any differences observed are not due to age variation.
Table 1.
Patient characteristics
| Variable | Non-SS sicca control | Incomplete pSS | pSS |
|---|---|---|---|
| (n = 21) | (n = 13) | (n = 35) | |
| Patient characteristics | |||
| Age of participant into cohort (range, year) | 53.81 (38–66) | 47.46 (25–69) | 51.63 (24–74) |
| Female, n (%) | 15 (71.43) | 12 (92.31) | 34 (97.14) |
| Clinical parameters | |||
| Stimulated parotid saliva (SPS, average of two sides, range, mL/min) | 0.03 (0.00–0.09) | 0.10 (0.01–0.24) | 0.09 (0.00–0.38)* |
| Stimulated whole saliva (SWS, range, mL/min) | 0.28 (0.06–0.84) | 0.42 (0.09–1.14) | 0.32 (0–1.35) |
| Unstimulated whole saliva (UWS, range, mL/min) | 0.10 (0.00–0.36) | 0.29 (0.02–1.26) | 0.15 (0.00–0.68) |
| Ultrasound total score (range) | 11.14 (3–16) | 7.33 (2–14) | 17.58 (3–42)# |
| ACR-EULAR score (range) | 1.53 (0–2) | 2.31 (1–3) | 6.61 (4–9)****/#### |
| ESSDAI (EULAR Sjögren’s syndrome disease activity index, range) | 1.6 (0–7) | 4.46 (0–19) | 6.06 (0–29)* |
| ESSPRI (EULAR Sjogren’s syndrome patient reported index, range) | — | 7.33 (4–10) | 6.40 (1.33–9) |
| Histopathological parameters | |||
| Relative area of CD45+ infiltrate (range, %) | 1.15 (0.03–3.93) | 1.11 (0.28–4.29) | 12.93 (0.04–57.12)**/## |
| Focus score (FS) positive, n (%) | 0 (0) | 2 (15.38) | 21 (60.00) |
| Laboratory assessments | |||
| SSA positive, n (%) | 0 (0) | 2 (15.38) | 28 (80.00) |
Statistical testing between pSS and non-SS sicca control group is denoted by asterisks, where *P < 0.05; **P < 0.01; ****P < 0.0001;
Statistical testing between pSS and incomplete pSS group is denoted by hash signs, where #P < 0.05; ##p < 0.01; ####P < 0.0001.
Table 1 Patient characteristics. * Significant difference with non-SS sicca control patients. # Significant difference with incomplete pSS patients. * = P <0.05, ** = P <0.01, **** = P <0.0001. # = P <0.05, ## = P <0.01, #### = P <0.0001.
| Variable | Non-SS sicca control (n=21) | Incomplete pSS (n=13) | pSS (n=35) |
|---|---|---|---|
| Patient characteristics | |||
| Age of participant into cohort (range, year) | 53.81 (38-66) | 47.46 (25-69) | 51.63 (24-74) |
| Female, n(%) | 15 (71.43) | 12 (92.31) | 34 (97.14) |
| Clinical parameters | |||
| Stimulated parotid saliva (SPS, average of two sides, range, mL/min) | 0.03 (0.00-0.09) | 0.10 (0.01-0.24) | 0.09 (0.00-0.38)* |
| Stimulated whole saliva (SWS, range, mL/min) | 0.28 (0.06-0.84) | 0.42 (0.09-1.14) | 0.32 (0-1.35) |
| Unstimulated whole saliva (UWS, range, mL/min) | 0.10 (0.00-0.36) | 0.29 (0.02-1.26) | 0.15 (0.00-0.68) |
| Ultrasound total score (range) | 11.14 (3-16) | 7.33 (2-14) | 17.58 (3-42)# |
| ACR-EULAR score (range) | 1.53 (0-2) | 2.31 (1-3) | 6.61 (4-9)****/#### |
| ESSDAI (EULAR Sjögren's syndrome disease activity index, range) | 1.6 (0-7) | 4.46 (0-19) | 6.06 (0-29)* |
| ESSPRI (EULAR Sjogren‘s Syndrome Patient Reported Index, range) | - | 7.33 (4-10) | 6.40 (1.33-9) |
| Histopathological parameters | |||
| Relative area of CD45+ infiltrate (range, %) | 1.15 (0.03-3.93) | 1.11 (0.28-4.29) | 12.93 (0.04-57.12)**/## |
| Focus score (FS) positive, n(%) | 0 (0) | 2 (15.38) | 21 (60.00) |
| Laboratory assessments | |||
| SSA positive, n(%) | 0 (0) | 2 (15.38) | 28 (80.00) |
Scattered p16+ cells were found in the SGs of non-SS sicca control patients. Most of these p16+ cells were acinar cells or luminal striated duct cells. Positivity for p16 was rarely found in the BSD layer (Fig. 1A). Conversely, in SGs from pSS patients, p16+ cells were observed not only as acinar and luminal striated duct cells, but also in the BSD compartment (Fig. 1C and H). A significant increase in both p16+ total epithelial cells (P = 0.0008) and p16+ BSD cells (P < 0.0001) in SGs of pSS patients (n = 35) compared with non-SS sicca control patients (n = 21) was detected (Fig. 1I and J). A similar distribution of p16+ cells was seen in the incomplete pSS group (Fig. 1B and G). Also, these patients exhibited a significant increase in p16+ epithelial cells (P = 0.0448) and p16+ BSD cells (P = 0.0045) (Fig. 1I and J). There were no significant differences in numbers of p16+ cells between the pSS patients and the incomplete pSS patients.
Fig. 1.

Increased p16 expression in progenitor cell niche of pSS and incomplete pSS parotid glands
Double staining of p16 (blue) and epidermal growth factor receptor (EGFR, brown) in (A) non-SS sicca control, (B) incomplete pSS patients and (C) pSS patients’ parotid gland (PG). Double staining of p21 (blue) and EGFR in (D) non-SS sicca control, (E) incomplete pSS and (F) pSS patients PG. (G) High-resolution images of black square in B. (H) High-resolution images of black square in C. Black arrows point to representative p16+ basal striated duct (BSD) cells. Quantification of (I) p16+ epithelial cells and (J) p16+ BSD cells per 4 mm2 in non-SS sicca control (n = 21), incomplete pSS (n = 13) and pSS (n = 35) groups. Bars = SEM. Nonparametric test of Kruskal–Wallis test was used for statistical analysis. The cut-off point is based on an increase of the mean + 2 SDs from the non-SS sicca control patients’ group.
A cut-off point based on the mean +2 (s.d.) of p16 expression in non-SS sicca control patients for total epithelium (115 p16+ cells/4mm2) and BSD cells (4 p16+ cells/4mm2) was calculated to facilitate data interpretation (Fig. 1I and J). Patients with more p16+ cells than this threshold were termed p16high. Fifteen pSS patients (43%) compared with 1 non-SS sicca control patients (5%) were p16high for total epithelial cells. When examining p16+ BSD cells, 20 pSS patients (57%) were p16high, compared with 1 non-SS sicca control patients (5%). Among the incomplete pSS patients, 31% and 54% were p16high for epithelial or BSD cells, respectively (Fig. 1I and J).
Staining for a second marker of senescence, p21, was also performed. Scarce p21+ cells could be found in both groups (data not quantified due to the extremely low expression), suggesting that the p21 pathway plays a less important role in the senescence of the pSS patient SG than the p16 pathway (Fig. 1D–F).
Global SG relative mRNA levels of p16 and p21 were also determined by qPCR using mRNA extracted from frozen parotid SG sections. p16 mRNA in pSS SGs (n = 6) was significantly increased when compared with non-SS sicca control (n = 3) and incomplete pSS (n = 4) patients (Supplementary Fig. S1C, available at Rheumatology online). p21 mRNA expression in pSS patient SGs was increased compared with non-SS sicca controls and incomplete pSS patients, without reaching statistical significance (Supplementary Fig. S1C, available at Rheumatology online). Collectively, these results suggest increased senescence in an important potential progenitor cell niche and in the parenchyma of the parotid SG in pSS patients.
p16+ BSD cells and pSS patient saliva secretion are significantly negatively correlated
Saliva secretion reflects SG function. To establish whether p16 reflects SG function in pSS, correlation analyses between p16+ epithelial/BSD cells and saliva secretion were performed.
There was a clear trend showing a negative correlation between p16+ epithelial cells and UWS in pSS patients, but without statistical significance (r = –0.31, P = 0.0665, Fig. 2A). p16+ BSD cells and UWS in these patients showed significant and stronger correlation (r =–0.52, P = 0.0014, Fig. 2B).
Fig. 2.

p16+ basal striated ductal cells closely correlate with SG functional parameters in pSS patients
(A) Negative correlation between p16+ epithelial cells per 4 mm2 parotid gland tissue and unstimulated whole saliva (UWS) in pSS patients, n = 35. (B) Significant negative correlation between p16+ BSD cells per 4 mm2 parotid gland tissue and UWS in pSS patients, n = 35. (C) Negative significant correlation between p16+ epithelial cells per 4 mm2 parotid gland tissue and stimulated whole saliva (SWS) in pSS patients, n = 35. (D) Significant negative correlation between p16+ BSD cells per 4 mm2 parotid gland tissue and SWS in pSS patients, n = 35. (E) Negative correlation between p16+ epithelial cells per 4 mm2 and stimulated parotid saliva (SPS, average of two sides) in pSS patients, n = 35. (F) Significant negative correlation between p16+ basal striated duct (BSD) cells per 4 mm2 and SPS in pSS patients, n = 35. Non-parametric Spearman correlation was used for correlation analysis. r and P values for each correlation are shown.
A negative and significant correlation between SWS and p16+ epithelial cells (r =–0.42, P = 0.0129, Fig. 2C) was found. This correlation was even more robust between SWS and p16+ BSD cells (r =–0.55, P = 0.0007, Fig. 2D).
Similarly, a non-significant trend for negative correlation was detected between p16+ total epithelial cells and stimulated parotid saliva (SPS, average value of left and right parotid glands) in pSS patients (n = 35, r =–0.31, P = 0.0672, Fig. 2E). A significant negative correlation was again detected between p16+ BSD cells and SPS (r =–0.45, P = 0.0071, Fig. 2F). No correlation between p16+ BSD cells and UWS, SWS or SPS was found in the combination of non-SS sicca control and incomplete pSS patients (Supplementary Fig. S2A–C, available at Rheumatology online). These data show that protein level expression of the senescence marker p16 in particular in the proposed stem cell niche of the SG at least partly reflects SG function in pSS.
p16+ BSD cells are increased in lymphoepithelial lesions
Lymphoepithelial lesions (LELs) are another important abnormality in SGs of patients with pSS. LELs, whereby SG striated ducts are invaded by B-lymphocytes and show disorganized ductal structure with high abnormal proliferated BSDs. These invasive B cells are thought to be a precursor of mucosa-associated lymphoid tissue (MALT) lymphomas [26, 27]. In the current study, we noted an increased presence of cells displaying strong p16 positivity in LELs [marked by epidermal growth factor receptor (EGFR) Fig. 3E]. pSS patients with LELs in PG did not show more p16+ epithelial cells (Fig. 3C), but interestingly, did show a trend for more p16+ BSD cells (Fig. 3D).
Fig. 3.

Leukocytic infiltration may take partial responsibility for pSS SG progenitor cell senescence
(A) Significant positive correlation between p16+ epithelial cells per 4 mm2 parotid gland tissue and relative area of CD45+ infiltrate in parotid gland (PG) in pSS patients, n = 34. (B) Significant positive correlation between p16+ BSD cells per 4 mm2 parotid gland tissue and relative area of CD45+ infiltrate in PG in pSS patients, n = 34. (C) No difference in expression p16+ epithelial cells per 4 mm2 between patients with or without lymphoepithelial lesions (LELs). (D) Increased expression of p16+ BSD cells per 4 mm2 between patients with or without LELs. n = 18 LEL– patients, n = 17 LEL+ patients. Nonparametric test was used to compare differences, bars = SEM. (E) Double staining of p16 (blue) and epidermal growth factor receptor (EGFR, brown) in pSS patient parotid gland with LELs. Inside dotted portion is the boundary of LEL. Black arrowheads point to representative p16+ BSDs. (F) No significant linear correlation was found between UWS and relative area of CD45+ infiltrate in pSS patients, n = 34. (G) No significant linear correlation was found between SWS and relative area of CD45+ infiltrate in pSS patients, n = 34. (H) No significant linear correlation was found between SPS and relative area of CD45+ infiltrate in pSS patients, n = 34. Non-parametric Spearman correlation was used for correlation analysis. r and P values are shown for each correlation.
p16+ BSD cells and relative area of CD45+ infiltrate in pSS SG are significantly positively correlated
Lymphocytic infiltration in SGs is a commonly touted pathologic manifestation in pSS. To fulfill the ACR-EULAR classification criteria for pSS, patients must have at least a positive biopsy (FS ≥ 1.0) or presence of SSA autoantibodies [23]. pSS patients were grouped based on FS <1 (FS–) or ≥1 (FS+). FS+ pSS patients tended to have more p16+ BSD cells than FS– patients, while there was no difference between two groups in p16+ epithelial cell occurrence (Supplementary Fig. S3B and C, available at Rheumatology online).
Focus scores, however, did not accurately reflect the size of the SG infiltrate, with the only criterium being >50 lymphocytes clustered together. In order to more accurately assess the relationship between p16+ cells and SG infiltrate, we digitally quantified the relative area of CD45+ infiltrate in each section [28]. In line with previous studies in pSS [8–10], there was no correlation between CD45+ infiltrate in SGs and UWS (r = −0.12, P = 0.4941, Fig. 3F), SWS (r = −0.15, P=0.3907, Fig. 3G), or with SPS (r = 0.11, P=0.5417, Fig. 3H) in pSS patients (n = 34). In contrast, a significant correlation was found between relative area of CD45+ infiltrate and number of p16+ epithelial cells/4mm2 (r = 0.38, P=0.0269, Fig. 3A). The correlation was even stronger between area of CD45+ infiltrate and relative number of p16+ BSD cells/4mm2 (r = 0.41, P=0.0173, Fig. 3B). No significant correlation was found between relative area of CD45+ infiltrate and number of p16+ BSD cells/4mm2 in the combination of non-SS sicca control and incomplete pSS patients (n = 25, r = 0.05, P=0.8066, Supplementary Fig. S3A, available at Rheumatology online). These data imply that p16+ BSD cells reflect SG damage, and more infiltrates may lead to or reinforce SGPCs senescence.
p16+ BSD cells and ultrasound total score are positively correlated in pSS
Ultrasonographic changes of the major SGs, such as changes in echogenicity, homogeneity, presence of hypoechogenic areas, hyperechogenic reflections and clearness of the SG borders, characterize typical SS patients [25, 29]. In pSS patients, no significant linear correlation was found between p16+ epithelial cell and ultrasound total score (n = 26, r = 0.14, P=0.5039, Fig. 4A). Interestingly, the correlation between p16+ BSD cells and ultrasound total score was significant (r = 0.47 P=0.0153, Fig. 4B). No significant correlation was found in the combination of non-SS sicca control and incomplete pSS patients (n = 13; Supplementary Fig. S4A, available at Rheumatology online). These data may suggest that striated ductal abnormalities in pSS as inferred from increased p16+ cells in the BSD layer may contribute to abnormal ultrasounds in pSS.
Fig. 4.
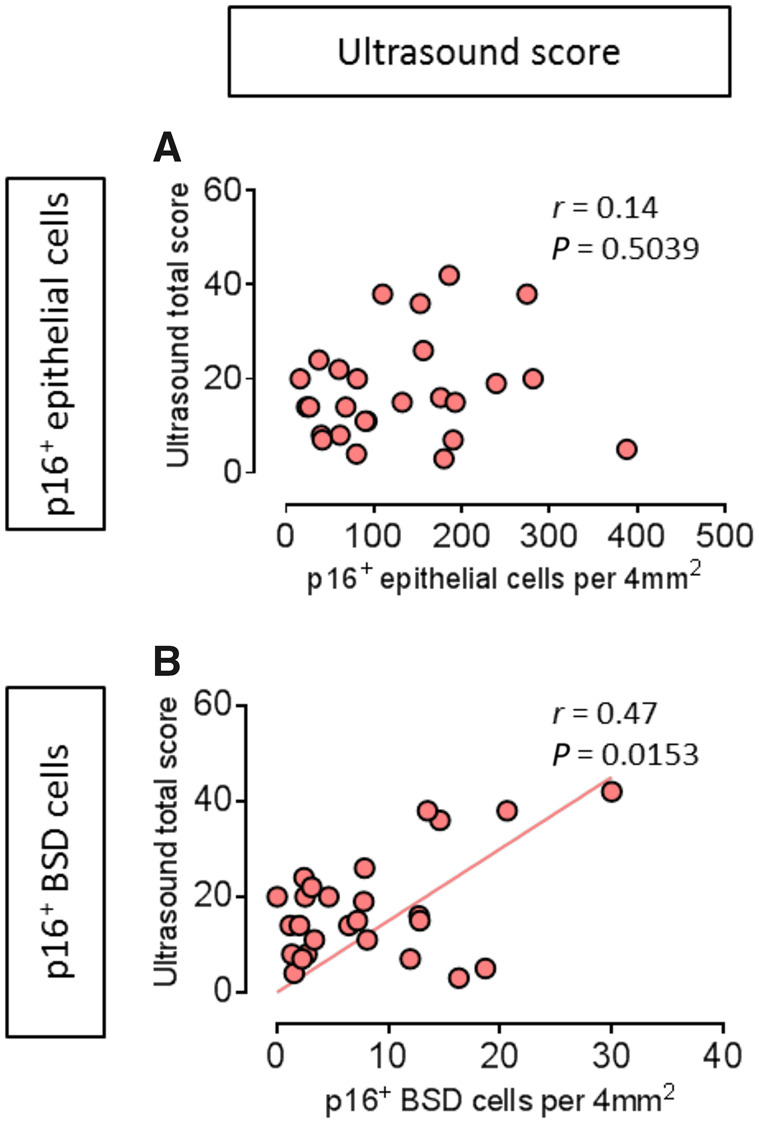
p16+ basal striated ductal cells closely correlate with pSS ultrasound total score
(A) No significant linear correlation was found between p16+ epithelial cells per 4 mm2 and ultrasound total score in pSS patients, n = 26. (B) Significant positive correlation between p16+ basal striated duct (BSD) cells per 4 mm2 parotid gland tissue and ultrasound total score in pSS patients, n = 26. Pearson correlation coefficients was used for correlation analysis. r and P values are shown for each correlation.
p16+ BSD cells and pSS systemic clinical scores are not consistently correlated in pSS
The EULAR Sjogren’s Syndrome Patient Reported Index (ESSPRI) is subjectively scored by the patient about three items: pain, fatigue and dryness. The EULAR Sjögren’s syndrome (SS) disease activity index (ESSDAI) is a systemic disease activity index that was designed to measure disease activity in patients with pSS. In this study, we found no linear correlation in pSS patients between p16+ epithelial cells per 4 mm2 parotid gland and ESSPRI score (n = 30, r = –0.22, P=0.2331, Supplementary Fig. S4C, available at Rheumatology online) and ESSDAI score (n = 35, r = 0.18, P=0.3087, Supplementary Fig. S4E, available at Rheumatology online). Also, no linear correlation was found between p16+ BSD cells per 4 mm2 parotid gland and ESSPRI score (n = 30, r = –0.27, P=0.1526, Supplementary Fig. S4D, available at Rheumatology online) and ESSDAI score (n = 35, r = 0.28, P=0.1049, Supplementary Fig. S4F, available at Rheumatology online) and in pSS patients. Currently, the ACR-EULAR classification score is one of the most widely used classification criteria for pSS, which is taking core symptoms (e.g. glandular dryness, lymphocytic infiltration and autoantibodies presence) of pSS into account. We used the ACR-EULAR criteria items to generate a total score, which to some extent may reflect pSS severity. A significant correlation between ACR-EULAR classification total score and p16+ BSD cells was found in both pSS patients (n = 33, r = 0.41, P=0.0180, Supplementary Fig. S4H, available at Rheumatology online) and the combination of non-SS sicca control and incomplete pSS patients (n = 28, r = 0.38, P=0.0458, Supplementary Fig. S4B, available at Rheumatology online), but not with p16+ total epithelial cells (n = 33, r = 0.20, P=0.2731, Supplementary Fig. S4G, available at Rheumatology online). These findings suggest that p16+ BSD cells reflect PG pathology, but they don’t necessarily reflect disease activity and patient reported general symptoms.
Discussion
In the current study, we show that p16 expression in the SG BSD layer of pSS patients correlates with loss of saliva production ability, leukocytic infiltration and abnormal ultrasound scores, suggesting the central role of SG epithelial progenitor cell senescence in SG abnormalities in pSS.
SGPCs maintain SG homeostasis by proliferation and differentiation [11]. The BSD is a proposed niche of SGPCs, and is easily identifiable histologically [12–14]. p16+ BSD and total epithelial cells in pSS significantly increased compared with non-SS sicca control patients. This increased potential senescence level in SG parenchyma, especially in progenitor cell niche, may denote a dysfunctional homeostatic state in pSS patient SGs. Moreover, before establishment of the official diagnosis of pSS, patients having some indications to develop into pSS but that didn’t fulfill the ACR/EULAR classification criteria (the ‘incomplete pSS’ group) already showed significantly increased p16+ cell numbers (both epithelial cells and BSD cells) compared with non-SS sicca patients. This might suggest senescence could happen in an early phase of pSS. The mean numbers of p16+ epithelial and BSD cells in ‘incomplete pSS’ patients were, however, less than pSS patients, indicating senescence could be a continuous process that occurs together with disease progression. However, approximately half of pSS patients did not show increased p16 expression level, highlighting the need for multiple parameters for stratifying pSS patients. Several studies have suggested that SG progenitor cells may also reside in the intercalated ducts and acini compartments [11, 30]. We are not excluding the possibility of progenitor cell senescence in other SG niches also contributing to SG dysfunction in pSS.
p16 and p21 mediate replication-induced cellular senescence both independently and together [31, 32]. p21 does not appear to be involved in the senescence of BSD cells in pSS, according to our results. In a parallel study, we examined p16 and p21 expression in the autoimmune disorders SLE (unpublished data) and Crohn’s disease [33]. Here, we detected both p16 and p21 expression in skin and intestine lesions of SLE and Crohn’s patients, respectively, whereby p16 was expressed in progenitor cell niches of the skin and intestine, p21 was more frequently observed in distinct transient amplifying (TA) cell niches. TA cells arise from progenitor cells, and divide a finite number of times until they become differentiated. These contrasting p16/p21 expression profiles in progenitor/TA cell niches raise fundamental questions about both senescence and tissue dynamics. Firstly, we submit that both progenitor and TA cells may become senescent in autoimmune diseases as a consequence of the inflammatory environment, but that this senescence may be achieved using different cellular starting points. Secondly, the data may suggest a lack of TA cell population in SGs, presumably attributable to the slow turnover of the SG vs the fast turnover of the skin/intestine, the latter necessitating an intermediate cell type to satisfy demand for fresh parenchymal cells [34, 35].
We also found a significant correlation between p16+ BSD cells and ultrasound score. In pSS, hypoechogeneic SG areas are well characterized features [36], correlating with degree of infiltration, SSA autoantibody presence, and classification criteria [37]. The pathology underlying hypoechogeneic areas remains mysterious. Inflammatory cytokines and chemokines are components of the SASP presumably produced by these p16+ BSD cells, as well as by activated lymphocytes and other epithelial cells. Cytokines have been well established to reduce tight junction function [11, 38, 39]. Tight junctions clamp epithelial cells to each other, and are prominent in the luminal layer of the striated duct in the SG. Loss of inter luminal cell adhesion due to cytokines expressed by senescent BSD cells may promote saliva extravasation into the SG parenchyma. Aqueous regions are visible as hypoechoic areas via ultrasound, and may thus represent extravasated saliva.
This study was focused on elucidating the degree of senescence of the epithelium and cells in a potential SGPC niche in SGs of pSS patients. Some pSS and incomplete pSS patients already demonstrated increased numbers of p16+ cells in the BSD in the absence of massive infiltration, implying that infiltration might at least not be the only trigger of senescence. On the other hand, because there is a correlation between numbers of p16+ cells (both epithelial and BSD cells) and CD45+ cells, indicating infiltration, which may be an important component of glandular dysfunction [26, 40], also seems to promote senescence. Take the results of this study together with our previous work [11], we hypothesize that in the early phases of pSS SG damage, SG epithelial cells including SGPCs are activated by factors (cytokines) potentially originating from activated (ductal) epithelial cells themselves and/or tissue resident innate lymphocytes. These factors, presumably proinflammatory cytokines such as IL-6, TNF and IFNα induce SGPC proliferation and begin the transition towards replication-induced senescence. Meanwhile, further lymphocytes are attracted by these and other cytokines/chemokines, of which CXCL10 seems to be an important factor [41]. Recruited lymphocytes enter, produce cytokines themselves and provide a second hit inducing further SGPCs proliferation and senescence, together with epithelial cell death [40]. In parallel, leakage of saliva out of the striated ducts through epithelial tight junctions perturbance may occur, generating hypoechogeneic regions (Fig. 5).
Fig. 5.

Schematic representation of senescent SG progenitor cells induced saliva secretion drop in pSS SG.
In the early phases of pSS SG damage, SG epithelial cells including SGPCs are activated by factors potentially originating from tissue-resident innate lymphocytes. These factors, presumably proinflammatory cytokines such as IL-6, TNF and IFNα induce SGPC proliferation and begin the transition towards replication-induced senescence. Meanwhile, further lymphocytes are attracted by these cytokines. Lymphocytes enter and provide a second hit, increasing the cytokine number and concentration in the SG, inducing further SGPCs proliferation, senescence together with epithelial cell death [40
]. In parallel, leakage of saliva out of the striated ducts through cytokine-mediated perturbance of epithelial cell tight junctions may also occur, generating characteristic hypoechogeneic regions. BSD = basal striated duct, LSD = luminal striated duct.
In conclusion, we assessed the senescence state of pSS SG, and found increased numbers of p16+ BSD cells. Significant correlations between p16+ BSDs and saliva production and pathological and clinical parameters (CD45+ infiltrate, ultrasound total score, ACR-EULAR classification score) were elucidated. We highlight the potential of parenchymal cell senescence markers as disease progression readouts in an autoimmune disease.
Supplementary Material
Acknowledgements
The authors gratefully acknowledge the patients who took part into this research and agree to provide their parotid gland biopsies for this study. All authors were involved in drafting and revising this article, and all authors approved the final version to be submitted for publication. X.W. had full access to all of the data in this study and takes responsibility for the integrity of the data and the accuracy of the data analysis. Study conception and design: X.W., A.V., F.K.L.S., H.B., F.G.M.K., S.P.; acquisition of data: X.W., J.T., S.P.; analysis and interpretation of data: X.W., S.P., F.G.M.K.
Funding: This research was funded by a China Scholarship Council grant (201606220074), Dutch Arthritis Foundation Translational Research Grant (T015-052) and a Dutch Arthritis Foundation Long Term Project Grant (LLP-29).
Disclosure statement: The authors have declared no conflicts of interest.
Supplementary data
Supplementary data are available at Rheumatology online.
References
- 1. Maciel G, Crowson CS, Matteson EL. et al. Prevalence of primary Sjögren’s syndrome in a US population-based cohort. Arthritis Care Res 2017;69:1612–6. [DOI] [PMC free article] [PubMed] [Google Scholar]
- 2. Both T, Dalm V, van Hagen PM. et al. Reviewing primary Sjögren’s syndrome: beyond the dryness - from pathophysiology to diagnosis and treatment. Int J Med Sci 2017;14:191–200. [DOI] [PMC free article] [PubMed] [Google Scholar]
- 3. Stefanski A-L, Tomiak C, Pleyer U. et al. The diagnosis and treatment of Sjögren’s syndrome. Dtsch Arztebl Int 2017;114:354–61. [DOI] [PMC free article] [PubMed] [Google Scholar]
- 4. Nocturne G, Mariette X.. Advances in understanding the pathogenesis of primary Sjögren’s syndrome. Nat Rev Rheumatol 2013;9:544–56. [DOI] [PubMed] [Google Scholar]
- 5. Ambrosi A, Wahren-Herlenius M.. Update on the immunobiology of Sjögren’s syndrome. Curr Opin Rheumatol 2015;27:468–75. [DOI] [PubMed] [Google Scholar]
- 6. Pertovaara M, Silvennoinen O, Isomäki P.. Cytokine-induced STAT1 activation is increased in patients with primary Sjögren’s syndrome. Clin Immunol 2016;165:60–7. [DOI] [PubMed] [Google Scholar]
- 7. Moriyama M, Hayashida J-N, Toyoshima T. et al. Cytokine/chemokine profiles contribute to understanding the pathogenesis and diagnosis of primary Sjögren’s syndrome. Clin Exp Immunol 2012;169:17–26. [DOI] [PMC free article] [PubMed] [Google Scholar]
- 8. Jonsson R, Kroneld U, Bäckman K. et al. Progression of sialadenitis in Sjögren’s syndrome. Br J Rheumatol 1993;32:578–81. [DOI] [PubMed] [Google Scholar]
- 9. Mignogna MD, Fedele S, Lo Russo L. et al. Sjögren’s syndrome: the diagnostic potential of early oral manifestations preceding hyposalivation/xerostomia. J Oral Pathol Med 2005;34:1–6. [DOI] [PubMed] [Google Scholar]
- 10. Soto-Rojas AE, Kraus A.. The oral side of Sjögren syndrome. Diagnosis and treatment. A review. Arch Med Res 2002;33:95–106. [DOI] [PubMed] [Google Scholar]
- 11. Pringle S, Wang X, Verstappen G. et al. SG stem cells age prematurely in primary Sjögren’s syndrome. Arthritis Rheumatol 2019;71:133–42. [DOI] [PMC free article] [PubMed] [Google Scholar]
- 12. May AJ, Cruz-Pacheco N, Emmerson E. et al. Diverse progenitor cells preserve SG ductal architecture after radiation induced damage. Development 2018;145:dev166363. [DOI] [PMC free article] [PubMed] [Google Scholar]
- 13. Song E-A, Min S, Oyelakin A. et al. Genetic and scRNA-seq analysis reveals distinct cell populations that contribute to SG development and maintenance. Sci Rep 2018;8:14043. [DOI] [PMC free article] [PubMed] [Google Scholar]
- 14. Kwak M, Ninche N, Klein S. et al. c-Kit+ cells in adult SGs do not function as tissue stem cells. Sci Rep 2018;8:14193. [DOI] [PMC free article] [PubMed] [Google Scholar]
- 15. van Deursen JM. The role of senescent cells in ageing. Nature 2014;509:439–46. [DOI] [PMC free article] [PubMed] [Google Scholar]
- 16. Farr JN, Fraser DG, Wang H. et al. Identification of senescent cells in the bone microenvironment. J Bone Miner Res 2016;31:1920–9. [DOI] [PMC free article] [PubMed] [Google Scholar]
- 17. Irvine KM, Skoien R, Bokil NJ. et al. Senescent human hepatocytes express a unique secretory phenotype and promote macrophage migration. World J Gastroenterol 2014;20:17851–62. [DOI] [PMC free article] [PubMed] [Google Scholar]
- 18. Xu M, Pirtskhalava T, Farr JN. et al. Senolytics improve physical function and increase lifespan in old age. Nat Med 2018;24:1246–56. [DOI] [PMC free article] [PubMed] [Google Scholar]
- 19. Choi IY, Lee C, Longo VD.. Nutrition and fasting mimicking diets in the prevention and treatment of autoimmune diseases and immunosenescence. Mol Cell Endocrinol 2017;455:4–12. [DOI] [PMC free article] [PubMed] [Google Scholar]
- 20. Castelo-Branco C, Soveral I.. The immune system and aging: a review. Gynecol Endocrinol 2014;30:16–22. [DOI] [PubMed] [Google Scholar]
- 21. Weyand CM, Yang Z, Goronzy JJ.. T-cell aging in rheumatoid arthritis. Curr Opin Rheumatol 2014;26:93–100. [DOI] [PMC free article] [PubMed] [Google Scholar]
- 22. Maimets M, Bron R, de Haan G. et al. Similar ex vivo expansion and post-irradiation regenerative potential of juvenile and aged SG stem cells. Radiother Oncol 2015;116:443–8. [DOI] [PubMed] [Google Scholar]
- 23. Shiboski CH, Shiboski SC, Seror R. et al. 2016 American College of Rheumatology/European League Against Rheumatism Classification Criteria for Primary Sjögren’s syndrome: a consensus and data-driven methodology involving three international patient cohorts. Arthritis Rheumatol 2017;69:35–45. [DOI] [PMC free article] [PubMed] [Google Scholar]
- 24. Pijpe J, Kalk WWI, Bootsma H. et al. Progression of SG dysfunction in patients with Sjogren’s syndrome. Ann Rheum Dis 2007;66:107–12. [DOI] [PMC free article] [PubMed] [Google Scholar]
- 25. Hočevar A, Ambrožič A, Rozman B. et al. Ultrasonographic changes of major SGs in primary Sjögren’s syndrome. Diagnostic value of a novel scoring system. Rheumatology 2005;44:768–72. [DOI] [PubMed] [Google Scholar]
- 26. van Ginkel MS, Haacke EA, Bootsma H. et al. Presence of intraepithelial B-lymphocytes is associated with the formation of lymphoepithelial lesions in SGs of primary Sjögren’s syndrome patients. Clin Exp Rheumatol 2019;Supp 118:42–8. [PubMed] [Google Scholar]
- 27. Haacke EA, Bootsma H, Spijkervet FKL. et al. FcRL4+ B-cells in SGs of primary Sjögren’s syndrome patients. J Autoimmun 2017;81:90–8. [DOI] [PubMed] [Google Scholar]
- 28. Delli K, Haacke EA, Kroese FGM. et al. Towards personalised treatment in primary Sjögren’s syndrome: baseline parotid histopathology predicts responsiveness to rituximab treatment. Ann Rheum Dis 2016;75:1933–8. [DOI] [PubMed] [Google Scholar]
- 29. Mossel E, Arends S, Nimwegen J. V. et al. Scoring hypoechogenic areas in one parotid and one submandibular gland increases feasibility of ultrasound in primary Sjögren’s syndrome. Ann Rheum Dis 2018;77:556–62. [DOI] [PubMed] [Google Scholar]
- 30. de Paula F, Teshima THN, Hsieh R. et al. Overview of human SGs: highlights of morphology and developing processes. Anat Rec 2017;300:1180–8. [DOI] [PubMed] [Google Scholar]
- 31. Smogorzewska A, Avilion AA, LeFeuvre CE. et al. Different telomere damage signaling pathways in human and mouse cells. EMBO J 2002;21:4338–48. [DOI] [PMC free article] [PubMed] [Google Scholar]
- 32. Campisi J, d'Adda di Fagagna F.. Cellular senescence: when bad things happen to good cells. Nat Rev Mol Cell Biol 2007;8:729–40. [DOI] [PubMed] [Google Scholar]
- 33. Wang X, Bootsma H, Kroese F., Dijkstra G., Pringle S.. Senescent Stem and Transient Amplifying Cells in Crohn s Disease Intestine. Inflammatory Bowel Dis 2020;26:e8–9. 10.1093/ibd/izz295. [DOI] [PMC free article] [PubMed] [Google Scholar]
- 34. Hsu Y-C, Li L, Fuchs E.. Transit-amplifying cells orchestrate stem cell activity and tissue regeneration. Cell 2014;157:935–49. [DOI] [PMC free article] [PubMed] [Google Scholar]
- 35. Seim I, Ma S, Gladyshev VN.. Gene expression signatures of human cell and tissue longevity. npj Aging Mech Dis 2016;2:16014. [DOI] [PMC free article] [PubMed] [Google Scholar]
- 36. Bialek EJ, Jakubowski W, Zajkowski P. et al. US of the major salivary glands: anatomy and spatial relationships, pathologic conditions, and pitfalls. Radiographics 2006;26:745–63. [DOI] [PubMed] [Google Scholar]
- 37. Mossel E, Delli K, van Nimwegen JF. et al. Ultrasonography of major SGs compared with parotid and labial gland biopsy and classification criteria in patients with clinically suspected primary Sjögren’s syndrome. Ann Rheum Dis 2017;76:1883–9. [DOI] [PubMed] [Google Scholar]
- 38. Chai Q, He WQ, Zhou M. et al. Enhancement of blood-brain barrier permeability and reduction of tight junction protein expression are modulated by chemokines/cytokines induced by rabies virus infection. J Virol 2014;88:4698–710. [DOI] [PMC free article] [PubMed] [Google Scholar]
- 39. Stamatovic SM, Dimitrijevic OB, Keep RF. et al. Inflammation and brain edema: new insights into the role of chemokines and their receptors. In: Brain Edema XIII. Vienna: Springer, 2006: 444–50. [DOI] [PubMed]
- 40. Varin M-M, Guerrier T, Devauchelle-Pensec V. et al. In Sjögren’s syndrome, B lymphocytes induce epithelial cells of SGs into apoptosis through protein kinase C delta activation. Autoimmun Rev 2012;11:252–8. [DOI] [PubMed] [Google Scholar]
- 41. Lande R, Giacomini E, Grassi T. et al. IFN-αβ released by mycobacterium tuberculosis -infected human dendritic cells induces the expression of CXCL10: selective recruitment of NK and activated T cells. J Immunol 2003;170:1174–82. [DOI] [PubMed] [Google Scholar]
Associated Data
This section collects any data citations, data availability statements, or supplementary materials included in this article.