Abstract
Anti-CD19 chimeric antigen receptor (CAR) T cell therapies can cause severe cytokine-release syndrome (CRS) and neurotoxicity, impeding their therapeutic application. Here we generated a new anti-CD19 CAR molecule (CD19-BBz(86)) derived from the CD19-BBz prototype bearing co-stimulatory 4-1BB and CD3ζ domains. We found that CD19-BBz(86) CAR T cells produced lower levels of cytokines, expressed higher levels of antiapoptotic molecules and proliferated more slowly than the prototype CD19-BBz CAR T cells, although they retained potent cytolytic activity. We performed a phase 1 trial of CD19-BBz(86) CAR T cell therapy in patients with B cell lymphoma (ClinicalTrials.gov identifier NCT02842138). Complete remission occurred in 6 of 11 patients (54.5%) who each received a dose of 2 × 10⁸−4 × 10⁸ CD19-BBz(86) CAR T cells. Notably, no neurological toxicity or CRS (greater than grade 1) occurred in any of the 25 patients treated. No significant elevation in serum cytokine levels after CAR T cell infusion was detected in the patients treated, including in those who achieved complete remission. CD19-BBz(86) CAR T cells persistently proliferated and differentiated into memory cells in vivo. Thus, therapy with the new CD19-BBz(86) CAR T cells produces a potent and durable antilymphoma response without causing neurotoxicity or severe CRS, representing a safe and potent anti-CD19 CAR T cell therapy.
The second-generation anti-CD19 CAR prototype (CD19-BBz), bearing FMC63 single-chain variant fragment (scFv) together with intracellular 4-1BB co-stimulatory and CD3ζ signaling domains linked by a CD8α sequence comprising the hinge and transmembrane domains, was originally developed by Imai et al. in 2004 (refs. 1,2). This CD19-BBz CAR construct was cloned into a lentiviral vector for preclinical and clinical studies, and the transduced CAR T cells were later termed CTL019 (Kymriah)3–8. CTL019 and other anti-CD19 CAR T cells are effective in the treatment of relapsed or refractory B cell lymphoma and leukemia, but they often cause severe toxicities, including CRS and neurological toxicities, which have been correlated with significantly elevated serum levels of inflammatory cytokines4–19.
To generate a safe anti-CD19 CAR T cell therapy, we used guidance from a tertiary-structure-prediction program (Phrye2)20 to create a panel of representative CD19-BBz variants, genetically altering sequences encoding the extracellular and intracellular domains of the CD8α molecule in the prototype CD19-BBz CAR construct (CD19-BBz(71))1–3 (Fig. 1a,b), and identified CAR variants with reduced ability to produce cytokines. We found that T cells transduced with the CD19-BBz(86) variant CAR vector produced significantly lower levels of cytokines and expressed higher levels of antiapoptotic molecules than T cells transduced with the prototype CD19-BBz(71) when they interacted with CD19+ human tumor cells (Fig. 1c,d). T cells transduced with CD19-BBz(86) proliferated more slowly than T cells transduced with CD19-BBz(71) when they interacted with CD19+ tumor cells (Extended Data Fig. 1). Despite exhibiting reduced cytokine production, CD19-BBz(86) CAR T cells retained potent cytolytic activity against CD19+ tumor cells in vitro and in vivo (Extended Data Fig. 1 and Supplementary Fig. 1). The CD19-BBz(86) CAR variant contains an 86-amino-acid fragment from human CD8α, comprising a longer extracellular-domain fragment (55 amino acids versus 45 amino acids in the CD19-BBz(71) prototype) and a longer intracellular sequence (7 amino acids versus 3 amino acids in CD19-BBz(71)) (Fig. 1a). The CD19-BBz(86) lentiviral vector coexpressing the CD19-BBz(86) variant CAR and truncated, nonfunctional epidermal growth factor receptor (tEGFR) as a marker for transduction and anti-EGFR antibody-mediated cell ablation17,21 (Fig. 1a) was selected for further studies.
Fig. 1 |. CD19-BBz(86)-transduced CAR T cells have lower cytokine production and higher antiapoptotic molecule expression.
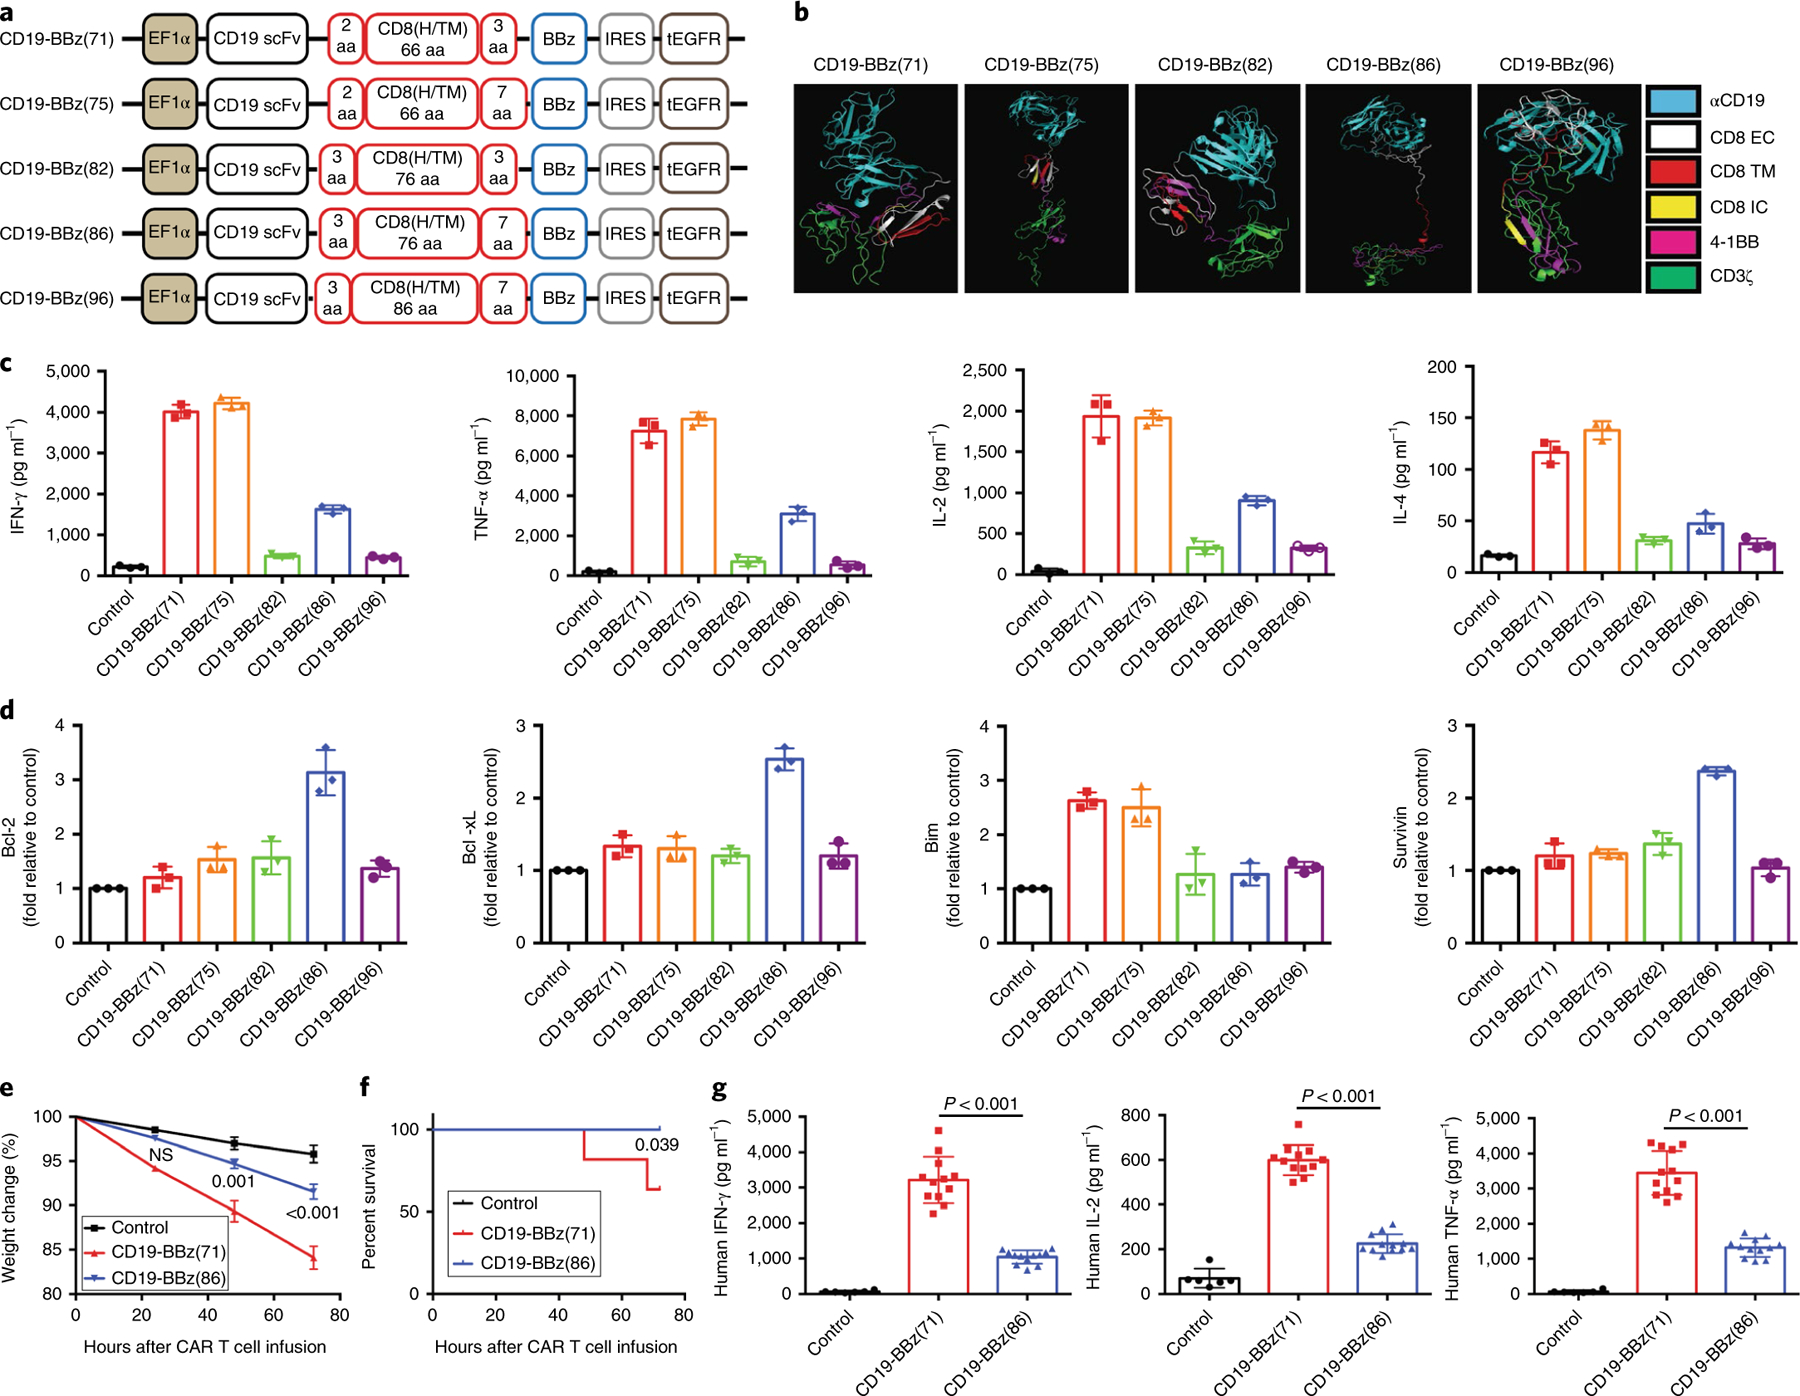
a, Schematic of the recombinant lentiviral vectors encoding the prototype anti-CD19 CAR (CD19-BBz(71); also termed CTL019) or variants generated in this study. Coexpression of tEGFR was facilitated by the internal ribosome entry site (IRES), and expression of the construct was under the control of the elongation factor (EF) 1α promoter. CD8(H/TM), CD8α hinge and transmembrane domains. b, Predicted tertiary structures of the CD19-BBz CAR variants in the PyMOL molecular graphics program. αCD19, anti-CD19 scFv; EC, extracellular domain; IC, intracellular domain; TM, transmembrane domain. c, Different levels of cytokines secreted by CD19-BBz-variant-transduced CAR T cells. Human T cells isolated from donor peripheral blood mononuclear cells (PBMCs) were stimulated with Dynabeads Human T Activator CD3/CD28 and then transduced with vectors encoding the indicated CD19-BBz variants. One week after transduction, CAR T cells were co-cultured with irradiated CD19-expressing K562 cells and the culture medium was collected for ELISA. Data are presented as the mean ± s.d. Experiments were repeated with T cells derived from four donors. A two-tailed, unpaired two-sample t test was used for statistical analysis; *P < 0.003, CD19-BBz(86) versus CD19-BBz(71). d, qRT–PCR analysis of the mRNA levels of apoptotic or antiapoptotic molecules in CD19-BBz-variant-transduced CAR T cells after co-culture with irradiated CD19-K562 cells. Data from one of three repeated experiments are presented as the mean ± s.d. Experiments were repeated with T cells derived from three donors. A two-tailed, unpaired two-sample t test was used for statistical analysis; *P < 0.002, CD19-BBz(86) versus CD19-BBz(71). e,f, Groups of SCID-beige mice were inoculated i.p. with 3 × 10⁶ Raji cells followed by i.p. injection with 35 × 106 CD19-BBz(71) or CD19-BBz(86) CAR T cells or mock (PBS). e, Weight change in tumor-bearing mice after CAR T cell transfer. The weight for each mouse was normalized to the starting weight before CAR T cell transfer (n = 10 mice). Data are presented as the mean ± s.d. A multiple t test was used for statistical analysis; NS, not significant. f, Percentage of surviving tumor-bearing mice after i.p. injection with CAR T cells (n = 10 mice). A log-rank Mantel–Cox test was used for statistical analysis. Data are presented from one of two independent experiments with similar results. g, Serum human cytokine levels. SCID-beige mice were inoculated i.p. with 3 × 10⁶ Raji cells followed by i.p. injection with 35 × 106 CD19-BBz(71) or CD19-BBz(86) CAR T cells or mock. Sixty hours after CAR T cell injection, mice were bled and sera were isolated for determination of the serum concentrations of the indicated cytokines by ELISA (n = 6 for the control group, n = 12 for the CAR T cell groups). Data are presented as the mean ± s.d. A two-tailed, unpaired two-sample t test was used for statistical analysis.
We evaluated the differences between CAR T cells with the variant CD19-BBz(86) and prototype CD19-BBz(71) CAR molecules with respect to production of cytokines and induction of CRS by using the SCID-beige mouse model of CRS22. CD19-BBz(71) CAR T cells caused severe CRS, resulting in significant weight loss and eventual mortality in a substantial portion of the mice treated in comparison to control (PBS) (Fig. 1e,f). In contrast, CD19-BBz(86) CAR T cells did not cause CRS, and all mice treated with these cells survived and did not have substantial weight loss in comparison to control mice. Moreover, serum concentrations of human cytokines produced by the CAR T cells were significantly lower in mice treated with CD19-BBz(86) CAR T cells than in mice treated with CD19-BBz(71) CAR T cells (Fig. 1g). Serum levels of mouse cytokines, primarily produced by host myeloid cells activated by CAR T cells22,23, were also significantly lower in mice treated with CD19-BBz(86) CAR T cells. We also observed a more modest increase in peritoneal myeloid cell numbers and cytokine mRNA levels after intraperitoneal (i.p.) injection with CD19-BBz(86) CAR T cells (Extended Data Fig. 1). These in vitro and in vivo data demonstrate that CD19-BBz(86) CAR T cells retain potent cytolytic activity, have reduced ability to produce proinflammatory cytokines and to recruit and activate myeloid cells, and do not cause CRS in tumor-bearing SCID-beige mice.
We performed a phase 1 trial of CD19-BBz(86) CAR T cell therapy in patients with refractory B cell lymphoma. A total of 26 patients were enrolled in the study, and 25 patients received treatment. One patient did not receive treatment owing to an inability to manufacture a sufficient number of CAR T cells. The characteristics of the patients who received CD19-BBz(86) CAR T cell infusions are shown in Table 1 and Supplementary Tables 1 and 2. Characteristics of the infused CD19-BBz(86) CAR T cells are shown in Supplementary Table 3.
Table 1 |.
Baseline characteristics of patients and clinical response after CD19-BBz(86) CAR T cell therapy
| Patient number | Sex | Age (years) | Lymphoma type | Number of previous therapiesa | Number of ASCTs | Disease stage | IPI score | Refractory statusb | Total CAR T cells infused | Best responsec | Duration of response (d)d | CRS | Neurological toxicity |
|---|---|---|---|---|---|---|---|---|---|---|---|---|---|
| BZ001 | M | 65 | FL3a | 2 | 0 | IV | 4 | Refractory | 6.4 × 10⁶ | PR | 281 | None | None |
| BZ002 | F | 68 | Non-GCB DLBCL | 5 | 0 | IV | 3 | Refractory | 5.7 × 10⁶ | SD | Grade 1 | None | |
| BZ004 | F | 37 | FL2 | 2 | 0 | IV | 3 | Not refractory | 3 × 10⁶ | PR | 395+ | None | None |
| BZ005 | M | 43 | FL2 | 2 | 0 | IV | 1 | Not refractory | 6 × 10⁶ | CR | 211 | None | None |
| BZ006 | M | 48 | Non-GCB DLBCL | 3 | 0 | IV | 2 | Refractory | 6 × 10⁶ | PD | None | None | |
| BZ007 | M | 30 | GCB DLBCL | 2 | 0 | II | 0 | Refractory | 6 × 10⁶ | PD | None | None | |
| BZ008 | M | 26 | Non-GCB DLBCL | 3 | 1 | IV | 1 | Not refractory | 6 × 10⁷ | PR | 82 | None | None |
| BZ009 | M | 24 | Non-GCB DLBCL | 2 | 0 | IV | 2 | Not refractory | 6 × 10⁷ | PR | 119 | None | None |
| BZ010 | F | 42 | Non-GCB DLBCL | 6 | 0 | IV | 3 | Refractory | 6 × 10⁷ | PD | Grade 1 | None | |
| BZ011 | F | 30 | HGBL with MYC | 2 | 0 | IV | 2 | Refractory | 6 × 10⁷ | PR | 92 | None | None |
| and BCL2 R | |||||||||||||
| BZ018 | F | 50 | FL2 | 4 | 0 | IV | 2 | Not refractory | 4.3 × 10⁷ | SD | None | None | |
| BZ012 | M | 36 | Non-GCB DLBCL | 4 | 2 | IV | 3 | Refractory | 1.8 × 10⁸ | PD | None | None | |
| BZ013 | F | 63 | Non-GCB DLBCL | 2 | 0 | IV | 4 | Refractory | 1.8 × 10⁸ | PD | None | None | |
| BZ014 | M | 67 | GCB DLBCL | 2 | 0 | IV | 3 | Refractory | 1.8 × 10⁸ | PR | 186 | None | None |
| BZ015 | M | 48 | Non-GCB DLBCL | 3 | 0 | IV | 2 | Refractory | 3.6 × 10⁸ | CR | 290+ | None | None |
| BZ016 | F | 50 | GCB DLBCL | 3 | 0 | III | 1 | Refractory | 3.6 × 10⁸ | CR | 210+ | None | None |
| BZ017 | M | 33 | FL with large B cell transformation | 3 | 1 | IV | 2 | Refractory | 2.5 × 10⁸ | PD | Grade 1 | None | |
| BZ019 | F | 66 | Non-GCB DLBCL | 1 | 1 | IV | 3 | Not refractory | 3.6 × 10⁸ | CR | 188+ | None | None |
| BZ020 | F | 60 | Non-GCB DLBCL | 4 | 1 | IV | 3 | Refractory | 2.0 × 10⁸ | CR | 162 | None | None |
| BZ021 | F | 66 | Non-GCB DLBCL | 2 | 0 | III | 3 | Refractory | 2.5 × 10⁸ | CR | 174+ | Grade 1 | None |
| BZ022 | F | 63 | Non-GCB DLBCL | 3 | 0 | IV | 4 | Refractory | 3.6 × 10⁸ | PD | Grade 1 | None | |
| BZ023 | M | 47 | FL3a | 5 | 0 | III | 2 | Not refractory | 3.6 × 10⁸ | PD | None | None | |
| BZ024 | F | 39 | FL2 | 2 | 0 | IV | 2 | Refractory | 3.6 × 10⁸ | PR | 153+ | None | None |
| BZ025 | M | 35 | FL3a | 3 | 1 | IV | 2 | Not refractory | 3.7 × 10⁸ | CR | 173+ | Grade 1 | None |
| BZ026 | M | 76 | Non-GCB DLBCL | 3 | 0 | IV | 4 | Not refractory | 3.2 × 10⁸ | PR | 55 | Grade 1 | None |
ASCT, autologous stem cell transplantation; CR, complete remission; F, female; FL, follicular lymphoma; GCB DLBCL, germinal center B cell–like diffuse large B cell lymphoma; HGBL with MYC and BCL2 R, high-grade B cell lymphoma with MYC and BCL2 rearrangement; IPI score, International Prognostic Index score; M, male; PD, progressive disease; PR, partial remission; SD, stable disease.
All previous therapies and response for each patient are listed in Supplementary Tables 1 and 4–10.
Disease was defined as refractory if a patient did not achieve partial or complete remission after the most recent chemotherapy.
Best response was defined as the best response that a patient achieved after CAR T cell infusion.
Duration of response was defined as the time from the first documented response (complete or partial remission) to the date of relapse, initiation of new treatment or death due to underlying disease. If a patient had not relapsed or died at the time of data cutoff, duration of response was censored on the date for the last available visit.
Ongoing clinical respones.
At the lowest dose of 3–6 × 10⁶ total CD19-BBz(86) CAR T cells per patient, three of six patients attained a treatment response. At the medium dose of 6–19 × 107 total CD19-BBz(86) CAR T cells per patient, four of eight patients attained a partial response. At the highest dose of 2–4 × 10⁸ total CD19-BBz(86) CAR T cells per patient, 6 of 11 patients achieved complete remission (54.5%) and 2 of 11 patients achieved partial remission (18%) (Table 1). Figure 2a shows positron emission tomography–computed tomography (PET–CT) images for the six patients who achieved complete remission. Clinical responses in patients achieving complete remission were durable, with five of six patients maintaining ongoing complete remission on the date for the last visit. Clinical responses in some of the patients achieving partial remission were also durable (Fig. 2b, Extended Data Fig. 2 and Supplementary Fig. 2). The median duration of response for the six patients who achieved complete remission was >181 d (range 162–290 d) (Fig. 2c and Supplementary Fig. 2). Sequential CT or PET–CT images of the patients (BZ004, BZ024, and B025) showed durable, ongoing complete or partial remission after CD19-BBz(86) CAR T cell infusion (Fig. 2b and Extended Data Fig. 2). These data indicate that CD19-BBz(86) CAR T cells produce a potent and durable antitumor response.
Fig. 2 |. Patients with refractory or relapsed lymphoma achieved durable remission after CD19-BBz(86) CAR T cell treatment.
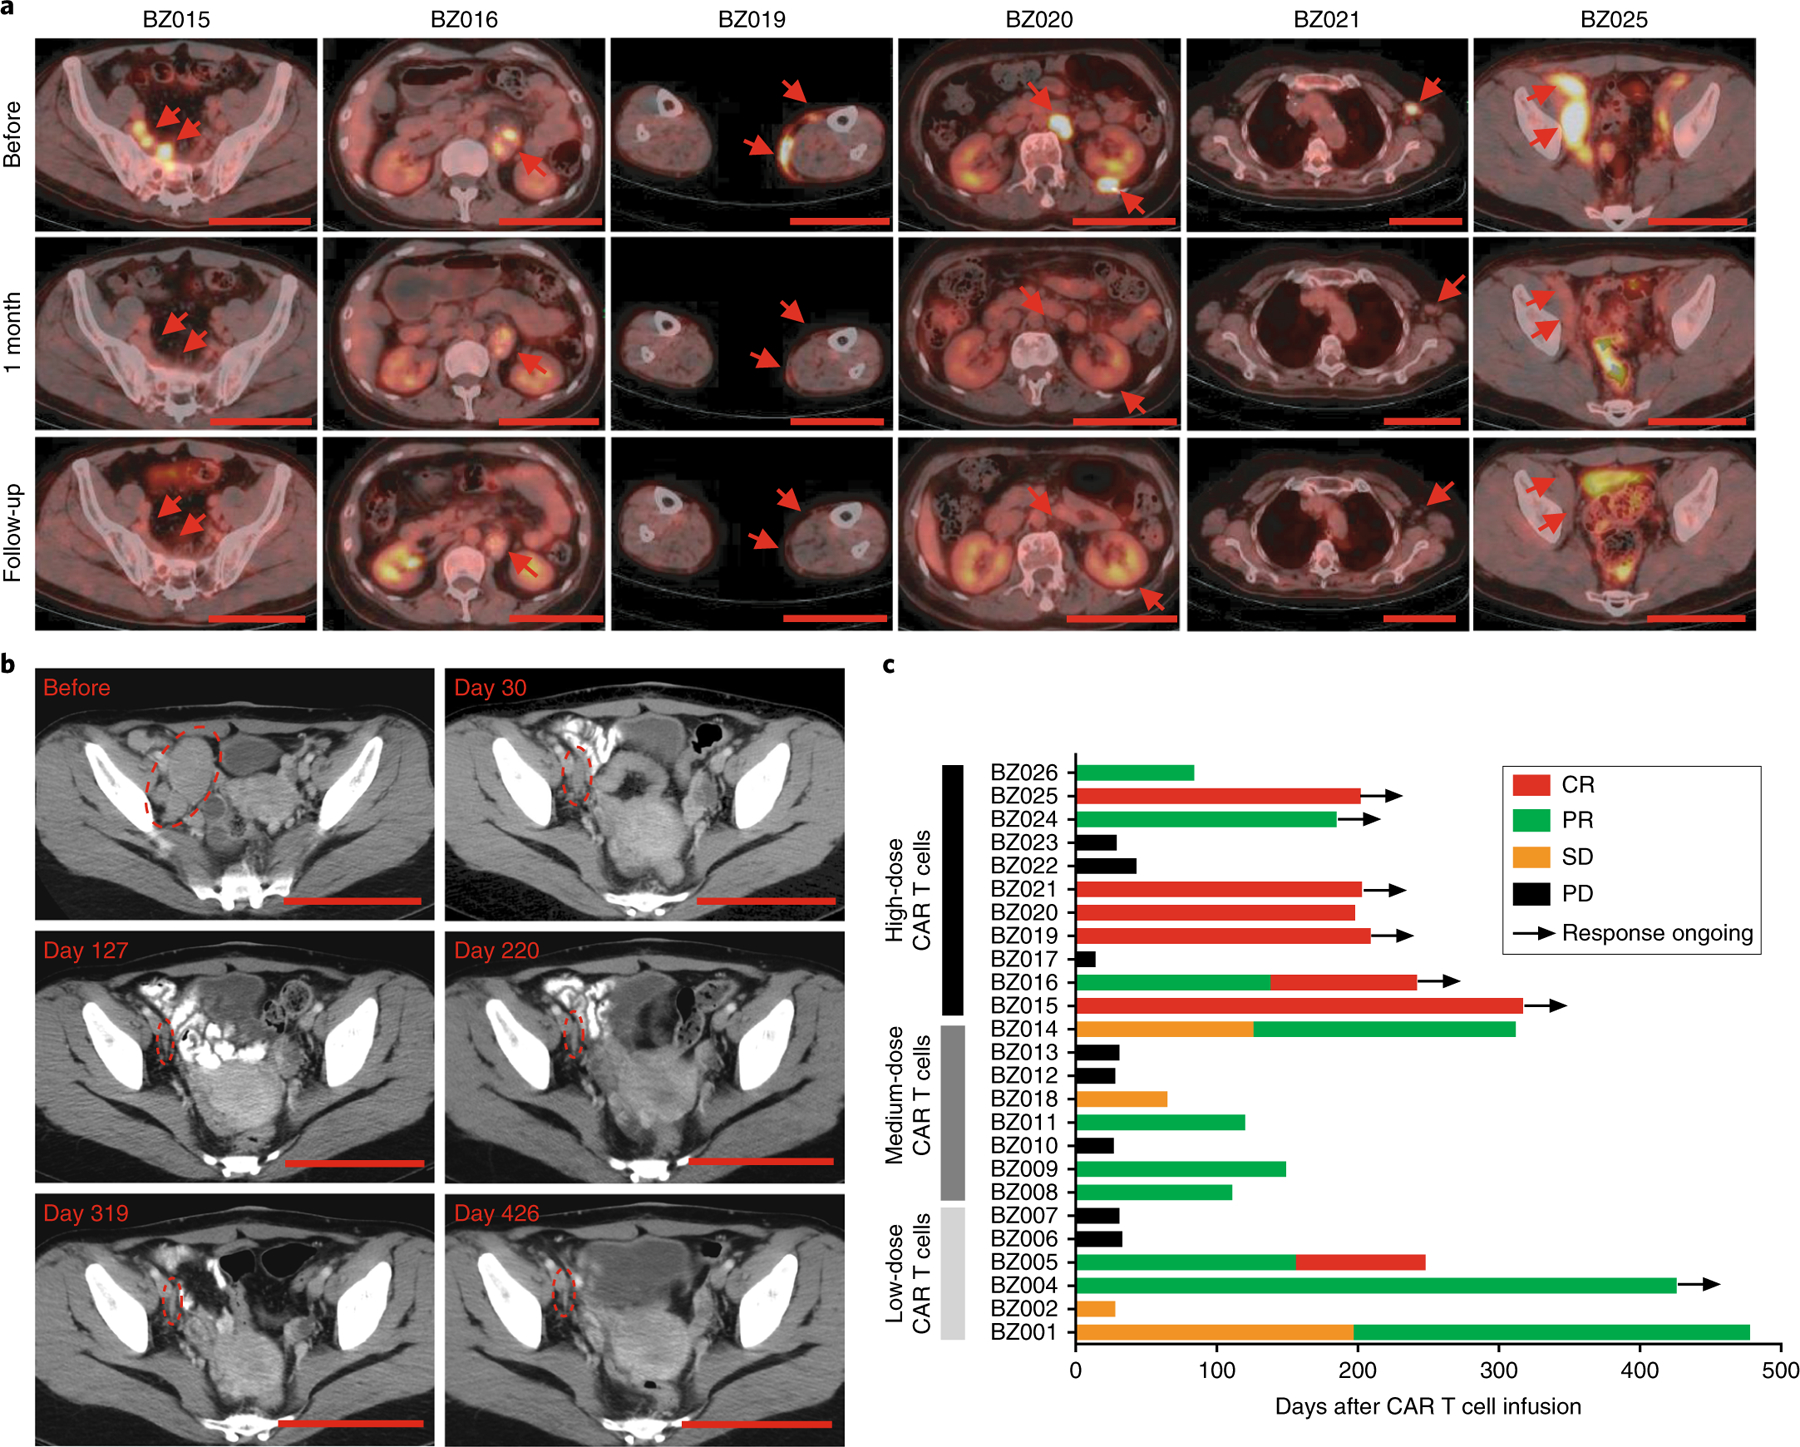
a, Representative PET–CT scans of six patients before and after CAR T cell treatment showing durable complete remission. Red arrows indicate sites of lymphoma. Top, PET–CT scans taken before CAR T cell therapy; middle, PET–CT scans taken approximately 1 month after (days 27–35) CAR T cell therapy; bottom, PET–CT scans at the most recent follow-up (day 237 for patient BZ015, day 242 for patient BZ016, day 209 for patient BZ019, day 129 for patient BZ020, day 203 for patient BZ021 and day 119 for patient BZ025). Scale bars, 10 cm. b, CT scans showing long-term remission in patient BZ004 treated with CD19-BBz(86) CAR T cells at a dose of 3 × 10⁶ cells. Circles indicate sites of lymphoma. Scale bars, 10 cm. c, Treatment response of each patient after CD19-BBz(86) CAR T cell treatment and the duration of response. Ongoing remission is marked by a black arrow. Patient number and dose of CD19-BBz(86) CAR T cells are shown to the left of the y axis. CR, complete remission; PR, partial remission; SD, stable disease; PD, progressive disease.
Adverse events of special interest that may be related to CD19-BBz(86) CAR T cell therapy are shown in Table 1 and Supplementary Tables 4–10. The severity of CRS was graded according to consensus criteria15,24. Neurological toxicities were graded according to the National Cancer Institute Common Toxicity Criteria for Adverse Events (NCI CTCAE; version 4.03). No CRS of greater than grade 1 was observed in any of the 25 infused patients (Supplementary Tables 4 and 5). No neurological toxicities were observed in any of the treated patients. None of the study participants required medical treatment to relieve the mild side effects (grade 1 CRS). One individual (patient BZ010) with a pre-enrollment history of disease refractory to six lines of chemotherapy did not respond to the CD19-BBz(86) CAR T cell infusion and died of disease progression 1 month after infusion. No patient developed dose-limiting toxicity (DLT), and the maximum tolerated dose (MTD) was not reached in this trial. A majority of patients developed the toxicities expected with cytotoxic lymphodepletion chemotherapy, including bone marrow suppression (Extended Data Fig. 3 and Supplementary Figs. 3–7). Taken together, these data demonstrate that CD19-BBz(86) CAR T cell therapy has potent clinical efficacy without causing any neurological toxicity or severe CRS (greater than grade 1).
Adverse events of CRS and neurotoxicity are closely related to a marked increase in the serum levels of cytokines produced directly by rapidly proliferating CAR T cells after encountering CD19+ tumor or normal B cells or indirectly by myeloid cells activated by CAR T cells17,22,23,25–27. A panel of serum inflammatory and immune-modulating cytokines, chemokines and T cell effector proteins was quantified in patient sera. In contrast to previous reports of marked increases in serum cytokine concentrations following anti-CD19 CAR T cell therapy15,18,19, serum cytokines and immune modulators, such as IL-6, tumor necrosis factor (TNF)-α, interferon (IFN)-γ, IL-17A, IL-2, IL-15, IL-5, IL-12 p70, IL-1β and C-reactive protein (CRP), unexpectedly all remained at basal or low levels on different days after CD19-BBz(86) CAR T cell infusion in all treated patients (Fig. 3a,b). Only the serum concentrations of T cell effector proteins, granzyme A and granzyme B, appeared higher in patients achieving complete or partial remission than in patients with progressive disease (Fig. 3c). Prolonged depletion of normal CD19+ B cells was observed in all patients, while CD3+ T cell numbers returned to normal (Supplementary Figs. 6 and 7). Hypogammaglobulinemia was observed in treated patients (Extended Data Figs. 4–6). Levels of other blood proteins were also examined (Supplementary Figs. 8–15). Collectively, these data indicate that CD19-BBz(86) CAR T cells produce potent antitumor responses without causing the elevated serum cytokine concentrations that are primarily responsible for CRS and neurological toxicity.
Fig. 3 |. No significant elevation in serum cytokine levels after CD19-BBz(86) CAR T cell infusion.
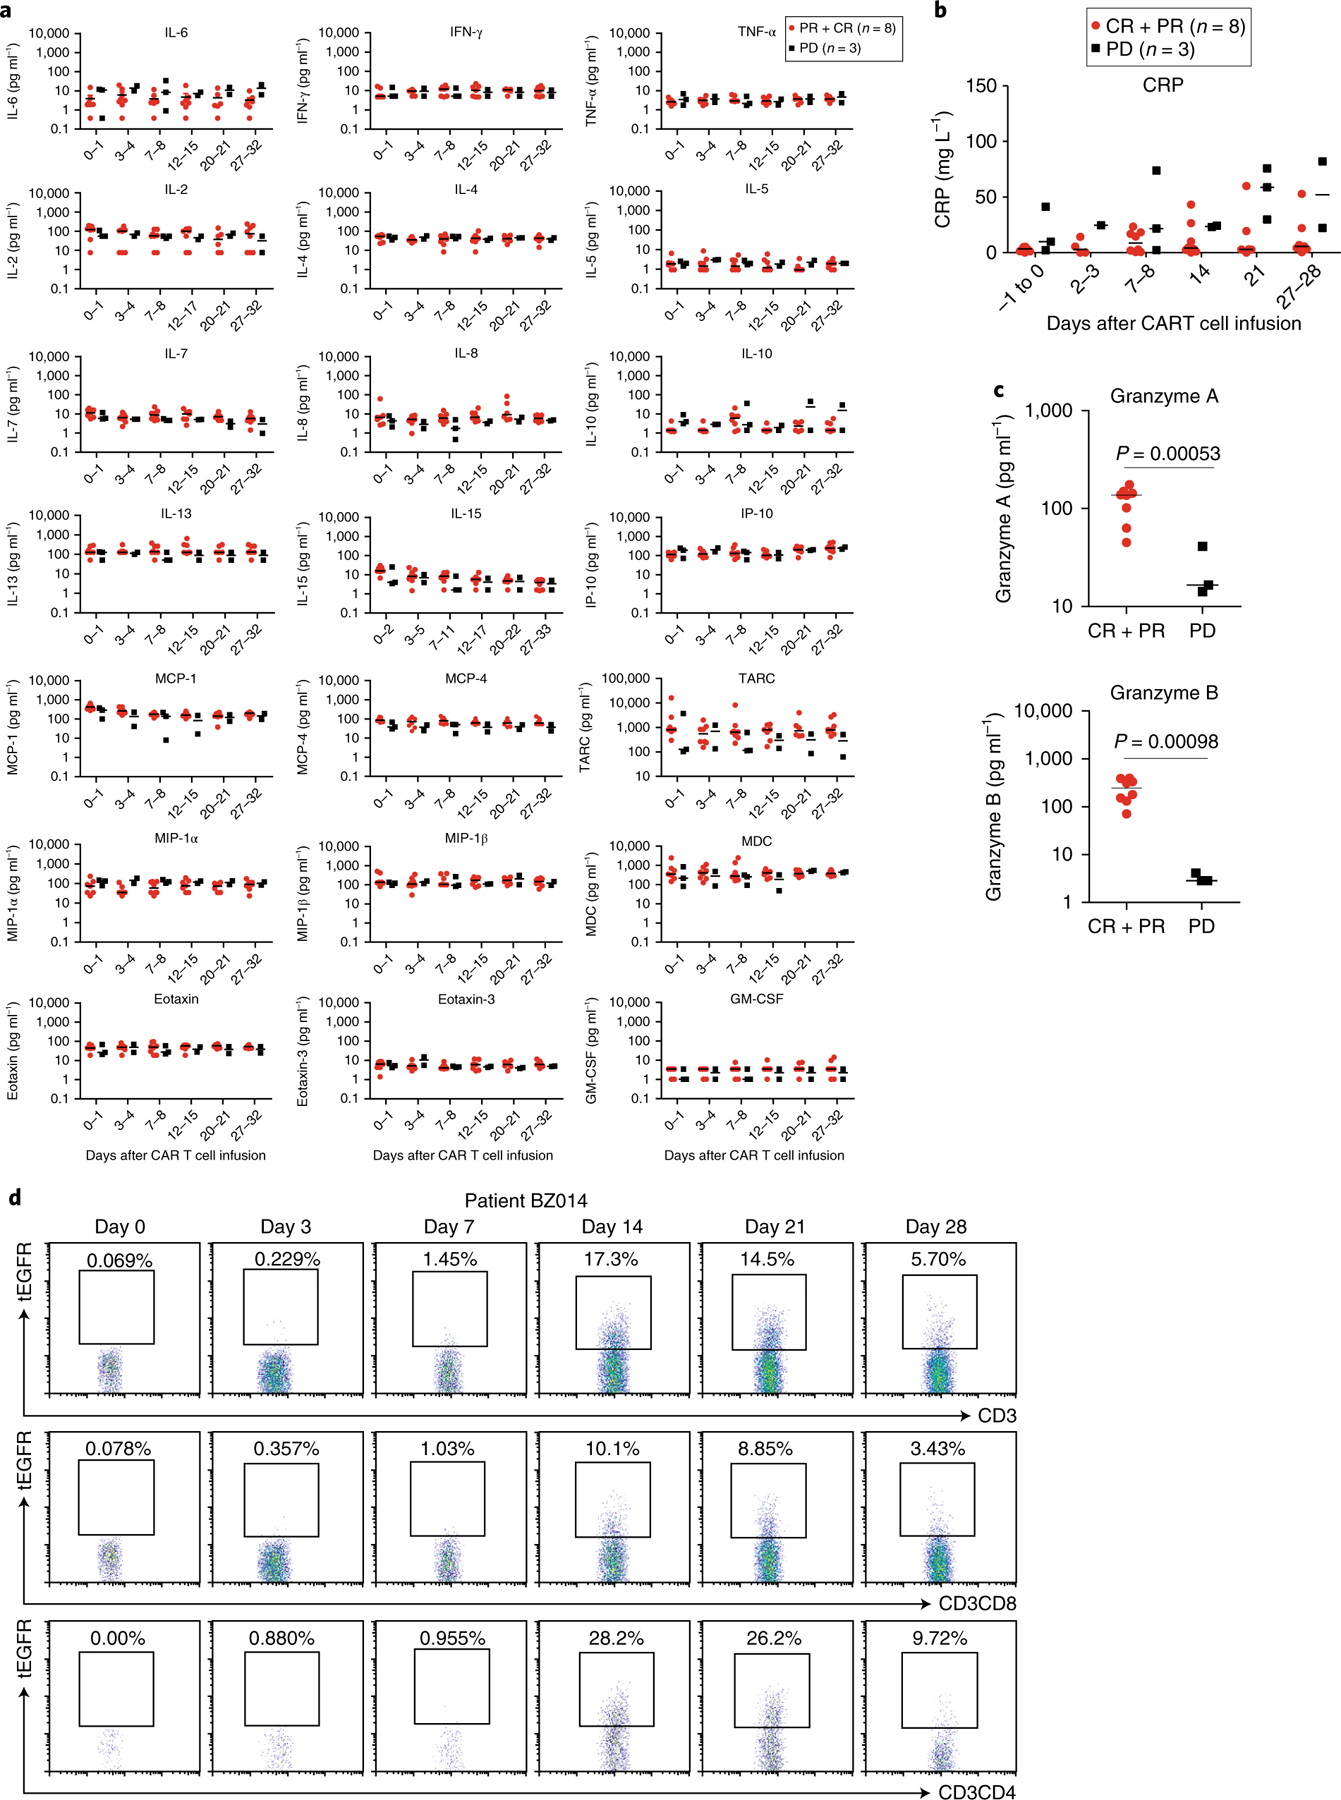
a, Serum kinetics of a panel of cytokines in 11 patients who received infusions with high doses of CD19-BBz(86) CAR T cells (total of 2–4 × 10⁸ CAR T cells per patient), as determined by Luminex multiplex assay (R&D Systems). Of the 11 patients, 6 achieved complete remission, 2 achieved partial remission and 3 had progressive disease. Horizontal lines denote median values. b, Serum levels of CRP in patients who achieved remission (complete or partial; n = 8) or had progressive disease (n = 3) after CAR T cell infusion. ‘−1 to 0’, 1 d before or the same day as CAR T cell infusion. Horizontal lines denote median values. c, Serum granzyme levels were significantly higher in patients who achieved complete or partial remission (n = 8) than in patients who had progressive disease (n = 3) 1 week after CAR T cell infusion. P values were calculated by two-tailed Student’s t tests. Horizontal lines denote median values. d, Flow cytometry analysis showing in vivo expansion of tEGFR+ CD19-BBz(86) CAR T cells in the peripheral blood of representative patient BZ014, who achieved a PR.
We detected in vivo expansion of tEGFR+ CD19-BBz(86) CAR T cells by flow cytometry analysis (Fig. 3d, Extended Data Fig. 7 and Supplementary Fig. 16). Efficient in vivo expansion and persistence of CD19-BBz(86) CAR T cells was also detected by qPCR (Extended Data Fig. 7). Phenotypes of the memory tEGFR+ CAR T cells were evaluated by flow cytometry analysis for CD45RA and CCR7 (refs. 28–30). Data from six patients showed that a majority of tEGFR+ CD19-BBz(86) CAR T cells following in vivo expansion (median of 95.2%) were CD45RA−, and a substantial proportion of tEGFR+ CD19-BBz(86) CAR T cells exhibited a CD45RA−CCR7+ central memory phenotype28–30 (Extended Data Fig. 7). At 317 d after cell infusion (in patient BZ015), tEGFR+ CAR T cells were still detectable and 45.8% of tEGFR+CD3+CD8+ CD19-BBz(86) CAR T cells exhibited the CD45RO+CCR7+ central memory phenotype (Extended Data Fig. 7). These data demonstrate persistent in vivo expansion and memory generation of CD19-BBz(86) CAR T cells in treated patients.
The results of this study indicate that the length of the CD8α extracellular hinge and intracellular domains, which lack intrinsic signaling function, is critical for cytokine production, proliferation and memory generation in CAR T cells. During the course of this study, several preclinical studies have also suggested an important role for the hinge and transmembrane domain sequences in CAR T cell activation and function31,32. This study provides an avenue for CAR design with an optimal length of the hinge and intracellular sequences to improve the safety and efficacy of CAR T cell therapy.
In contrast to previous reports of significantly elevated levels of serum cytokines15,18,19, we unexpectedly found no substantial elevation of serum cytokine concentrations after CD19-BBz(86) CAR T cell infusion in the treated patients, including those achieving complete or partial remission. Cytokines—small molecules with very short half-lives in serum—function at a range of concentrations in local lymphoid or inflammatory tissues33,34. The CD19-BBz(86) CAR T cells generated in this study had a lower capacity for cytokine production and cell proliferation than T cells with the prototype CD19-BBz CAR, but retained cytolytic activity. CD19-BBz(86) CAR T cells persistently proliferated and differentiated into memory cells in vivo, which may contribute to durable response. The mechanisms underlying the functional difference between T cells with the prototype CD19-BBz CAR and the CD19-BBz(86) variant CAR are not yet clear. The genetic alterations affecting the CD8α hinge and intracellular domain sequences may change the stability and dimerization of the CD19-BBz CAR and its interaction with downstream adaptors and signaling molecules for T cell activation. Thus far, understanding of how signaling by CARs directs T cell functional output is still rudimentary35. A comprehensive investigation is needed to mechanistically reveal the features of signaling and activation in CD19-BBz(86) CAR T cells. Additionally, multicenter clinical trials are warranted to evaluate the safety and efficacy of this new CAR T cell therapy.
In summary, this study demonstrates that the improved version of CD19-BBz(86) CAR T cells is effective in treatment of refractory B cell lymphoma and does not cause neurological toxicity or severe CRS, representing a safe and potent anti-CD19 CAR T cell therapy.
Methods
Trial design and clinical protocol summary.
A phase 1, dose-escalation, single-arm clinical trial was designed to evaluate the safety and feasibility of using autologous CD19-BBz(86) CAR T cells in patients with relapsed or refractory B cell lymphoma. The clinical protocol was reviewed and approved by the Medical Ethics Committee of Beijing Cancer Hospital and has been registered at ClinicalTrials.gov with identifier NCT02842138. Patients were recruited and treated at Beijing Cancer Hospital in Beijing, China.
- Inclusion criteria:
- CD19+ B cell lymphoma, as determined by immunohistochemistry or flow cytometry;
- Previous history of at least two lines of standard of care therapy;
- Ineligibility for allogeneic transplantation or relapse after transplantation;
- Age of 18 years or older;
- Life expectancy of >3 months;
- Eastern Cooperative Oncology Group (ECOG) score of ≤2;
- Satisfactory major organ functions: adequate heart function with left ventricular ejection fractions ≥ 50%; pulse oximetry ≥ 90%; Cockcroft–Gault creatinine clearance ≥ 40 ml min−1; alanine aminotransferase (ALT) and aspartate aminotransferase (AST) ≤ 3 upper limit of normal; and bilirubin ≤ 2.0 mg dl−1;
- Blood: hemoglobin ≥ 80 g L−1; absolute neutrophil count ≥ 1 × 10⁹cells L−1; and platelet ≥ 50 × 109 cells L−1;
- A negative pregnancy test for women of reproductive potential and an agreement to use birth control during the study and 1 year after by men and women of reproductive potential;
- Measurable tumors.
- Exclusion criteria:
- Use of immunosuppressive drugs or systemic steroids within 1 week of enrollment;
- Active infection;
- HIV-positive status;
- Active hepatitis B or hepatitis C viral infection;
- Breast feeding or pregnancy if a woman;
- Refusal to practice birth control during the study and 1 year after;
- Previous history of other malignances; however, patients who were cured from skin basal cell carcinoma or cervical cancer or who had their tumors removed by surgical resection but without further therapies and had more than 5 years of progression-free survival were included in the study;
- Current enrollment in another study;
- Ineligibility or lack of ability to comply with the study, in the opinion of the investigators.
Written informed consent was obtained from patients after potential risks were discussed. CAR T cell therapy included 3 d of lymphodepletion chemotherapy comprising fludarabine (25 mg m−2 on days 1–3) and cyclophosphamide (250 mg m−2 on days 1–3). CAR T cell infusion was started 4 d after the end of lymphodepletion chemotherapy. CAR T cells were infused into each patient in a 3-d split-dose regimen (day 0, 30%; day 1, 30%; day 2, 40%).
CAR T cell manufacture.
PBMCs were collected from patients by leukapheresis. PBMCs were isolated and purified from leukapheresis products by Ficoll-Paque density-gradient centrifugation and were then seeded into flasks that had been coated with anti-CD3/anti-CD28 antibodies. PBMCs were cultured in X-VIVO 15 medium supplemented with IL-2. Two days after initial T cell activation, T cells were transduced with a lentivirus encoding CD19-BBz(86) CAR. Cells were expanded for an additional 11–13 d. Quality checks were performed during the CAR T cell manufacturing process.
Release criteria for the final CAR T cell products included the following:
Cell viability ≥ 70%;
CD3+ cells ≥ 80%;
Endotoxins ≤ 1 EU ml−1;
Mycoplasma: negative;
Bacterial culture: negative;
Fungal culture: negative;
tEGFR+ cells (transduction efficiency) ≥ 2%.
Response assessment.
Response to treatment of malignant lymphoma was assessed according to the revised criteria for Response Assessment of the Lugano Classification, which was recommended by a workshop held at the eleventh and twelfth meetings for the International Conference on Malignant Lymphoma in Lugano, Switzerland (Supplementary Table 11).
Assessment and grading of cytokine-release syndrome.
CRS was assessed and graded according to the CRS grading system developed by Lee et al.15 with minor modifications (Supplementary Table 12).
Assessment and grading of neurological toxicity.
Neurological toxicity assessment and grading after CAR T cell infusion were performed daily on inpatients by the clinical oncology team. Neurological toxicities were assigned to adverse event terms and graded according to the NCI CTCAE (v4.03) by clinical doctors who managed the patient. Neurological symptoms were monitored starting on the day of CAR T cell infusion to at least 1 month after infusion and were continuously reported to investigation doctors up to 3 months after CAR T cell infusion. When a patient developed symptoms of CRS, such as fever and/or hypertension, or other types of adverse events, the patient was kept on close watch for signs of neurological toxicity, such as cognitive disturbance, delirium, seizure and tremors. When neurological toxicities were identified, symptoms were assessed and graded by CTCAE v4.03. A retrospective review of the hospital electronic records was performed 3 months after CAR T cell infusion. The highest grade for each adverse event identified after CAR T cell infusion is reported as the patient’s neurological toxicity.
Assessment and grading of adverse events.
Patients remained inpatients and were closely monitored during lymphodepletion chemotherapy and the 3 d of CAR T cell infusion. All clinical and physical examinations were recorded during hospitalization. After CAR T cell infusions, patients were given final physical examinations and laboratory studies to determine whether they were in good condition to be discharged from the hospital. Patients were asked to visit the hospital once a week within 1 month of CAR T cell infusions. During each hospital visit, patients were given physical examinations and clinical laboratory examinations to determine the toxicity of the treatments. Patients were also asked to report any adverse events that occurred after CAR T cell infusion, such as fever, cough, pain, fatigue or neurological abnormalities.
Any adverse event that resulted in hospitalization after CAR T cell infusion was documented. Serious adverse events, except for decreases in lymphocyte count, which were due to lymphodepletion chemotherapy, were required to be reported to the Medical Ethics Committee of Beijing Cancer Hospital within 24 h of the occurrence.
Patients were followed by physical examinations and clinical laboratory examinations every 2 or 3 months after the first month to monitor disease progression and toxicity. Six months after the last patient received CAR T cell infusion, all recorded adverse events, physical examinations, hospital electronic recordings, clinical laboratory examinations, hospital visit recordings, patient self-report documents and patients’ medical histories were obtained and used to analyze the assessment and grading of adverse events according to NCI CTCAE v4.03. The results for adverse events were revised by clinical investigators who managed the patients.
Clinical laboratory examinations.
Blood samples were collected during CAR T cell therapy and after infusion. Samples were sent to the clinical laboratory of the Beijing Cancer Hospital for analyses of complete blood counts, biochemical assays, renal function, hepatic function, coagulation and serum immunoglobulin concentrations.
qPCR analysis of CAR T cell expansion and persistence in vivo.
Blood samples were collected during and after CAR T cell infusion. PBMCs were isolated from blood samples with Red Blood Cell Lysis Buffer. PBMCs were stored at −80 °C until use. DNA was isolated from PBMC samples by using a DNA extraction kit (Tian Gen, DP304-03). A pair of Scorpion primers targeting a specific fragment of the CAR sequence spanning the junction of 4-1BB and CD3ζ was used to determine the copy number of the CAR construct in PBMCs. The human albumin gene (ALB) was used as an endogenous reference for final sample normalization. To determine CAR copy number, a seven-point curve was generated by spiking 5 to 5 × 10⁵ copies of CD19-BBz(86) lentiviral vector DNA into 100 ng of DNA from 293T cells. For albumin reference gene quantification, a six-point standard curve comprising 16–50,000 copies of the human genome in a fivefold dilution series was generated. To determine the CAR copy number of a sample, 100 ng of PBMC DNA was added to SsoAdvanced Universal Probes Supermix (Bio-Rad), along with CAR-specific Scorpion primers. For albumin reference gene quantification, 100 ng of PBMC DNA was added to a qPCR mixture, along with albumin-specific TaqMan probe and primers. qPCR was run on a QuantStudio 3 (Applied Biosystems). Each sample was run in triplicate and mean values were used for data analysis. Acceptable qPCR results had an efficiency of amplification between 90% and 110% and R2 ≥ 0.99. After a qPCR run, the CAR copy number of the sample was calculated on the basis of the standard curve and then normalized to the albumin reference gene.
Multicolor flow cytometry.
Flow cytometry staining was performed as described in our previous studies36–39. Briefly, PBMCs were isolated from blood samples of donors or patients before and after CAR T cell infusion and treated with Red Blood Cell Lysis Buffer (Solarbio, R1010). CAR T cells were identified as tEGFR+CD3+ cells by flow cytometry. For flow staining, PBMCs were first incubated with Human TruStain FcX (BioLegend). CAR T cells were stained in a two-step protocol. After blocking Fc receptor, PBMCs were stained with antibodies against EGFR (C225), CD3, CD4 and CD8. After cells were washed, PBMCs were stained with PE-labeled anti-human-IgG antibody. Fluorescently labeled isotype antibodies were used as a staining control. Stained samples were analyzed on a BD FACSCalibur or BD FACSCanto II system. Data were analyzed with FlowJo software. The antibodies used for flow cytometry are listed in Supplementary Table 13.
Soluble factor Luminex multiplex assay.
Blood samples were collected before and after CAR T cell infusion. After centrifugation, plasma was collected and stored at −80 °C. Soluble factors in the plasma were quantified on the Luminex FLEXMAP 3D multiplexing platform. A human Premixed Multi-Analyte kit (LXSAHM-27, R&D Systems) was used to measure the concentrations of a panel of soluble factors (TNF-α, IL-6, CXCL8 (IL-8), IL-7, CXCL10 (IP-10), IL-10, CCL2 (MCP-1), IL-1β, IFN-γ, CCL3 (MIP-1α), CCL22 (MDC), CCL4 (MIP-1β), CCL13 (MCP-4), IL-4, IL-17A, IL-2, CCL26 (eotaxin-3), GM-CSF, granzyme A, IL-15, IL-5, IL-12 p70, granzyme B, CCL17 (TARC), IL-13, VEGF-D, CCL11 (eotaxin)) in one sample at the same time. Plasma samples were diluted 1:2 according to the manufacturer’s protocol. Luminex assays were performed by following the manufacturer’s protocol with standard curves and quality and background controls included. Samples and standards were run in duplicate and mean values were used for data analysis. Samples were read on a Luminex FLEXMAP 3D System. Raw data were processed with the Milliplex Analyte program by using five-parameter logistic regression analysis.
Generation of recombinant lentiviral vectors coexpressing CD19-BBz variants and tEGFR.
The prototype anti-CD19 CAR (CD19-BBz(71)) DNA fragment, comprising FMC63 scFv, the extracellular domain and transmembrane regions (71 amino acids) of human CD8α, the cytoplasmic region of human 4–1BB, and the cytoplasmic part of the human CD3ζ molecule, was synthesized and cloned into XbaI–BstBI sites in the lentiviral vector pCDH-EF1α-MCS-IRES-GFP (System Biosciences) to generate recombinant vector encoding CD19-BBz(71). Synthetic tEGFR lacking the membrane-distal EGF-binding domain and the cytoplasmic signaling tail was cloned into the BspEI–SalI sites of CD19-BBz(71) by replacing the GFP sequence to generate the recombinant lentiviral vector LV-CD19-BBz(71). The LV-CD19-BBz(71) vector coexpresses CD19-BBz(71) CAR and the tEGFR marker, as shown in Fig. 1a. DNA fragments for the CD19-BBz(75), CD19-BBz(82), CD19-BBz(86) and CD19-BBz(86) variants were synthesized and cloned into the LV-CD19-BBz(71) vector by replacing the CD19-BBz(71) fragment (Fig. 1a). The lentiviral vector only expressing tEGFR was used as a control. All constructs were verified by DNA sequencing and used to generate recombinant lentiviruses.
T cell proliferation assays.
Human T cells were isolated from buffy coats from anonymous healthy donors by negative magnetic selection (Pan T Cell Isolation Kit, Miltenyi Biotec) and suspended in complete culture medium (RPMI 1640 supplemented with 10% FBS, 10 mM HEPES, 100 µM nonessential amino acids, 0.05 mM mercaptoethanol and 1% PenStrep/glutamine in a 12-well tissue culture plate. Human T Activator CD3/CD28 Dynabeads (10 μl; Thermo Fisher Scientific) were added to the cells to obtain a bead-to-cell ratio of 1:1, and the mixture was incubated overnight in a humidified CO2 incubator at 37 °C. Dynabeads-activated T cells were seeded into 24-well plates (100 µl per well) and transduced with recombinant lentiviruses in the presence of polybrene (8 μg ml−1) at a multiplicity of infection (MOI) of 5. Dynabeads were then removed and the transduced T cells were cultured in RPMI 1640 supplemented with 10 ng ml−1 IL-2 (Peprotech). One week after transduction, the transduced T cells were collected, sorted (by BD FACSAria) and then co-cultured in a 24-well plate with irradiated CD19-expressing CD19-K562 cells at a ratio of 3:1 in the presence of IL-2 (10 ng ml−1). T cells were counted at various time points. For [3H]thymidine incorporation assays, 1 µCi of [3H]thymidine (PerkinElmer) was added to each well of the co-culture for 16 h to be incorporated into the newly synthesized DNA of dividing cells. After incubation, a cell harvester was used to transfer the cells from 96-well plates to a glass fiber filter for counting on a scintillation beta-counter.
Cytotoxic T-lymphocyte assays.
Cytotoxicity was assessed with a standard chromium-release assay, as described in our previous studies38. Briefly, target cells were labeled with 100 μCi of 51Cr (PerkinElmer) in 1 ml of complete culture medium for 1 h at 37 °C in an incubator. Various numbers of human T cells transduced with CD19-BBz variant vectors were mixed with 51Cr-labeled target cells at the indicated effector (E):target cell (T) ratios in triplicate in a 96-well plate and incubated for 4–5 h. In parallel, control wells including spontaneous release (no T cells added) and maximum release (2% TX-100 added) were set up. Supernatants were dried on a LumaPlate (PerkinElmer) overnight and counted in a liquid scintillation counter. The percentage of specific lysis was calculated by using the standard formula ((experimental – spontaneous release)/(maximum load – spontaneous release) × 100) and expressed as the mean for the triplicate samples.
qRT–PCR analysis of human gene expression.
Expression of human Bcl-2, Bcl-xL, Bim and survivin was measured with iTaq Universal SYBR Green Supermix (Bio-Rad) and qRT–PCR. After T cells transduced with CD19-BBz variant vectors were co-cultured with irradiated CD19-K562 cells, tEGFR+ transduced T cells were sorted by FACS and total cellular RNA was extracted with an RNeasy Mini kit (Qiagen). cDNA was prepared with iScript cDNA Synthesis kits (Bio-Rad). The following primer sequences were used: Bcl-2: forward primer, 5′-CAGAAGGGACTGAATCGGAG-3′; reverse primer, 5′-TGGGATGTCAGGTCACTGAA-3′; Bcl-xL: forward primer, 5′-TGAG TCGGATCGCAGCTTGG-3′; reverse primer, 5′-TGGATGGTCAGTGT CTGGTC-3′; Bim: forward primer, 5′-ACAGGAGCCCAGCACCCATG-3′; reverse primer, 5′-ACGCCGCAACTCTTGGGCGA-3′; survivin: forward primer: 5′-GGACCACCGCATCTCTACAT-3′; reverse primer, 5′-GTTCCTCTATGGGGTCGTCA-3′, β-actin: forward primer, 5′-TTGCCGACAGGATGCAGAA-3′; reverse primer, 5′-GCCGATCCACACGGAGTACT-3′.
Mouse studies.
For studies with the CRS mouse model22, 5- to 8-week-old female C.B.Igh-1b/GbmsTac-PrkdcscidLystbgN7 (SCID-beige) mice (Taconic) were injected i.p. with 3 × 10⁶ Raji cells and tumors were allowed to grow for ~19 d. Mice were then injected i.p. with 35 × 106 CAR T cells in PBS supplemented with 2% human serum. Control mice were injected i.p. with PBS supplemented with 2% human serum. Body weight, other CRS-like symptoms (malaise, piloerection) and survival were monitored. At different time points, blood samples were collected from mice for measurement of serum concentrations of human and mouse cytokines. After collection, blood was left to clot for 30 min at room temperature. After clotting, blood was centrifuged at 6,000g for 10 min at 4 °C. Serum was aliquotted into tubes and was stored at −80 °C until analysis. Cytokines were measured with ELISA kits for mouse and human cytokines, according to the manufacturer’s instructions. Enumeration of myeloid cell populations, including granulocytes (CD11b+Ly6G+), macrophages (CD11b+F4/80+) and monocytes (CD11b+Ly6C+), in peritoneal lavage after injection of CAR T cells was performed. Intraperitoneal macrophages were isolated from peritoneal lavage with Mouse Macrophage Isolation kits (Miltenyi Biotec). qRT–PCR assays were used to examine the expression of cytokine genes40. The following primers were used for qRT–PCR assays: mouse IL-6 (forward primer, 5′-AGTTGCCTTTCTTGGGACTGA-3′; reverse primer, 5′-TCCACGATTTCCCAGAGAAC-3′); mouse IL-12 (forward primer, 5′-CATCGATGAGCTGATGCAGT-3′; reverse primer, 5′-CAGATAGCCCATCACCCTGT-3′) and mouse G-CSF (forward primer, 5′-CTCAACTTTCTGCCCAGAGG-3′; reverse primer, 5′-TAGGTGGCACACAACTGCTC-3′). For monitoring of CAR T cell expansion in mice, 5- to 8-week-old NOD.Cg-PrkdcscidIl2rgtmWjl/SzJ (NSG) mice (Jackson Laboratory) were inoculated with 5 × 10⁵ NALM-6 cells by tail-vein injection followed by 5 × 10⁶ human CAR T cells 4 d later. At different time points, peripheral blood samples were collected via tail clip or retro-orbital bleeding for quantification of tEGFR+ CAR T cells by flow cytometry.
Statistical analyses.
Comparison of two groups was performed by two-tailed unpaired Student’s t test or the Mann–Whitney two-tailed test, where P < 0.05 with a 95% confidence limit was considered statistically significant. Two-way ANOVA was performed where applicable with the post hoc test. A log-rank Mantel–Cox test was used for statistical analysis. All graphs show the mean ± s.e.m. unless otherwise indicated. GraphPad Prism 7 was used for statistical analysis of the experiments, data processing and presentation.
Reporting Summary.
Further information on research design is available in the Nature Research Reporting Summary linked to this article.
Extended Data
Extended Data Fig. 1 |. In vitro and in vivo evaluation.
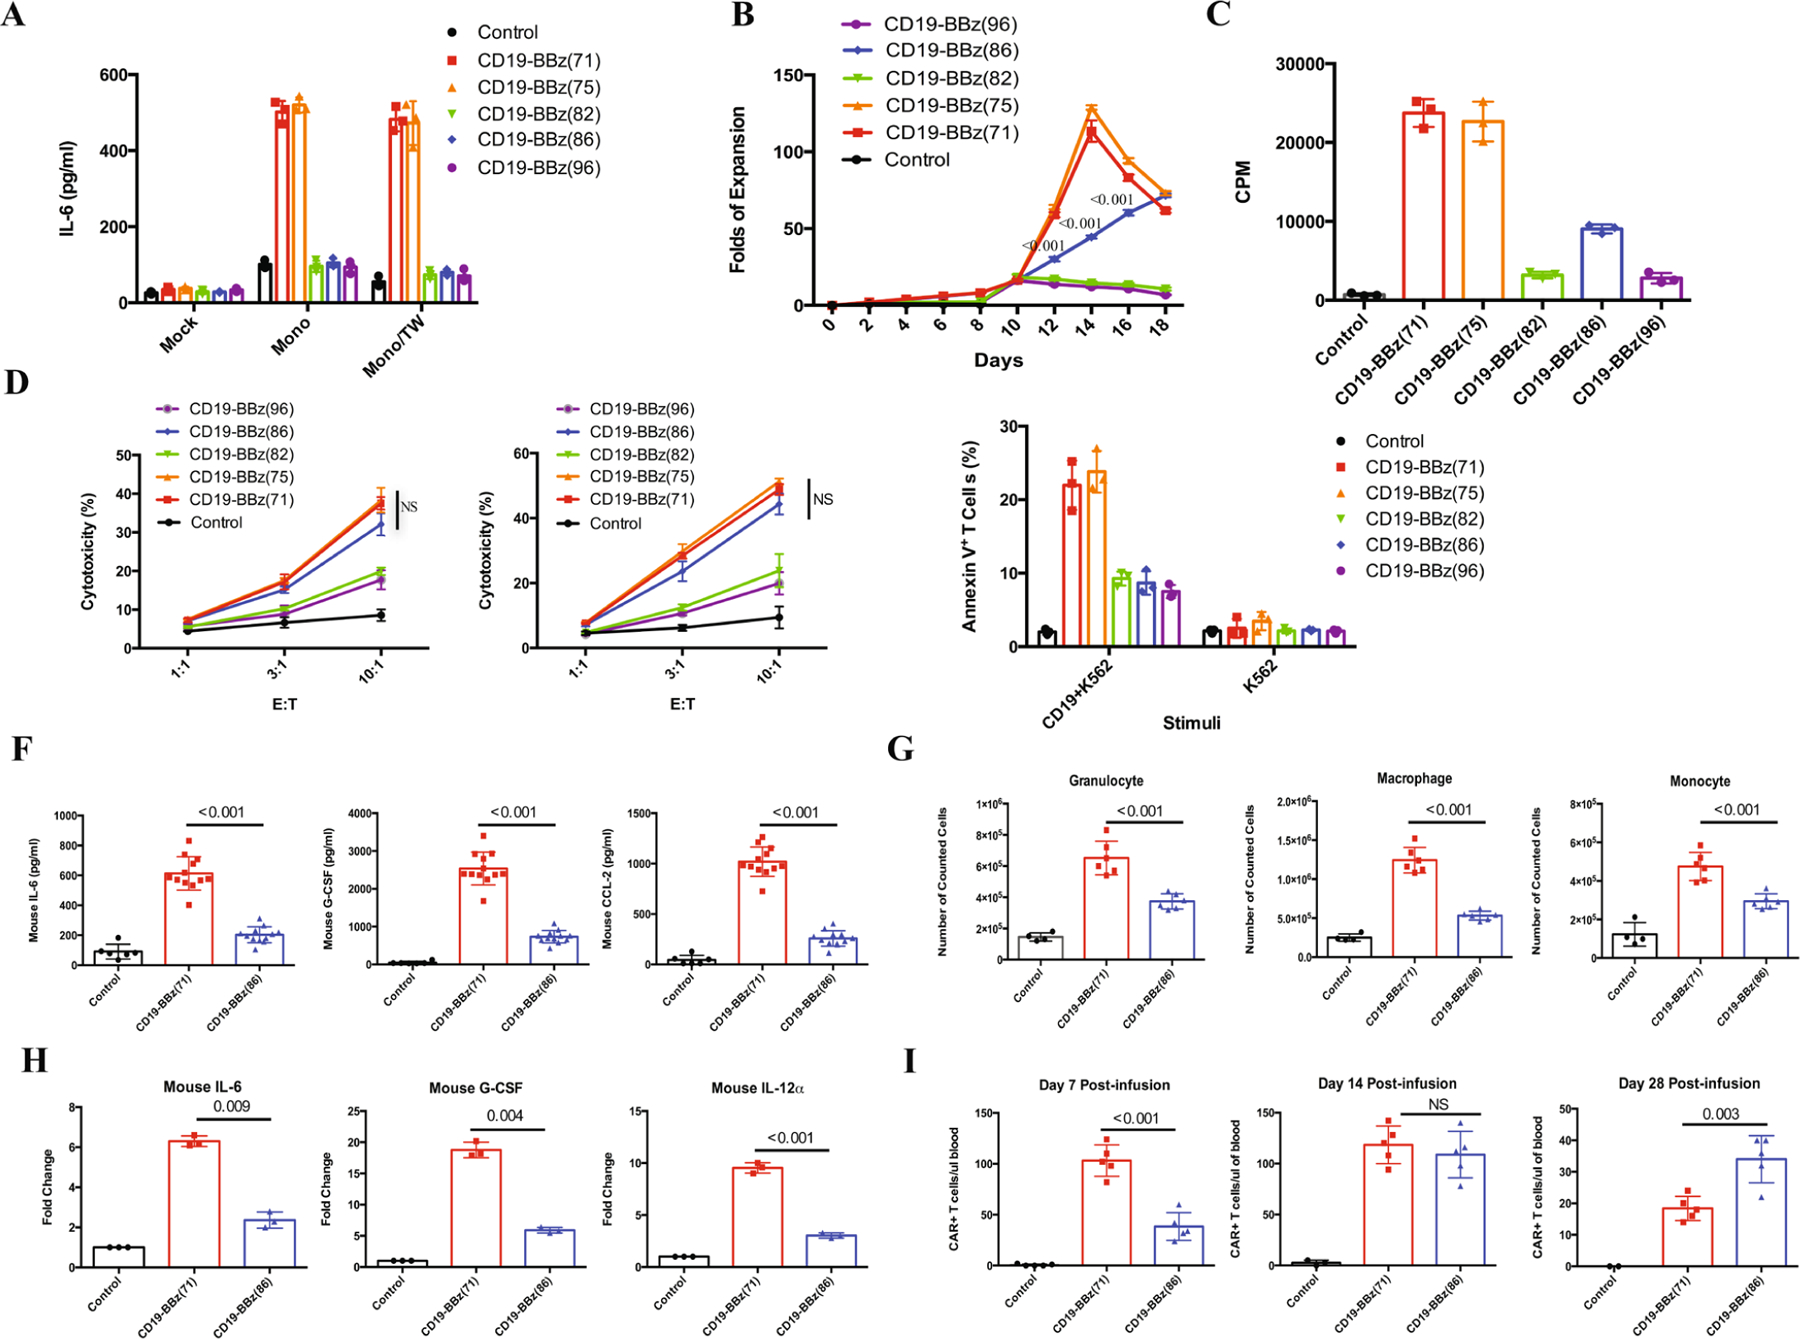
a, IL-6 levels in co-culture of monocytes and CD19-BBz-variant-transduced CAR T cells. Human T cells transduced with the indicated CD19-BBz variants were co-cultured with irradiated CD19-K562 cells in the presence of autologous monocytes (Mono) in a 24-well plate with or without a Corning Transwell (TW) to separate CAR T cells from monocytes. The culture medium was collected after 48 h of co-culture for analysis of IL-6 concentration by ELISA. Data are presented as the mean ± s.d. Experiments were repeated with four different donor-derived T cells (n = 4). A two-tailed, unpaired two-sample t test was used for statistical analysis. *P < 0.001, CD19-BBz(86) versus CD19-BBz(71). b, Proliferation of CD19-BBz-variant-transduced CAR T cells in co-culture with CD19-K562 cells. Human T cells were transduced with the indicated CD19-BBz variants and cultured for 1 week. tEGFR+ transduced CAR T cells were sorted by FACS and co-cultured with irradiated CD19-K562 cells. On the indicated days, T cells were counted, and the fold of T cell expansion is presented as the mean ± s.d. Experiments were repeated with three different donor-derived T cells (n = 3). c, [3H]thymidine incorporation assay to measure CD19-BBz-variant-transduced CAR T cell proliferation. Human T cells transduced with CD19-BBz variants were co-cultured with irradiated CD19-K562 cells in the presence of [3H]thymidine. Data are presented as the mean ± s.d. Experiments were repeated with four donor-derived T cells (n = 4). A two-tailed, unpaired two-sample t test was used for statistical analysis. *P < 0.001, CD19-BBz(86) versus CD19-BBz(71). d, Cytolytic activities of CD19-BBz-variant-transduced CAR T cells. CD19-BBz-variant-transduced CAR T cells were co-cultured with 51Cr-labeled CD19-K562 (left) or CD19+ Nalm-6 (right) cells in triplicate at the indicated E:T ratios. Cytotoxicity was measured by 51Cr release, and data are presented as the mean ± s.d. Experiments were repeated with three donor-derived T cells (n = 3). A two-tailed, unpaired two-sample t test was used for statistical analysis. NS, CD19-BBz(86) versus CD19-BBz(71). e, Annexin V expression in CD19-BBz-variant-transduced CAR T cells after co-culture with irradiated CD19-K562 cells or control K562 cells as detected by flow cytometry staining with anti-tEGFR and Annexin V. Data are presented as the mean ± s.d. Experiments were repeated with three donor-derived T cells (n = 3). A two-tailed, unpaired two-sample t test was used for statistical analysis. *P < 0.004, CD19-BBz(86) versus CD19-BBz(71). f, Serum mouse cytokine levels. SCID-beige mice were inoculated i.p. with 3 × 10⁶ Raji cells followed by i.p. injection with 35 × 106 CD19-BBz(71) or CD19-BBz(86) CAR T cells or were mock treated. Sixty hours after CAR T cell injection, mice were bled and sera were isolated to determine the concentrations in serum of the indicated mouse cytokines by ELISA (n = 6 for the mock group, n = 12 for the CAR T cell groups). Data are presented as the mean ± s.d. A two-tailed, unpaired two-sample t test was used for statistical analysis. g, Absolute counts of intraperitoneal myeloid cell populations obtained by peritoneal lavage 60 h after injection of CAR T cells (i.p.). Data are presented as the mean ± s.d. (n = 4 for the mock group, n = 6 for the CAR T cell groups). A two-tailed, unpaired two-sample t test was used for statistical analysis. h, qRT–PCR analysis of mouse cytokine gene expression in intraperitoneal macrophages isolated from peritoneal lavage 60 h after injection of CAR T cells (i.p.). Data are presented as the mean ± s.d. (n = 4 for the mock group, n = 6 for the CAR T cell groups). A two-tailed, unpaired two-sample t test was used for statistical analysis. i, In vivo expansion of CAR T cells in tumor-bearing mice. Groups of NSG mice were inoculated intravenously (i.v.) with NALM-6 tumor cells followed by i.v. injection with CD19-BBz(71) or CD19-BBz(86) CAR T cells or mock T cells 4 d later. At days 7, 14 and 28 after CAR T cell injection, peripheral blood samples were collected for quantification of tEGFR+ CAR T cells in the blood. Data are presented as the mean ± s.d. (n = 4 for the mock group, n = 6 for the CAR T cell groups). A two-tailed, unpaired two-sample t test was used for statistical analysis.
Extended Data Fig. 2 |. Durable remission.
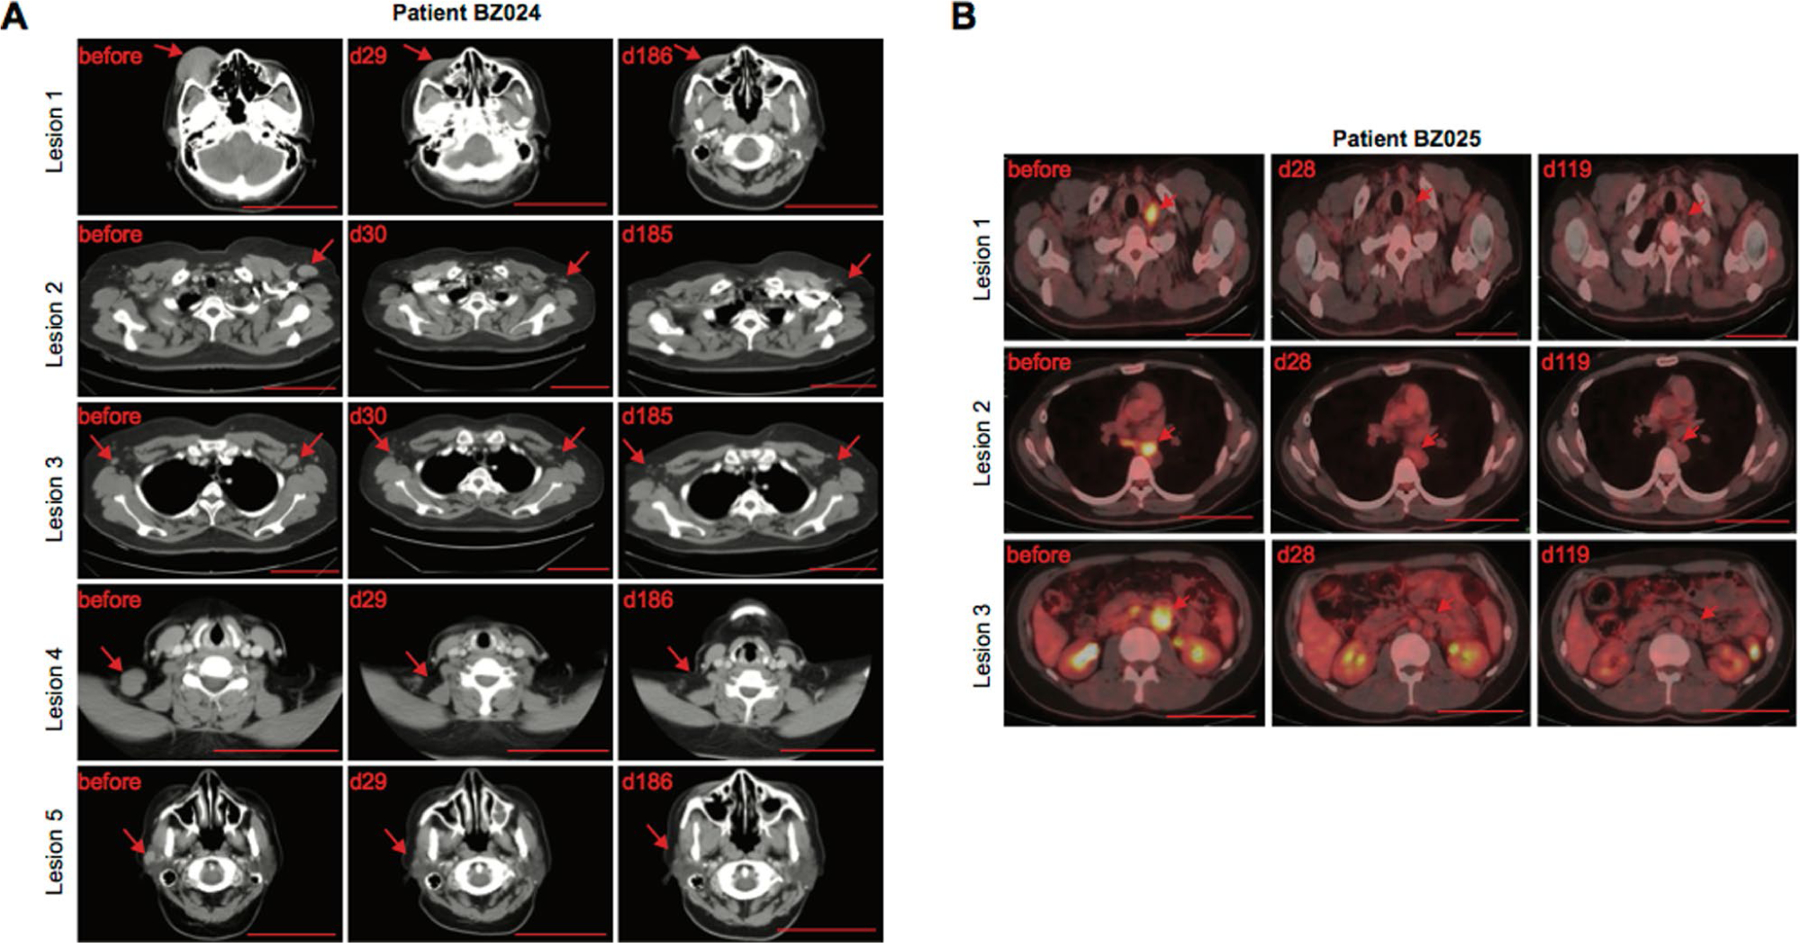
CT and PET–CT scans showing durable remission in patients BZ024 and BZ025 treated with CD19-BBz(86) CAR T cells. The arrow indicates sites of lymphoma. Scale bar, 10 cm.
Extended Data Fig. 3 |. Decrease in lymphocyte count after lymphodepletion chemotherapy in individual patients.
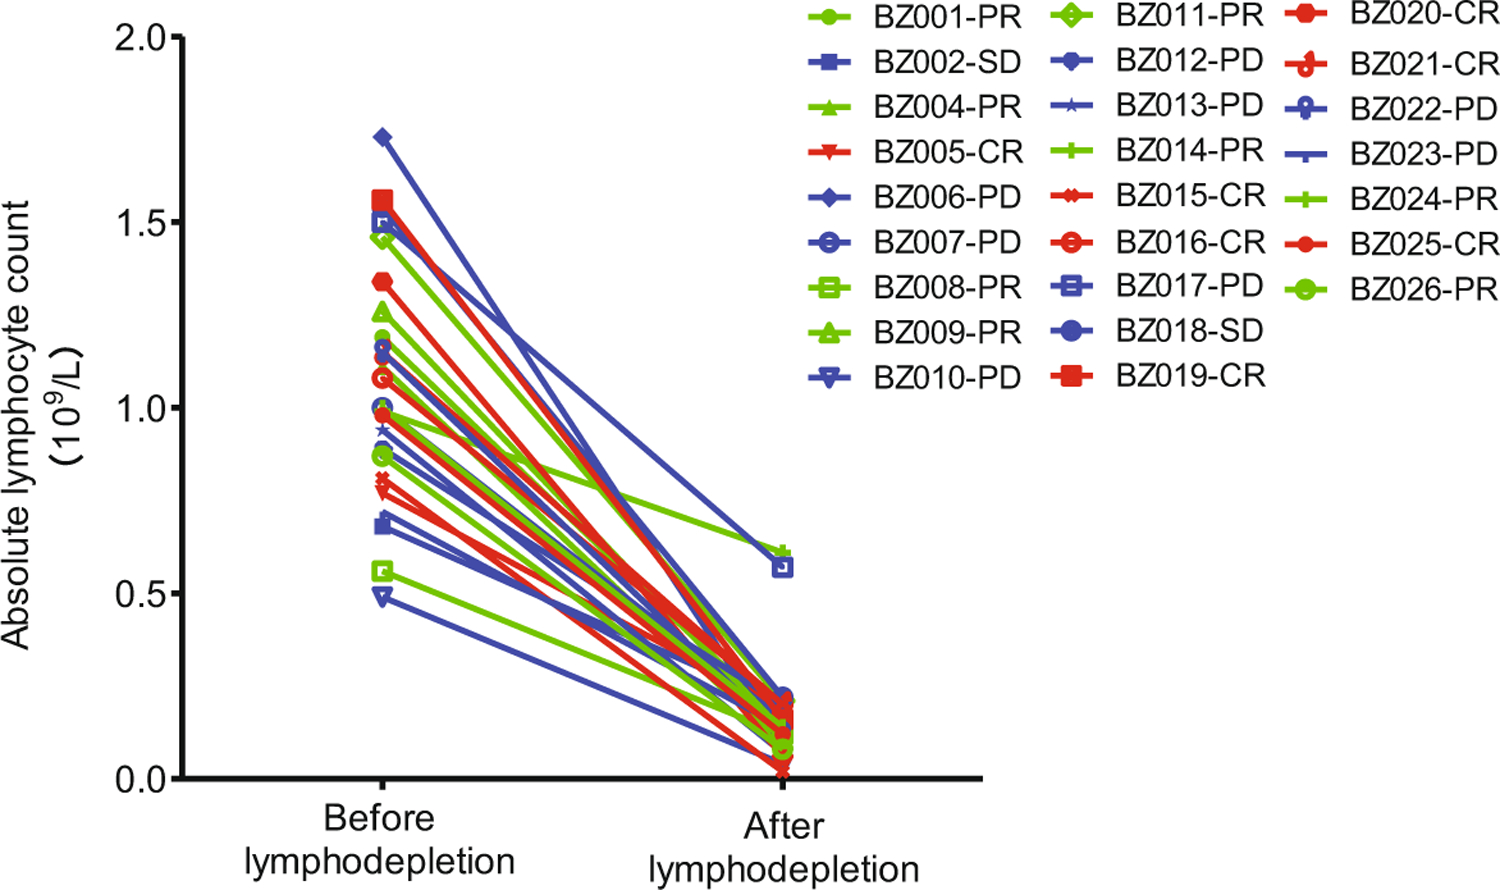
All patients were administrated 3-d lymphodepletion chemotherapy comprising fludarabine (25 mg m−2 on days 1–3) and cyclophosphamide (250 mg m−2 on days 1–3) before CAR T cell infusion. The time point of lymphodepletion was on the day of CAR T cell infusion (day 0) for all patients, except for patients BZ015 (day –1), BZ021 (day –2) and BZ026 (day –3). Each patient’s lymphocyte counts before and after lymphodepletion chemotherapy are connected by a line for pairwise comparison. The median blood lymphocyte count just before lymphodepletion chemotherapy was 1 × 10⁹ cells L−1 (range of 0.49–1.73 × 10⁹ cells L−1). The median lymphocyte count after chemotherapy on the day of CAR T cell infusion was 0.14 × 10⁹ cells L−1 (range of 0.02–0.61 × 10⁹ cells L−1).
Extended Data Fig. 4 |. Changes in blood igA levels.
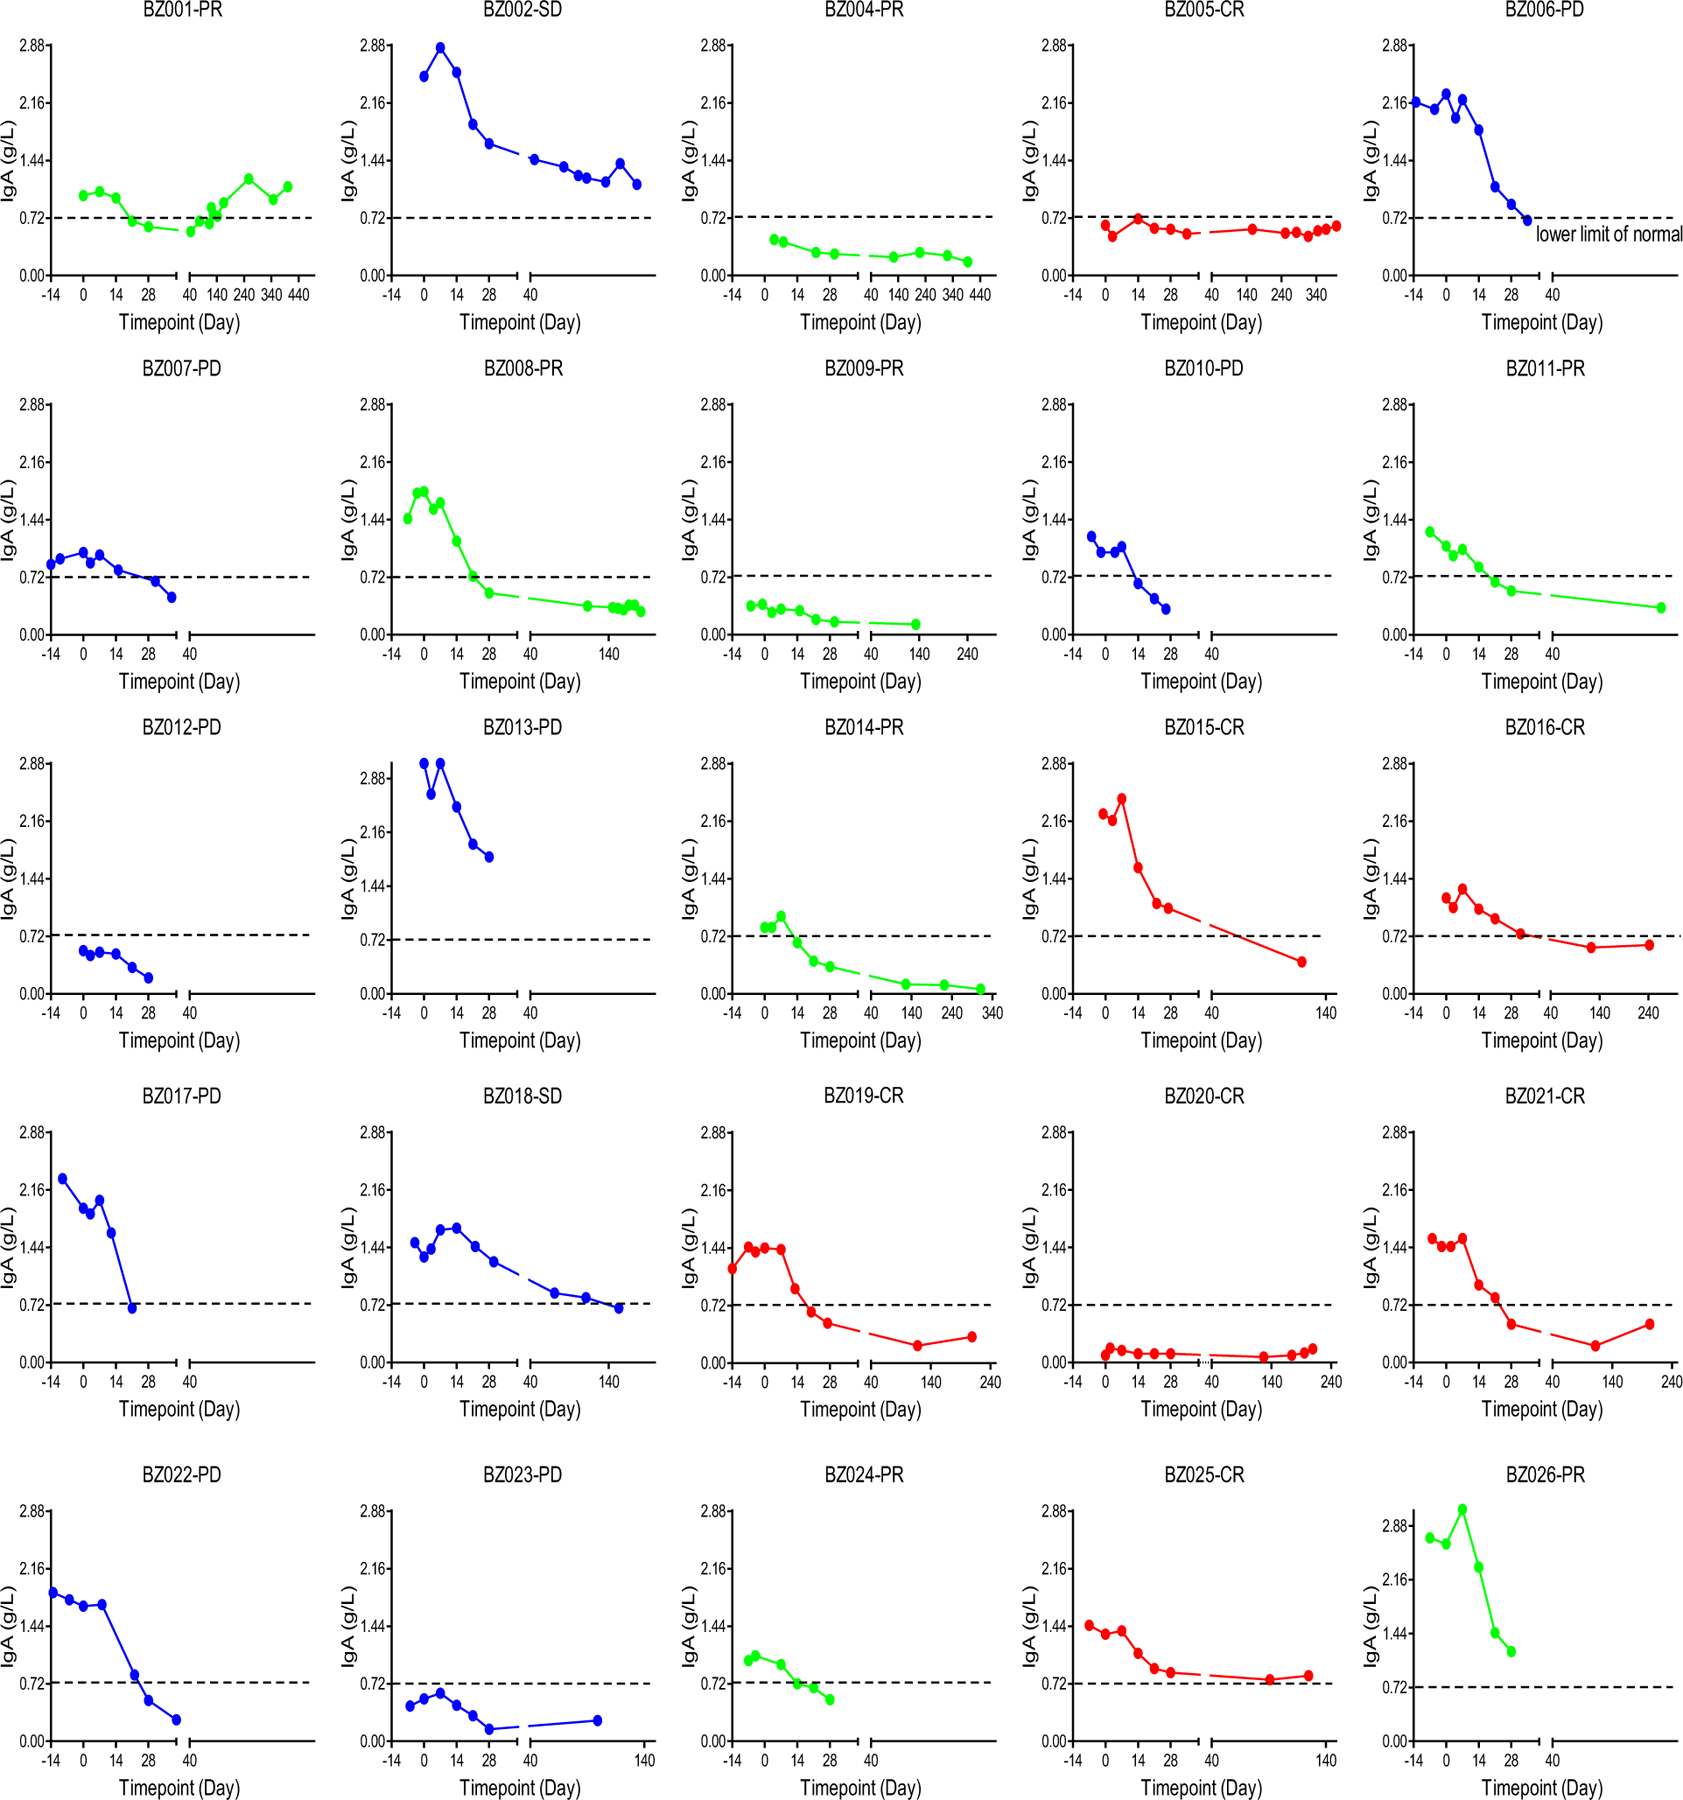
Changes in IgA levels were assessed after CD19-BBz(86) CAR T cell therapy in individual patients.
Extended Data Fig. 5 |. Changes in blood IgG levels.
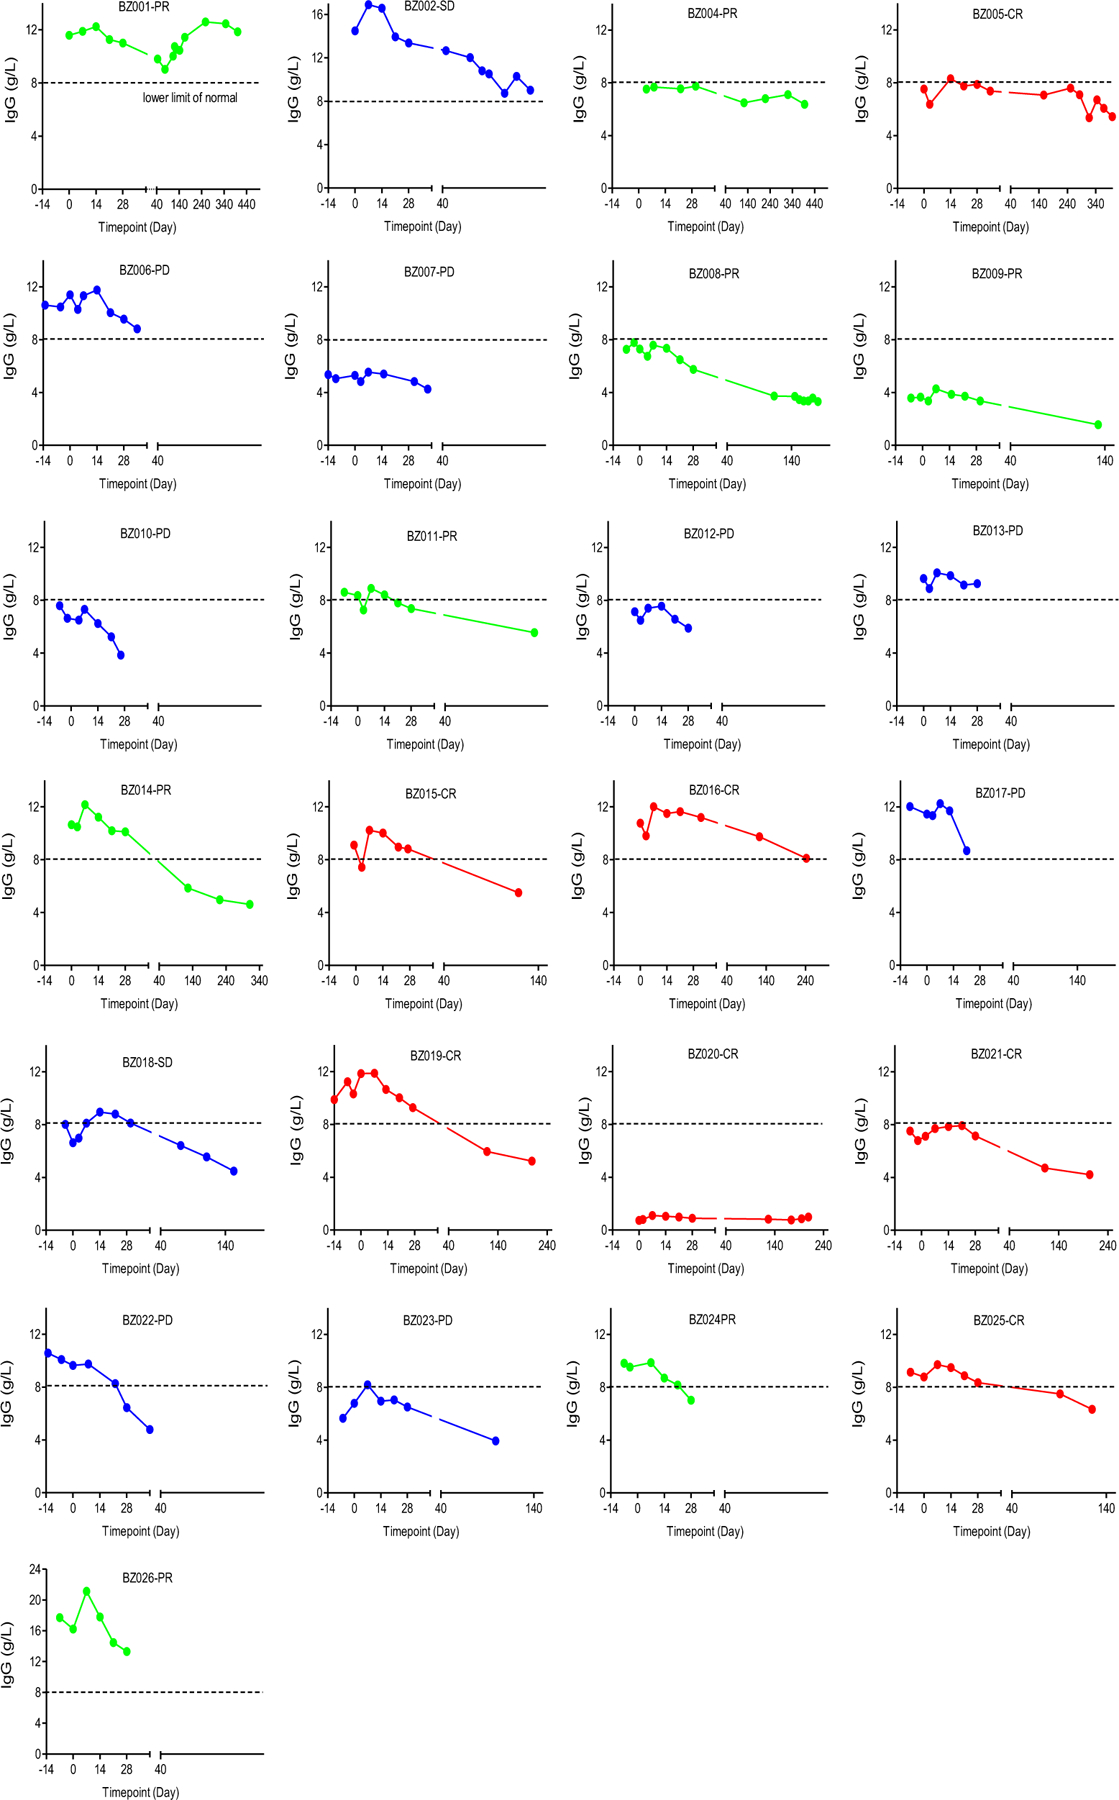
Changes in IgG levels were assessed after CD19-BBz(86) CAR T cell therapy in individual patients.
Extended Data Fig. 6 |. Changes in blood IgM levels.
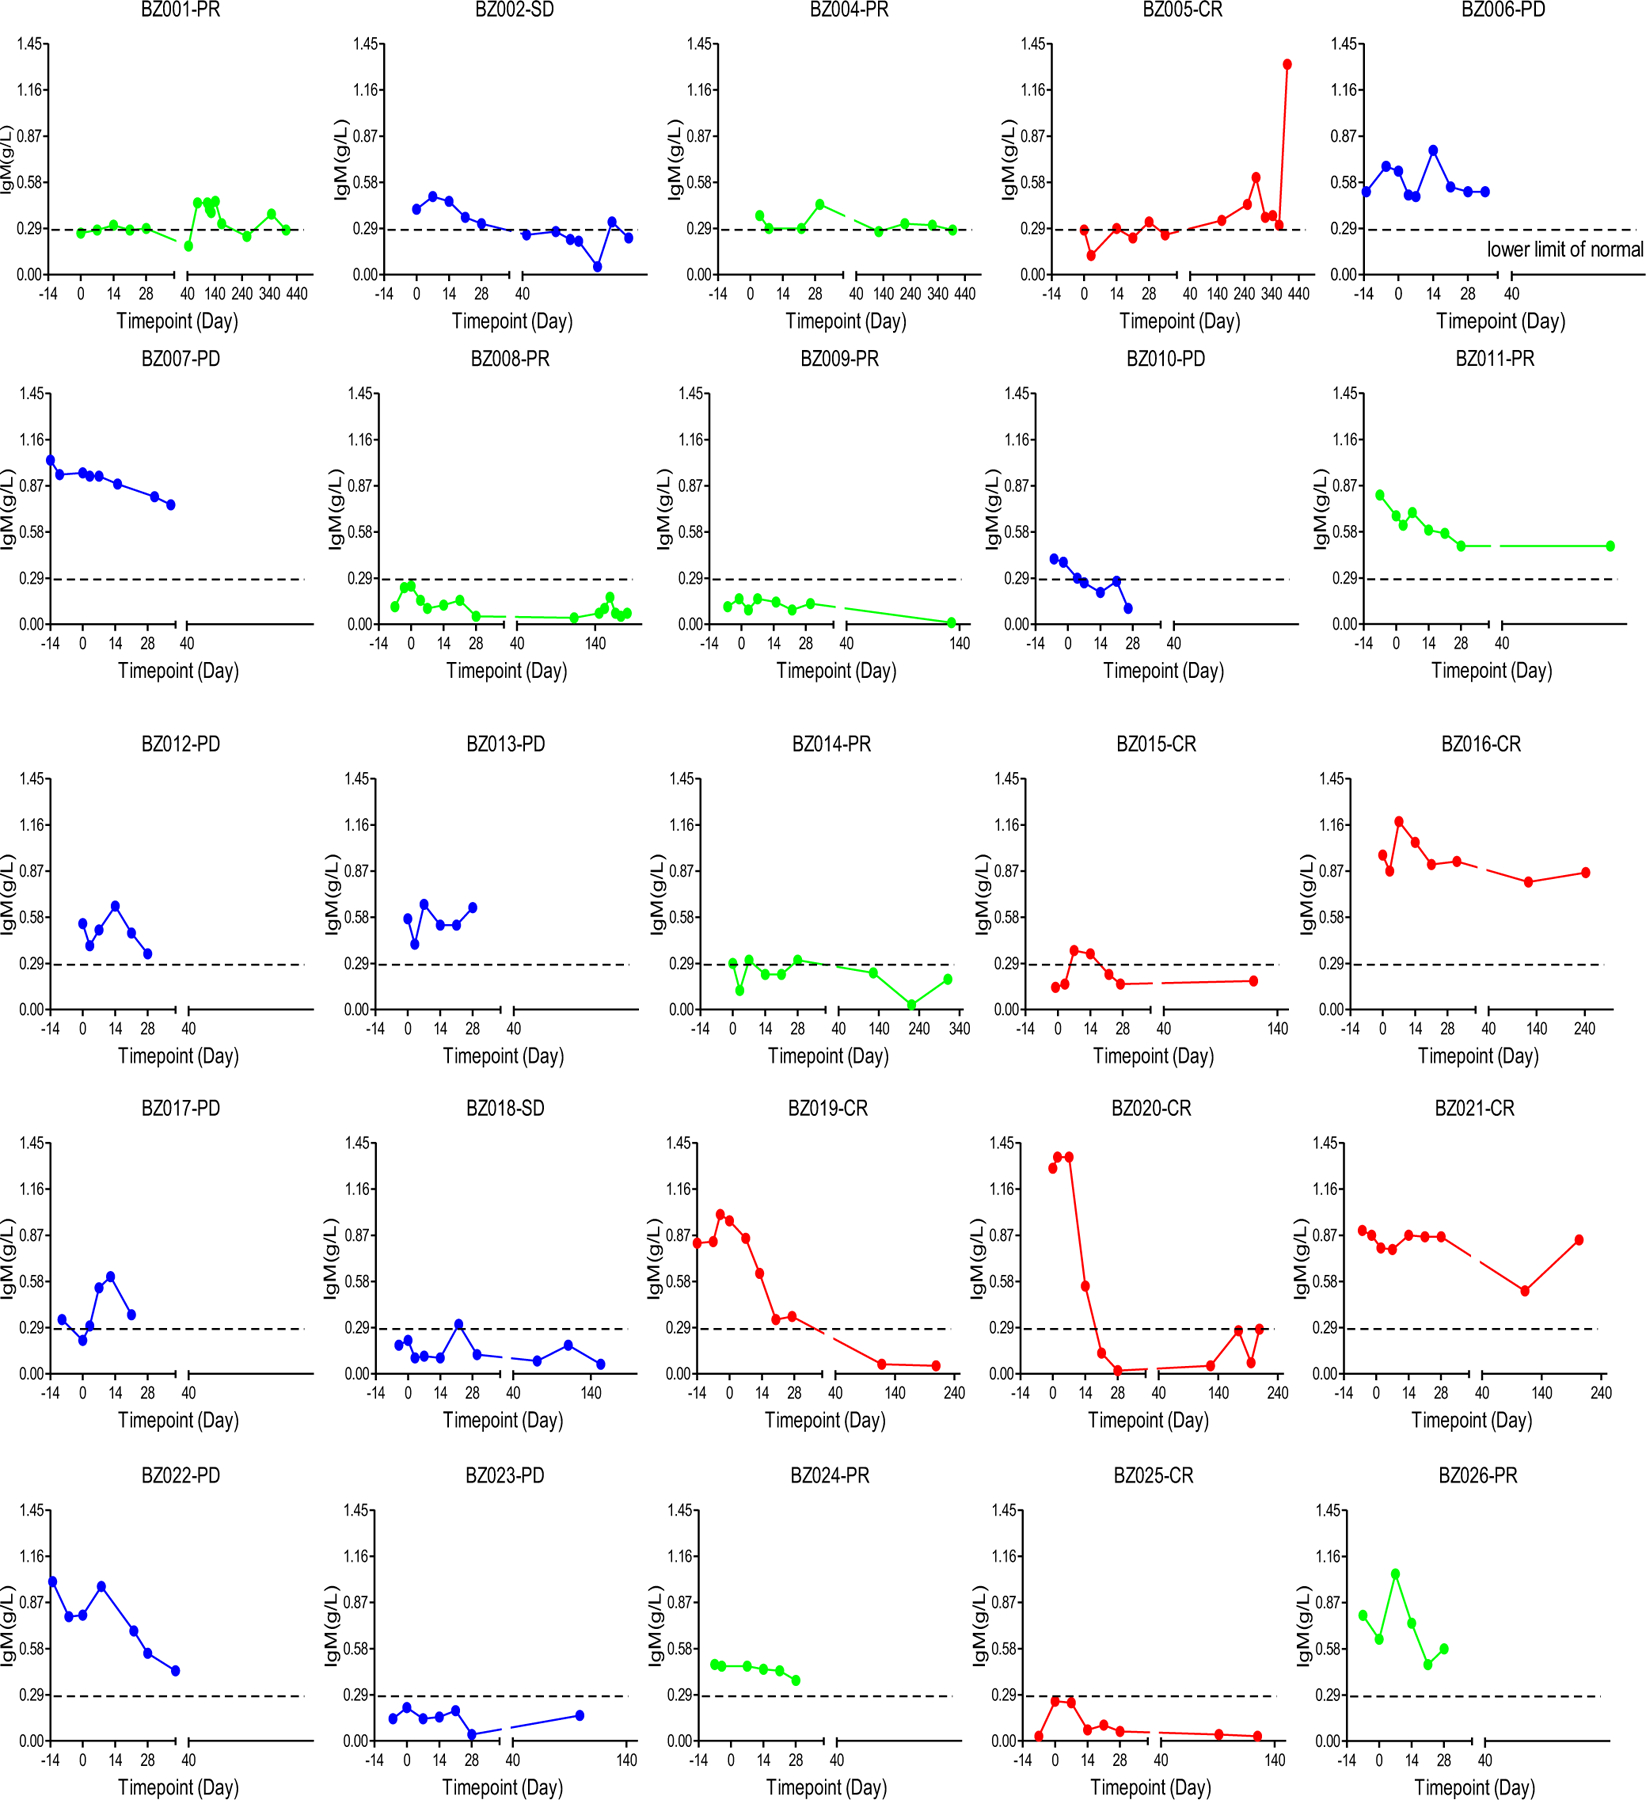
Changes in IgM levels were assessed after CD19-BBz(86) CAR T cell therapy in individual patients.
Extended Data Fig. 7 |. In vivo expansion and memory generation.
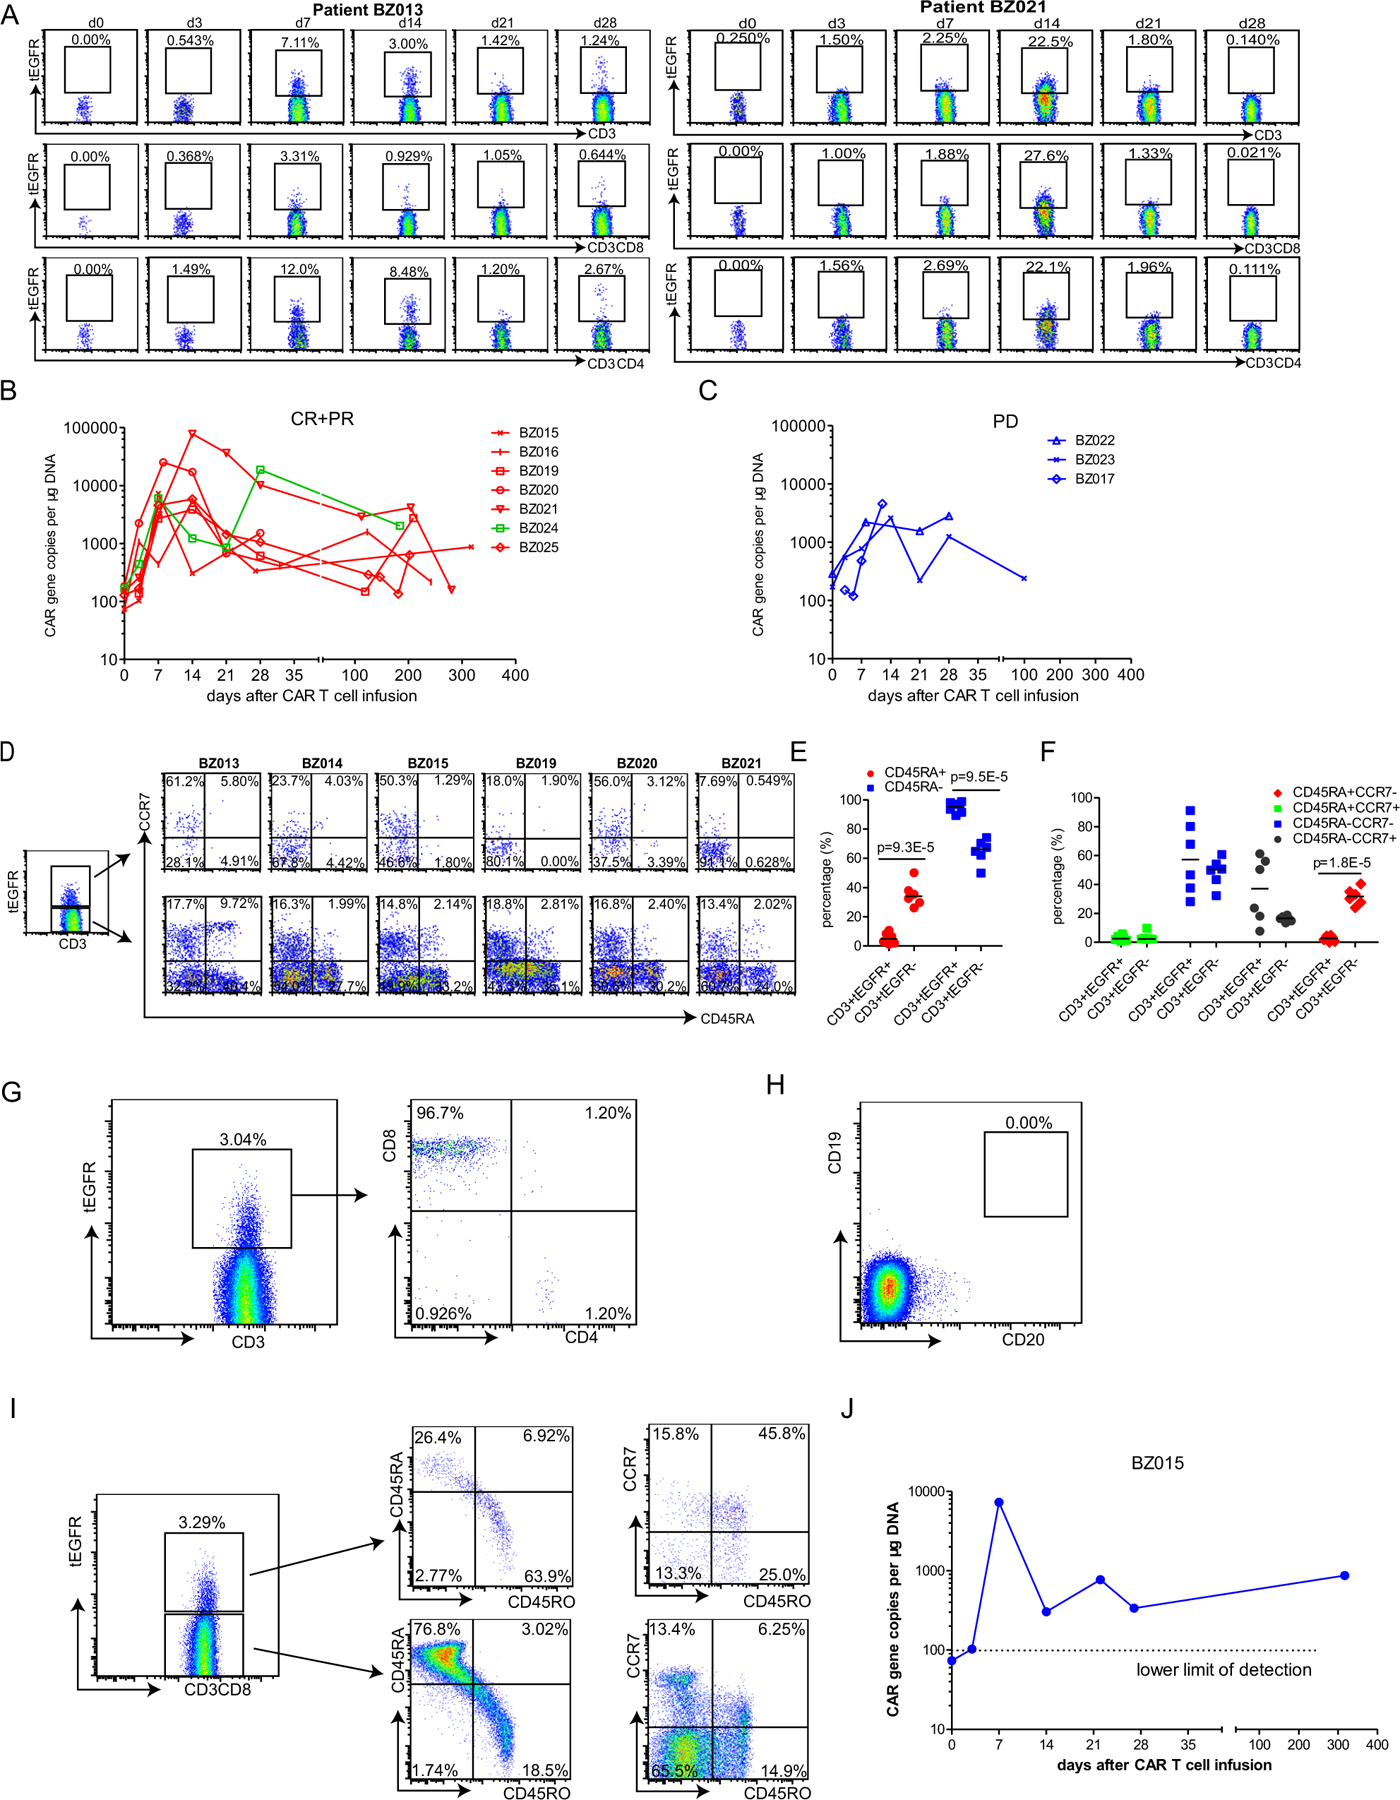
a, Flow cytometry analysis showing in vivo expansion of tEGFR+ CD19-BBz(86) CAR T cells in the peripheral blood of representative patients who achieved complete remission (patient BZ021) or had progressive disease (patient BZ013). b,c. qPCR showing in vivo CAR T cell expansion and persistence in the blood of patients who achieved complete or partial remission (patients BZ015, BZ016, BZ019, BZ020, BZ021, BZ024 and BZ025) (b) or had progressive disease (patients BZ017, BZ022 and BZ023) (c). d, Memory phenotype (CD45RA− CCR7+) of in vivo-expanded tEGFR+CD3+ CD19-BBz(86) CAR T cells and tEGFR−CD3+ normal T cells from six patients who had progressive disease (BZ013) or achieved partial remission (BZ014) or complete remission (BZ015, BZ019, BZ020 and BZ021). e, Percentage of CD45RA+ and CD45RA− subpopulations of in vivo-expanded tEGFR+CD3+ CD19-BBz(86) CAR T cells and tEGFR−CD3+ normal T cells from the six treated patients. P values were calculated from two-tailed Student’s t tests. Horizontal lines denote median values. f, Percentage of CD45RA+CCR7−, CD45RA+CCR7+, CD45RA−CCR7− and CD45RA−CCR7+ subpopulations of in vivo-expanded tEGFR+CD3+ CD19-BBz(86) CAR T cells and tEGFR−CD3+ normal T cells from the six treated patients. P values were calculated from two-tailed Student’s t tests. Horizontal lines denote median values. g–j, Detection of tEGFR+CD3+ CD19-BBz(86) CAR T cells in the peripheral blood of patient BZ015 on day 317 after cell infusion. g, Of the tEGFR+CD3+ CAR T cells, 96.7% were CD8+. h, CD19+ B cells were still depleted. i, 45.8% of the long-term, persistent tEGFR+CD3+ CD19-BBz(86) CAR T cells were CD45RO+CCR7+ central memory T cells in the peripheral blood of patient BZ015 on day 317 after cell infusion, while only 6.25% of the tEGFR−CD3+ normal T cells were CD45RO+CCR7+ central memory T cells. j, qPCR analyses in triplicate also showed long-term persistence of CD19-BBz(86) CAR T cells in peripheral blood.
Supplementary Material
Acknowledgements
We would like to thank S. Yan, X. Wu, Y. Yan and members of the GMP-compliant CAR vector and CAR T cell manufacturing teams and the immunological monitoring team of Marino Biotechnology Corp. for their technical assistance. We would also like to thank Y. Wei and T. Liu for their valuable suggestions and help. This study was supported financially by the National Natural Science Foundation of China (No. 81600164, No. 81870154), Beijing Natural Science Foundation (No. 7172046), Beijing Municipal Administration of Hospitals Incubating Program (PX2017001), Capital’s Funds for Health Improvement and Research (No. 2018–1-2151), Beijing Municipal Administration of Hospitals’ Ascent Plan (No. DFL20151001), a generous donation from Y. L. Zhu and the Marino Biotechnology Corp.
Footnotes
Online content
Any methods, additional references, Nature Research reporting summaries, source data, extended data, supplementary information, acknowledgements, peer review information; details of author contributions and competing interests; and statements of data and code availability are available at https://doi.org/10.1038/s41591-019-0421-7.
Competing interests
X.X., Y. Liu, X.G., H.L., T.Z., P.D., J. Zhang, Y.W., S.L., M.M., X.Y., L.F., S.W. and H.S. are employees of Marino Biotechnology Corp., whose potential product was studied in this work. S.-Y.C. is a consultant of Marino Biotechnology Corp. and a recipient of a research contract with the corporation.
Additional information
Extended data is available for this paper at https://doi.org/10.1038/s41591-019-0421-7.
Supplementary information is available for this paper at https://doi.org/10.1038/s41591-019-0421-7.
Publisher’s note: Springer Nature remains neutral with regard to jurisdictional claims in published maps and institutional affiliations.
Data availability
Detailed data are available in the supplementary tables and figures published with this manuscript. Any materials generated during the current study will be released via a material transfer agreement. The full sequences of the CAR variants are provided in Supplementary Data 1–5.
References
- 1.Imai C et al. Chimeric receptors with 4–1BB signaling capacity provoke potent cytotoxicity against acute lymphoblastic leukemia. Leukemia 18, 676–684 (2004). [DOI] [PubMed] [Google Scholar]
- 2.Campana D, Schwarz H & Imai C 4–1BB chimeric antigen receptors. Cancer J 20, 134–140 (2014). [DOI] [PubMed] [Google Scholar]
- 3.Milone MC et al. Chimeric receptors containing CD137 signal transduction domains mediate enhanced survival of T cells and increased antileukemic efficacy in vivo. Mol. Ther 17, 1453–1464 (2009). [DOI] [PMC free article] [PubMed] [Google Scholar]
- 4.Porter DL, Levine BL, Kalos M, Bagg A & June CH Chimeric antigen receptor-modified T cells in chronic lymphoid leukemia. N. Engl. J. Med 365, 725–733 (2011). [DOI] [PMC free article] [PubMed] [Google Scholar]
- 5.Maude SL et al. Chimeric antigen receptor T cells for sustained remissions in leukemia. N. Engl. J. Med 371, 1507–1517 (2014). [DOI] [PMC free article] [PubMed] [Google Scholar]
- 6.Maude SLP et al. Efficacy and safety of CTL019 in the first US phase II multicenter trial in pediatric relapsed/refractory acute lymphoblastic leukemia: results of an interim analysis. Blood 128, 2801 (2016). [Google Scholar]
- 7.Schuster SJ et al. Chimeric antigen receptor T cells in refractory B-cell lymphomas. N. Engl. J. Med 377, 2545–2554 (2017). [DOI] [PMC free article] [PubMed] [Google Scholar]
- 8.Schuster SJ et al. Tisagenlecleucel in adult relapsed or refractory diffuse large B-cell lymphoma. N. Engl. J. Med 380, 45–56 (2019). [DOI] [PubMed] [Google Scholar]
- 9.Eshhar Z, Waks T, Gross G & Schindler DG Specific activation and targeting of cytotoxic lymphocytes through chimeric single chains consisting of antibody-binding domains and the gamma or zeta subunits of the immunoglobulin and T-cell receptors. Proc. Natl Acad. Sci. USA 90, 720–724 (1993). [DOI] [PMC free article] [PubMed] [Google Scholar]
- 10.Brentjens RJ et al. Genetically targeted T cells eradicate systemic acute lymphoblastic leukemia xenografts. Clin. Cancer Res 13, 5426–5435 (2007). [DOI] [PubMed] [Google Scholar]
- 11.Kochenderfer JN et al. Eradication of B-lineage cells and regression of lymphoma in a patient treated with autologous T cells genetically engineered to recognize CD19. Blood 116, 4099–4102 (2010). [DOI] [PMC free article] [PubMed] [Google Scholar]
- 12.Kalos M et al. T cells with chimeric antigen receptors have potent antitumor effects and can establish memory in patients with advanced leukemia. Sci. Transl. Med 3, 95ra73 (2011). [DOI] [PMC free article] [PubMed] [Google Scholar]
- 13.Kochenderfer JN et al. B-cell depletion and remissions of malignancy along with cytokine-associated toxicity in a clinical trial of anti-CD19 chimeric-antigen-receptor-transduced T cells. Blood 119, 2709–2720 (2012). [DOI] [PMC free article] [PubMed] [Google Scholar]
- 14.Brentjens RJ et al. CD19-targeted T cells rapidly induce molecular remissions in adults with chemotherapy-refractory acute lymphoblastic leukemia. Sci. Transl. Med 5, 177ra138 (2013). [DOI] [PMC free article] [PubMed] [Google Scholar]
- 15.Lee DW et al. Current concepts in the diagnosis and management of cytokine release syndrome. Blood 124, 188–195 (2014). [DOI] [PMC free article] [PubMed] [Google Scholar]
- 16.Turtle CJ et al. Immunotherapy of non-Hodgkin’s lymphoma with a defined ratio of CD8+ and CD4+CD19-specific chimeric antigen receptor-modified T cells. Sci. Transl. Med 8, 355ra116 (2016). [DOI] [PMC free article] [PubMed] [Google Scholar]
- 17.Turtle CJ et al. CD19 CAR-T cells of defined CD4+:CD8+ composition in adult B cell ALL patients. J. Clin. Invest 126, 2123–2138 (2016). [DOI] [PMC free article] [PubMed] [Google Scholar]
- 18.Neelapu SS et al. Chimeric antigen receptor T-cell therapy—assessment and management of toxicities. Nat. Rev. Clin. Oncol 15, 47–62 (2018). [DOI] [PMC free article] [PubMed] [Google Scholar]
- 19.Brudno JN & Kochenderfer JN Chimeric antigen receptor T-cell therapies for lymphoma. Nat. Rev. Clin. Oncol 15, 31–46 (2018). [DOI] [PubMed] [Google Scholar]
- 20.Kelley LA & Sternberg MJ Protein structure prediction on the Web: a case study using the Phyre server. Nat. Protoc 4, 363–371 (2009). [DOI] [PubMed] [Google Scholar]
- 21.Wang X et al. A transgene-encoded cell surface polypeptide for selection, in vivo tracking, and ablation of engineered cells. Blood 118, 1255–1263 (2011). [DOI] [PMC free article] [PubMed] [Google Scholar]
- 22.Giavridis T et al. CAR T cell-induced cytokine release syndrome is mediated by macrophages and abated by IL-1 blockade. Nat. Med 24, 731–738 (2018). [DOI] [PMC free article] [PubMed] [Google Scholar]
- 23.Norelli M et al. Monocyte-derived IL-1 and IL-6 are differentially required for cytokine-release syndrome and neurotoxicity due to CAR T cells. Nat. Med 24, 739–748 (2018). [DOI] [PubMed] [Google Scholar]
- 24.Kochenderfer JN et al. Chemotherapy-refractory diffuse large B-cell lymphoma and indolent B-cell malignancies can be effectively treated with autologous T cells expressing an anti-CD19 chimeric antigen receptor. J. Clin. Oncol 33, 540–549 (2015). [DOI] [PMC free article] [PubMed] [Google Scholar]
- 25.Porter DL et al. Chimeric antigen receptor T cells persist and induce sustained remissions in relapsed refractory chronic lymphocytic leukemia. Sci. Transl. Med 7, 303ra139 (2015). [DOI] [PMC free article] [PubMed] [Google Scholar]
- 26.Teachey DT et al. Identification of predictive biomarkers for cytokine release syndrome after chimeric antigen receptor T-cell therapy for acute lymphoblastic leukemia. Cancer Discov 6, 664–679 (2016). [DOI] [PMC free article] [PubMed] [Google Scholar]
- 27.Brudno JN & Kochenderfer JN Toxicities of chimeric antigen receptor T cells: recognition and management. Blood 127, 3321–3330 (2016). [DOI] [PMC free article] [PubMed] [Google Scholar]
- 28.Gattinoni L et al. A human memory T cell subset with stem cell-like properties. Nat. Med 17, 1290–1297 (2011). [DOI] [PMC free article] [PubMed] [Google Scholar]
- 29.Farber DL, Yudanin NA & Restifo NP Human memory T cells: generation, compartmentalization and homeostasis. Nat. Rev. Immunol 14, 24–35 (2014). [DOI] [PMC free article] [PubMed] [Google Scholar]
- 30.Wang A et al. The stoichiometric production of IL-2 and IFN-γ mRNA defines memory T cells that can self-renew after adoptive transfer in humans. Sci. Transl. Med 4, 149ra120 (2012). [DOI] [PMC free article] [PubMed] [Google Scholar]
- 31.Hudecek M et al. The nonsignaling extracellular spacer domain of chimeric antigen receptors is decisive for in vivo antitumor activity. Cancer Immunol. Res 3, 125–135 (2015). [DOI] [PMC free article] [PubMed] [Google Scholar]
- 32.Alabanza L et al. Function of novel anti-CD19 chimeric antigen receptors with human variable regions is affected by hinge and transmembrane domains. Mol. Ther 25, 2452–2465 (2017). [DOI] [PMC free article] [PubMed] [Google Scholar]
- 33.Waage A, Brandtzaeg P, Halstensen A, Kierulf P & Espevik T The complex pattern of cytokines in serum from patients with meningococcal septic shock. Association between interleukin 6, interleukin 1, and fatal outcome. J. Exp. Med 169, 333–338 (1989). [DOI] [PMC free article] [PubMed] [Google Scholar]
- 34.Oliver JC et al. Cytokine kinetics in an in vitro whole blood model following an endotoxin challenge. Lymphokine Cytokine Res 12, 115–120 (1993). [PubMed] [Google Scholar]
- 35.Salter AI et al. Phosphoproteomic analysis of chimeric antigen receptor signaling reveals kinetic and quantitative differences that affect cell function. Sci. Signal 11, eaat6753 (2018). [DOI] [PMC free article] [PubMed] [Google Scholar]
References
- 36.Marasco WA, Haseltine WA & Chen SY Design, intracellular expression, and activity of a human anti-human immunodeficiency virus type 1 gp120 single-chain antibody. Proc. Natl Acad. Sci. USA 90, 7889–7893 (1993). [DOI] [PMC free article] [PubMed] [Google Scholar]
- 37.Shen L, Evel-Kabler K, Strube R & Chen SY Silencing of SOCS1 enhances antigen presentation by dendritic cells and antigen-specific anti-tumor immunity. Nat. Biotechnol 22, 1546–1553 (2004). [DOI] [PubMed] [Google Scholar]
- 38.Song XT et al. A20 is an antigen presentation attenuator, and its inhibition overcomes regulatory T cell-mediated suppression. Nat. Med 14, 258–265 (2008). [DOI] [PMC free article] [PubMed] [Google Scholar]
- 39.Wang D et al. Efficacy of intracellular immune checkpoint-silenced DC vaccine. JCI Insight 3, e98368 (2018). [DOI] [PMC free article] [PubMed] [Google Scholar]
- 40.Jiang XX et al. Control of B cell development by the histone H2A deubiquitinase MYSM1. Immunity 35, 883–896 (2011). [DOI] [PMC free article] [PubMed] [Google Scholar]
Associated Data
This section collects any data citations, data availability statements, or supplementary materials included in this article.


