

Abstract
Pore-forming toxins are a common virulence strategy for bacterial pathogens such as methicillin resistant Staphylococcus aureus (MRSA)1–3. It is unclear whether innate immune mechanisms exist that can neutralize pore-forming toxins during infection. We previously showed the autophagy protein ATG16L1 to be necessary for protection against MRSA strains encoding -toxin4, a pore-forming toxin that binds the metalloprotease ADAM10 on the surface of a broad range of target cells and tissues5–7. Autophagy typically involves the targeting of cytosolic material to the lysosome for the degradation. Here, we demonstrate that ATG16L1 and other ATG proteins mediate protection against α-toxin through the release of ADAM10 on exosomes, extracellular vesicles of endosomal origin. Bacterial DNA and CpG DNA induced the secretion of ADAM10-bearing exosomes in both human cells as well as in mice. Transferred exosomes protected host cells in vitro by serving as scavengers that can bind multiple toxins and improved survival of mice infected with MRSA in vivo. These findings indicate that ATG proteins mediate a novel form of defense in response to infection whereby the production of exosomes serve as decoys for bacterially-produced toxins.
We previously demonstrated that primary cells harvested from mice with hypomorphic expression of Atg16l1 (Atg16l1HM) display an increase in total ADAM10 and are susceptible to lysis when cultured in the presence of α-toxin4. Consistent with these findings, we found cell surface and total ADAM10 are increased in the human alveolar epithelial cell line A549 upon shRNA-mediated depletion of ATG16L1 (Fig. 1a–d). ATG16L1 knockdown (KD) cells treated with purified α-toxin displayed increased cell death compared to control cells transduced with non-targeting (nt) shRNA, whereas ADAM10 KD cells were resistant (Fig. 1e). ATG16L1 mediates the conjugation of phosphatidylethanolamine (PE) to the ubiquitin-like molecule LC3, a necessary step for the proper biogenesis of the autophagosome and subsequent events where substrates are degraded by the lysosome8. Inhibiting ULK1, a kinase upstream of ATG16L1, or ATG5, a binding partner of ATG16L1, led to increased cell surface ADAM10 similar to ATG16L1 KD (Fig. 1f). Prevention of lysosomal acidification by weak bases alters endosomal recycling to the plasma membrane9,10. Although total ADAM10 and the autophagy substrate SQSTM1 were increased when A549 cells were treated with lysosomal acidification inhibitors (NH4Cl, chloroquine, and bafilomycin), all 3 agents decreased surface ADAM10 (Fig. 1g–h and Ext. Fig. 1a–d). Surface EpCAM levels were unaltered indicating lysosome inhibition did not affect all plasma membrane molecules (Ext. Fig. 1e–g). ADAM10 levels were unaffected by proteasome inhibition (Ext. Fig. 1h–i), suggesting ATG proteins reduce cell surface ADAM10 through a lysosome- and proteasome-independent process.
Figure 1: ATG16L1 inhibits surface ADAM10 independent of lysosomal degradation.

a-b, Representative flow cytometry histogram (a) and quantification of mean fluorescent intensity (MFI) (b) of surface ADAM10 in A459 cells following ATG16L1 knockdown (ATG16L1 KD, n = 5); or cells containing non-targeting control shRNA (nt shRNA, n = 10). c-d, Representative Western blot (c) and quantification (d) of ADAM10 in ATG16L1 KD and control cells, n = 3. e, Quantification of cell death by LDH release assay of nt shRNA, ATG16L1 KD, and ADAM10 KD cells following treatment with purified α-toxin, n = 4. f, Quantification of surface ADAM10 by flow cytometry in nt shRNA (n = 3), ATG5 KD (n = 3), and ULK1 KD (n = 4) A549 cells. g-h, Representative flow cytometry histogram from three independent repeats of surface ADAM10 on A549 cells 24 hours after bafilomycin (BAF; 10nM) (g), and quantification of MFI over time following addition of BAF (n = 3). Measurements were taken from distinct samples and graphs show mean and standard error of the mean (s.e.m.). b, d, f, h, Two tailed, unpaired t-test with Welch’s correction compared to nt shRNA controls. e, Two tailed, unpaired t-test of area under curve compared to nt shRNA controls.
ATG proteins mediate the extracellular release of soluble and vesicle-bound substrates through a process broadly referred to as secretory autophagy11. ADAM10 is known to be incorporated into exosomes, extracellular vesicles typically 40 −120nm in diameter12,13. Thus, we hypothesized the autophagy machinery prevents ADAM10 accumulation on cells by facilitating its secretion on exosomes. We found a reduction in the lower molecular weight band of ADAM10 (a mature form cleaved during trafficking from the ER) in exosome fractions isolated from the culture supernatants of ATG16L1 KD cells compared with nt shRNA control cells (Fig. 2a–b and Ext. Fig. 2a). Western blot (WB) analysis confirmed the fractionation procedure led to enrichment of the exosomal marker CD9 and not the microvesicle marker ARF6 (Ext. Fig. 2b). Parallel analysis by transmission electron microscopy (TEM) indicated the exosome fraction contained a greater number of 80 – 150nm diameter single-lipid bilayer vesicles compared to microvesicles >150nm (Ext. Fig. 2c–e). The decrease in ADAM10 occuring upon ATG16L1 inhibition reflects a general reduction in exosome levels because we observed a reduction in CD9 by WB and a reduction of vesicles by TEM in the exosome fraction of ATG16L1 KD cell culture supernatant (Fig. 2a, c–e). To further validate these results through a quantitative assay, we used flow cytometry in which antibody-based staining of surface exosome markers CD9, CD63, and CD81 was combined with PKH67, a fluorescent lipid bilayer intercalating compound (Ext. Fig. 2f). Depletion of autophagy proteins significantly reduced the total numbers of exosomes in the culture supernatant (Fig. 2f). ATG16L1 KD reduced the total number of ADAM10+ exosomes but not the amount of ADAM10 per exosome (Fig. 2g), confirming the ATG proteins regulate exosome biogenesis rather than substrate incorporation. We also found the blood from Atg16l1HM (HM) mice contained less exosomes than wild-type (WT) mice (Fig. 2h).
Figure 2: ATG proteins regulate the release of ADAM10-containing exosomes.

a-c, Representative ADAM10 and CD9 Western blot from three independently repeated experiments (a), quantification of exosome ADAM10, n = 3 (b), and quantification of CD9 in cell lysates and exosomes from nt shRNA (n = 3) and ATG16L1 KD (n = 6) cells (c). d-e, Representative transmission electron micrographs (d) and quantification (e) of vesicles in the exosome fraction of nt shRNA and ATG16L1 KD culture supernatents. Scale bars, 100μM, n = 80 images. f, Flow cytometric quantification of exosomes from untreated (n = 4), nt shRNA (n = 3), ATG16L1 KD (n = 6), ULK1 KD (n = 6), and ATG7 KD (n = 6) A549 cells. g, Quantification of ADAM10 MFI in untreated, nt shRNA and ATG16L1 KD exosomes from (f), n = 3. h, Exosome quantification (CD9, CD63, CD81, and PKH67+ structures) in blood from C57BL/6J (WT, n = 6) and ATG16L1 hypomorph (HM, n = 8) mice. i, Exosome quantification following PBS (n = 4), CQ (n = 5), or BAF (n = 9) addition. j, Representative Western blot from three independent repeats analyzing ADAM10, SQSTM1, and LC3II levels in nt shRNA and STX17 KD cells. k, ADAM10 MFI of nt shRNA (n = 5) and STX17 KD (n = 6) cells. l, Exosome quantification from nt shRNA and STX17 KD cells, n = 8. Measurements were taken from distinct samples and graphs show mean and s.e.m. b-c, e, h, l, Two tailed, unpaired t-test with Welch’s correction compared to nt shRNA or WT controls. f-g, i, One-way ANOVA with Dunnet’s post-test compared to nt shRNA or PBS. Data represents at least 3 independent experiments.
Our finding that blocking lysosomal acidification decreases plasma membrane ADAM10 could be explained by a mechanism in which inhibiting late stage autophagy redirects the autophagy machinery towards generation of exosomes14–16. Consistent with this possibility, we detected increases in CD9 and ADAM10 in the exosome fraction as well as total exosome numbers in the culture supernatant of cells treated with chloroquine or bafilomycin (Fig. 2i, Ext. Fig. 3a–d). The SNARE protein syntaxin 17 (STX17) mediates autophagosome-lysosome fusion and is dispensable for secretory autophagy17,18. STX17 KD increased total ADAM10, SQSTM1, and LC3II, indicating successful inhibition of autophagy, without increasing surface levels of ADAM10 (Fig. 2j–k). However, STX17 KD supernatants contained more exosomes (Fig. 2l), indicating that ATG proteins mediate the release of exosomes in a manner distinct from conventional degradative autophagy.
We next examined whether ATG-dependent exosome production is induced by pathogen exposure. Heat-killed S. aureus (CA-MRSA USA300, hereafter HKSA), an isogenic α-toxin-deficient USA300 (Δhla), Streptococcus pneumoniae, Citrobacter rodentium, and Salmonella enterica Typhimurium all increased exosome production in human and murine cells (Fig. 3a, Ext. Fig. 4a, i). After testing several bacterially-derived products, we indentified bacterial DNA and CpG DNA as the exosome inducer (Fig. 3b, Ext. Fig. 4b–g). Also, addition of DNA isolated from S. aureus to cells elicited exosomes, and DNase-treatment abolished this effect (Ext. Fig. 4j). Exosome production in response to HKSA and CpG DNA was dependent on the endosomal DNA-sensor toll-like receptor 9 (TLR9) (Fig. 3c, Ext. Fig. 4h). Inducing autophagy with the mTOR inhibitor Torin-1 did not induce exosomes, suggesting TLR9 acts through a distinct mechanism (Ext. Fig. 4k–l). Instead, the addition of CpG DNA or bafilomycin (positive control) individually or together decreased LysoSensor staining, an indicator of acidic organelles (Ext. Fig. 5a–c). We also found treating cells with the neutral sphingomyelinase inhibitor GW4869, which prevents the generation of vesicles that become exosomes by interfering with the inward budding of the multivesicular body (MVB)19, impairs CpG DNA-induced exosome production (Ext. Fig. 4m). Thus, the membrane trafficking events downstream of TLR9 likely contribute to exosome production through regulating endosomal trafficking and vesicle biogenesis events that include the MVB.
Figure 3: Bacteria induce exosome production.

a-e, Flow cytometric quantification of exosomes in A549 cell culture supernatant 18 hours following exposure to heat killed (HK) S. aureus (n = 7), HK S. pneumoniae (n = 5), HK C. rodentium (n = 4), HK S. Typhimurium (n = 3) (a), following CpG DNA treatment (4uM, n = 5) (b), in nt shRNA (n = 6) and TLR9 shRNA (TLR9 KD, n = 3) targeted A549 cells following HKSA exposure (c), in blood from WT and Atg16l1HM mice following intranasal (i.n.) inoculation with HKSA (1×10⁸ CFU; WT + PBS, n = 7; WT + HKSA, n = 9; HM + PBS, n = 2; HM + HKSA, n = 4) (d), or intravenous (i.v.) live S. aureus (1×10⁷ CFU; WT + PBS, n = 5; WT + HKSA, n = 10; HM + PBS, n = 3; HM + HKSA, n = 6) (e). j, Venn diagram of shared and discreet proteins identified by mass spectrometry in exosomes isolated from the blood of mice exposed to HKSA or CpG DNA i.n. (1×10⁸ CFU; 20ug CpG DNA). k, Gene ontology analysis of subcellular location of proteins identified by mass spectrometry. l, Tissue specific origin of exosome proteins. Measurements were taken from distinct samples and graphs show mean and s.e.m.. a-b, Two-tailed, unpaired t-test with Welch’s correction compared to PBS controls. c-e, One-way ANOVA with Dunnet’s post-test compared to nt shRNA + PBS, or WT + PBS controls.
Intravenous injection of heat-killed or live S. aureus into WT mice led to a marked increase in exosomes in their blood that was blunted in Atg16l1HM mice, but not mice in which Atg16l1 is selectively deleted in macrophage and dendritic cell lineages (Fig. 3d–e, Ext. Fig. 4n–o). This observation is consistent with our previous study in which the Atg16l1HM mice, but not myeloid cell-specific Atg16l1 knockouts, were susceptible to lethal bloodstream infection by MRSA4. Next, we performed mass spectrometry on exosomes from the blood of mice inoculated intranasally with HKSA or CpG DNA (Ext. Fig. 4p). The majority of detected proteins originated from the liver and were previously identified in exosomes and extracellular spaces (Fig. 3f–h, Supp. Table 1–3). We confirmed the liver enzyme argininosuccinate synthase 1 (ASS1) was enriched in the HKSA and CpG DNA elicited exososmes in vivo (Ext. Fig. 4p)20.
Next, we tested whether these released vesicles could serve as a host response to bind and inhibit toxins. We found that exosomes isolated from control donor cells, but not ATG16L1 KD cells, were able to protect A549 target cells from α-toxin toxicity (Fig. 4a). Adding twice the volume of ATG16L1 KD supernatant from which exosomes were isolated improved viability of the cells, indicating that the inability of exosomes from ATG16L1 KD cells to protect cells was due to a reduction in the number of exosomes. Exosomes harvested from ADAM10 KD cells were unable to protect cells (Fig. 4a and Ext. Fig. 6a). These results were confirmed with exosomes purified through fluorescence-activated cell sorting (FACS) (Fig. 4b). Of note, pre-incubating cells with HKSA or CpG DNA also protected against α-toxin toxicity (Ext. Fig. 6b). This protection was due to exosomes as removing the exosome-containing supernatant restored susceptibility to α-toxin in HKSA or CpG DNA treated cells (Ext. Fig. 6b). Exosomes seem to protect cells by inducing toxin oligomerization on the exosome membranes (Fig. 4c–d).
Figure 4: Exosomes protect against bacterial toxins.

a-b, A549 cell death following treatment with α-toxin or α-toxin together with exosomes isolated from nt shRNA (n = 6), ATG16L1 KD (n = 6), ATG16L1 KD x2 (n = 3), ADAM10 KD (n = 5) cells (a), or FACS-purified exosomes, n = 4 (b). c-d Western blot of α-toxin oligomerization following addition of exosomes isolated from WT or ADAM10 KD A549 cells. Representative Western blot of α-toxin (c), and quantification of α-toxin oligomerization >130 kD (d), n = 3. e, Bone marrow-derived macrophage (BMDM) cell death following treatment with LukED together with exosomes isolated from WT BMDM cultures (LukED only, n = 10; LukED + WT Exo, n = 16). f, Cell death following following exposure to diphtheria toxin (DPT) together with exosomes isolated from of WT A549 cultures, n = 12. g, Survival of WT mice infected i.v. with a lethal dose of S. aureus (USA300; 5 × 10⁷ CFU) mock-treated or injected i.p. with exosomes from WT mice, n = 9 mice/condition. h, Survival of WT (n = 10), and Atg16l1HM (Mock -> HM, n =10; WT exo -> HM, n = 10) mice infected with i.v. 2.5 ×10⁷ CFU S. aureus and receiving exosomes from WT mice. i, Survival of WT mice (n = 10) given a pretreatment of intranasal HKSA followed by a lethal dose of S. aureus (USA300; 5 × 10⁷ CFU; (n = 10) or an isogenic α-toxin deficient strain (Δhla; n = 5). j, S. aureus burden 24 hours post infection with 1×10⁷ USA300 i.v. in kidney, spleen, lung, and blood (per mL) in mice pre-exposed to either PBS or HKSA i.v., n = 6. Measurements were taken from distinct samples and graphs show mean and s.e.m.. a-b, One-way ANOVA with Dunnet’s post-test compared to α-toxin only or control exo. d-f, j, Two-tailed, unpaired t-test with Welch’s correction compared to nt shRNA exo, α-toxin only, or PBS controls. g-i, Log-rank Mantel-Cox test.
Exosomes elicited from murine bone marrow derived macrophages (BMDMs) harbor the toxin receptor CCR5 and protected BMDMs from LukED (Fig. 4e, Ext. Fig. 6c), another toxin produced by S. aureus21. Similarly, exosomes isolated from A549 cell protected target cells from diphtheria toxin (Fig. 4f), a potent toxin produced by Corynebacterium diphtheriae that binds EGFR22, which was present in our exosome proteomics data set (Supp. Table 1). Thus, exosomes can neutralize different types of toxins.
To test whether exosomes are protective in vivo, donor mice were injected with HKSA to elicit exosomes in the blood, which were transferred into recipient mice that were subsequently infected intravenously with a lethal dose of S. aureus. Transfer of exosomes from WT but not Atg16l1HM donors extended the survival of S. aureus-infected WT recipient mice (Fig. 4g, Ext. Fig. 6d–e). Also, transfer of exosomes from a WT donor improved survival of Atg16l1HM mice injected with lethal dose 50 (LD50) of S. aureus to levels similar as mock-treated WT mice (Fig. 4h), suggesting the increased susceptibility of Atg16l1 mutants is in part due to reduced exosome production.
Finally, priming mice with intravenous injection of HKSA increased the relative amount of α-toxin oligomers to monomers in the exosome isolated from the bronchoalveolar lavage (BAL) fluid compared with mock-treated controls (Ext. Fig. 6f–k). Additionally, we found that conditioning the mice with HKSA prolonged survival following S. aureus infection, phenocopying control mice infected with the Δhla strain (Fig. 4i). To monitor bacterial burden, we challenged mice with a lower inoculum, and found that conditioning with HKSA resulted in reduction in S. aureus burdens in the kidney and blood (Fig. 4j).
Exosomes extend the functional reach of their cells of origin and contribute to a spectrum of biological processes23,24. Our results suggest exosomes can also act as a novel innate immune response to bacterial infection by acting as decoys that trap membrane-acting virulence factors, like pore-forming toxins, to prevent injury of target tissues. The action of these ‘defensosomes’ are in line with recent evidence engineered liposomes can neutralize toxins from Gram-positive bacteria25. These findings also indicate ATG proteins regulate the production of exosomes during host defense, a mechanism that is distinct from recently uncovered roles of ATG16L1 in promoting plasma membrane repair during Listeria monocytogenes infection or prevening necroptosis mediated by the pore-forming molecule MLKL during norovirus infection26,27. Rather, the findings in our study resemble recently described processes in which extracellular vesicles are produced when the atypical ATG12–ATG3 conjugate promotes mulitvesicular body (MVB) function or ATG5 disrupts lysosomal acidification28,29. Given the origin and regulation of extracellular vesicles remain poorly defined, a detailed understanding of the cellular response triggering the production of defensosomes during infection may allow for opportunities to leverage their unique properties to combat bacteria and other pathogens.
METHODS
Mice
Age and gender matched 8–12 week old mice on the C57BL/6J background were used. Atg16L1HM mice on the C57BL/6J background were previously described4,30,31. Wild-type (WT) refers to littermate controls generated from breeder pairs that were heterozygous for the Atg16L1HM allele for experiments that involve comparisons between genotype. For other experiments, C57BL/6J mice were purchased from Jackson Laboratory and bred onsite. All animal studies were performed according to approved protocols and ethical guidelines established by the NYU School of Medicine Institutional Animal Care and Use Committee (IACUC) and institutional IRB.
Bacterial growth
S. aureus strain LAC/USA300 was grown overnight in tryptic soy broth (TSB) broth with shaking at 37C and diluted 1:100 followed by an additional 3–4 hours of growth until bacteria reached an optical density of 2. S. pneumonia strain D39 was grown overnight in Luria-Bertani (LB) broth at 37C. The following day S. pneumonia was diluted 1:50 followed by 4 hour of growth until optical density reached 0.5. C. rodentium and S. Typhimurium was grown overnight in Luria-Bertani (LB) broth at 37C. The following both were diluted 1:10 followed by 4 hour of growth until optical density reached 2.0. Bacterial density was confirmed by dilution plating. 1 × 10⁹ cfu of each bacteria was boiled at 95C for 2 hours and resuspended in PBS for heat killed bacteria experiments.
shRNA knockdown
Lentivirus-based knockdown of human ATG16L1 (5’-CCGGACTGTAGCTTTGCCGTG
AATGCTCGAGCATTCACGGCAAAGCTACAGTTTTTTTG-3’), ULK1 (5’-CCGGGCC
CTTTGCGTTATATTGTATCTCGAGATACAATATAACGCAAAGGGCTTTTT-3’), ATG5 (5’-CCGGGATTCATGGAATTGAGCCAATCTCGAGATTGGCTCAATTCCATGAATC
TTTTTTG-3’), ATG7 (5’-CCGGGCTTTGGGATTTGACACATTTCTCGAGAAATGTGTCA
AATCCCAAAGCTTTTT-3’), ADAM10 (5’-CCGGCCAGGTGGAATTACTTAATTC
TCGAAGAATTTAAGTAATTCCTGGTTTTT-3’) and non-targeting control were performed using MISSION® shRNA constructs (Sigma-Aldrich) according to previously described transduction methods32. Virus expressing shRNAs were produced by DNA transfection via Lipofectamine 3000 (ThermoFisher). Successful knockdown was confirmed by Western blot and/or RT- qPCR.
Flow cytometry
A549 cells were stained for surface markers ADAM10 (human SHM14) and EpCAM (human 9C4) using antibodies from BioLegend. A fixable live/dead stain from BioLegend was used to exclude dead cells. For profiling, exosome pellets were resuspended in 100 μL of PBS and were stained with a combination of CD9 (human Hl9a, mouse MZ3), CD63 (human H5C6, mouse NVG-2), CD81 (human 5a6, mouse Eat-2), CCR5 (mouse HM-CCR5) and/or ADAM10 surface antibodies from BioLegend for 60 mins at 4C. Exosomes fractions were then stained with PKH67 (Sigma) as recommended by the manufacturer. Exosome fractions were washed in 40 mL PBS and ultracentrifuged again at 100,000 g for 60 mins. Washed exosome pellets were resuspended PBS. For LysoSensor experiments, A549 cells were stimulated for 4 hrs (1uM CpG-A, 10nM Bafilomycin, or media alone). Cells were loaded with 1uM Lysosensor Green DND-189 (Molecular Probes, Invitrogen, Karlsruhe, Germany) diluted in prewarmed media and incubated for 15 minutes at 37C. Cells were collected with 1mL 5mM PBS-EDTA and washed once with FACs buffer (5% FCS, 1X PBS, 2mM EDTA). Cell and exosome were analyzed using Beckman Coulter Cytoflex Cytometer. For FACS assisted purification, exosomes identification and isolation was performed as previously described33, and stained with a combination of CD81, CD63, and PHK67. Exosomes were sorted using the FACS ARIA IIu SORP cell sorter.
Western blotting
1×10⁶ cells were collected and washed with PBS, then suspended in RIPA buffer (Thermo-Scientific) containing 10X protease inhibitor (Santa Cruz Biotechnologies). Tissue homogenate was then pelleted twice at 10,000g × 10 min, 4C. Protein concentration in the supernatant was measured by Bradford assay and reduced using 4X Laemmli buffer containing β-mercapotethanol at 95C for 5 min. For gel electrophoresis, 10 to 30ug of protein were run at 120V for 1 hour using a 4–12% gradient protein gel (Thermo Fisher). Proteins were then transferred to an Immuno-Blot PVDF membrane through Bio-Rad semi-dry transfer apparatus for 1 hour, 12V constant. Membrane was incubated for 30 minutes with 5% Non-fat dairy milk, and mouse anti-β-actin (Abcam) at 1:10000, polyclonal rabbit anti-ADAM10 (Cell Signaling) at 1:2500, mouse anti-ATG16L1 (MBL) at 1:1000, monoclonal rabbit anti-CD9 (Cell Signaling) at 1:1000, monoclonal mouse anti-CD81 (Cell Signaling) at 1:1000, polyclonal rabbit anti-ARF6 (Cell Signaling) at 1:2000, polyclonal rabbit anti-ASS1 (Abcam) at 1:1000, polyclonal rabbit anti-HLA (Sigma) at 1:5000, polyclonal rabbit anti-SQSTM1 (Cell Signaling) at 1:2000, monoclonal rabbit anti-LC3 (Cell Signaling) at 1:2000, or polyclonal rabbit anti-STX17 (Abcam) at 1:1000 were probed overnight at 4C. Membranes were washed 3 times for 5 minutes and probed with secondary antibody rabbit-anti mouse LICOR IRDye 800CW and goat anti-rabbit LICOR IRDye 800CW 680 antibodies for 1 hour at RT. After additional washing, protein was then detected LICOR Odyssey CLX imaging system.
Exosome Isolation
48 hours prior to isolation 1 × 10⁷ A549 cells were plated in 150 millimeters tissue culture dishes. 24 hours pre-isolation, approximately 35–40 milliliters of 10% DMEM (10% FBS, 1% nonessential amino acids, and 1% penicillin/streptomycin) was removed, and fresh 10% DMEM without supplements was added to each dish. On the day of exosome isolation media from each plate was removed and centrifuged once at 500g for 10 mins, then centrifuged once at 10,000g for 10 mins. Supernatants were passed through a 0.22-micron filter and finally ultracentrifuged at 100,000g for 90 mins. Following ultracentrifugation supernatant was discarded. The pellet remaining after ultracentrifugation was collected and used for downstream analysis. When assessing by Western blot, normalization was performed by controlling for the number of cells seeded onto the plate and input loading was confirmed by probing CD9 in the depleted cell fractions. For exosome isolation from broncholear lavage (BAL), mice were euthanized and trachea exposed. Using a 0.5 inch blunt nose needle, 1mL of PBS was flushed into the lungs and removed three times. The exosome isolation protocol was then performed on the remaining BAL fraction as previously described.
α-toxin and exosome treatment of cells grown in culture
To determine cell sensitivity to α-toxin, 3 ×10⁴ A549 cells were seeded in 96 well plates and allowed to attach overnight. Various concentrations of α-toxin were then added and incubated together for 3 hours at 37C. 50 microliters of supernatant was collected and cell death was measured by pore formation via LDH release (Promega CytoTox-One Kit) or by metabolic activity cia CellTiter (Promega cat# G3582). Total cytolysis was calculated via manufacturer’s instructions. For experiments in which the protective ability of exosomes was analyzed, 3 ×10⁴ A549 cells were seeded in 96 well plates and allowed to attach overnight. Exosome fractions were isolated from 35 mLs of A549 culture supernatant as described above. The exosome fraction was mixed with 1 μg/mL α-toxin in PBS. The exosome / α-toxin mixture was incubated at 37C for 30 mins and then added to plated A549 cells.
Treatment with heat killed bacteria, bacterial components, and chemical inhibitors
5 ×10⁶ A549 cells were seeded and allowed to attach overnight. The following day cells were washed with PBS and new media was added including 5×10⁶ CFU heat killed S. aureus, 2×10⁵ CFU heat killed S. pneumoniae, 5×10⁶ CFU heat killed C. rodentium, 5×10⁶ CFU heat killed S. Typhimurium, 250μg/mL lipoteichoic acid (LTA, Sigma; cat# L2515), 1μg/mL lipopolysaccharide (LPS, InvivoGen; cat# tlrl-3pelps), 10μg/mL peptidoglycan (PDG, Sigma; cat# 77140), 2μM CpG DNA, .5μg/mL Pam2CSK (InvivoGen; cat# tlrl-pm2s-1), .5μg/mL Pam3CSK (InvivoGen; cat# tlrl-pms), .5μg/mL S. aureus (SA) genomic DNA (gDNA; .5ug/mL), .5μg/mL S. aureus RNA, 2μM GW4869 (Sigma; cat# D1692), or 200nM Torin-1 (Tocris; cat# 4247). After 4 or 18 hours, supernatants were removed from cultures and exosomes were collected as previously described. Exosomes were identified and quantified using aforementioned flow cytometry protocol.
Infection and exosome treatment of mice
Donor mice received an intranasal treatment of heat-killed S. aureus to induce exosome production. After 4–6 hours mice were bled submandibularly and plasma was collected. The exosome fraction was collected as described above for A549 cells. Recipient WT or Atg16L1HM mice each received exosomes intraperitonially isolated from 1 mL of plasma on day −1, day 0, and day +1 of infection in a final volume of 1 mL of PBS. On day 0 mice were intravenously infected with USA300 S. aureus and mice were monitored for signs of morbidity daily.
α-toxin purification from S. aureus
Primers, VJT1391 (5’ GGGGG-AAGCTT-gtttgatatggaactcctgaatttttcg 3’; underline sequence is the HindIII site) and VJT1395 (5’ GATAA-GCTAGC-tta-GTGGTGGTGGTGGTGGTG-atttgtcatttcttc 3’; underline sequence is the Nhe1 site), were used to amplify the promoter region of hla followed by the hla gene and 6-histadine tag (6xhis tag) from the genomic DNA of S. aureus strain Newman by PCR. The PCR product was then cloned into the pOS1 plasmid using HindIII and NheI restriction sites to generate pOS1-phla-hla-6his plasmid. The purified plasmid was transformed into E. coli DH5α competent cells, selected by ampicillin resistance (100 μg/ml) and confirmed by colony PCR and Sanger sequencing (Genewiz). The plasmid from a positive clone was purified and electroporated into S. aureus RN4220, selected for by chloramphenicol (10 μg/ml) resistance, then the plasmid purified from RN4220 was electroporated into S. aureus Newman ΔlukED ΔhlgACB::tet ΔlukAB::spec Δhla::ermC (ΔΔΔΔ) and selected for by chloramphenicol (10 μg/ml) resistance. To purify 6xhis-tagged α-toxin, S. aureus Newman ΔΔΔΔ strain harboring the pOS1-phla-hla-6his plasmid (strain VJT 45.56) were grown overnight in 5 ml Tryptic Soy Broth (TSB; Fisher) supplemented with chloramphenicol (10 μg/ml) at 37°C, shaking at 180 rpm, then sub-cultured the following day at a 1:100 dilution in TSB supplemented with chloramphenicol (10 μg/ml) and incubated for 5 hours at 37°C, shaking at 180 rpm. The cultures were centrifuged for 15 minutes at 6,000 rpm, 4°C and the supernatants filtered-sterilized through a 0.22 μm filter (Corning). The filtrates were incubated in the presence of a final concentration of 10 mM imidazole and nickel-nitrilotriacetic acid (Ni-NTA) agarose resin (Qiagen) equilibrated with 10mM imidazole (Fisher) in 1x Tris-Buffered Saline (TBS; Cellgro), for 30 minutes at 4°C while nutating. The filtrates were passed through a glass column by gravity filtration, then nickel-NTA-bound toxins were washed with 25mM imidazole, followed by a secondary wash with 1x TBS. The nickel-NTA-bound toxins were eluted using 500 mM imidazole. The eluted toxins were dialyzed into 10% glycerol in 1x TBS and filtered through a 0.22 μm filter prior to storage in −80°C. When required, the toxins were concentrated using concentrator columns (Ultra-15 Centrifugal Filter Units 10,000 NMWL, 15-ml volume capacity; EMD Millipore Amicon) before measuring protein concentration using absorbance at 280 nm with a Nanodrop (Thermo Scientific) and Beer-Lambert’s equation. 2 μg of the purified proteins were separated by SDS-PAGE at 90V for 120 minutes, following by Coomassie Blue staining to visualizing proteins to confirm purity.
Sample preparation for mass spectrometry analysis
Exosomes were lysed in 8M urea containing 10% SDS. Lysed exosomes were reduced using dithiothreitol (5μl of 0.2 M) for 1 h at 55 °C. The reduced cysteines were subsequently alkylated with iodoacetamide (5μl of 0.5 M) for 45 min in the dark at room temperature. Each sample was loaded onto S-Trap microcolumns (Protifi, USA) according to the manufacturer’s instructions. Briefly, 3 μL of 12% phosphoric acid and 165 μL of binding buffer (90% methanol, 100-mM TEAB) were added to each sample. Samples were loaded onto the S-trap columns and centrifuged at 4000×g for 30 s. After three washes, 20 μL of 50-mM TEAB and 1 μg of trypsin (1:50 ratio) were added to the trap and incubated at 47 °C for one hour. Peptides were then eluted using 40% acetonitrile (ACN) in 0.5% acetic acid followed by 80% acetonitrile (ACN) in 0.5% acetic acid. Eluted peptides were dried and concentrated in a SpeedVac.
LC-MS/MS analysis
1 μg of each sample was loaded onto a trap column (Acclaim® PepMap 100 pre-column, 75 μm × 2 cm, C18, 3 μm, 100 Å, Thermo Scientific) connected to an analytical column (EASY-Spray column, 50 μm × 75 μm ID, PepMap RSLC C18, 2 μm, 100 Å, Thermo Scientific) using the autosampler of an Easy nLC 1000 (Thermo Scientific) with solvent A consisting of 2% acetonitrile in 0.5% acetic acid and solvent B consisting of 80% acetonitrile in 0.5% acetic acid. The peptide mixture was gradient eluted into the Orbitrap QExactive HF-X Mass Spectrometer (Thermo Scientific) using the following gradient: a 5%−35% solvent B in 120 min, 35% −45% solvent B in 10 min, followed by 45%- 100% solvent B in 20 min. The full scan was acquired with a resolution of 60,000 (@ m/z 200), a target value of 3e6 and a maximum ion time of 45 ms. Following each full MS scan, twenty data-dependent MS/MS spectra were acquired. The MS/MS spectra were collected with a resolution of 15,000, an AGC target of 1e5, maximum ion time of 120ms, one microscan, 2m/z isolation window, fixed first mass of 150 m/z, dynamic exclusion of 30 sec, and Normalized Collision Energy (NCE) of 27.
Mass Spec Data analysis
All acquired MS2 spectra were searched against the UniProt mouse reference database using Sequest HT within Proteome Discoverer 1.4 (Thermo Fisher Scientific). The search parameters were as follows: precursor mass tolerance ±10 ppm, fragment mass tolerance ±0.02 Da, digestion parameters trypsin allowing two missed cleavages, fixed modification of carbamidomethyl on cysteine, variable modification of oxidation on methionine, and variable modification of deamidation on glutamine and asparagine. The results were filtered using a 1% peptide and protein False Discovery Rate (FDR) searched against a decoy database and requiring proteins to have at least two unique peptides.
α-toxin oligomerization assay
Exosomes were collected from A549 culture supernatants as previously described. Exosome fractions were resuspended in 30 uL PBS. α-toxin was added to exosome suspension at a concentration of 1ug/mL. The exosome/α-toxin combination was then shook at room temperature for 1 hour. Following incubation, the exosome/α-toxin mixture was resuspended in 40 mL PBS and spun at 100,000g for 90 mins to pellet exosomes with bound α-toxin and remove excess α-toxin. The exosome fraction was resuspended in RIPA buffer containing 4X Laemmli buffer without β-mercapotethanol. For gel electrophoresis, each sample including an α-toxin only lane were run at 120V for 1 hour using a 4–20% tris-glycine gradient protein gel (Thermo Fisher). Proteins were then transferred to an Immuno-Blot PVDF membrane through Bio-Rad semi-dry transfer apparatus for 1 hour, 12V constant. Membrane was incubated for 30 minutes with 5% Non-fat dairy milk, and mouse anti-α-toxin (Sigma) at 1:5000 was probed overnight at 4C. Membranes were washed 3 times for 5 minutes and probed with secondary antibody goat anti-rabbit LICOR IRDye 800CW 680 antibodies for 1 hour at RT. After additional washing, protein was then detected LICOR Odyssey CLX imaging system.
Transmission Electron Microscopy
For exosome morphology analysis, 5 μl isolated exosome were put on glow discharged carbon coated 400 mesh copper/rhodium grids and stained with 1% uranyl acetate aquous solution. For whole mount immune-electron microscopy, deposit 5μl of 2% paraformaldehyde fixed exosomes on glow discharged formvar-carbon coated copper grids, and let it adsorbed for 20min. After washing with PBS, the grids were incubated with 50mM glycine/PBS for 5min, blocked with 1% coldwater fish skin gelatin (Sigma) for 10min, then incubate with primary antibodies (anti-TSG101, Abcam) in blocking solution for 2 hours at room temperature. Following washing with PBS, gold conjugated secondary antibodies (15nm protein A- gold, Cell Microscopy Center, University Medical Center Utrecht, 35584 CX Utrecht, The Netherlands; 12nm colloidal gold-AffiniPure goat anti-rabbit IgG (H+L), Jackson ImmunoReasearch Laboratories, Inc., West Grove, PA) were applied in the blocking buffer for 1 hour. After washing with PBS, the grids were fixed in 1% glutaraldehyde in PBS for 5min, washed with water, contrasted and embedded in a mixture of 3% uranyl acetate and 2% methylcellulose in a ratio of 1 to 9. All stained grids were examined under Philips CM-12 electron microscope and photographed with a Gatan (4kx2.7k) digital camera (Gatan Inc., Pleasanton, CA)34.
Data availability
The data sets generated during this study are available from the corresponding authors upon request. Western blot gel source data can be found in Supplementary Fig. 1. All identified proteins from mass spectrometry experiments and thier Accession IDs are listed in Supplementary Tables 1–3.
Statistical analysis
All analyses were performed with Graphpad Prism v.7. The number of animals or biological repicated used in the experiments in this study is estimated based on a power analysis with the following assumptions: standard deviation will be ~20% of the mean, p-value will be under 0.05 when the null hypothesis is false, the effect size (Cohen’s d) is between 1.0–2.0. The minimal number of mice required under these conditions ranges between 6–28 for in vivo experiments. Additionally, we have carefully chosen the sample size listed based on empirical evidence of what is necessary for interpretation of the data and statistical significance. A unpaired two-tailed t-test with Welch’s correction was used to evaluate differences between two groups. One-way ANOVA with Dunnet’s post-test analysis was performed to evaluate differences between groups of 3 or more. The log-rank Mantel–Cox test was used for comparison of mortality curves. Randomization nor blinding was utilized in this study.
Extended Data
Extended Figure 1: ADAM10 and EpCAM levels following lysosomal inhibition with ammonium chloride (NH4Cl), chloroquine (CQ), bafilomycin (BAF), or proteasomal inhibition with MG132.

a, Time course flow cytometry analysis of ADAM10 following lysosomal inhibition with ammonium chloride (NH4Cl, 20mM) or chloroquine (CQ, 50μM), n = 3. b-d, Western blot analysis of ADAM10 and SQSTM1 following lysosomal inhibition by NH4Cl, CQ, or bafilomycin (BAF, 10nM). Representative Western blot from four independent experiments (b), quantification of ADAM10 levels (n = 5) (c), and quantification of SQSTM1 levels 24 hours post inhibition (n = 3) (d). e-f, Representative histogram (e) and quantification (f) of cell surface EpCAM in BAF treated A549 cells, n = 3. g, Time course flow cytometry analysis of EpCAM following treatment with NH4Cl or CQ, n = 4. h-i, ADAM10, P4D1, and ACTIN levels following proteasomal inhibition by chemical compound MG132. Flow cytometry time course of cell surface ADAM10 levels following MG132 treatment (h) and representative Western blot from three independent experiments (i), n = 3. Measurements were taken from distinct samples and graphs show mean and standard error of mean (s.e.m.). a, c-d, f-h, One-way ANOVA with Dunnet’s post-test compared to PBS or time 0.
Extended Figure 2: Exosome isolation and quantification strategies.

a, Exosome isolation protocol from in vitro or in vivo sources. Exosomes are isolated using a multi-step centrifugation procedure including a 0.22μM filtration step. b, Western blot of ACTIN, ARF6, and CD9 following each sequential centrifugation step during exosome isolation. c, Electron microscopy (EM) quantification of vesicles 80–150 nm and >150 nm in size, n = 80 images. d, EM negative staining of exosome fractions. Arrows indicate exosomes and protein aggregates. e, Representative EM image of exosome fraction and zoomed inset with arrows indicating the single membranes of exosomes. f, Gating strategy and representative flow cytometry plots from nt shRNA and ATG16L1 KD samples of six independently repeated experiments. Exosomes were stained with antibodies against CD9, CD63, CD81 and ADAM10. Exosomes are concurrently labeled with PKH67, a lipid membrane incorporating dye. Measurements were taken from distinct samples and graphs show mean and standard error of mean (s.e.m.). c, Two-tailed, unpaired t-test with Welch’s correction compared to PBS controls.
Extended Figure 3: CQ and BAF elicit ADAM10+ exosome production.

a-d. Western blot analysis of cell lysate CD9 (Cell CD9), exosome CD9 (Exo CD9) and exosome ADAM10 (Exo ADAM10) following addition of CQ or BAF. Representative Western blot from six independent experiments (a) and quantification of Cell CD9 (b), Exo CD (c), and Exo ADAM10 (d) after PBS, CQ, or BAF treatment. Measurements were taken from distinct samples and graphs show mean and standard error of mean (s.e.m.). b-d, One-way ANOVA with Dunnet’s post-test compared to PBS controls.
Extended Figure 4: Exosomes are produced in response to bacterial exposure.

a, Flow cytometry quantification of exosomes per 100,000 events in murine BMDCs (BMDCs + PBS, n = 3; BMDCs + HKSA, n = 4) and BMDMs (n = 5) following exposure to HKSA. b-h, Quantification of total exosomes in A549 cell culture supernatant by flow cytometry 18 hours following treatment with (b) peptidoglycan (PDG), (c) lipopolysaccharide (LPS), (d) lipoteichoic acid (LTA), (e) Pam3CSK, (f) Pam2CSK, or (g) S. aureus RNA (SA RNA), n = 3. h, Quantification of total exosomes in TLR9 KD A549 cell culture supernatants following treatment with CpG DNA, n = 3. i, Flow cytometry quantification of A549 produced exosomes following exposure to heat killed S. aureus (HKSA) or a strain of S. aureus deficient in the production of α-toxin (HK dHLA). j, Flow cytometry quantification of exosomes isolated from A549 cells treated with PBS (n = 3), S. aureus genomic DNA (SA gDNA; .5ugmL; n = 5) and/or DNase I (n = 2) k, Flow cytometry quantification of exosomes isolated from cells treated with BAF (n = 5), Torin-1 (n = 6), or both (n = 3). l, Representative Western blot of SQSMT1, LC3I/II and ACTIN in cells treated BAF, Torin-1, or both 4 hours post treatment from two independent experiments. p, Flow cytometry quantification of exosomes from A549 cells treated with Mock (PBS, n = 8), CpG DNA (n = 8), or CpG DNA and GW4869 (n = 7). n-o, Plasma exosome quantification of ATG16L1 flow/flox; CD11c-Cre (n), and ATG16L1 flow/flox; LysM-Cre (o) following exposure to either CpG DNA or HKSA, respectively. p, Representative Western blot of ADAM10, ASS1, CD9 and CD81 in exosome fractions submitted to mass spectrometry from three independent experiments. Measurements were taken from distinct samples and graphs show mean and standard error of mean (s.e.m.). a, b-h, Two-tailed, unpaired t-test with Welch’s correction compared to PBS controls. j, k, m-o, One-way ANOVA with Dunnet’s post-test compared to PBS, Mock, CpG DNA or Cre−/+ controls.
Extended Figure 5: BAF and CpG DNA decrease acidic organelles.
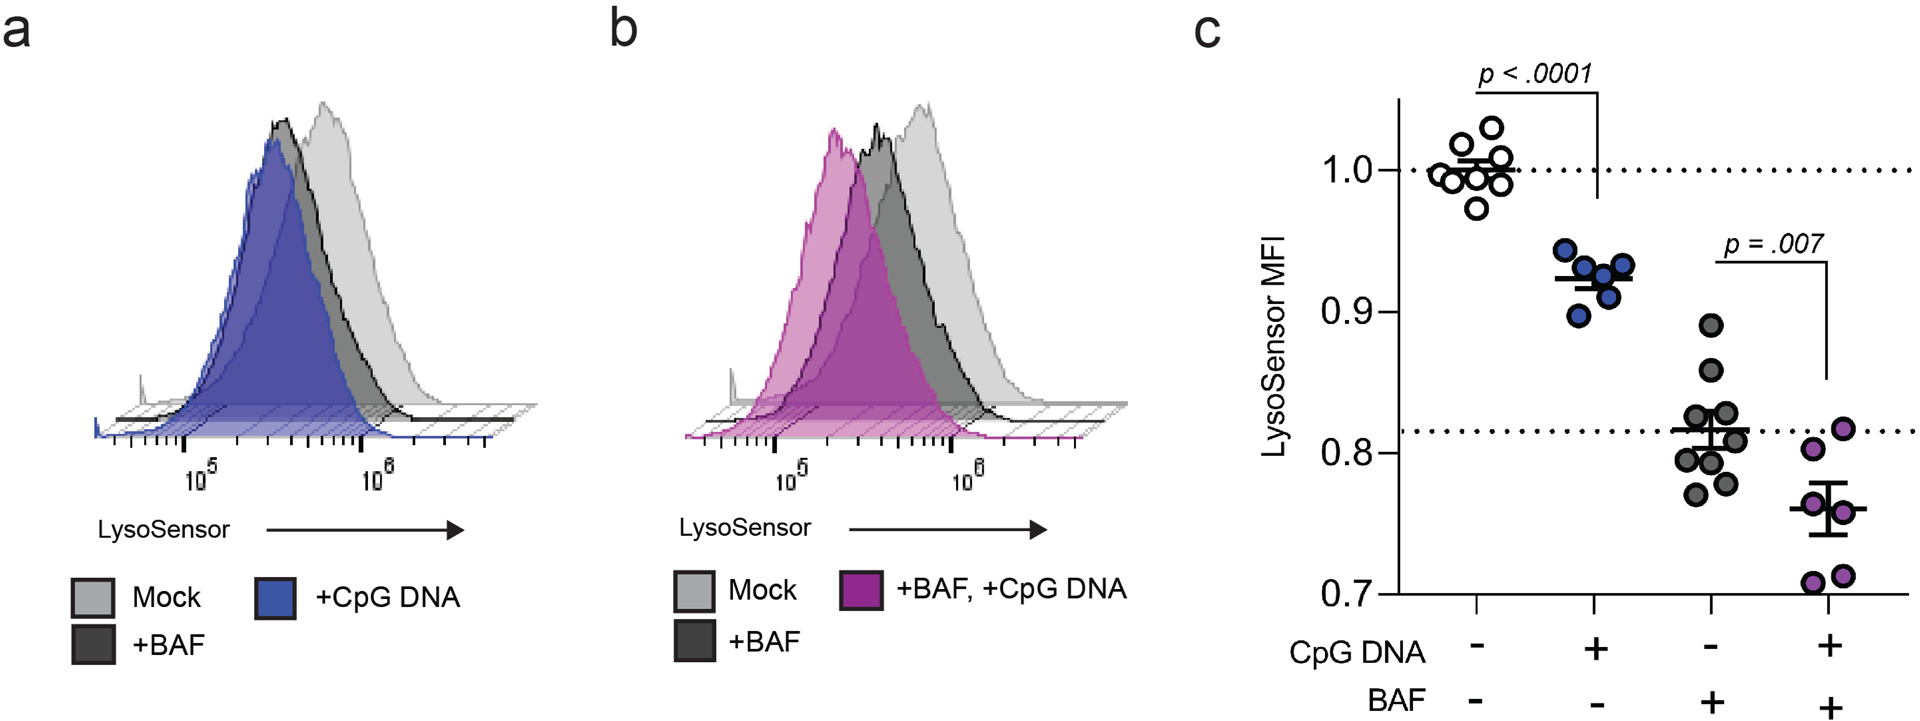
a-c, Representative flow cytometry histograms from three independent experiments of Lysosensor signal following treatment with BAF, CpG DNA (a), or BAF and CpG DNA (b). c, Quantification of Lysosensor MFI following treatment with PBS (n = 8), BAF (n = 6), CpG DNA (n = 9), and BAF + CpG DNA (n = 6)(c). Measurements were taken from distinct samples and graphs show mean and standard error of mean (s.e.m.). c, One-way ANOVA with Dunnet’s post-test compared to PBS controls.
Extended Figure 6: Exosomes protect from S. aureus toxicity in vitro and in vivo.

a, Flow cytometry exosome quantification from nt shRNA control and ADAM10 KD A549 cells, n = 3. b, Cell death measured by LDH release of A549 cells treated with α-toxin only, pretreated with HKSA or CpG DNA and α-toxin (induced), or pre-exposed to HKSA or CpG DNA followed by PBS wash and then α-toxin treatment (induced; washed), n = 5. c, Representative flow cytometry histograms of CCR5 on CD81+, CD63+, and CD9+ exosomes isolated from murine BMDMs. d, Exogenous exosome transfer protocol. In Step 1, donor mice are pre-exposed to HKSA i.v. to induce exosome production. In Step 2, exosomes from donor mice were then injected intraperitoneally (i.p.) on day −1, day 0, and day +1 following lethal i.v. injection of S. aureus. e, Survival of WT mice infected i.v. with a lethal dose of 5×10⁷ CFU S. aureus (USA300) that were mock-treated (n = 10) or injected i.p. with exosomes from Atg16l1HM mice (n = 8). f, Endogenous exosome protection protocol. Mice are i.v. injected with HKSA to induce exosome production. 4 hours later mice were infected with a lethal dose of S. aureus (2.5–5 ×10⁷). g-h, Western blot analysis of α-toxin oligomerization in total bronchiolar lavage (BAL) or exosome fraction in BAL of mice pre-exposed to HKSA or PBS intranasally (i.n.), representative of four independent experiments. i-j, Quantification of α-toxin monomer (i), heptamer (j) in BAL and exosomes fraction following pre-exposure, n = 4. k, Ratio of α-toxin heptamer in exosome fraction to total α-toxin signal in the BAL, n = 4. Measurements were taken from distinct samples and graphs show mean and standard error of mean (s.e.m.) a, i-k, Two-tailed, unpaired t-test with Welch’s correction. b, One-way ANOVA with Dunnet’s post-test compared to α-toxin only or ‘induced’ controls. e, Log-rank Mantel-Cox test.
Supplementary Material
ACKNOWLEDGEMENTS
We wish to thank members of the Cadwell and Torres lab for constructive comments over the years. Specially, we want to thank Irnov Irnov and Exene Anderson for providing the purified S. aureus DNA and assisting with the LukED protection experiments, respectively.
This work was supported in part by US National Institute of Health (NIH) grants R01 AI121244 (K.C. and V.J.T.), R01 HL123340 (K.C.), R01 DK093668 (K.C.), R01 DK103788 (K.C.), R01 AI130945 (K.C.), R01 HL125816 (K.C.), R01 AI099394 (V.J.T.) and R01 AI105129 (V.J.T.), T32 AI007180 and F31 HL137304 (M.D.K.) and pilot awards from the NYU CTSA grant UL1TR001445 from the National Center for Advancing Translational Sciences (NCATS) (K.C.) and NYU Cancer Center grant P30CA016087 (K.C.). Cell sorting/flow cytometry (NYU Langone’s Cytometry and Cell Sorting Laboratory), mass spectrometry (The Proteomics Labratory at NYU Langone), and EM studies (The Microscopy Labratory at NYU Langone), are supported in part by NYU Langone’s Laura and Isaac Perlmutter Cancer Center Support grant P30CA016087 from the National Cancer Institute. This work was also supported by Faculty Scholar grant from the Howard Hughes Medical Institute (K.C.), Merieux Institute (K.C.), Kenneth Rainin Foundation (K.C.), Crohn’s & Colitis Foundation (K.C.), and Stony Wold-Herbert Fund (K.C.). K.C. and V.J.T. are Burroughs Wellcome Fund Investigators in the Pathogenesis of Infectious Diseases.
COMPETING FINANCIAL INTERESTS
V.J.T. is an inventor on patents and patent applications filed by NYU, which are currently under commercial license to Janssen Biotech Inc. K.C. has consulted for or received an honorarium from Puretech Health, Genentech, and AbbVie, Inc., has received research support from Puretech Health, Pacific Biosciences, and Pfizer, Inc, and has a provisional patent, U.S. Patent Appln. No. 15/625,934.
REFERENCES
- 1.Dal Peraro M & van der Goot FG Pore-forming toxins: ancient, but never really out of fashion. Nat Rev Microbiol 14, 77–92, doi: 10.1038/nrmicro.2015.3 (2016). [DOI] [PubMed] [Google Scholar]
- 2.Seilie ES & Bubeck Wardenburg J Staphylococcus aureus pore-forming toxins: The interface of pathogen and host complexity. Seminars in cell & developmental biology 72, 101–116, doi: 10.1016/j.semcdb.2017.04.003 (2017). [DOI] [PMC free article] [PubMed] [Google Scholar]
- 3.Spaan AN, van Strijp JAG & Torres VJ Leukocidins: staphylococcal bi-component pore-forming toxins find their receptors. Nature Reviews Microbiology 15, 435, doi: 10.1038/nrmicro.2017.27 (2017). [DOI] [PMC free article] [PubMed] [Google Scholar]
- 4.Maurer K et al. Autophagy mediates tolerance to Staphylococcus aureus alpha-toxin. Cell Host Microbe 17, 429–440, doi: 10.1016/j.chom.2015.03.001 (2015). [DOI] [PMC free article] [PubMed] [Google Scholar]
- 5.Inoshima I et al. A Staphylococcus aureus pore-forming toxin subverts the activity of ADAM10 to cause lethal infection in mice. Nat Med 17, 1310–1314, doi: 10.1038/nm.2451 (2011). [DOI] [PMC free article] [PubMed] [Google Scholar]
- 6.Becker RE, Berube BJ, Sampedro GR, DeDent AC & Bubeck Wardenburg J Tissue-specific patterning of host innate immune responses by Staphylococcus aureus alpha-toxin. J Innate Immun 6, 619–631, doi: 10.1159/000360006 (2014). [DOI] [PMC free article] [PubMed] [Google Scholar]
- 7.Seilie ES & Bubeck Wardenburg J Staphylococcus aureus pore-forming toxins: The interface of pathogen and host complexity. Seminars in Cell & Developmental Biology 72, 101–116, doi: 10.1016/j.semcdb.2017.04.003 (2017). [DOI] [PMC free article] [PubMed] [Google Scholar]
- 8.Matsuzawa-Ishimoto Y, Hwang S & Cadwell K Autophagy and Inflammation. Annu Rev Immunol 36, 73–101, doi: 10.1146/annurev-immunol-042617-053253 (2018). [DOI] [PubMed] [Google Scholar]
- 9.Presley JF, Mayor S, McGraw TE, Dunn KW & Maxfield FR Bafilomycin A1 Treatment Retards Transferrin Receptor Recycling More than Bulk Membrane Recycling. 272, 13929–13936, doi: 10.1074/jbc.272.21.13929 (1997). [DOI] [PubMed] [Google Scholar]
- 10.Johnson LS, Dunn KW, Pytowski B & McGraw TE Endosome acidification and receptor trafficking: bafilomycin A1 slows receptor externalization by a mechanism involving the receptor’s internalization motif. 4, 1251–1266, doi: 10.1091/mbc.4.12.1251 (1993). [DOI] [PMC free article] [PubMed] [Google Scholar]
- 11.Cadwell K & Debnath J Beyond self-eating: The control of nonautophagic functions and signaling pathways by autophagy-related proteins. The Journal of cell biology 217, 813–822, doi: 10.1083/jcb.201706157 (2018). [DOI] [PMC free article] [PubMed] [Google Scholar]
- 12.Stoeck A et al. A role for exosomes in the constitutive and stimulus-induced ectodomain cleavage of L1 and CD44. Biochem J 393, 609–618, doi: 10.1042/bj20051013 (2006). [DOI] [PMC free article] [PubMed] [Google Scholar]
- 13.Shimoda M et al. Loss of the Timp gene family is sufficient for the acquisition of the CAF-like cell state. Nat Cell Biol 16, 889–901, doi: 10.1038/ncb3021 (2014). [DOI] [PubMed] [Google Scholar]
- 14.Ejlerskov P et al. Tubulin Polymerization-promoting Protein (TPPP/p25α) Promotes Unconventional Secretion of α-Synuclein through Exophagy by Impairing Autophagosome-Lysosome Fusion. 288, 17313–17335, doi: 10.1074/jbc.M112.401174 (2013). [DOI] [PMC free article] [PubMed] [Google Scholar]
- 15.Guo H et al. Atg5 Disassociates the V1V0-ATPase to Promote Exosome Production and Tumor Metastasis Independent of Canonical Macroautophagy. Dev Cell 43, 716–730 e717, doi: 10.1016/j.devcel.2017.11.018 (2017). [DOI] [PubMed] [Google Scholar]
- 16.Miao Y, Li G, Zhang X, Xu H & Abraham SN A TRP Channel Senses Lysosome Neutralization by Pathogens to Trigger Their Expulsion. Cell 161, 1306–1319, doi: 10.1016/j.cell.2015.05.009 (2015). [DOI] [PMC free article] [PubMed] [Google Scholar]
- 17.Itakura E, Kishi-Itakura C & Mizushima N The hairpin-type tail-anchored SNARE syntaxin 17 targets to autophagosomes for fusion with endosomes/lysosomes. Cell 151, 1256–1269, doi: 10.1016/j.cell.2012.11.001 (2012). [DOI] [PubMed] [Google Scholar]
- 18.Kimura T et al. Dedicated SNAREs and specialized TRIM cargo receptors mediate secretory autophagy. Embo j 36, 42–60, doi: 10.15252/embj.201695081 (2017). [DOI] [PMC free article] [PubMed] [Google Scholar]
- 19.Trajkovic K et al. Ceramide triggers budding of exosome vesicles into multivesicular endosomes. Science 319, 1244–1247, doi: 10.1126/science.1153124 (2008). [DOI] [PubMed] [Google Scholar]
- 20.Cho YE et al. Increased liver-specific proteins in circulating extracellular vesicles as potential biomarkers for drug- and alcohol-induced liver injury. PLoS One 12, e0172463, doi: 10.1371/journal.pone.0172463 (2017). [DOI] [PMC free article] [PubMed] [Google Scholar]
- 21.Alonzo Iii F et al. CCR5 is a receptor for Staphylococcus aureus leukotoxin ED. Nature 493, 51, doi:10.1038/nature1172410.1038/nature11724https://www.nature.com/articles/nature11724#supplementary-informationhttps://www.nature.com/articles/nature11724#supplementary-information (2012). [DOI] [PMC free article] [PubMed] [Google Scholar]
- 22.Mitamura T, Higashiyama S, Taniguchi N, Klagsbrun M & Mekada E Diphtheria toxin binds to the epidermal growth factor (EGF)-like domain of human heparin-binding EGF-like growth factor/diphtheria toxin receptor and inhibits specifically its mitogenic activity. J Biol Chem 270, 1015–1019, doi: 10.1074/jbc.270.3.1015 (1995). [DOI] [PubMed] [Google Scholar]
- 23.Montecalvo A et al. Mechanism of transfer of functional microRNAs between mouse dendritic cells via exosomes. Blood 119, 756–766, doi: 10.1182/blood-2011-02-338004 (2012). [DOI] [PMC free article] [PubMed] [Google Scholar]
- 24.Kalluri R The biology and function of exosomes in cancer. The Journal of Clinical Investigation 126, 1208–1215, doi: 10.1172/JCI81135 (2016). [DOI] [PMC free article] [PubMed] [Google Scholar]
- 25.Henry BD et al. Engineered liposomes sequester bacterial exotoxins and protect from severe invasive infections in mice. Nat Biotechnol 33, 81–88, doi: 10.1038/nbt.3037 (2015). [DOI] [PubMed] [Google Scholar]
- 26.Tan JMJ et al. An ATG16L1-dependent pathway promotes plasma membrane repair and limits Listeria monocytogenes cell-to-cell spread. Nature Microbiology 3, 1472–1485, doi: 10.1038/s41564-018-0293-5 (2018). [DOI] [PubMed] [Google Scholar]
- 27.Matsuzawa-Ishimoto Y et al. Autophagy protein ATG16L1 prevents necroptosis in the intestinal epithelium. J Exp Med, doi: 10.1084/jem.20170558 (2017). [DOI] [PMC free article] [PubMed] [Google Scholar]
- 28.Murrow L, Malhotra R & Debnath J ATG12-ATG3 interacts with Alix to promote basal autophagic flux and late endosome function. Nat Cell Biol 17, 300–310, doi: 10.1038/ncb3112 (2015). [DOI] [PMC free article] [PubMed] [Google Scholar]
- 29.Guo H et al. Atg5 Disassociates the V1V0-ATPase to Promote Exosome Production and Tumor Metastasis Independent of Canonical Macroautophagy. Dev Cell 43, 716–730.e717, doi: 10.1016/j.devcel.2017.11.018 (2017). [DOI] [PubMed] [Google Scholar]
- 30.Hubbard-Lucey VM et al. Autophagy gene atg16l1 prevents lethal T cell alloreactivity mediated by dendritic cells. Immunity 41, 579–591, doi: 10.1016/j.immuni.2014.09.011 (2014). [DOI] [PMC free article] [PubMed] [Google Scholar]
- 31.Marchiando AM et al. A deficiency in the autophagy gene Atg16L1 enhances resistance to enteric bacterial infection. Cell Host Microbe 14, 216–224, doi: 10.1016/j.chom.2013.07.013 (2013). [DOI] [PMC free article] [PubMed] [Google Scholar]
- 32.DuMont AL et al. Staphylococcus aureus LukAB cytotoxin kills human neutrophils by targeting the CD11b subunit of the integrin Mac-1. 110, 10794–10799, doi: 10.1073/pnas.1305121110 %J Proceedings of the National Academy of Sciences (2013). [DOI] [PMC free article] [PubMed] [Google Scholar]
- 33.van der Vlist EJ, Nolte-’t Hoen EN, Stoorvogel W, Arkesteijn GJ & Wauben MH Fluorescent labeling of nano-sized vesicles released by cells and subsequent quantitative and qualitative analysis by high-resolution flow cytometry. Nat Protoc 7, 1311–1326, doi: 10.1038/nprot.2012.065 (2012). [DOI] [PubMed] [Google Scholar]
- 34.Théry C, Amigorena S, Raposo G & Clayton A Isolation and Characterization of Exosomes from Cell Culture Supernatants and Biological Fluids. 30, 3.22.21–23.22.29, doi:doi: 10.1002/0471143030.cb0322s30 (2006). [DOI] [PubMed] [Google Scholar]
Associated Data
This section collects any data citations, data availability statements, or supplementary materials included in this article.
Supplementary Materials
Data Availability Statement
The data sets generated during this study are available from the corresponding authors upon request. Western blot gel source data can be found in Supplementary Fig. 1. All identified proteins from mass spectrometry experiments and thier Accession IDs are listed in Supplementary Tables 1–3.