Abstract
We recently proposed a dual-slope technique for diffuse optical spectroscopy and imaging of scattering media. This technique requires a special configuration of light sources and optical detectors to create dual-slope sets. Here, we present methods for designing, optimizing, and building an optical imaging array that features m dual-slope sets to image n voxels. After defining the m × n matrix () that describes the sensitivity of the m dual-slope measurements to absorption perturbations in each of the n voxels, we formulate the inverse imaging problem in terms of the Moore–Penrose pseudoinverse matrix of (). This approach allows us to introduce several measures of imaging performance: reconstruction accuracy (correct spatial mapping), crosstalk (incorrect spatial mapping), resolution (point spread function), and localization (offset between actual and reconstructed point perturbations). Furthermore, by considering the singular value decomposition formulation, we show the significance of visualizing the first m right singular vectors of , whose linear combination generates the reconstructed map. We also describe methods to build a physical array using a three-layer mesh structure (two polyethylene films and polypropylene hook-and-loop fabric) embedded in silicone (PDMS). Finally, we apply these methods to design two arrays and choose one to construct. The chosen array consists of 16 illumination fibers, 10 detection fibers, and 27 dual-slope sets for dual-slope imaging optimized for the size of field of view and localization of absorption perturbations. This particular array is aimed at functional near-infrared spectroscopy of the human brain, but the methods presented here are of general applicability to a variety of devices and imaging scenarios.
I. INTRODUCTION
In the field of diffuse optics, the propagation of photons traversing a highly scattering medium is studied. The optical quantities of interest are the absorption coefficient related to the probability of photon absorption and the reduced scattering coefficient related to the probability of effective isotropic scattering. A common diffuse optics technique used in the study of biological tissue is Near-InfraRed Spectroscopy (NIRS), named such since it focuses on photons in the wavelength range of ∼600 nm to ∼1000 nm. This range typically corresponds to a much lower absorption coefficient than the reduced scattering coefficient in biological tissues, which are the targets of NIRS.
NIRS can be implemented in three different domains characterized by different temporal profiles of the incident light and optical detection methods. In each domain, light is delivered into a diffuse medium and detected after it has propagated through the medium, typically 10 mm–40 mm from the source. The simplest domain is Continuous Wave (CW)-NIRS where the temporal signal of the injected light is a constant intensity value.1 In CW-NIRS, one can typically only measure changes in optical properties from a baseline or reference condition. The most information-rich domain is Time-Domain (TD)-NIRS in which a pulse of light on the order of picoseconds in duration is delivered to the medium, and the optical signal is detected as the photon time-of-flight distribution.2 Finally, Frequency-Domain (FD)-NIRS lies somewhere in between CW-NIRS and TD-NIRS information-wise. In FD-NIRS, the source intensity is modulated sinusoidally at a frequency on the order of 100 MHz and the amplitude and phase of the optical signal are detected.3 In this article, we will focus on the use of FD-NIRS.
A common implementation of NIRS is in the reflectance mode, in which the scattering medium is often modeled by a semi-infinite geometry. NIRS is a common technique in the field of biomedical optics where the medium in question is biological tissue. FD-NIRS or TD-NIRS can be used to measure absolute optical properties of tissue.4 In this case, the reduced scattering coefficient provides morphological information (i.e., size scale of scatterers) and the absorption coefficient provides biochemical information (i.e., concentration of chromophores). The most sought-after optical property is absorption since it can be converted into absorber concentrations (oxyhemoglobin, deoxyhemoglobin, water, melanin, lipids, etc.) within the tissue. The change in the absorption coefficient is a quantity of interest, which can be obtained in all three domains. It provides information about chromophore dynamics within the tissue. Examples of NIRS applications include the skeletal muscle5 to measure blood flow or oxygen consumption, breast tissue6 to detect breast cancer, and brain7 for the assessment of cerebral hemodynamics. In the case of brain, NIRS can be used to provide functional (fNIRS) information regarding brain activation or diagnostic information regarding cerebral blood flow or autoregulation.
Each of these measurement modalities can be implemented for point measurements (focusing on one location of the target tissue) or for imaging using an array of sources and detectors (providing information on a large area of the target tissue). The advantage of imaging is to provide spatial information about the quantity of interest. This technique is described as Diffuse Optical Imaging (DOI) since the purpose is to provide images of optical properties, whether absolute values or relative changes. DOI has been implemented on the brain using many measurements between a single source and a single detector [Single-Distance (SD)].8 DOI is often implemented in CW-NIRS1 but has also been shown to benefit from the extra information provided by FD-NIRS.9
A common question when designing a DOI experiment is what geometry to use for the arrangement of sources and detectors. Many experiments have been done by placing optical sources according to the 10–20 system (or similar) commonly used in ElectroEncephaloGram (EEG) experiments.10–12 However, work has also been done designing optode arrays specifically for DOI. For example, previous work includes comparing different array configurations,13,14 optimizing or assessing array designs,12,15,16 realizing an automated or guided array design for specific brain regions,10,11,17–20 tessellation of optode modules to produce an array,21 designing for wearables,22,23 and studying how an array acts in regard to simulated perturbations.24,25 Additionally, some overviews and reviews of fNIRS arrays and array design have been published.26–28 All these methods have provided the community with various ways to design and position arrays for functional experiments, as well as presenting a plethora of differing array designs.
The field of DOI of tissue, especially in non-invasive applications to the human brain, continues to struggle with optical measurements dominated by superficial perturbations.29–31 In fact, the desired signal in fNIRS comes from the brain (deep) but is contaminated by contributions from superficial hemodynamics.32 Recently, we developed an approach with the goal of suppressing the superficial signal and providing a signal dominated by deep perturbations. This approach, named Dual-Slope (DS)33 for its use of an average of two paired slopes of the optical signal vs source–detector distance, was inspired by the geometry described in the self-calibrating approach for absolute FD-NIRS measurements.34 The DS method inherited practical advantages of the self-calibrating approach, namely, an insensitivity to signal drifts of instrumental origin and an ability to make absolute measurements without any calibration, but focuses on measuring localized changes in optical absorption. DS experiments on the brain have been shown to reinforce the idea of deep signal dominance when compared to data collected using more traditional NIRS SD methods.35
This article describes the design of a DOI array for use specifically with DS data. No such array has yet been designed for use on human subjects aiming at fNIRS measurements. In fact, previously referenced arrays were not designed with DS as a consideration. The purpose of the content herein is to provide methods to design and evaluate a DS-based imaging array so that the reader may create one themselves. This provides the framework for a whole family of DS imaging arrays. After laying out these methods, we then describe two specific arrays that we designed and the one we built using the methods described. The concepts and methods described in this article will allow researchers to design and construct the DS-based imaging array for their own applications. In doing so, a novel set of arrays can be created focused on DS data, which has not been done in the past.
This article is structured as follows. First, we describe the theoretical background related to DS data collection and image reconstruction (Sec. II). Then, we describe methods to design a source–detector arrangement for DS imaging (Sec. III A 1) and to evaluate that arrangement (Sec. III A 2). Next, we describe the design methodology for a fiber-based DS imaging array (Sec. III B 1) and how such an array may be constructed (Sec. III B 2). Finally, we describe the two specific arrangements (Sec. IV A) and a final optical array (Sec. IV B) that we designed. We conclude with discussions of DS imaging applications and areas of improvement (Sec. V).
II. BACKGROUND
A. Dual-slope (DS) method
The Dual-Slope (DS) method was recently developed for Near-InfraRed Spectroscopy (NIRS). Results involving a single DS set have been published in Frequency-Domain (FD)-NIRS35–37 and Time-Domain (TD)-NIRS.38 Additionally, the first attempt at imaging using DS in phantoms has also been presented.24,33
DS relies on the averaging of two measurements of slope. In FD-NIRS, the phase () or the intensity (I) of the detected light signal can be measured using one source and one detector; this is dubbed Single-Distance (SD). Using data at multiple source–detector distances (ρ), the slopes of linear functions of intensity and phase [to the first approximation, and in a semi-infinite geometry] vs ρ can be measured. These slope measurements can be achieved with either a single detector and multiple sources or multiple detectors and a single source. Both cases are referred to as Single-Slope (SS) measurements. In this work, we assume that each SS is only made of two SD measurements for simplicity; however, in general, one may consider SS measurements using more than two SDs. A DS measurement is achieved by averaging two SSs under the following requirements37 (the following description assumes each SS is made of one source and two detectors for simplicity): (1) a DS set is made of two SSs (SS1 and SS2); (2) the difference between the source–detector distances for both SSs must be the same (); and (3) the detector for the shorter SD measurement in SS1 must be the same detector for the longer SD measurement in SS2.
The SS measurements of the slope of vs ρ (SSI) or ϕ vs ρ (SSϕ) can be measured as the change from some baseline value (∆SSI or ∆SSϕ). This is done since the goal of the measurements is not reconstruction of absolute optical properties, but instead measurements of changes in absorption from a baseline value. Conversion of these changes in slope into absorption changes is done by introducing a Differential Slope Factor (DSF), which can be calculated using absolute optical properties or generalized optical pathlengths.35 The measured absorption changes associated with DS measurements () are expressed as the average of the absorption changes obtained from each SS measurement that makes up the DS set (here, we indicate I or ϕ with the general datatype Y for brevity),
| (1) |
where the DSF depends on the datatype (Y) and the SS set (1 or 2).
When designing DS sets or a full array of DS measurements, the above requirements must be met. In addition to these requirements, there are also two practical constraints37 (based on typical NIRS instrumental limits): (1) all source–detector distances should be between 20 mm and 40 mm (the low end limited to achieve preferentially deep sensitivity and the upper limit limited by detector noise or source power) and (2) the difference between the source–detector distances for the SSs should be between 10 mm and 20 mm (the low end limited by measurement noise and the upper limit due to the detector dynamic range).
The challenge in designing a DS imaging array primarily lies in meeting all these requirements and constraints. This must be done while still achieving as many DS sets as possible (given a limited number of sources and detectors) and overlapping the sensitivities of DS sets as much as possible.
B. Sensitivity maps
Theoretical investigation of the Dual-Slope (DS) method started with the examination and comparison of the sensitivity maps of Single-Distance (SD), Single-Slope (SS), and DS data.35–37 These sensitivity maps are computed using the concept of generalized optical pathlength.39 These pathlengths are found analytically using the assumed or known absolute optical properties of the medium. Each datatype [intensity, I, and phase, ϕ, in the Frequency-Domain (FD)] has its own generalized pathlength associated with it. Here, we will again denote the datatype with the letter Y that can indicate either I or ϕ. The sensitivity of a given DS set i to the voxel j [] can be written as the average of the SS sensitivities that make up the DS set i [ and ],
| (2) |
On the right-hand side of Eq. (2), we have expressed the DS sensitivity as the ratio of the measured absorption change by the DS set i () to the actual absorption change in the voxel j ().36 The measured absorption change is the effective absorption change that is measured if the actual change in a datatype would be caused by a homogeneous change in the absorption coefficient. The SS sensitivities are expressed in terms of the generalized pathlengths (we again assume only two SD measurements in a SS set, at distances and ),
| (3) |
where is the partial pathlength for the datatype Y at the distance in the SS set k that is part of the DS set i that goes through the voxel j centered at and is the total pathlength for the datatype Y at the distance in the SS set k that is part of the DS set i.
Using these formulations, the sensitivity regions for DS sets can be found analytically for any medium for which the generalized pathlengths are known (they can be found using the complex fluence and reflectance functions).36,39 We have reported these sensitivity maps for data collected with various types of DS sets.37 In this work, we will assume a semi-infinite homogeneous medium with extrapolated boundary conditions for our calculation of sensitivities. As such, the optical parameters associated with the sensitivity maps will be the baseline absorption coefficient (μa0) and reduced scattering coefficient ().
C. Image reconstruction
The sensitivity maps for each Dual-Slope (DS) set within an array easily lend themselves to linear image reconstruction methods. We consider the following forward problem as the basis of our linear reconstruction, which is an extension of Eq. (2) for many voxels j and measurements i:
| (4a) |
| (4b) |
| (4c) |
| (4d) |
where is the m × 1 vector of DS absorption measurements, is the n × 1 vector of voxel absorption changes, and S is the m × n matrix of sensitivities. Note that the sensitivity matrix is highly non-square (having many more columns than rows) since there are typically many more voxels than measurements (m ≪ n).
In this work, we consider a linear image reconstruction using the Moore–Penrose pseudoinverse of , which has been used previously in diffuse optical tomography.9,14,30,31 We note that the linear problem could be considered one step in a non-linear reconstruction. The linear inverse problem is formulated as
| (5) |
where is the n × 1 vector of reconstructed voxel absorption changes and is the n × m Moore–Penrose pseudoinverse of .
The Moore–Penrose pseudoinverse can be formulated in various ways and may or may not include Tikhonov regularization, which aids in smoothing noise in the measurement. The typical matrix formulation of the Moore–Penrose pseudoinverse with Tikhonov regularization is as follows:9
| (6a) |
| (6b) |
where α is the Tikhonov regularization parameter that scales with the maximum singular value of and a is a tunable parameter that should be chosen based on the noise in the measurement to optimize signal-to-noise against smoothing in the reconstructed image. The Moore–Penrose pseudoinverse can also be formulated in terms of the Singular Value Decomposition (SVD) of ,
| (7a) |
| (7b) |
where U is the m × m matrix of left singular vectors of , is the n × n matrix of right singular vectors of , and is the diagonal m × n matrix of m singular values () of . Using the SVD of , the Moore–Penrose pseudoinverse without Tikhonov regularization is formulated as follows:40
| (8a) |
| (8b) |
where the inverse of the singular value matrix () of size has a trivial solution using the inverse of the singular values (). Here, we note possible instability in the calculation of the Moore–Penrose pseudoinverse if there are singular values that are close to zero.
Depending on the application and need, either formulation of the Moore–Penrose pseudoinverse may be helpful. In the scope of this work, we use both to examine and understand characteristics of the sensitivity matrix for a given optical array and understand how the image reconstruction will behave. We utilize this understanding to inform the imaging array design process.
III. METHODS AND DESIGN
A. Source–detector arrangement
1. Arrangement design
a. Dual-slope (DS) set discovery.
To design a Dual-Slope (DS) imaging arrangement, we start with a pen and paper design of a configuration that is suitable to create many DS sets. Then, we use a DS set discovery algorithm that takes the source and detector coordinates as inputs. The algorithm finds all the possible DS sets that meet the requirements and considerations (Sec. II A).
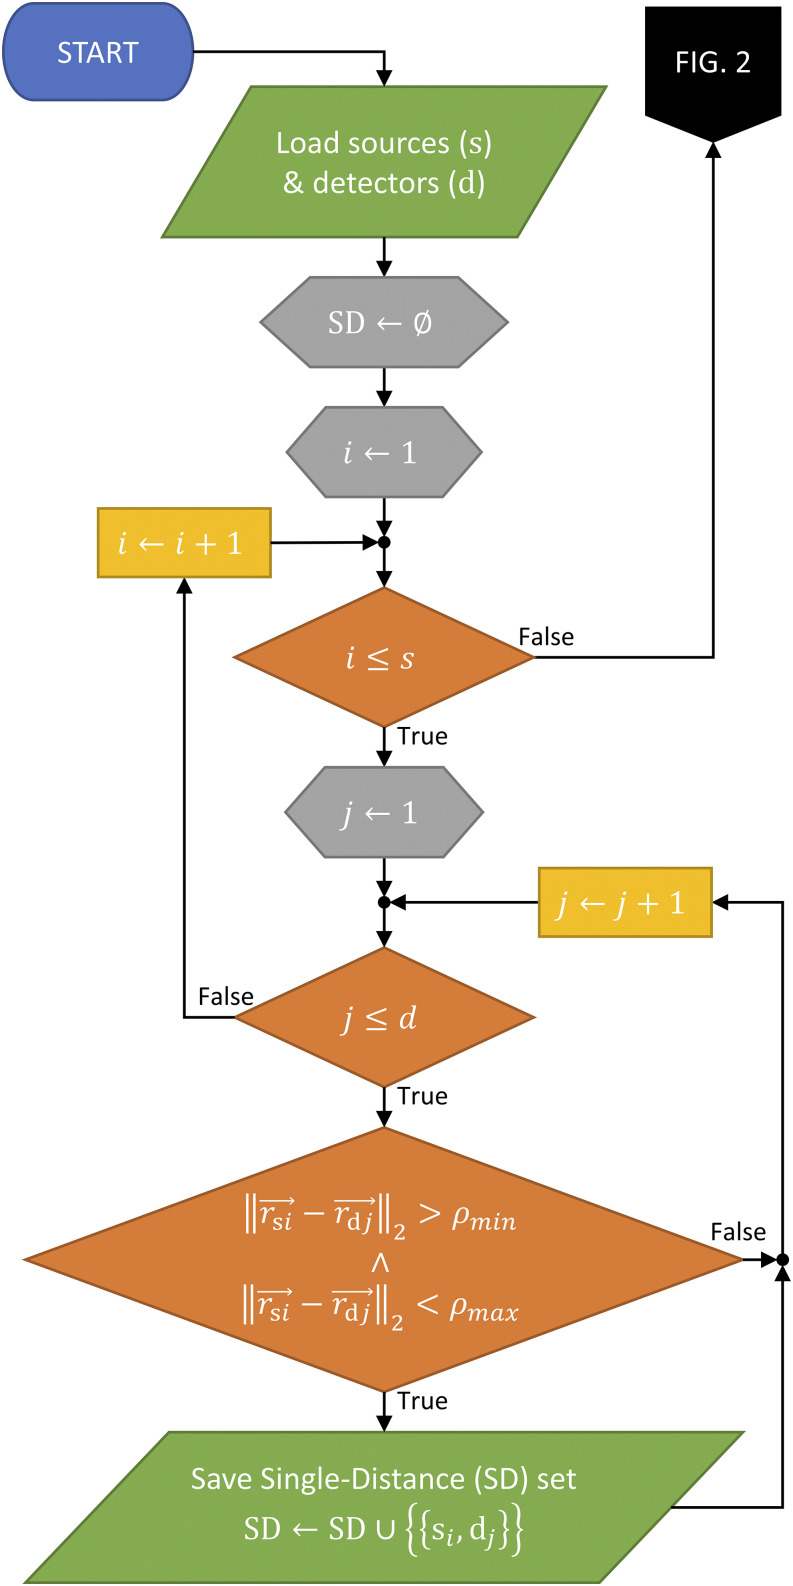
The algorithm starts by finding all the possible Single-Distance (SD) sets within the arrangement (Fig. 1), which is trivial given that s sources and d detectors result in s × d possible SD sets. However, the algorithm then eliminates any SD sets that do not meet the minimum and maximum distance constraints [20 mm and 40 mm, respectively; constraint (1) in Sec. II A]. This results in all SD measurements that meet the distance requirements within the arrangement (and their number mSD).
FIG. 1.
Flowchart showing the Single-Distance (SD) discovery part of the full Dual-Slope (DS) discovery algorithm, showing one required check.
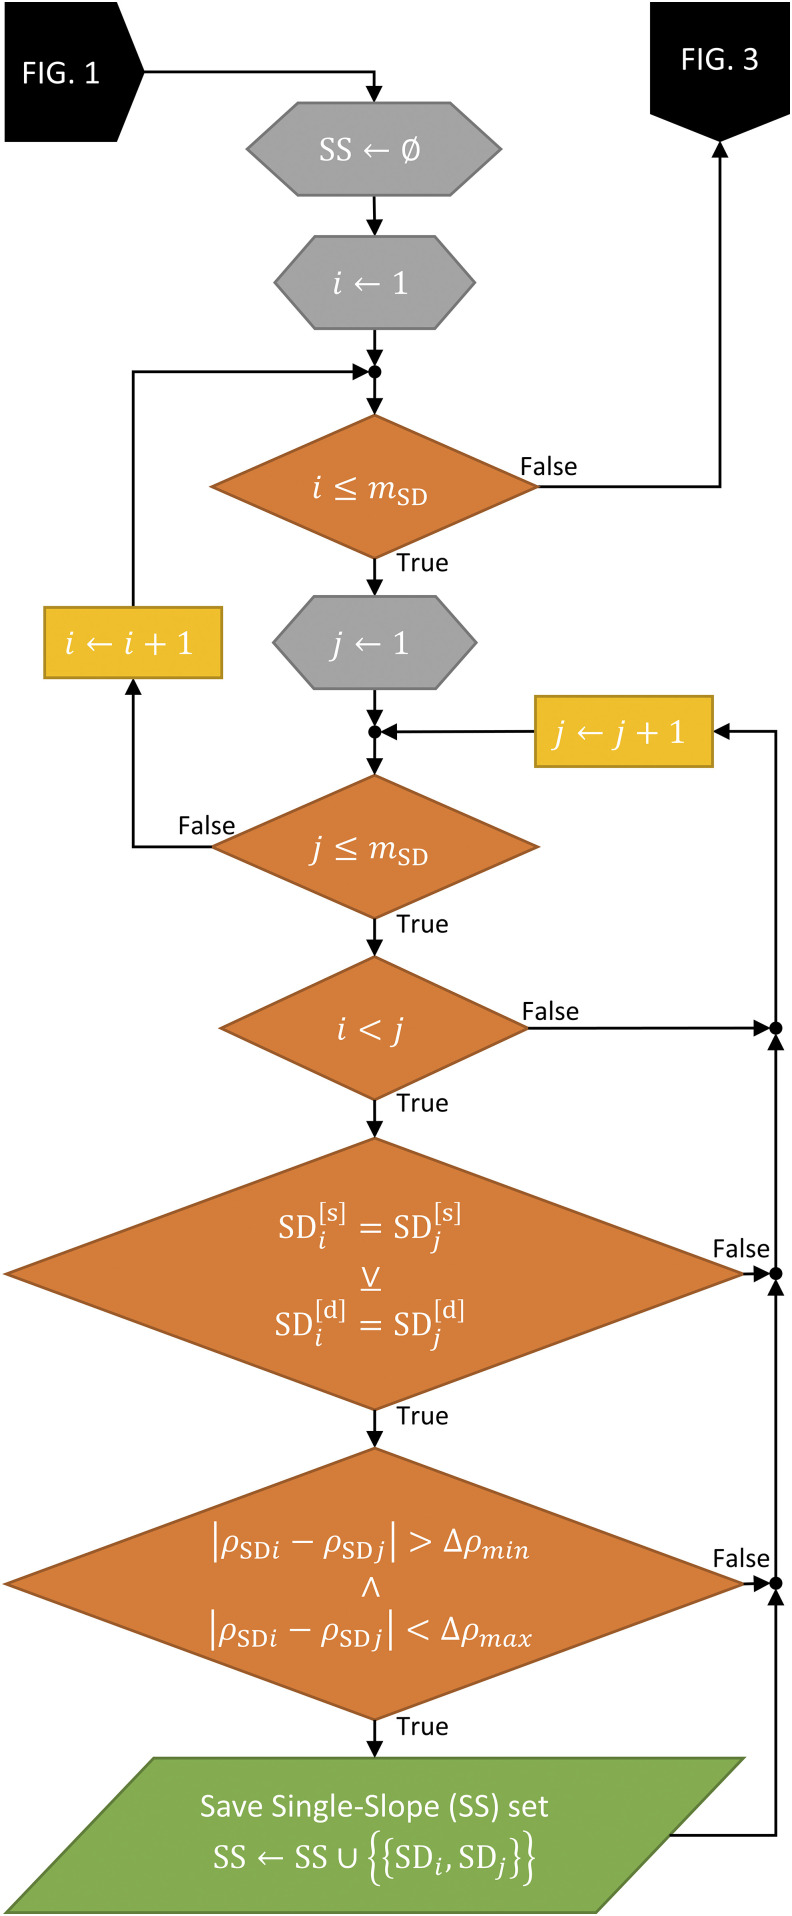
Then, the algorithm moves on to find all the possible Single-Slope (SS) sets (Fig. 2). This is done by looping through every combination of two SD sets [mSD × (mSD − 1)/2 combinations]. For each possible combination of two SD sets, two conditions are imposed to realize a suitable SS set: (1) An exclusive or (xor) that the sources xor the detectors are the same for the two SD sets (i.e., the SD sets share a source or a detector but not both) and (2) the difference between the source-detector distances of the two SD sets lies within a range set by minimum and maximum acceptable values [10 mm and 20 mm, respectively; constraint (2) in Sec. II A]. This step results in all the possible SS measurements in the arrangement (and their number mSS).
FIG. 2.
Flowchart showing the Single-Slope (SS) discovery part of the full Dual-Slope (DS) discovery algorithm, showing two required checks.
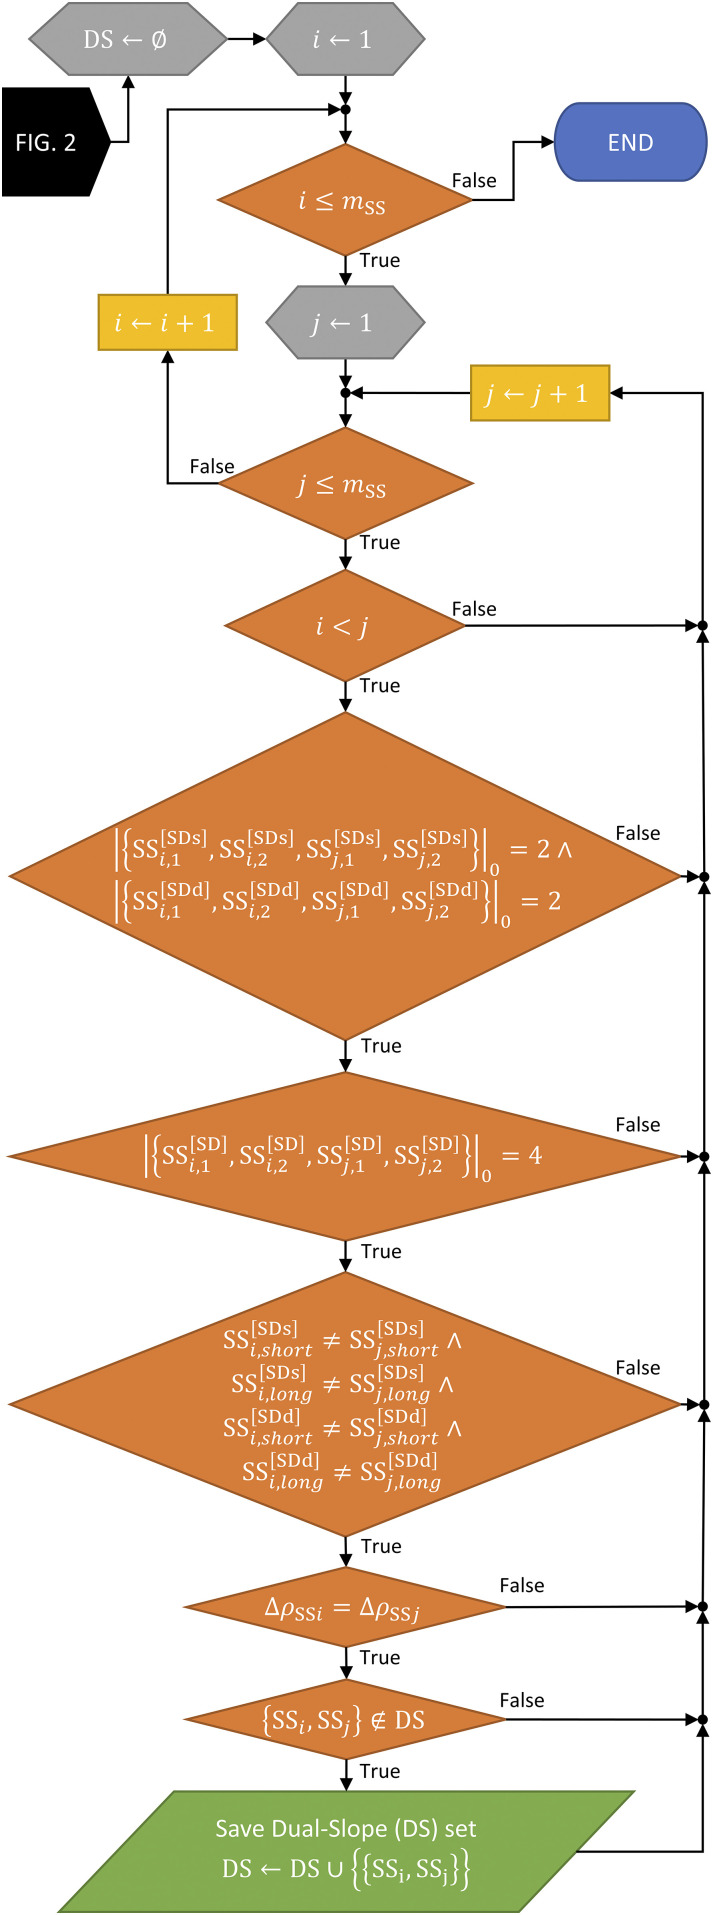
Finally, the algorithm finds all the possible DS sets within the arrangement (Fig. 3). Again, a loop is entered that loops through all combinations, this time of SS sets [mSS × (mSS − 1)/2 combinations]. For each SS combination, five checks are done to ensure that the two SS sets form a new DS set: (1) between the two SS sets, there are exactly two unique sources and two unique detectors; (2) between the two SS sets (four SD sets), there are no repeated source–detector pairs (i.e., there are four unique SD sets); (3) between the two SS sets, the sources/detectors that make up the shorter/longer SD measurement are not the same (i.e., no source or detector is used for the long or the short measurement more than once); (4) the difference between the SD measurements for each SS set that comprises the DS set is the same; and (5) the DS set found at each iteration is new and has not already been found in a previous iteration. Checks (1) and (2) ensure the first DS requirement, check (3) ensures the third requirement, and check (4) ensures the second requirement (Sec. II A). The result of the algorithm is to identify all possible DS sets in the arrangement (and their number mDS = m).
FIG. 3.
Flowchart showing the Dual-Slope (DS) discovery part of the full DS discovery algorithm, showing five required checks.
The realization of this algorithm allows for the automatic discovery of DS sets from any list of source and detector coordinates. The various checks ensure the DS requirements are met and there are tunable parameters that allow the constraints to be changed (minimum source–detector distance, etc.). The algorithm has a run time of ∼200 ms (for 10 detectors and 16 sources) on Microsoft Surface Pro 2017 (Redmond, WA, USA) running an Intel Core i5-7300U (Santa Clara, CA, USA) Central Processing Unit (CPU) at 2.6 GHz with 8 GB of Random Access Memory (RAM). Furthermore, it can be used to iteratively refine the position of the sources and detectors by rearranging them (using different starting points) or applying position refinement (Sec. III A 1 b) and finding the new possible DS sets over multiple iterations.
b. Position refinement.
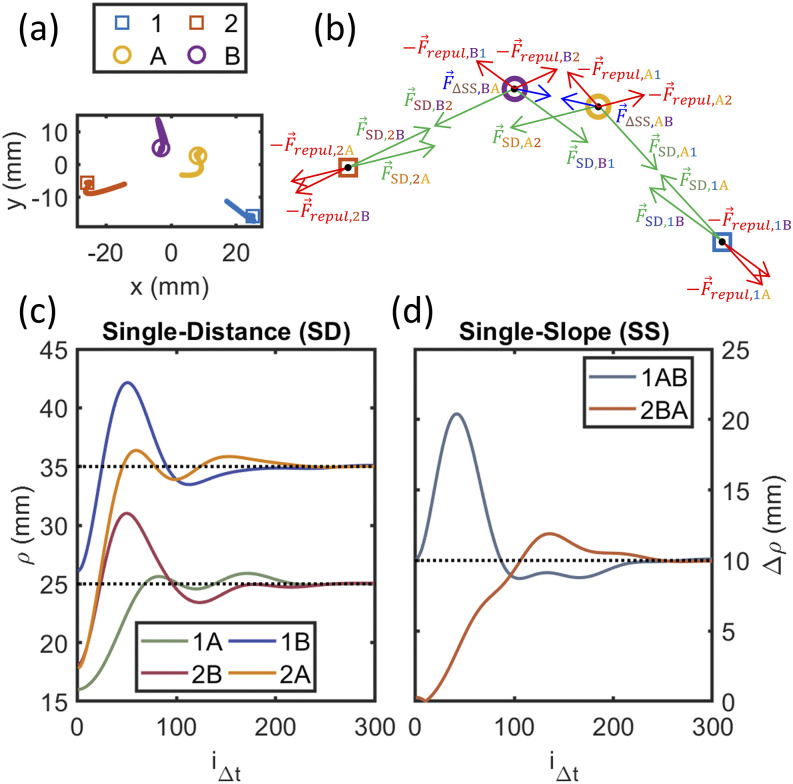
Once all the Dual-Slope (DS) sets for an arrangement have been identified, the exact positions of the sources and detectors are refined. This is done by introducing forces between array elements acting such that desired parameters of the DS sets are met. The dynamical system is then allowed to reach equilibrium through Euler’s method for solving a system of ordinary differential equations, and the new coordinates of the sources and detectors are saved (Fig. 4). Such a system can also be used to find valid source–detector arrangements that meet the DS requirements from random starting positions of the sources and detectors.
FIG. 4.
Example position refinement for one Dual-Slope (DS) set. (a) Evolution of the positions of sources (1 and 2) and detectors (A and B) after random start positions, showing their trajectories as lines and final positions as symbols. (b) Free body diagram of all forces acting on sources and detectors. (c) Evolution of the four Single-Distance (SD) source–detector distances. (d) Evolution of the two Single-Slope (SS) source–detector distances’ difference.
Four parameters control the final positions in the system: the nominal source–detector distance for the short leg of a Single-Slope (SS) set (ρ0s), the nominal distance for the long leg (ρ0l), the nominal difference between source–detector distances in a SS set (∆ρ0), and the minimum source–detector separation (ρmin). The final arrangement will have DS sets with distances as close to their nominal values as possible given the overall connections between the elements of the arrangement, and the minimum separation ensures no detector will be saturated by a close source. Other than the four parameters above, another five parameters control the dynamics of the simulation and how the equilibrium is reached: the element mass (), the spring constant { [mass/time2 (or force/length)]}, the damping ratio (ζ), the repulsion coefficient {ξ [mass × length2/time2 (or energy)]}, and the time step (∆t). The damping ratio controls the damping coefficient ( [mass/time]) and is set to slightly below 1 to cause a slight underdamping, thus allowing the system to converge.
The above parameters are used to control four forces that act upon each source and detector, which are combined using Newton’s second law of motion [Fig. 4(b)],
| (9) |
where is the acceleration vector for a given element, is the Single-Distance (SD) force, is the SS difference in source–detector distance forces, is the repulsion force, and is the damping force. We note that the key force in this method encouraging the creation of DS sets is , which, when applied to symmetric SSs, causes the arrangement to converge to a valid DS arrangement. The use of this force in this way makes this method novel and specific to DS.
The SD force causes sources and detectors to be attracted to positions that will make the source–detector distance close to the nominal values (ρ0s or ρ0l),
| (10) |
where is the Euclidean distance between the element considered and its pair, is the unit vector pointing from the element to its pair, and ρ0 is the nominal distance between the elements (ρ0s or ρ0l, depending on whether the SD pair is the short or long distance pair in a SS set).
The SS difference in forces causes SS sets to be attracted to configurations that have a difference in the source–detector distances close to the nominal value (∆ρ0),
| (11) |
where and are the Euclidean source–detector distances for the two SD pairs and is the unit vector pointing from the element considered to the element of the SS set of the same type. For example, for a common source SS set that contains one source and two detectors (A and B), there will be pointing from A to B, which controls the force that acts upon A, and vice versa for B. Thus, each SS set creates two forces that act on the non-common element types in the set. Additionally, if two SS sets form a DS set, the symmetric nature of the requirements creates resulting SS differences in forces that encourage the DS requirements to be met.
The repulsive force pushes sources and detectors apart such that detectors will not become saturated by near sources. The force only activates if sources and detectors get closer than the minimum distance (ρmin),
| (12) |
where is the Euclidean distance between the element and its repulsor, H is the Heaviside step function, and is the unit vector pointing from the element to its repulsor.
Finally, the damping force creates non-conservation friction within the system, allowing for convergence,
| (13) |
where is the velocity vector. Euler’s method with a step of is used to iteratively solve Eq. (9), finding the position of each source and detector () at each time step. When the system converges to equilibrium, the new positions of the arrangement elements are saved, and the arrangement is optimized for the desired nominal distances. Furthermore, the DS set discovery algorithm may be run again in the case of iterative design.
2. Arrangement evaluation methods
a. Examination of .
With various arrangements produced using the design methods (Sec. III A 1), we need a way to specify the performance of different arrangements to choose the most effective one for imaging. This is done by examining the imaging system in terms of the Moore–Penrose pseudoinverse for image reconstruction. The following discussions assume no regularization. Substituting Eq. (4) into Eq. (5) yields
| (14) |
where the matrix is the key operator that transforms the actual absorption perturbation vector into the reconstructed one. In the ideal case where the matrix is the identity matrix, the image reconstruction would be perfect. This requires the pseudoinverse to be equal to the true inverse, which implies that is a square matrix (i.e., , the same number of voxels as measurements). This can be achieved by choosing a medium voxelization with only voxels and reconstructing equivalent absorption changes for those large voxels. However, this would require uniform absorption properties across such large voxels and the use of a sensitivity matrix that reflects the size of such large voxels. Furthermore, the goal of imaging is to reconstruct maps of absorption perturbations with a fine voxel grade to represent arbitrary shapes of optical perturbations. Thus, we will focus on cases where , and we will examine ways to specify how close is to the identity matrix.
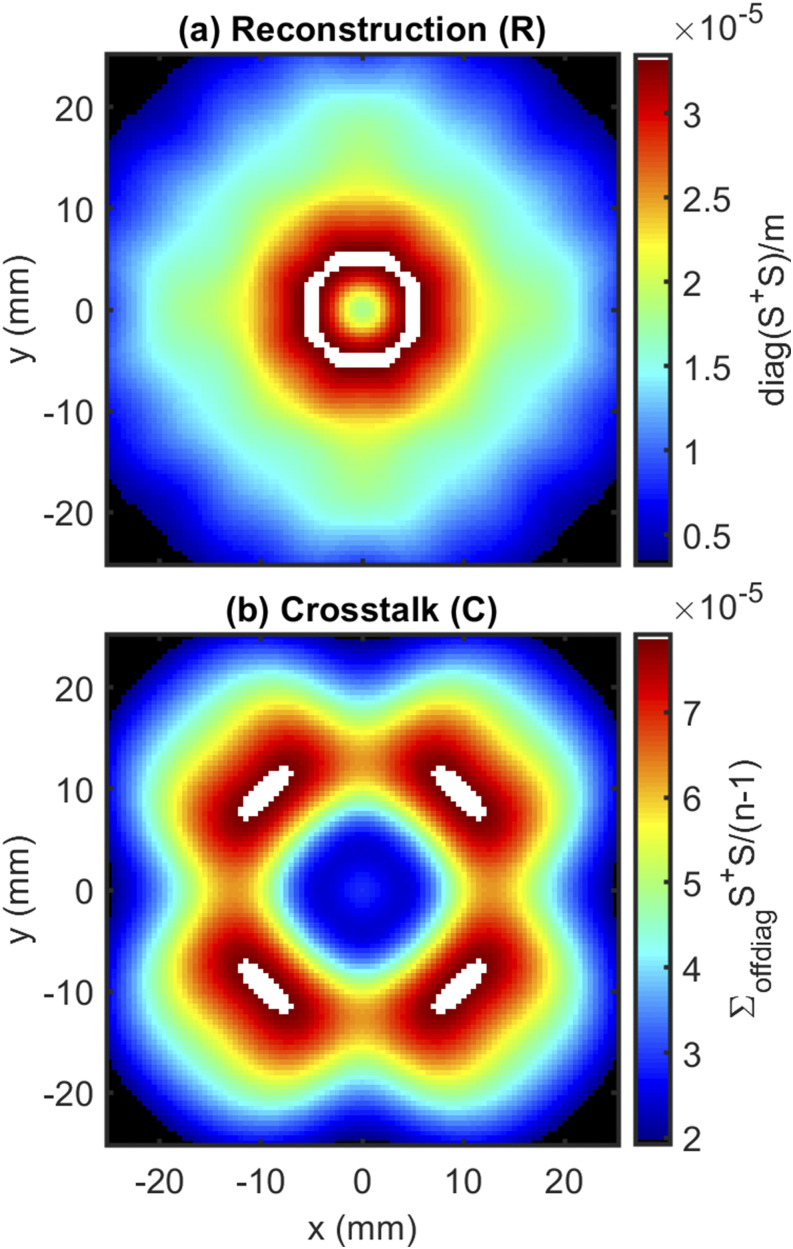
The first method we use to examine is by producing the reconstruction () vector, which can be visualized in a voxelated map. This vector is defined as
| (15) |
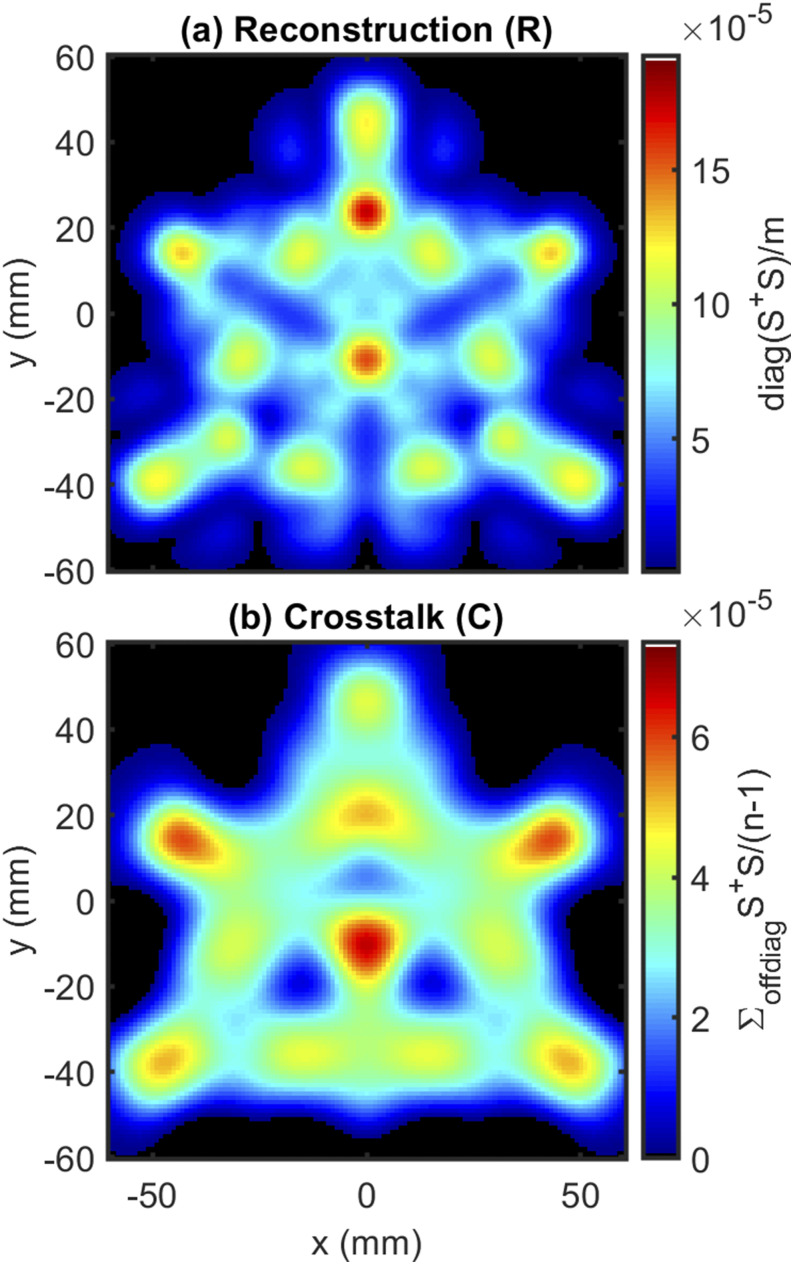
where the diagonal elements of are normalized by since the trace of is equal to . This normalizes such that the sum of its elements is equal to one. The reconstruction map (made of the n values of the reconstruction vector elements for the n voxels) shows the weight with which the imaging system reconstructs an actual perturbation into its true voxel (higher values are better). In the ideal case, the vector’s elements would be all one. Visualizing the reconstruction map shows which parts of the medium will reconstruct perturbations well.
The second map that is used to visualize compared to the identity is the crosstalk () vector. This vector is defined as
| (16) |
where is the vector of one. Conceptually, the elements of the crosstalk vector are the average of the off-diagonal elements of for each row. The n values of the crosstalk vector elements indicate the average weight with which actual perturbations elsewhere in the medium are reconstructed to a given voxel (lower values are better). In the ideal case, would be a vector of zeros. When visualized as a map, it shows where the imaging system will reconstruct actual perturbations in the incorrect voxel.
Aside from the reconstruction and crosstalk vectors, there are also scalar values that can be used to evaluate the imaging effectiveness of . One value is the condition number of , which represents the instability of the imaging system. The condition number () is defined as
| (17) |
where smaller is better.40 Here, we use the -norm for our discussion, but the condition number can be defined as any norm that is desired. For comparison, in the best case of Gaussian random sampling, . However, in the worst case of a singular , .
The above two maps and one scalar method for evaluating the imaging performance of an optical arrangement of sources and detectors are inspired by the mathematics of image reconstruction, focusing on the stability of the imaging system and closeness to the identity. In Sec. III A 2 b, we examine the imaging system in terms of common imaging metrics.
b. Resolution and localization.
Determining the resolution and offset (localization) of reconstructed perturbations can be done efficiently by considering as a matrix of unit voxel impulse response vectors. This can be seen by examining Eq. (14) and considering that contains all zeros except a 1 in the element (a unit perturbation only in the voxel ). Then, will be the th column of . Thus, contains the response vectors (in its rows and columns since it is symmetric) for a unit perturbation in each voxel. In this section, we discuss efficient ways to calculate resolution and localization maps in MATLAB (MathWorks, Natick, MA, USA). However, the methods could be adapted to other programming languages.
For notation, we introduce the resolution matrix () and the localization matrix () as follows:
| (18) |
| (19) |
where and are both n × 3 matrices containing the map of resolution or localization in each coordinate direction (three columns for x, y, and z). For example, the j element of () is the reconstructed Full Width at Half Maximum (FWHM) resolution along for a perturbation in the voxel . Additionally, the th element of () is the offset between the actual perturbation location and the reconstructed maximum location along for a perturbation in the voxel .
For computation of these matrices in MATLAB, we must consider the data format. (SpS) has size , but we want to consider the response maps in a three-dimensional (3D) coordinate system. Thus, SpS is reshaped as follows:
where nx, ny, and nz are the number of voxels in the , , and directions, respectively. Now, SpS_grid2 is a six-dimensional (6D) array, where the first three dimensions can index a perturbation location and the remaining 3D array is the reconstructed map (note switching the indexing to the last three would produce the same result since SpS is symmetric). For example,
where reconMap is the 3D array of the reconstructed map for a unit perturbation at the voxel [iy, ix, iz]. The resolution and localization are computed for each of the three dimensions. Thus, first we find the linear reconstruction along the axis of interest ( shown here),
where Mrcn_gridx is the four-nonsingular-dimensional array containing the linear reconstruction (along the fifth dimension) for a perturbation in every voxel location (first three dimensions). This is obtained by summing the 3D reconstructed maps along the and directions (fourth and sixth dimensions). The same method can be used for the other two directions by summing over different indices. With in this form, we can now quickly find the resolution and localization maps along each dimension.
We define the resolution in terms of the FWHM that can be computed in one line using the data structured in this way ( direction shown),
where Gamma_x is reshaped to be a 3D map and dx is the voxel pitch in the direction. Similar reasoning follows for the other two directions.
For the localization map, we must first create a 3D array of actual perturbation location indices in each dimension for every voxel location ( direction shown),
where XX is the 3D array of the indices of the actual perturbation location for a perturbation in every possible location. Next, the indices of the reconstructed maxima must be found (again for the direction),
where maxInds_x is the 3D array with the x index of the maximum of the reconstructed image for an actual perturbation in every voxel location. Finally, we can compare XX to maxInds_x to find the localization map,
where Delta_x is reshaped to be a 3D array for visualization. As before, the same process can be used to find the y and z directions.
This method of finding the resolution and localization maps allows for quick evaluation of how perturbations are expected to be reconstructed. Doing so provides another tool for evaluating the imaging performance of optical arrangement designs (in addition to the methods described in Sec. III A 2 a). In Sec. III A 2 c, we discuss another method through which image reconstruction can be examined, thus providing another evaluation of optical arrangements for imaging.
c. Singular value decomposition (SVD).
Instead of looking at the Moore–Penrose pseudoinverse in terms of its typical formulation [Eq. (6)], we can also think of it in terms of Singular Value Decomposition (SVD). Equation (8) shows the SVD based formulation, which we can use to examine and gain more insights into the imaging system. Combining Eqs. (7) and (8) to find yields
| (20) |
which can be simplified to
| (21) |
by the orthogonality of U (i.e., U−1 = UT) and the multiplication of [Eq. (8a)] and [Eq. (7a)], which yields an matrix with 1 in the first diagonal elements and 0 elsewhere. In Eq. (21), is an vector of zeros of which there are in the matrix within the brackets on the right-hand side. From this formulation, we can see that the imaging system matrix () is completely formulated using the right singular vectors.
The importance of the right singular vectors of can be seen when substituting Eq. (21) into Eq. (14),
| (22) |
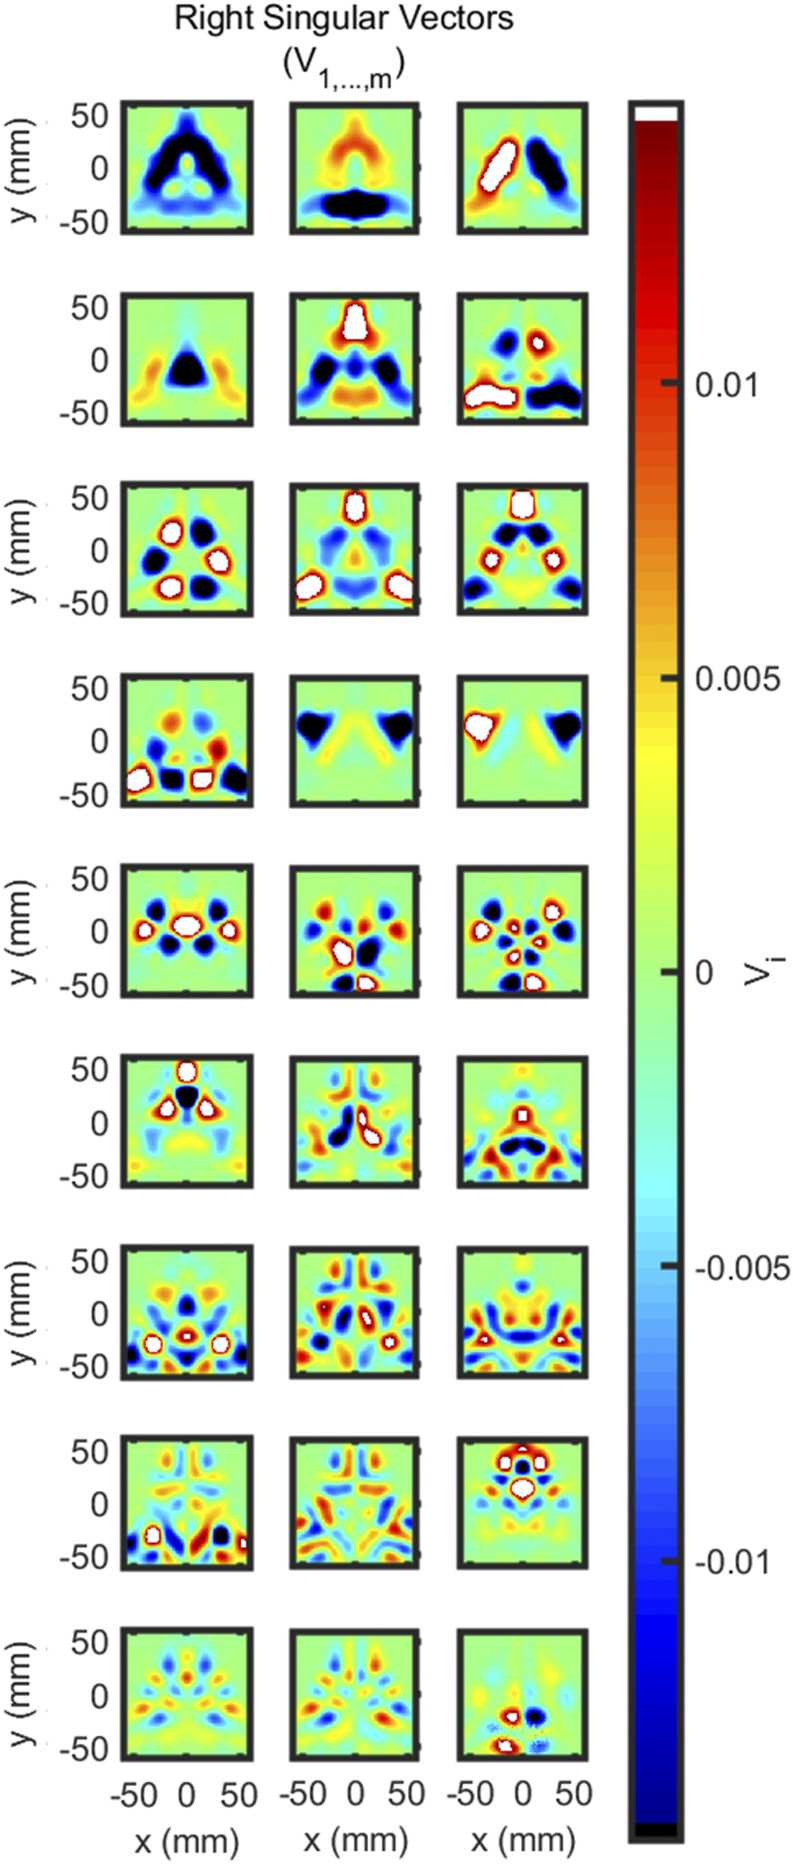
where it can be seen by the orthogonality of that if is any of the first right singular vectors of (or any linear combination of them), then a perfect reconstruction will be achieved (i.e., ). Conversely, if is any of the last right singular vectors, then a null reconstruction will be achieved (i.e., ). This means that is spanned by the vectors (). In other words, any reconstructed image must be some linear combination of the first right singular vectors of . This fact can be used to further evaluate the imaging system by visualizing these vectors as maps in three-dimensional (3D) space, keeping in mind that any image reconstructed by the system must be a linear combination of these maps.
We may also revisit the condition number () in terms of SVD. Equation (7) shows as containing the singular values of (). We consider the singular values ordered such that is the maximum singular value and is the minimum singular value. Therefore, can also be expressed as40
| (23) |
showing that the condition number (meaning the system stability) can be thought of as the ratio of biggest and smallest singular values. This suggests that a better conditioned system will have a set of singular values within a relatively small range, while an ill-conditioned system will have a large difference between the largest and smallest singular values. Therefore, yet another method for looking at the stability/condition of the imaging system is to examine the singular values and noting how much they differ. For example, if the first singular values have approximately the same order of magnitude but is near zero, the condition number of the system may be improved by ignoring a redundant measurement.
For better understanding of the use of singular values, we may consider two simple examples with and . First, we consider the case where one measurement is very weakly sensitive to the medium, . Then, σ1 = 0.6, σ2 = 8 × 10⁻⁷, and κ = 7 × 10⁵, showing that one measurement is problematic. Second, we consider the case where the two measurements are close to the same sensitivity, . Then, σ1 = 0.8, σ2 = 10−6, and κ = 8 × 10⁵, showing again there is a problematic measurement (this time because one is redundant). We note that examining these values cannot be done blindly since their magnitudes are dependent on the specific reconstruction parameters being considered, and different issues may cause similar effects. However, examining singular values can provide guidance when combined with other evaluation methods or when compared to two similar designs.
B. Physical array
1. Array design
Once the optimal geometrical arrangement of source and detector locations has been determined, a design must be created that physically realizes it. Depending on the specifics of the Near-InfraRed Spectroscopy (NIRS) instrument, the array may contain physical sources (laser diodes, light emitting diodes, etc.) and detectors (photodiodes, avalanche photodiodes, etc.), or it may contain optical fibers that deliver light to and from the investigated sample. In this work, we have used an Imagent V2 (ISS, Champaign, IL, USA) NIRS instrument, which uses laser diodes and photomultiplier tube detectors that are coupled to optical fibers. Specifically, the light sources are coupled to SubMiniature version A (SMA) terminated multimode optical fibers, whereas the optical detectors are coupled to ferrule terminated fiber bundles connected via a collet. For the detector fibers, we use 2 m long, 3 mm diameter fiber bundles with 4.75 mm Outer Diameter (OD) ferrules (ISS O431). Two separate optical fibers, one for each of the two wavelengths (690 nm and 830 nm), deliver light at each source location. To accomplish this, we use custom-built, 2 m long, fanout fiber bundles with 1 m long split ends (Thorlabs, Newton, NJ, USA). The optical fiber used was a 600 µm multimode fiber (Thorlabs FT600EMT) with a furcation tubing jacket (Thorlabs FT038). The split ends are terminated in SMA905 connectors (Thorlabs 10125A), and the common end is terminated in a custom drilled and polished 2.5 mm OD ferrule (drilled from Thorlabs SF230-1). Given these optical fiber terminations, the optical array was designed to arrange the 4.75 mm OD detector fibers and the 2.5 mm OD source fibers in the desired arrangement.
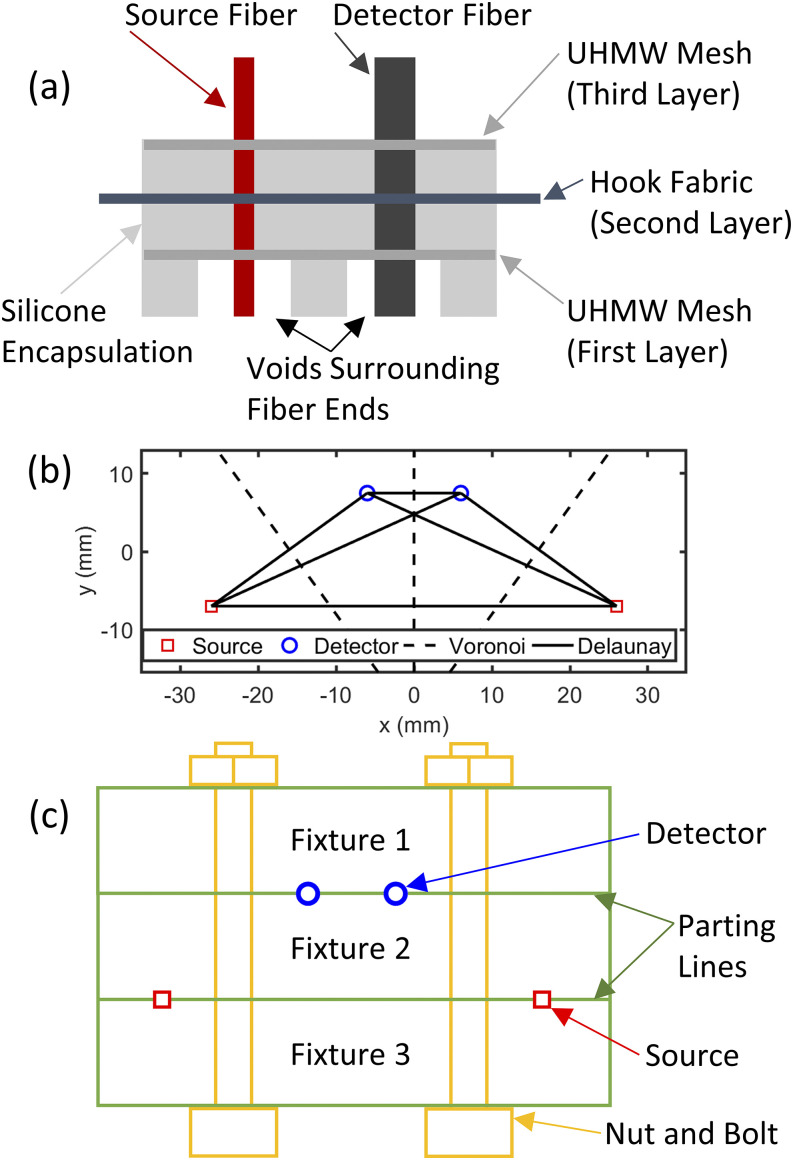
The overarching design of the array was a three-layer mesh structure encapsulated in PolyDiMethylSiloxane (PDMS) [Fig. 5(a)]. The first and third layers of the array are constructed from the Ultra-High Molecular Weight (UHMW) polyethylene film (McMaster Carr 85655K15, Elmhurst, IL, USA), and the middle (second) layer is built from the polypropylene hook and loop fabric (McMaster Carr 94975K42). PDMS used to encapsulate the array was Ecoflex 00-30 (Smooth-On, Macungie, PA, USA), which was mixed with Calli India-ink (Daler-Rowney, Bracknell, England) to pigment the array black.
FIG. 5.
Example array design methodology. (a) Basic schematic of the layered array geometry. (b) Example Delaunay triangulation used for mesh design and Voronoi partition used for fiber void design for a single Dual-Slope (DS) set. (c) Basic schematic of parting line locations and fixture clamping methodology used to design the array mold.
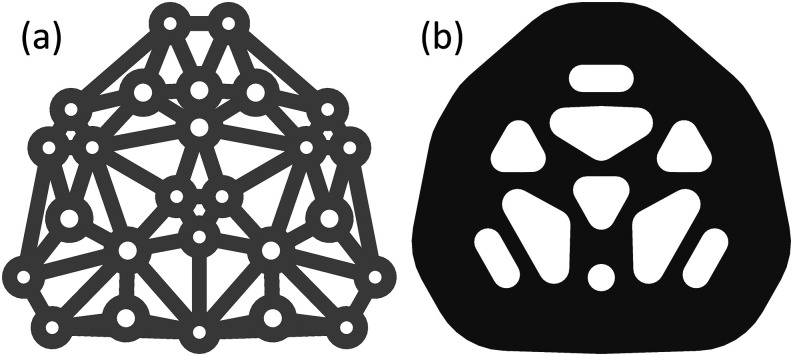
The first and third UHMW mesh layers hold the fiber terminations in their place within the arrangement. The design methodology for the UHMW mesh is as follows: (1) the locations of the source and detector ferrules are determined; (2) at each ferrule location, a hole is created to accommodate the ferrule with an UHMW doughnut surrounding it with an OD of 14.5 mm (i.e., we now have UHMW toroidal islands at each ferrule location); and (3) the centers of the doughnuts are connected with a Delaunay triangulation [Fig. 5(b)], where each triangulation edge defines the centerline of a 5 mm wide UHMW connector. The resulting mesh features UHMW circles surrounding each ferrule with 5 mm wide connections between them. This design strategy creates an interconnected mesh that will hold the fibers in the arrangement locations. The fiber ferrules are epoxied to the UHMW mesh using KwikWeld (J-B Weld, Sulphur Springs, TX, USA).
The middle layer of hook fabric is cut to remove as much material as possible, allowing the fibers to pass through the layer and PDMS to fully surround all the parts. Enough hook fabric remains to provide tension to the array when pulled, since this is the method with which the array will be attached to other components (such as a head cap). As such, the size of the hook fabric will overhang the array by 25 mm once it has been encapsulated with PDMS. Both the UHMW mesh and the hook fabric are cut using a paper cutter (Cricut Maker, South Jordan, UT, USA).
Finally, after designing and constructing the various array layers, the assembly is encapsulated with PDMS. The first mesh layer is placed 5 mm from the ferrule ends, the second layer of hook fabric (hooks facing away from ferrule ends) is placed 5 mm from the first mesh, and the third layer of mesh is placed 5 mm above the hook fabric. Finally, the top of PDMS is poured such that it is flushed with the top of the third layer. This procedure results in a total array thickness of 15 mm. The outer perimeter of the array is such that it fully encapsulates the mesh layers and leaves a 25 mm hook fabric overhung. On the bottom of the optical array, there are voids in PDMS surrounding each fiber ferrule to allow the ferrules to push through hair (in the case of non-invasive applications on the human head). These negative spaces are 5 mm in height, and their shape is defined using a Voronoi partition [Fig. 5(b)] between the fiber locations. The edges of the partition are of a non-zero width such that each ferrule is 7.5 mm to the edge of its void, or the partition width is 5 mm, whichever creates a larger partition wall width. This creates a design with walls of PDMS separating all fiber locations, ensuring that light diffuses through the medium being probed and does not leak across the surface.
We have now described the structure and materials for the construction of an array. In Subsection III B 1 a, we discuss what design methodology is used to incorporate the array into a head cap so that the array can be used on the head of human subjects.
a. Cap design.
Here, we consider functional Near-InfraRed Spectroscopy (fNIRS) as the array’s primary use. As such, it is designed to be placed on a human head to image optical property changes within brain tissue. To achieve this, a polychloroprene wet suit cap (NeoSport SH25V, Millville, NJ, USA) was modified to accept the array and connect to the overhanging hook fabric. Each cap can be designed to target a specific region on the subject’s head, and different sized caps can be made for different subjects. Additionally, caps can be washed between uses.
To construct a cap, a hole is cut to accommodate the profile of the array. Then, the loop polypropylene hook and loop fabric (McMaster Carr 94975K82) are sewn into the inside of the cap with loops facing toward the head. The optical array can be placed within the cap hole and fixed to the cap via the hook and loop. Each cap is custom designed for size and head location. If necessary, hook and loop tie straps are sewn to the outside of the cap to provide extra tension to the array. This may be necessary to conform the array to the subject’s head. Cap construction is done using a sewing machine (Singer Heavy Duty 4423, La Vergne, TN, USA), and components are attached using a black #69 polyester thread (Selric).
2. Array construction methods
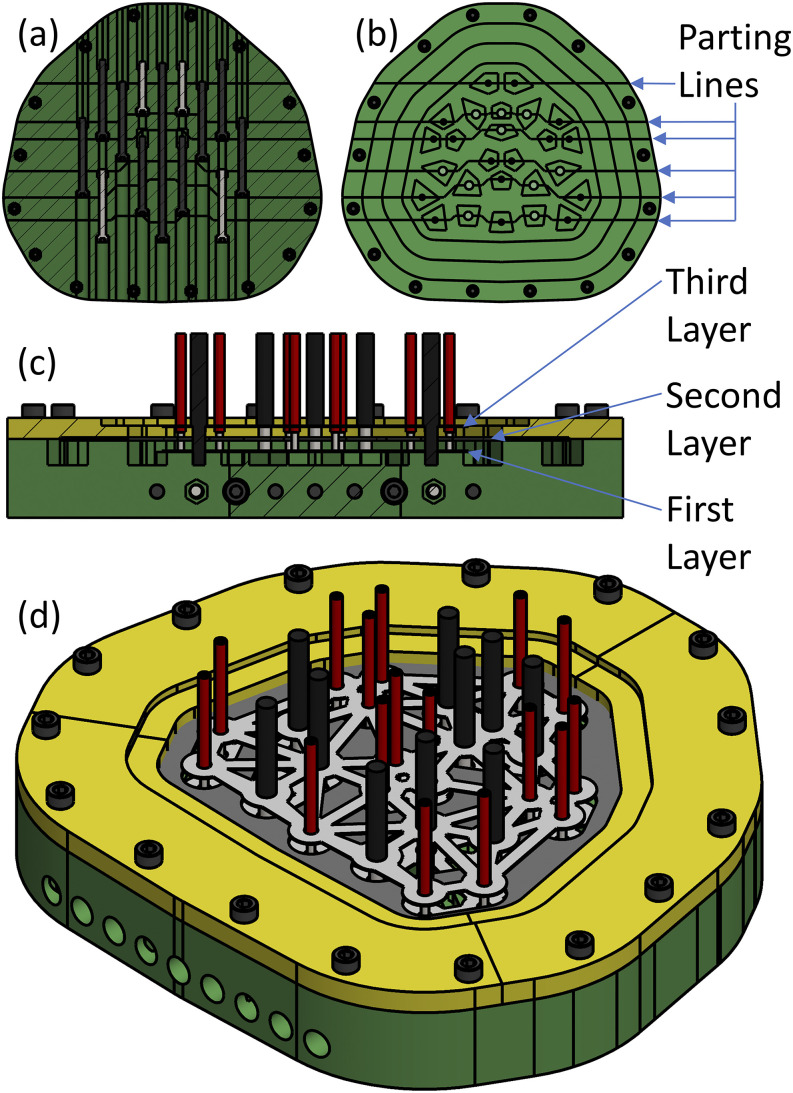
To realize the array design, the structure of the array is built using a mold that holds all components in place while PDMS is poured over the array. The general design of the array mold consists of a series of fixtures that bolt together such that the fiber ferrules are placed along the parting lines of the fixtures that are assembled to create the mold [Fig. 5(c)]. In other words, the assembly fixtures bolt together to sandwich the ferrules in place; once all the fixtures are bolted together, their negative space creates the mold for PDMS. Once this assembly is in place, a collar is bolted around the array such that the hook fabric is sandwiched to guarantee that when PDMS is poured, the fabric will not be encapsulated and will overhang the array.
The order of assembly of the array is to (1) pull the fibers through the three layers of mesh and hook fabric, (2) place the ferrules sandwiched between the fixtures to create a mold, (3) lower the layers into the mold negative space, epoxy the ferrules to the mesh, and affix the collar as to sandwich the middle layer, and (4) pour PDMS and allow the array to set, at which point everything is disassembled and the flash (excess material) is removed.
The primary material used for the mold was PolyLactic Acid (PLA) fabricated using a Fused Filament Fabrication (FFF) 3D printer (Ultimaker 2+, Utrecht, The Netherlands). The 3D-printed material was sprayed with methyl methacrylate lacquer (Dupli-Color DAL1695, Cleveland, OH, USA) to ensure there was no cure inhibition of PDMS. The mold is bolted together using M5 × 0.8 mm socket head cap screws of various lengths and matching nuts, which were captured within the printed PLA mold.
IV. RESULTS
A. Two possible source–detector arrangements
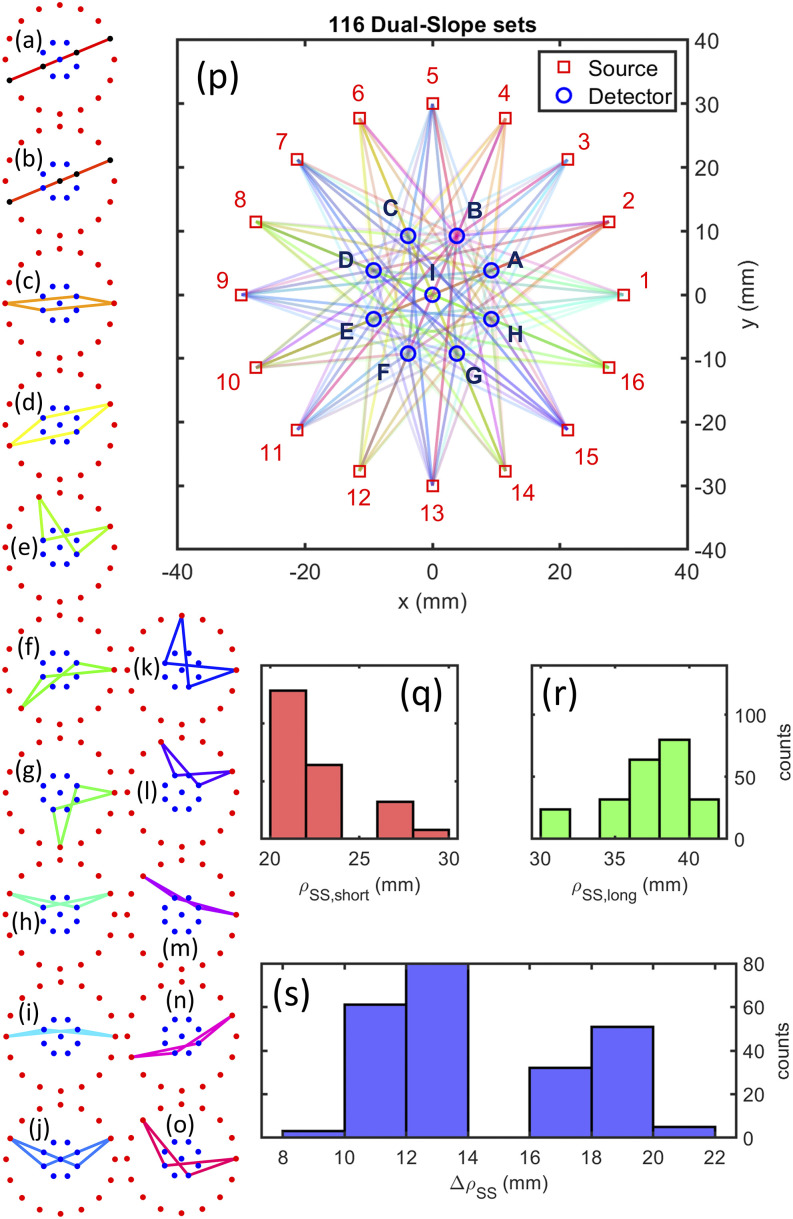
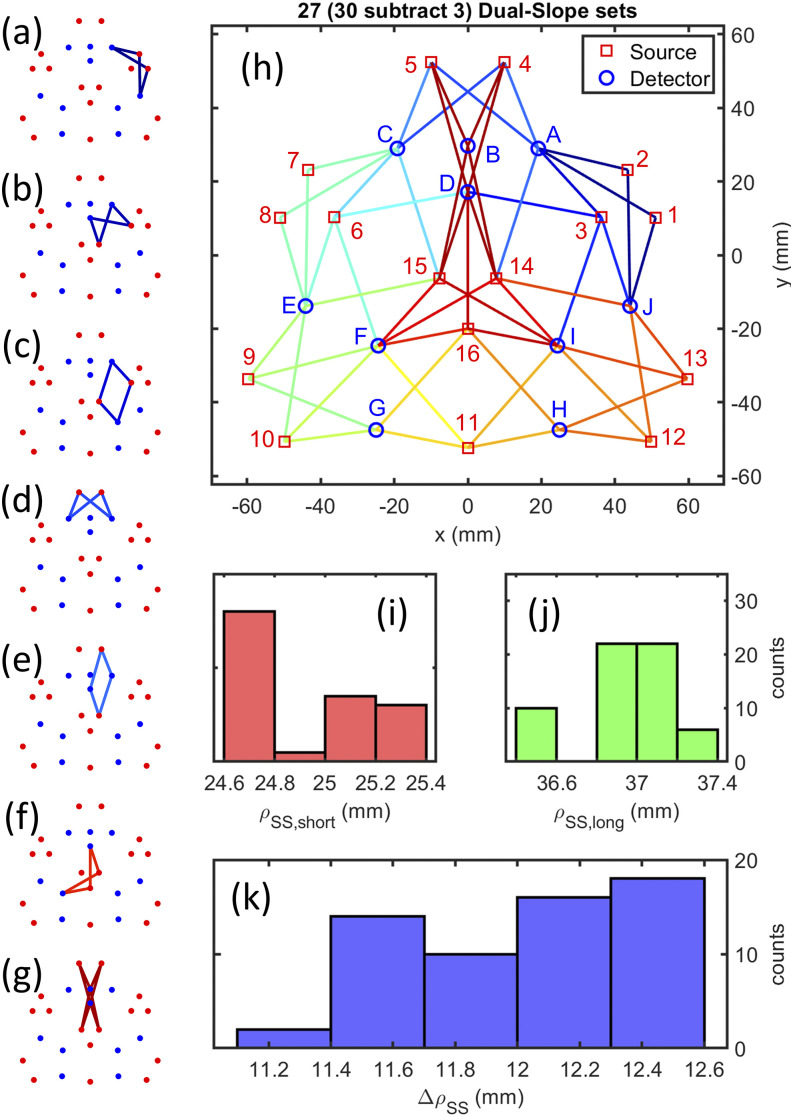
We designed two source–detector arrangements with the purpose of using the Dual-Slope (DS) phase () (DS) to preferentially image deep tissue. Our goal was to design one arrangement with many overlapping measurements in a small area for high Signal-to-Noise Ratio (SNR) and resolution (Fig. 6) and another with large lateral coverage and to prioritize localization of optical perturbations (Fig. 7). The former array demonstrates the presented methods, and the latter array allows for functional measurements where the location of brain activation could be identified. The latter goal differs from the goal of spatial resolution (former goal), which would imply the discrimination of two close perturbations, which is not the goal of the latter array.
FIG. 6.
Circular design of the Dual-Slope (DS) imaging arrangement. [(a)–(o)] Examples of each of the types of DS sets within the source–detector arrangement. (p) Full array showing all sources (1–16), detectors (A–I), and SD measurement pairs (lines). (q) Histogram of all Single-Distances (SDs) that make up the short distance of a Single-Slope (SS) set. (r) Histogram of all SDs that make up the long distance of a SS set. (s) Histogram of all distance differences for SS sets.
FIG. 7.
Final hexagonal design of the Dual-Slope (DS) imaging arrangement. [(a)–(g)] Examples of each of the types of DS sets within the source–detector arrangement. (g) Four redundant DS sets combined into one. (h) Full array showing all sources (1–16), detectors (A–J), and SD measurement pairs (lines). (i) Histogram of all Single-Distances (SDs) that make up the short distance of a Single-Slope (SS) set. (j) Histogram of all SDs that make up the long distance of a SS set. (k) Histogram of all distance differences for SS sets.
The arrangements were designed for a total of 16 sources and 9 detectors for the first array or 10 detectors for the second. We started the design process by manually placing the sources and detectors in various tessellations and using the DS discovery algorithm to find all the possible DS sets (Sec. III A 1 a). The arrangements with the largest number of overlapping sets and best evaluation (focusing on the goal for each array) results were chosen. The final arrangements were based on a circular symmetry (Fig. 6) for the first and a hexagonal tessellation (Fig. 7) for the second.
The resulting circular arrangement [Fig. 6(p)] consists of 116 DS sets, while the resulting hexagonal arrangement [Fig. 7(h)] contains 30 DS sets, four of which are redundant and averaged in analysis, resulting in . For the circular arrangement, there are 15 different DS set shapes that are either linear, trapezoidal, or rhombic [Figs. 6(a)–6(o)]. Within the hexagonal arrangement, there are seven different shapes of DS sets [Figs. 7(a)–7(g)] all of which are either trapezoidal or rhombic. The four redundant sets of the hexagonal arrangement [Fig. 7(g)] are averaged together since their regions of sensitivity are very close to each other, and considering them separately would increase the condition number of the system (Secs. III A 2 a and III A 2 c). The whole hexagonal array contains a small range of short and long distances [Figs. 7(i)–7(k)], showing that the position refinement successfully homogenized the array.
1. Arrangement evaluation results
The evaluation methods rely on the creation of sensitivity maps for each Dual-Slope (DS) set. For our simulations, we used an absolute reduced scattering coefficient of 1.2 mm−1, an absolute absorption coefficient of 0.01 mm−1, an internal index of refraction of 1.4, an external index of refraction of 1.0, and an optical modulation frequency of 140.625 MHz. These optical properties are consistent with those in the previous work concerning sensitivity maps36 and typical values for the human brain.41
The goal of DS imaging is not to create three-dimensional (3D) images but instead two-dimensional images representative of deep perturbations. Thus, our simulation geometry featured only two layers of voxels along the depth coordinate z; a first superficial layer with z in the range 0–10 mm, and a deeper layer (the one that we wish our images to be mostly sensitive to) with z in the range 10–20 mm. Such layered geometry has been previously described for use with DS.33 Laterally, for the circular array, the full volume was with voxels of , resulting in = 20 402, while for the hexagonal array, the full volume was with voxels, resulting in = 29 282.
The geometry was chosen to align with the goals of using the DS phase () (DS) to achieve preferential deep sensitivity. The second layer depth was chosen both because the brain is typically at a depth >10 mm42,43 and because the typical depth of maximal sensitivity for DS is greater than 10 mm. In accordance with these goals, we show the maps only for the second layer of voxels (10 mm–20 mm) and only for DS.
First, we examine the reconstruction () and crosstalk () maps for our imaging systems (Sec. III A 2 a). For the circular array, we note the reconstruction is focused on a small central region [Fig. 8(a)] and the crosstalk map suggests preferential reconstruction in a four-lobed ring around the center [Fig. 8(b)]. This is consistent with the design goals for this array, which sought to confine the sensitivity to a small region. As a result, Fig. 8 suggests the circular array has a coverage region with a radius of ∼10 mm (∼300 mm2) for which 116 DS sets overlap.
FIG. 8.
results: (a) reconstruction (R) and (b) crosstalk (C) for the circular arrangement.
Considering and for the hexagonal array and focusing on the reconstruction map [Fig. 9(a)], we note that the array does not feature homogeneous reconstruction. Notably, the array has high reconstruction values at the center and below the top four detectors (A–D). Additionally, there are low reconstruction values in various regions surrounding the center, suggesting compromised sensitivity and poor reconstruction quality in these regions. Looking at the crosstalk map [Fig. 9(b)], we notice high values in the center and below sources 2 and 7, indicating that some perturbations will be incorrectly reconstructed there. Low values in the crosstalk map are seen below detectors I and F, which align with low values in the reconstruction map; this suggests that the array has blind spots in these locations. Overall, given our goal of large lateral coverage, the array preforms reasonably well by covering a rough triangle of ∼7200 mm2, with the largest weakness being two poor sensitivity locations below detectors I and F. Keeping this imaging performance in mind, in a given experiment, the array should be placed such that the best sensitivity area (underneath detectors A–D) is aligned with the region of interest.
FIG. 9.
results: (a) reconstruction (R) and (b) crosstalk (C) for the final hexagonal arrangement.
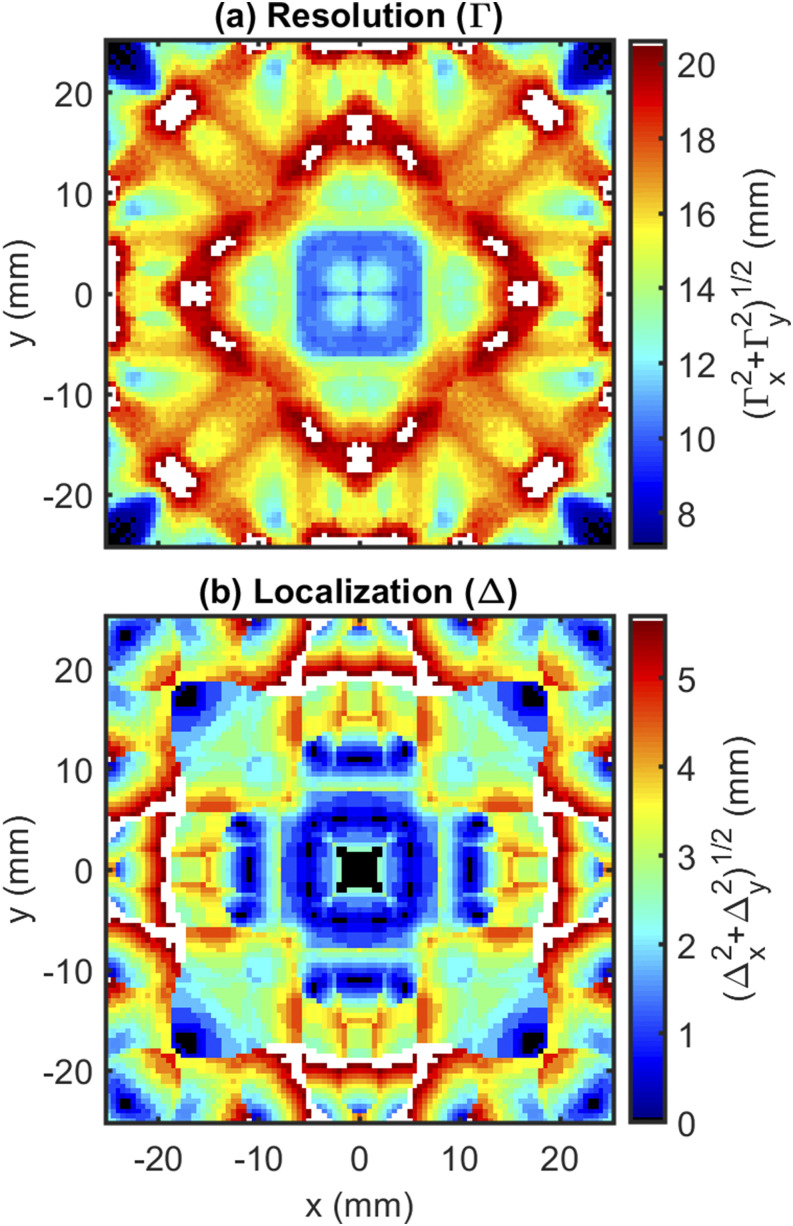
Second, we examine the resolution () and localization () maps (Sec. III A 2 b). In the case of the circular array, a typical (average in the useable array region) lateral Full Width at Half Maximum (FWHM) resolution of ∼10 mm is achieved [Fig. 10(a)] with a localization error of about 1 mm [Fig. 10(b)]. This suggests that the array could roughly resolve two point-like perturbations in its small imaging area and reinforcing the goals for this design are met given that it is capable of fine precise imaging in a small area.
FIG. 10.
impulse response results: (a) resolution () and (b) localization () for the circular arrangement.
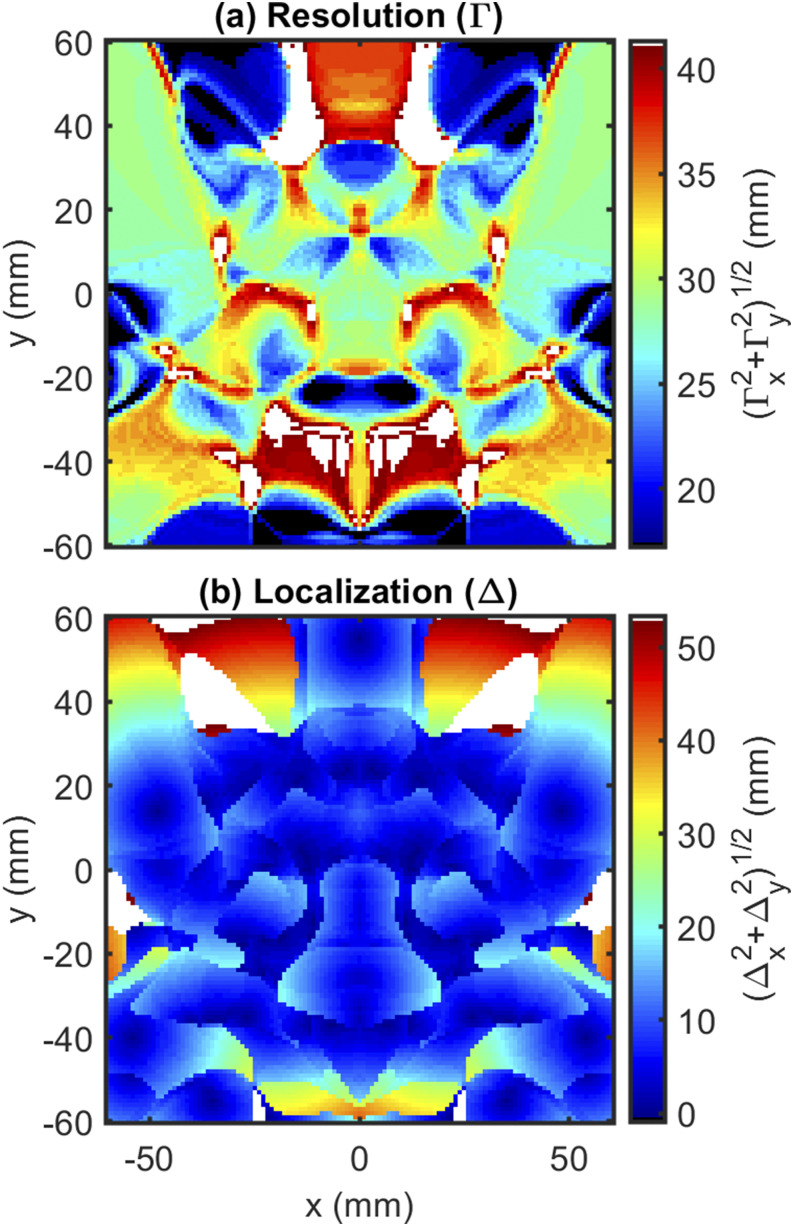
Focusing on the hexagonal array, the resolution map [Fig. 11(a)] shows that the expected lateral FWHM of the arrangement ranges from 20 mm to 30 mm in most regions. This value is quite large and shows that the arrangement will not be able to distinguish between two closely spaced perturbations. However, according to our goal, we prioritize localization over resolution. Thus, we look at the localization map [Fig. 11(b)] for metrics of success. Over almost the entire array, the lateral localization is ∼5 mm. Therefore, the arrangement achieves both good localization and large lateral coverage, along the lines of the design goals.
FIG. 11.
impulse response results: (a) resolution () and (b) localization () for the final hexagonal arrangement.
Finally, we consider the imaging system in terms of Singular Value Decomposition (SVD) (Sec. III A 2 c). We present this only for the hexagonal array for brevity, as the circular array would result in 116 images. The first right singular vectors show the span of all possible reconstructed images for the hexagonal array (Fig. 12). For this system, , and thus, the reconstruction must fit into 27 degrees of freedom that are shown in these singular vectors. Through careful examination of these maps, we can see where it is possible for the system to reconstruct images and where it is not. Notably, the upper right and left corners of the map cannot be reconstructed well, which is expected since the array cannot have sensitivity there. Aside from the right singular vectors, the condition number of the system was also evaluated [Eqs. (17) and (23)]. This can be calculated using the matrix norm or SVD, with SVD having the advantage of giving the option to examine the other singular values as well. For this system, the condition number is on the order of 1014, suggesting that the system is ill-conditioned. However, this is expected and known for a diffuse optical imaging system. What should be noted is the improvement that was achieved by averaging the redundant DS sets [Fig. 7(g)] When the system considers these separately (in which case ), the condition number is on the order of 1015 and the last three singular values approach zero. Therefore, removing the redundant measurements via averaging improved the condition of the system by an order of magnitude.
FIG. 12.
First right singular vectors (V) for the final arrangement.
B. Physical array
The physical array was designed around the final hexagonal source–detector arrangement (Fig. 7) since large coverage of functional imaging was desired. First, the mesh and hook fabric layers were designed (Sec. III B 1) and cut (Fig. 13). All other components of the array were prefabricated (source and detector fibers).
FIG. 13.
Layer profiles for the physical array construction. (a) First and third layer mesh. (b) Middle layer hook fabric.
Then, the array was assembled using a mold built from clamped fixtures (Sec. III B 2). The mold was constructed from seven fixtures clamped together by 13 bolts such that all 26 fibers were captured by being clamped at the parting lines [Figs. 14(a) and 14(b)]. The three layers were placed within the mold, with the middle layer of hook fabric clamped by a collar that encompassed the whole mold and was attached with 16 bolts [Fig. 14(c)]. The mesh layers (first and third layers) were fixed to the fibers with epoxy. Finally, with all parts held in place and the mold assembled, black silicone was poured to encapsulate the array [Fig. 14(d)]. Once silicone cured, the mold was disassembled, and the array was cleaned to finish the build.
FIG. 14.
Mold design used to construct the final array. (a) Bottom view showing bolts attaching seven fixtures to create the mold. (b) Top view showing parting line locations sandwiching the fiber ends. (c) Cross section showing three layers captured within the mold. (d) Isometric view of the full mold assembly before encapsulating PolyDiMethylSiloxane (PDMS) is poured.
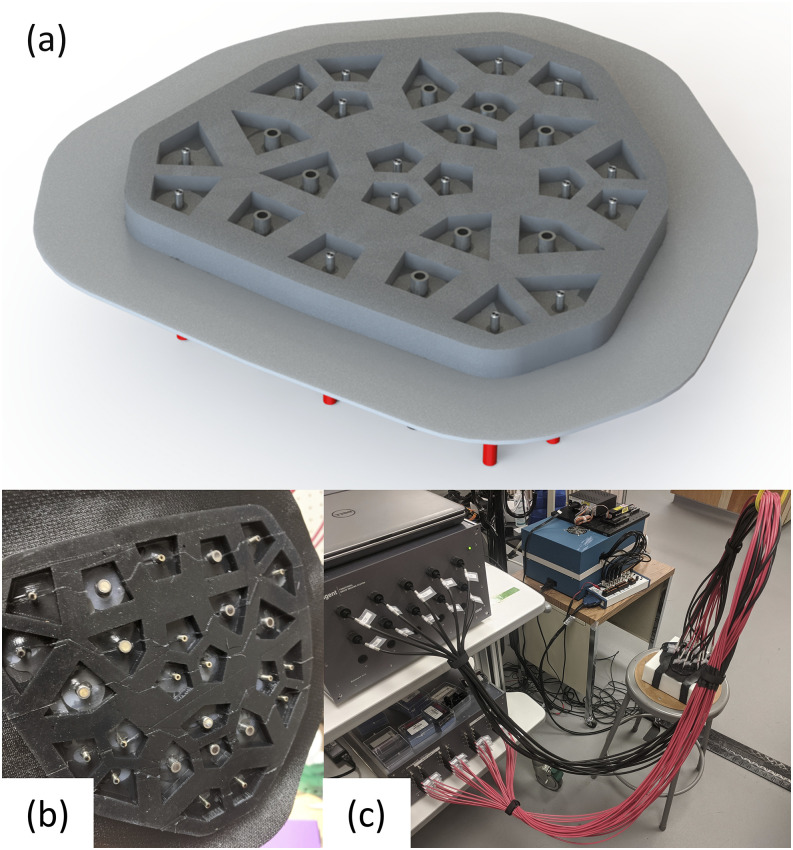
The final physical array realized the designed arrangement (Fig. 15). Given the design, the array can flex to conform to various surfaces including the human head, and the fibers can push through hair given the voids surrounding them.
FIG. 15.
Final array design and construction. (a) Rendering of the bottom side of our final array design. (b) Picture of the final array after construction. (c) Picture of the final array attached to the Imagent V2 instrument with the array applied onto an optical phantom.
V. DISCUSSION
The final hexagonal optical array was designed with the specific purpose of applications in functional Near-InfraRed Spectroscopy (fNIRS) imaging. This is the first optical array specifically designed for Dual-Slope (DS) phase imaging with FD-NIRS on human subjects. Of course, this array also collects Single-Distance (SD) data, as well as optical intensity measured with CW-NIRS. Therefore, the array may be used in experiments where the DS data (intensity or phase) are compared to SD data (intensity or phase) to investigate optimal conditions for imaging with selective sensitivity to deeper vs superficial tissues. Additionally, the large size of the array and the emphasis on localization would allow for identification of the brain activation location in fNIRS protocols. The large array size has the further advantage of broader coverage, which is important for experiments in which multiple neighboring brain areas are activated. Finally, this DS array design features the Self-Calibrating (SC) advantages of insensitivity to instrumental drifts and changes in optical coupling with tissue, and calibration-free absolute measurements.34 This allows for robust measurements weakly impacted by motion or instrumental artifacts.
Aside from fNIRS experiments, the array could also be used for non-invasive optical measurements of tissue where preferentially deep sensitivity is desired. Possible applications include breast and skeletal muscle imaging, where the tissue of interest is below the superficial layer of skin and adipose tissue.
All the aforementioned applications would take advantage of the array’s DS imaging capability; however, the array could also be implemented in the SC mode by combining DS intensity and phase data. In such a mode, the goal would not be to achieve preferentially deep sensitivity as for phase DS, but rather to measure absolute optical properties. In the SC mode, the array could image absolute optical properties of tissue without the need for calibration and with insensitivity to instrumental drifts. The applications of an array designed for DS data collection are numerous.
The arrays shown here are just two particular cases of a Dual-Slope (DS) imaging array. The purpose of this article is to provide a methodology and guidance for the design of a whole family of DS optical arrays (Sec. III). The final hexagonal array reported here was designed for large lateral coverage and good localization of optical perturbations. However, DS arrays can be designed for better spatial resolution, such as the circular array, or with other more complex goals in mind. In any case, the same methods described here can be used for DS array design.
There are a number of areas for improvements to the methodology and design. For example, a whole set of methods could be created to optimize the image reconstruction, such as changing the array geometry or optimizing regularization. We acknowledge that regularization was not considered here since it is typically employed to combat noise and we considered noiseless simulations. However, the presented methods could be expanded to include the effect of regularization, which would likely smooth the maps and worsen resolution.
Additionally, one may expand on the goal of localization considered here, which assumes the presence of a single perturbation. Along these lines, other image reconstruction techniques can be used, for example, methods inspired by compressed sensing for sparse solutions, which find the solution with the minimum number of voxels with non-zero perturbations.44
For improvements to the physical design, the first one is the enhancement of the subject’s comfort and mobility. Thinning the array design or adding relief cuts in silicone would make it more flexible, improve the subject’s comfort, and facilitate the conformable application to the curved head surface. A design for the head cap that does not encompass the entire head would also be beneficial to some subjects in the clinic, or in experiments where multiple probes are used simultaneously on the subject’s head.
Finally, we stress again that the methodology described here for designing and constructing a DS imaging arrangement can be applied to a variety of NIRS devices. Here, we have designed the array around a fiber-based instrument (ISS Imagent V2). However, the same arrangement design methodology can be applied to devices that use different types of optical fibers and fiber terminations or that use optical probes with directly embedded light sources and optical detectors.
VI. CONCLUSION
In this article, we have laid out the methods to design an imaging arrangement of illumination and optical collection points for use with Dual-Slope (DS) optical data (Sec. III A 1). We then describe various methods to evaluate the imaging performance of a given optical arrangement (Sec. III A 2). Given an arrangement design, we then lay out the methodology for building a physical fiber-based imaging array (Sec. III B). We then present two DS imaging arrays that we designed and one we built using these methods (Sec. IV). The arrays we present feature all the practical advantages of the DS technique (preferentially deep sensitivity and suppression of instrumental drifts and motion artifacts) implemented in an imaging modality.
The purpose of the designed final hexagonal array is for use in functional Near-InfraRed Spectroscopy (fNIRS) experiments. The goal of these experiments is to localize an activated brain area with minimal contributions from confounding superficial perturbation dynamics. However, the methods described here have more general applicability, as shown with the circular array design. An entire family of DS imaging arrays may be designed and built for a variety of applications and devices using the methods that we have laid out.
DATA AVAILABILITY
The data that support the findings of this study are available from the corresponding author upon reasonable request.
Code can be accessed via the following link: https://github.com/DOIT-Lab/DOIT-Public/tree/master/DualSlopeArrayDesign.
ACKNOWLEDGMENTS
This work was funded by the National Institutes of Health (NIH) under Grant No. R01 NS095334.
REFERENCES
- 1.Scholkmann F., Kleiser S., Metz A. J., Zimmermann R., Mata Pavia J., Wolf U., and Wolf M., Neuroimage 85, 6 (2014). 10.1016/j.neuroimage.2013.05.004 [DOI] [PubMed] [Google Scholar]
- 2.Torricelli A., Contini D., Pifferi A., Caffini M., Re R., Zucchelli L., and Spinelli L., Neuroimage 85, 28 (2014). 10.1016/j.neuroimage.2013.05.106 [DOI] [PubMed] [Google Scholar]
- 3.Fantini S. and Sassaroli A., Front. Neurosci. 14, 1 (2020). 10.3389/fnins.2020.00300 [DOI] [PMC free article] [PubMed] [Google Scholar]
- 4.Fantini S., Hueber D., Franceschini M. A., Gratton E., Rosenfeld W., Stubblefield P. G., Maulik D., and Stankovic M. R., Phys. Med. Biol. 44, 1543 (1999). 10.1088/0031-9155/44/6/308 [DOI] [PubMed] [Google Scholar]
- 5.Barstow T. J., J. Appl. Physiol. 126, 1360 (2019). 10.1152/japplphysiol.00166.2018 [DOI] [PubMed] [Google Scholar]
- 6.Grosenick D., Rinneberg H., Cubeddu R., and Taroni P., J. Biomed. Opt. 21, 091311 (2016). 10.1117/1.jbo.21.9.091311 [DOI] [PubMed] [Google Scholar]
- 7.Ferrari M. and Quaresima V., Neuroimage 63, 921 (2012). 10.1016/j.neuroimage.2012.03.049 [DOI] [PubMed] [Google Scholar]
- 8.Eggebrecht A. T., Ferradal S. L., Robichaux-Viehoever A., Hassanpour M. S., Dehghani H., Snyder A. Z., Hershey T., and Culver J. P., Nat. Photonics 8, 448 (2014). 10.1038/nphoton.2014.107 [DOI] [PMC free article] [PubMed] [Google Scholar]
- 9.Doulgerakis M., Eggebrecht A. T., and Dehghani H., Neurophotonics 6, 1 (2019). 10.1117/1.nph.6.3.035007 [DOI] [PMC free article] [PubMed] [Google Scholar]
- 10.Zimeo Morais G. A., Balardin J. B., and Sato J. R., Sci. Rep. 8, 3341 (2018). 10.1038/s41598-018-21716-z [DOI] [PMC free article] [PubMed] [Google Scholar]
- 11.Machado A., Marcotte O., Lina J. M., Kobayashi E., and Grova C., J. Biomed. Opt. 19, 026010 (2014). 10.1117/1.jbo.19.2.026010 [DOI] [PubMed] [Google Scholar]
- 12.Perdue K. L., Fang Q., and Diamond S. G., Phys. Med. Biol. 57, 2857 (2012). 10.1088/0031-9155/57/10/2857 [DOI] [PMC free article] [PubMed] [Google Scholar]
- 13.Boas D. A., Chen K., Grebert D., and Franceschini M. A., Opt. Lett. 29, 1506 (2004). 10.1364/ol.29.001506 [DOI] [PubMed] [Google Scholar]
- 14.White B. R., J. Biomed. Opt. 15, 026006 (2010). 10.1117/1.3368999 [DOI] [PMC free article] [PubMed] [Google Scholar]
- 15.Tian F., Alexandrakis G., and Liu H., Appl. Opt. 48, 2496 (2009). 10.1364/ao.48.002496 [DOI] [PMC free article] [PubMed] [Google Scholar]
- 16.Wijeakumar S., Spencer J. P., Bohache K., Boas D. A., and Magnotta V. A., Neuroimage 106, 86 (2015). 10.1016/j.neuroimage.2014.11.022 [DOI] [PMC free article] [PubMed] [Google Scholar]
- 17.Brigadoi S., Salvagnin D., Fischetti M., and Cooper R. J., Neurophotonics 5, 1 (2018). 10.1117/1.nph.5.3.035010 [DOI] [PMC free article] [PubMed] [Google Scholar]
- 18.Huppert T. J., Diamond S. G., Franceschini M. A., and Boas D. A., Appl. Opt. 48, D280 (2009). 10.1364/ao.48.00d280 [DOI] [PMC free article] [PubMed] [Google Scholar]
- 19.Aasted C. M., Yücel M. A., Cooper R. J., Dubb J., Tsuzuki D., Becerra L., Petkov M. P., Borsook D., Dan I., and Boas D. A., Neurophotonics 2, 020801 (2015). 10.1117/1.nph.2.2.020801 [DOI] [PMC free article] [PubMed] [Google Scholar]
- 20.Cutini S., Scatturin P., and Zorzi M., Neuroimage 54, 919 (2011). 10.1016/j.neuroimage.2010.09.030 [DOI] [PubMed] [Google Scholar]
- 21.Vanegas M. and Fang Q., in OSA Technical Digest (OSA, 2020), p. BM2C.6. [Google Scholar]
- 22.Pinti P., Aichelburg C., Lind F., Power S., Swingler E., Merla A., Hamilton A., Gilbert S., Burgess P., and Tachtsidis I., “Using fiberless, wearable fNIRS to monitor brain activity in real-world cognitive tasks,” J. Vis. Exp. 106, e53336 (2015). 10.3791/53336 [DOI] [PMC free article] [PubMed] [Google Scholar]
- 23.Piper S. K., Krueger A., Koch S. P., Mehnert J., Habermehl C., Steinbrink J., Obrig H., and Schmitz C. H., Neuroimage 85, 64 (2014). 10.1016/j.neuroimage.2013.06.062 [DOI] [PMC free article] [PubMed] [Google Scholar]
- 24.Blaney G., Sassaroli A., Pham T., Fernandez C., and Fantini S., in OSA Technical Digest (OSA, 2020), p. JTh2A.9. [Google Scholar]
- 25.Liao A. Y., Lai Y., and Sung K., in OSA Technical Digest (OSA, 2020), p. JTh2A.6. [Google Scholar]
- 26.Curtin A. and Ayaz H., Jpn. Psychol. Res. 60, 374 (2018). 10.1111/jpr.12227 [DOI] [Google Scholar]
- 27.Yücel M. A., Selb J. J., Huppert T. J., Franceschini M. A., and Boas D. A., Curr. Opin. Biomed. Eng. 4, 78 (2017). 10.1016/j.cobme.2017.09.011 [DOI] [PMC free article] [PubMed] [Google Scholar]
- 28.Zhao H. and Cooper R. J., Neurophotonics 5, 1 (2017). 10.1117/1.nph.5.1.011012 [DOI] [PMC free article] [PubMed] [Google Scholar]
- 29.Franceschini M. A., Fantini S., Paunescu L. A., Maier J. S., and Gratton E., Appl. Opt. 37, 7447 (1998). 10.1364/ao.37.007447 [DOI] [PubMed] [Google Scholar]
- 30.Dehaes M., Gagnon L., Lesage F., Pélégrini-Issac M., Vignaud A., Valabrègue R., Grebe R., Wallois F., and Benali H., Biomed. Opt. Express 2, 680 (2011). 10.1364/boe.2.000680 [DOI] [PMC free article] [PubMed] [Google Scholar]
- 31.Tian F., Niu H., Khan B., Alexandrakis G., Behbehani K., and Liu H., IEEE Trans. Med. Imaging 30, 1239 (2011). 10.1109/tmi.2011.2111459 [DOI] [PubMed] [Google Scholar]
- 32.Caldwell M., Scholkmann F., Wolf U., Wolf M., Elwell C., and Tachtsidis I., Neuroimage 143, 91 (2016). 10.1016/j.neuroimage.2016.08.058 [DOI] [PMC free article] [PubMed] [Google Scholar]
- 33.Blaney G., Sassaroli A., and Fantini S., “Dual-slope imaging in highly scattering media with frequency-domain near-infrared spectroscopy,” Opt. Lett. 45, 4464–4467 (2020). 10.1364/OL.394829 [DOI] [PMC free article] [PubMed] [Google Scholar]
- 34.Hueber D. M., Fantini S., Cerussi A. E., and Barbieri B. B., Proc. SPIE 3597, 618–631 (1999). 10.1117/12.356784 [DOI] [Google Scholar]
- 35.Blaney G., Sassaroli A., Pham T., Fernandez C., and Fantini S., J. Biophotonics 13, e201960018 (2020). 10.1002/jbio.201960018 [DOI] [PMC free article] [PubMed] [Google Scholar]
- 36.Sassaroli A., Blaney G., and Fantini S., J. Opt. Soc. Am. A 36, 1743 (2019). 10.1364/josaa.36.001743 [DOI] [PMC free article] [PubMed] [Google Scholar]
- 37.Fantini S., Blaney G., and Sassaroli A., J. Innov. Opt. Health Sci. 13, 1930013 (2020). 10.1142/s1793545819300131 [DOI] [PMC free article] [PubMed] [Google Scholar]
- 38.Sawosz P. and Liebert A., Biomed. Opt. Express 10, 5031 (2019). 10.1364/boe.10.005031 [DOI] [PMC free article] [PubMed] [Google Scholar]
- 39.Sassaroli A., Martelli F., and Fantini S., J. Opt. Soc. Am. A 27, 1723 (2010). 10.1364/josaa.27.001723 [DOI] [PMC free article] [PubMed] [Google Scholar]
- 40.MathWorks, MATLAB Document, 2020.
- 41.Hallacoglu B., Sassaroli A., Guerrero-Berroa E., Schnaider Beeri M., Haroutunian V., Shaul M., Rosenberg I. H., Toren A., and Fantini S., J. Biomed. Opt. 17, 081406 (2012). 10.1117/1.jbo.17.8.081406 [DOI] [PMC free article] [PubMed] [Google Scholar]
- 42.Xiao X., Yu X., Zhang Z., Zhao Y., Jiang Y., Li Z., Yang Y., and Zhu C., Sci. Adv. 4, eaar6904 (2018). 10.1126/sciadv.aar6904 [DOI] [PMC free article] [PubMed] [Google Scholar]
- 43.Lu H., Lam L. C. W., and Ning Y., CNS Neurosci. Ther. 25, 1270 (2019). 10.1111/cns.13204 [DOI] [PMC free article] [PubMed] [Google Scholar]
- 44.Candes E. and Romberg J., “L1-MAGIC: Recovery of sparse signals via convex programming,” (published online 2005), available at http://statweb.stanford.edu/∼candes/software/l1magic/downloads/l1magic.pdf.
Associated Data
This section collects any data citations, data availability statements, or supplementary materials included in this article.
Data Availability Statement
The data that support the findings of this study are available from the corresponding author upon reasonable request.
Code can be accessed via the following link: https://github.com/DOIT-Lab/DOIT-Public/tree/master/DualSlopeArrayDesign.


