

Abstract
Introduction:
Monitoring and diagnosing glaucoma until 2017 included funduscopy, IOP measurements, gonioscopy, pachymetry, as well as visual field tests, optical coherence tomography (OCT) and optical coherence tomography angiography (OCT-A). Radial peripapillary capillaries (RPC) can be observed by fluorescein angiography, as well as histologically - superficial and deep capillary layer.
Aim:
To correlate density of radial peripapillary capillary network (RPC) and retinal nerve fiber layer (RNFL) thickness in eight peripapillary segments in patients with a primary open angle glaucoma (POAG) which have the disease under 10 years of duration, over 10 years of duration and in a group of healthy patients.
Methods:
This is a cross-sectional review which included three groups of patients: POAG patients under 10 years of disease duration, over 10 years of disease duration and control group of patients. The study is performed on the commercial optical coherence tomography angiography system (AngioVue, Avanti RTVue-XR, Optovue, CA). Sectoral RPC density values, RPC maps and RNFL thickness were analyzed in three groups of patients, data was compared and correlation between parameters was examined.
Results:
Mean RPC Density values in both superior segments (S1, S2) were significantly lower in patients with glaucoma over 10 years of disease duration compared to patients with glaucoma under 10 years of disease duration (p<0.05). Statistically significant positive correlation was established between RNFL thickness and RPC density in all eight peripapillary segments.
Conclusion:
Analysis of radial peripapillary capillary network density on optical coherence tomography angiography may provide an earliest functional sign of progressive optic nerve disease and new insights into the pathophysiology of glaucomatous damage.
Keywords: Glaucoma, Primary Open Angle Glaucoma, Radial Peripapillary capillaries, Optical Coherence Tomography Angiography, Peripapillary Capillary Density Maps
1. INTRODUCTION
Monitoring and diagnosing glaucoma until 2017 included funduscopy, IOP measurements, gonioscopy, pachymetry, as well as visual field tests, optical coherence tomography (OCT) and optical coherence tomography angiography (OCT-A). Radial peripapillary capillaries (RPC) can be observed by fluorescein angiography, as well as histologically - superficial and deep capillary layer (1).
RPC is a unique vascular plexus from the inner limiting membrane (ILM) to the posterior boundary of the RNFL, the capillaries run along relatively long straight paths and are limited to the posterior pole where they seem to be associated highly with the superficial nerve fibers (2).
Peripapillary capillary density (PCD) maps enable a custom image analysis that provides qualitative and quantitative analysis of perfused peripapillary capillaries. In PCD maps we can analyze capillary density through colors, where the warm colors (yellow, orange and red) present regular, dense RPC, while cold colors, such as light and dark blue, reflect loss of RPC and ischaemia (3).
In POAG, segments with decreased RNFL thickness show lower peripapillary capillary density on PCD maps, while in patients with descendent optic nerve atrophy, lower peripapillary capillary density can be present before the decrease of RNFL thickness in correspondent segment appears. Decreased PCD may be the earliest sign of progressive optic nerve damage (4).
2. AIM
The aim of the study is to correlate RPC density values and retinal nerve fibre layer (RNFL) thickness in eight peripapillary segments in patients with a primary open-angle glaucoma (POAG) who have disease under 10 years, over 10 years and in a group of healthy patients.
3. METHODS
In this cross-sectional review, three groups of patients were enrolled: POAG patients under 10 years of disease duration, patients with POAG for over 10 years and control group of healthy individuals without any signs and symptoms of glaucoma. First group of patients with POAG under 10 years of disease duration counted 26 patients in total, 6 of which male and 20 female. In second group with over 10 years of POAG disease there were 20 patients, 11 of which male and 9 female. Control group counted 24 individuals in total, 10 males and 14 females. First group was 61,0 average years of age (51,75-70,0 years), second group was 72,5 years of age (61,5-76,25 years). Control group was of 50 years of age (29,5-61,0 years).
Patients were scanned on a commercial optical coherence tomography angiography (OCT-A) system (AngioVue, Avanti RTVue-XR, Optovue, CA). We measured and analyzed sectoral perfused capillary density values, PCD maps. Also, OCT RNFL thickness were analyzed between groups and data was compared.
Inclusion criteria for the study were: male and female older than 18, patients with confirmed diagnosis of POAG more or less than 10 years.
Exclusion criteria for the study were: younger than 18, acute ocular pathology, patients with previous ocular surgery, pregnancy, high myopia, amblyopia.
Statistical analysis
Results were analyzed using standard statistical methods, using SPSS computer software for statistical analysis (SPSS Statistical Package for Social Sciences) version 13.0. Results are presented as median and interquartile range (25-75 percentile), as mean ± SEM, and as percentage value (%). To test the significance of the difference in deviation from the normal distribution, Kolmogorov-Smirnov test was used. The results are analyzed by appropriate non-parametric tests (Wilcoxon and Friedman Tests). Values of p<0,05 are considered as statistically significant, and values of p<0,001 as statistically highly significant.
4. RESULTS
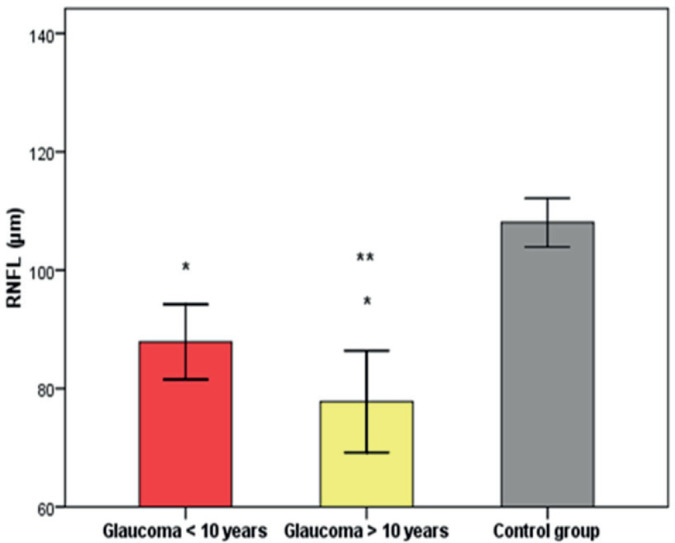
RNFL thickness was significantly lower (p<0,001) in patients with glaucoma more than ten years (RNFL thickness = 77.8 ± 4.1 μm) compared to glaucoma less than ten years (RNFL thickness = 87.9 ± 3.1 μm) and control group (RNFL thickness = 108.04 ± 1.9 μm).
Mean RPC density values in both superior segments (S1, S2) were significantly lower (p<0,05) in patients with glaucoma over ten years of duration, compared to patients with glaucoma less ten years of disease duration. There was no statistically significant difference in other parameters between other groups.
A significant positive correlation between RNFL thickness and RPC Density was found in all segments. High positive significance (p<0,001) was found between RNFL thickness and RPC density in both parts of nasal quadrant.
A significant positive correlation was found between RNFL thickness and RPC Density in all analyzed segments, except in inferior (I1), which was non significant. High positive significance (p<0,001) was found between RNFL thickness and RPC density in superior (S2) and temporal (T1) segments.
5. DISCUSSION
So far, only small number of studies compared OCT-A metrics such as RNFL and RPC across POAG disease stages.
We found that RNFL thickness decreases across POAG stages, as well as when compared to healthy subjects. Also, RPC density values in superior sectors decrease with glaucoma development and advancement. There was a positive correlation between RNFL thickness and RPC Density in all sectors in both groups.
Holló G. (5) presented study in 2016, in which he analyzed vessel density and RNFL in three peripapillary sectors in normal eyes, as well as in eyes with ocular hypertension and POAG. He investigated also the relationship between RNFL damage and peripapillary angio-flow density (PAFD) in the superotemporal (ST), inferotemporal (IT) and temporal (T) peripapillary sectors in three groups. He concluded that in patients with glaucoma with RNFL defect in ST and IT sectors, the value of PAFD declined to 32-45%. In comparison, PAFD value was 60% in healthy eyes. In this study, we presented a positive correlation between RNFL thickness and RPC Density in S, I, N, T segments. Our results also showed that RNFL thickness was significantly lower (p<0,001) in patients with glaucoma more than ten years compared to glaucoma less than ten years and control group.
Yarmohammadi et al. (6) conducted a study the same year in which he investigated the connection between RNFL thickness and OCT-A retinal vasculature measurements in 164 participants’ eyes - healthy eyes, glaucoma-suspect eyes and glaucoma patients. Mean vessel density had significantly lower values in open angle glaucoma eyes, compared to healthy individuals and glaucoma-suspect eyes (p<0,001). He found that OCTA vessel density had similar diagnostic accuracy to RNFL thickness measurements.
Mansoori T. et al. (7) presented a study in 2017 in purpose to compare RPC density between healthy eyes and patients with POAG, using OCTA. There were 76 participants enrolled, 52 of which healthy subjects and 24 of which with diagnosis of POAG. RPC density was lower in inferotemporal (p=0,002) and superotemporal (p=0,008) sectors in POAG group compared to healthy controls, as well as corresponding focal RNFL defect.
During 2017, Geyman et al. (8) investigated peripapillary perfused capillary density (PCD) in patients with POAG across stage of disease. In this cross-sectional study, 60 eyes with POAG in different stages and 24 healthy eyes were enrolled. Their results showed that PCD progressively decreases with POAG stage advancement. Conclusion of this study was that proper PCD analysis may be an useful tool in monitoring and following patients with POAG across stages.
That is correlated to our study, where we found that mean RPC density values in both superior segments (S1, S2) were significantly lower in patients with glaucoma over ten years of duration, compared to patients with glaucoma less ten years of disease duration.
In the same year, Mansoori T. et al. (9) analyzed the role of RPC density in the functioning of the RNFL in only healthy eyes and demonstrated that there was symmetry in superior and inferior sectors, as well as at the nasal and temporal poles.
In a retrospective study, Scripsema et al. (10) compared perfused PCD in POAG, normal-tension glaucoma (NTG) and normal patients, using OCTA. They included 40 patients with POAG, 26 with NTG and 26 healthy patients. Later, they demonstrated that PCD in POAG and NTG group was significantly lower compared to normal patients (p<0,001 in both groups), which was also in correlation with our results.
6. CONCLUSION
OCT-A offers insights into the perfusion status of the peripapillary region by identifying perfused vessels and quantifying the overall density of perfused vessels. Color maps can easily identify regions of decreased perfused vessel density. Visualization of perfused peripapillary capillaries by the OCT-A becomes an attractive imaging modality for assessing glaucoma and other optic nerve head diseases. PCD maps and new angiography technologies may provide an earliest functional sign of progressive optic nerve disease and new insights into the pathophysiology of glaucomatous damage.
Figure 1. RNFL in patients with Glaucoma<10 years, Glaucoma>10 years and Control group; *p<0.001 compared with Glaucoma<10 years and Control group; ** p<0.05 compared to Glaucoma<10 years; RNFL – retinal nerve fibre layer.
Picture 1. PCD maps, left eye: A. Peripapillary capillary vessel density in quadrants; B. RNFL thickness in quadrants; S – superior quadrant, I – inferior quadrant, T – temporal quadrant, N – nasal quadrant.
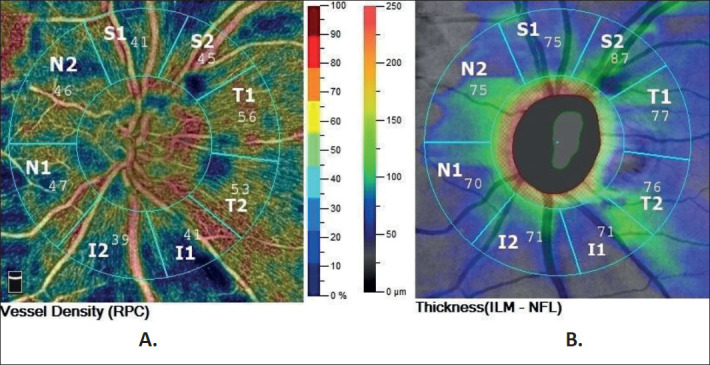
Table 1. RPC Density by segments in patients with Glaucoma > 10 years and patients with Glaucoma < 10 years; S – superior quadrant, I – inferior quadrant, T – temporal quadrant, N – nasal quadrant; RPC – radial peripapillary capillaries.
| RPC (%) | Glaucoma<10 years (n=26) | Glaucoma>10 years (n=20) | p value |
|---|---|---|---|
| RPC S1 | 44.0 (41.75–48.5) | 40.5 (20.0 -46.0) | 0.032 |
| RPC S2 | 54.0 (45.75 – 55.0) | 48.0 (34.25 – 51.75) | 0.033 |
| RPC I2 | 52.0 (46.5 – 57.25) | 44.5 (38.5 -53.75) | 0.055 |
| RPC N2 | 45.0 (38.75 – 48.25) | 44.0 (36.25 – 47.0) | 0.340 |
| RPC T1 | 55.0 (50.75 -57.25) | 53.0 (44.5 – 56.0) | 0.131 |
| RPC T2 | 53.0 (47.75 – 55.0) | 49.0 (43.0 – 53.0) | 0.172 |
| RPC N1 | 44.0 (41.5 – 49.25) | 45.5 (30.0 – 48.0) | 0.346 |
| RPC I1 | 44.5 (38.75 – 51.25) | 43.0 (37.5 – 48.0) | 0.399 |
Table 2. Correlation between RNFL and RPC Density in patients with glaucoma less than ten years disease duration; S – superior quadrant, I – inferior quadrant, T – temporal quadrant, N – nasal quadrant; RPC – radial peripapillary capillaries; RNFL – retinal nerve fibre layer.
| RPC (%) | RNFL (μm) | |
|---|---|---|
| RPC N2 | rho=0.726 | p<0.001 |
| RPC N1 | rho=0.639 | p<0.001 |
| RPC I2 | rho=0.614 | p=0.001 |
| RPC S1 | rho=0.600 | p=0.001 |
| RPC I1 | rho=0.550 | p=0.004 |
| RPC S2 | rho=0.478 | p=0.014 |
| RPC T2 | rho=0.471 | p=0.015 |
| RPC T1 | rho=0.405 | p=0.04 |
Table 3. Correlation between RNFL and RPC Density in patients with glaucoma more than ten years disease duration; S – superior quadrant, I – inferior quadrant, T – temporal quadrant, N – nasal quadrant; NS – nonsignificant; RPC – radial peripapillary capillaries; RNFL – retinal nerve fibre layer.
| RPC (%) | RNFL (μm) | |
|---|---|---|
| RPC S2 | rho=0.719 | p<0.001 |
| RPC T1 | rho=0.706 | p<0.001 |
| RPC S1 | rho=0.654 | p=0.002 |
| RPC I2 | rho=0.610 | p=0.004 |
| RPC N2 | rho=0.549 | p=0.01 |
| RPC N1 | rho=0.514 | p=0.02 |
| RPC T2 | rho=0.512 | p=0.02 |
| RPC I1 | rho=0.423 | NS |
Author’s contribution:
All authors were included in all steps of preparation this article. Final proof reading was made by the first author.
Conflict of interest:
None declared.
Financial support and sponsorship:
Nil.
REFERENCES
- 1.Mendis KR, Balaratnasingam C, Yu P, Barry CJ, McAllister IL, Cringle SJ, Yu D. Correlation of Histologic and Clinical Images to Determine the Diagnostic Value of Fluorescein Angiography for Studying Retinal Capillary Detail. 2010;51:5864–5869. doi: 10.1167/iovs.10-5333. [DOI] [PubMed] [Google Scholar]
- 2.Mase T, Ishibazawa A, Nagaoka T, Yokota H, Yoshida A. Radial Peripapillary Capillary Network Visualized Using Wide-Field Montage Optical Coherence Tomography Angiography. Invest. Ophthalmol. Vis Sci. 2016;57(12):5454. doi: 10.1167/iovs.15-18877. [DOI] [PubMed] [Google Scholar]
- 3.Fard MA, Suwan Y, Moghimi S, Geyman LS, Chui TY, Rosen RB, et al. Pattern of peripapillary capillary density loss in ischemic optic neuropathy compared to that in primary open-angle glaucoma. Plos One. 2018;13(1) doi: 10.1371/journal.pone.0189237. [DOI] [PMC free article] [PubMed] [Google Scholar]
- 4.Gür Güngör S, Akman A, Küçüködük A, Çolak M. Retinal Nerve Fiber Layer Thicknesses in Three Different Optic Nerve Head Size Groups Measured by Cirrus Spectral Domain Optical Coherence Tomography. Türk Oftalmoloji Dergisi. 2016;46(2):58–61. doi: 10.4274/tjo.29567. [DOI] [PMC free article] [PubMed] [Google Scholar]
- 5.Holló G. Vessel Density Calculated from OCT Angiography in 3 Peripapillary Sectors in Normal, Ocular Hypertensive, and Glaucoma Eyes. European Journal of Ophthalmology. 2016;26(3):42–45. doi: 10.5301/ejo.5000717. [DOI] [PubMed] [Google Scholar]
- 6.Yarmohammadi A, Zangwill LM, Diniz-Filho A, Suh MH, Manalastas PI, Fatehee N, et al. Optical Coherence Tomography Angiography Vessel Density in Healthy, Glaucoma Suspect, and Glaucoma Eyes. Investigative Opthalmology and Visual Science. 2016;57(9):OCT451. doi: 10.1167/iovs.15-18944. [DOI] [PMC free article] [PubMed] [Google Scholar]
- 7.Mansoori T, Sivaswamy J, Gamalapati JS, Balakrishna N. Radial Peripapillary Capillary Density Measurement Using Optical Coherence Tomography Angiography in Early Glaucoma. Journal of Glaucoma. 2017;26(5):438–443. doi: 10.1097/IJG.0000000000000649. [DOI] [PubMed] [Google Scholar]
- 8.Geyman LS, Garg RA, Suwan Y, Trivedi V, Krawitz BD, Mo S, et al. Peripapillary perfused capillary density in primary open–angle glaucoma across disease stage: an optical coherence tomography angiography study. British Journal of Ophthalmology. 2017;101(9):1261–1268. doi: 10.1136/bjophthalmol-2016-309642. [DOI] [PubMed] [Google Scholar]
- 9.Mansoori T, Sivaswamy J, Gamalapati JS, Agraharam SG, Balakrishna N. Measurement of Radial Peripapillary Capillary Density in the Normal Human Retina Using Optical Coherence Tomography Angiography. Journal of Glaucoma. 2017;26(3):241–246. doi: 10.1097/IJG.0000000000000594. [DOI] [PubMed] [Google Scholar]
- 10.Scripsema NK, Garcia PM, Bavier RD, Chui TYP, Krawitz BD, Mo S, et al. Optical Coherence Tomography Angiography Analysis of Perfused Peripapillary Capillaries in Primary Open-Angle Glaucoma and Normal-Tension Glaucoma. Investigative Opthalmology and Visual Science. 2016;57(9) doi: 10.1167/iovs.15-18945. [DOI] [PubMed] [Google Scholar]