

Abstract
Background -
We examined how expanding electrocardiographic (ECG) trait genome-wide association studies (GWAS) to include ancestrally diverse populations, prioritize more precise phenotypic measures, and evaluate evidence for shared genetic effects enabled the detection and characterization of loci.
Methods -
We decomposed 10-second, 12-lead ECGs from 34,668 multiethnic participants (15% African American; 30% Hispanic/Latino) into six contiguous, physiologically-distinct (P wave, PR segment, QRS interval, ST segment, T wave, and TP segment) and two composite, conventional (PR interval and QT interval) interval-scale traits and conducted multivariable-adjusted, trait-specific univariate GWAS using 1000-G imputed SNPs. Evidence of shared genetic effects was evaluated by aggregating meta-analyzed univariate results across the six continuous ECG traits using the combined phenotype adaptive sum of powered scores test (aSPU).
Results -
We identified six novel (CD36, PITX2, EMB, ZNF592, YPEL2, and BC043580) and 87 known loci (aSPU p-value<5E-9). Lead SNP rs3211938 at CD36 was common in African Americans (minor allele frequency=10%), near-monomorphic in European Americans, and had effects on the QT interval and TP segment that ranked among the largest reported to date for common variants. The other five novel loci were observed when evaluating the contiguous, but not the composite ECG traits. Combined phenotype testing did not identify novel ECG loci unapparent using traditional univariate approaches, although this approach did assist with the characterization of known loci.
Conclusions -
Despite including one-third as many participants as published ECG trait GWAS, our study identified six novel loci, emphasizing the importance of ancestral diversity and phenotype resolution in this era of ever-growing GWAS.
Keywords: electrophysiology, genetic epidemiology, diverse populations, Genome Wide Association Study, cardiovascular disease
Journal Subject Terms: Electrophysiology; Genetic, Association Studies
Introduction
Genetic susceptibility underlies a majority of common diseases and traits, as demonstrated by genome-wide association studies (GWAS) that have identified thousands of genetic loci for cardiovascular, cardiometabolic, cancer, kidney, psychiatric, ocular, inflammatory, and neuromuscular traits1. Together, these GWAS have revealed common threads underlying the genetic architecture of complex diseases and traits, as well as research gaps. For example, evidence of shared genetic effects (i.e., pleiotropy) is widespread, even for traits with few known etiologic links2,3. Yet few studies have systematically examined evidence of shared genetic effects, thereby missing opportunities to identify and characterize master regulators as strong candidates for intervention2,4. There is also limited racial/ethnic diversity in published GWAS, as the majority (>80%) of GWAS have been conducted in European ancestral populations3. Limited diversity leads to a biased view of human variation that hinders translation of genetic associations into clinical and public health applications for all populations5,6. Further, the scale and collaborative nature of GWAS prioritize traits that are widely available, although these traits may not precisely capture phenotypic variation and underlying biology7,8. Together, these research gaps argue for expanding GWAS analyses to systematically examine evidence of shared genetic effects across a spectrum of biologically motivated traits in multi-ethnic populations.
Electrocardiograms (ECG) measure a sequence of distinct electrophysiological processes in the myocardium that underlie cardiac conduction and repolarization. ECG traits have high heritability9, are relevant to cardiovascular health10, and allow opportunities for dense phenotyping11. Moreover, there are few racially/ethnically diverse GWAS of ECG traits12. Therefore, ECG traits are well suited for assessing the degree to which increased racial/ethnic diversity, evaluation of genetic effects shared across phenotypes, and improved phenotype resolution can enhance locus identification and characterization. We therefore examined individual and shared genetic effects underlying six contiguous measures of the ECG waveform spanning an average heartbeat using data from the multi-ethnic Population Architecture using Genetic Epidemiology (PAGE) study and the Multi-Ethnic Study of Atherosclerosis (MESA). Our results illustrate the broad utility of multi-ethnic GWAS of carefully constructed individual and aggregate traits to illuminate the biology of complex diseases and traits.
Methods
Methods for this paper are detailed in online supplementary material.
Summary-level (PAGE) and individual-level (ARIC, HCHS/SOL, MESA, and PAGE) data are available at DbGaP (https://www.ncbi.nlm.nih.gov/gap/, accession numbers phs000090.v1.p1 [ARIC], phs000810.v1.p1 [HCHS/SOL], phs000293.v1 [MESA], phs000.56.v1.p1 [PAGE], and phs000200.v1 [WHI]).
The institutional review board of the University of North Carolina at Chapel Hill determined this study as exempt from review, further each participating study was approved by the institutional review board at the respective sites, and all participants provided written consent.
Results
Sample description
Of the 39,538 participants with GWAS and ECG data in ARIC, HCHS/SOL, MESA, and WHI, 34,668 (88%) met all inclusion criteria (Table S1, Table S2). Seventy-five percent of eligible participants were female, the mean age was 55 years, and nearly half were either Hispanic/Latino (30%) or African American (15%) (Table S3). On average, participants were overweight (BMI mean = 29 kg/m2) and had high serum low-density lipoprotein cholesterol (mean = 135 mg/dL). There was a high prevalence of hypertension (49%). Holding all adjustment variables constant, PR segment and TP segment durations were the most strongly correlated among the six ECG traits (partial correlation ρ=−0.64), whereas T wave and P wave durations (ρ=−0.01) was largely uncorrelated (Table S4). P wave and QRS interval were the only two ECG traits with significant and positive genetic correlations (rg=0.27; p=0.05) (Table S5).
Overview of association results
Approximately 22M SNPs met our inclusion criteria (Table S6) and were evaluated in our combined phenotype multi-ethnic analysis of six contiguous ECG traits, our primary analysis (Figures S1, S2). Lead SNPs at 82 of 149 loci (56%) previously reported by 26 interval scale ECG trait GWAS analyses (Table S7) were identified at genome-wide significance in our multi-ethnic population. The identification of known loci varied by trait (Table S8), ranging from 21 of 45 (47%) loci for QRS interval to nine of 14 (64%) loci for P wave. When using a lower significance threshold of paSPU<0.0003 (0.05/149), 123 of the 149 (83%) previously recognized interval scale ECG trait loci were identified.
An additional six loci identified by our primary analysis were >2 Mb away from all lead SNPs previously reported by interval scale ECG trait GWAS and are presented as novel (Table 1, Figure 2). As described below, our results highlight the utility of phenotype decomposition, ancestral diversity, and combined-phenotype testing for the identification and characterization of complex trait loci.
Table 1.
Novel genome wide-significant (paSPU < 5×10⁻⁹) loci discovered in genome-wide association study of six contiguous electrocardiographic traits that decompose an average heartbeat in N=34,668 participants from the multi-ethnic Population Architectures using Genomics and Epidemiology study (PAGE) and the Multi-Ethnic Study of Atherosclerosis (MESA)
| Coded allele |
Non- coded allele |
Contiguous ECG traits | Composite ECG traits | ||||||||||||||
|---|---|---|---|---|---|---|---|---|---|---|---|---|---|---|---|---|---|
| Lead SNP | Cnr | Position | Locus | AA | EA | CHN | HIS | P wave | PR segment | QRS interval | ST segment | T wave | TP segment | QT interval | PR interval | ||
| rs13143308 | 4 | 111714419 | T | G | PITX2 | 30% | 21% | 74% | 39% | 2×10⁻¹¹ | 5×10⁻⁴ | 2×10⁻¹ | 3×10⁻² | 3×10⁻¹ | 1×10⁻¹ | 4×10⁻¹ | 8×10⁻¹ |
| rs4340921 | 5 | 49687697 | C | T | EMB | 66% | 46% | 49% | 44% | 8×10⁻¹³ | 8×10⁻¹ | 1×10⁻³ | 7×10⁻¹ | 2×10⁻¹ | 2×10⁻⁴ | 7×10⁻¹ | 2×10⁻³ |
| rs3211938 | 7 | 80300449 | G | T | CD36 | 10% | <0.01% | <0.01% | 1% | 2×10⁻⁵ | 8×10⁻³ | 5×10⁻³ | 4×10⁻¹ | 1×10⁻⁵ | 1×10⁻¹³ | 6×10⁻¹⁰ | 6×10⁻⁶ |
| rs11073663 | 15 | 85260268 | A | G | ZNF592 | 27% | 54% | 19% | 48% | 4×10⁻¹ | 3×10⁻¹⁰ | 5×10⁻¹ | 4×10⁻¹ | 2×10⁻³ | 7×10⁻³ | 2×10⁻² | 6×10⁻⁷ |
| rs142166837 | 17 | 57471022 | C | T | YPEL2 | 31% | 52% | 32% | 49% | 5×10⁻² | 6×10⁻¹ | 1×10⁻³ | 1×10⁻¹ | 4×10⁻¹¹ | 1×10⁻² | 4×10⁻⁷ | 8×10⁻¹ |
| rs13047360 | 21 | 28851580 | G | A | BC043580 | 7% | 17% | 23% | 16% | 7×10⁻¹ | 3×10⁻² | 2×10⁻¹¹ | 2×10⁻¹ | 5×10⁻² | 1×100 | 2×10⁻¹ | 3×10⁻² |
aSPU: adaptive sum of powered tests
AA: African American, CHN: Chinese-American, EA: European-American, HIS: Hispanic/Latinos
Bolded values exceed the genome-wide significance threshold (p<5×10⁻⁹)
Figure 2.
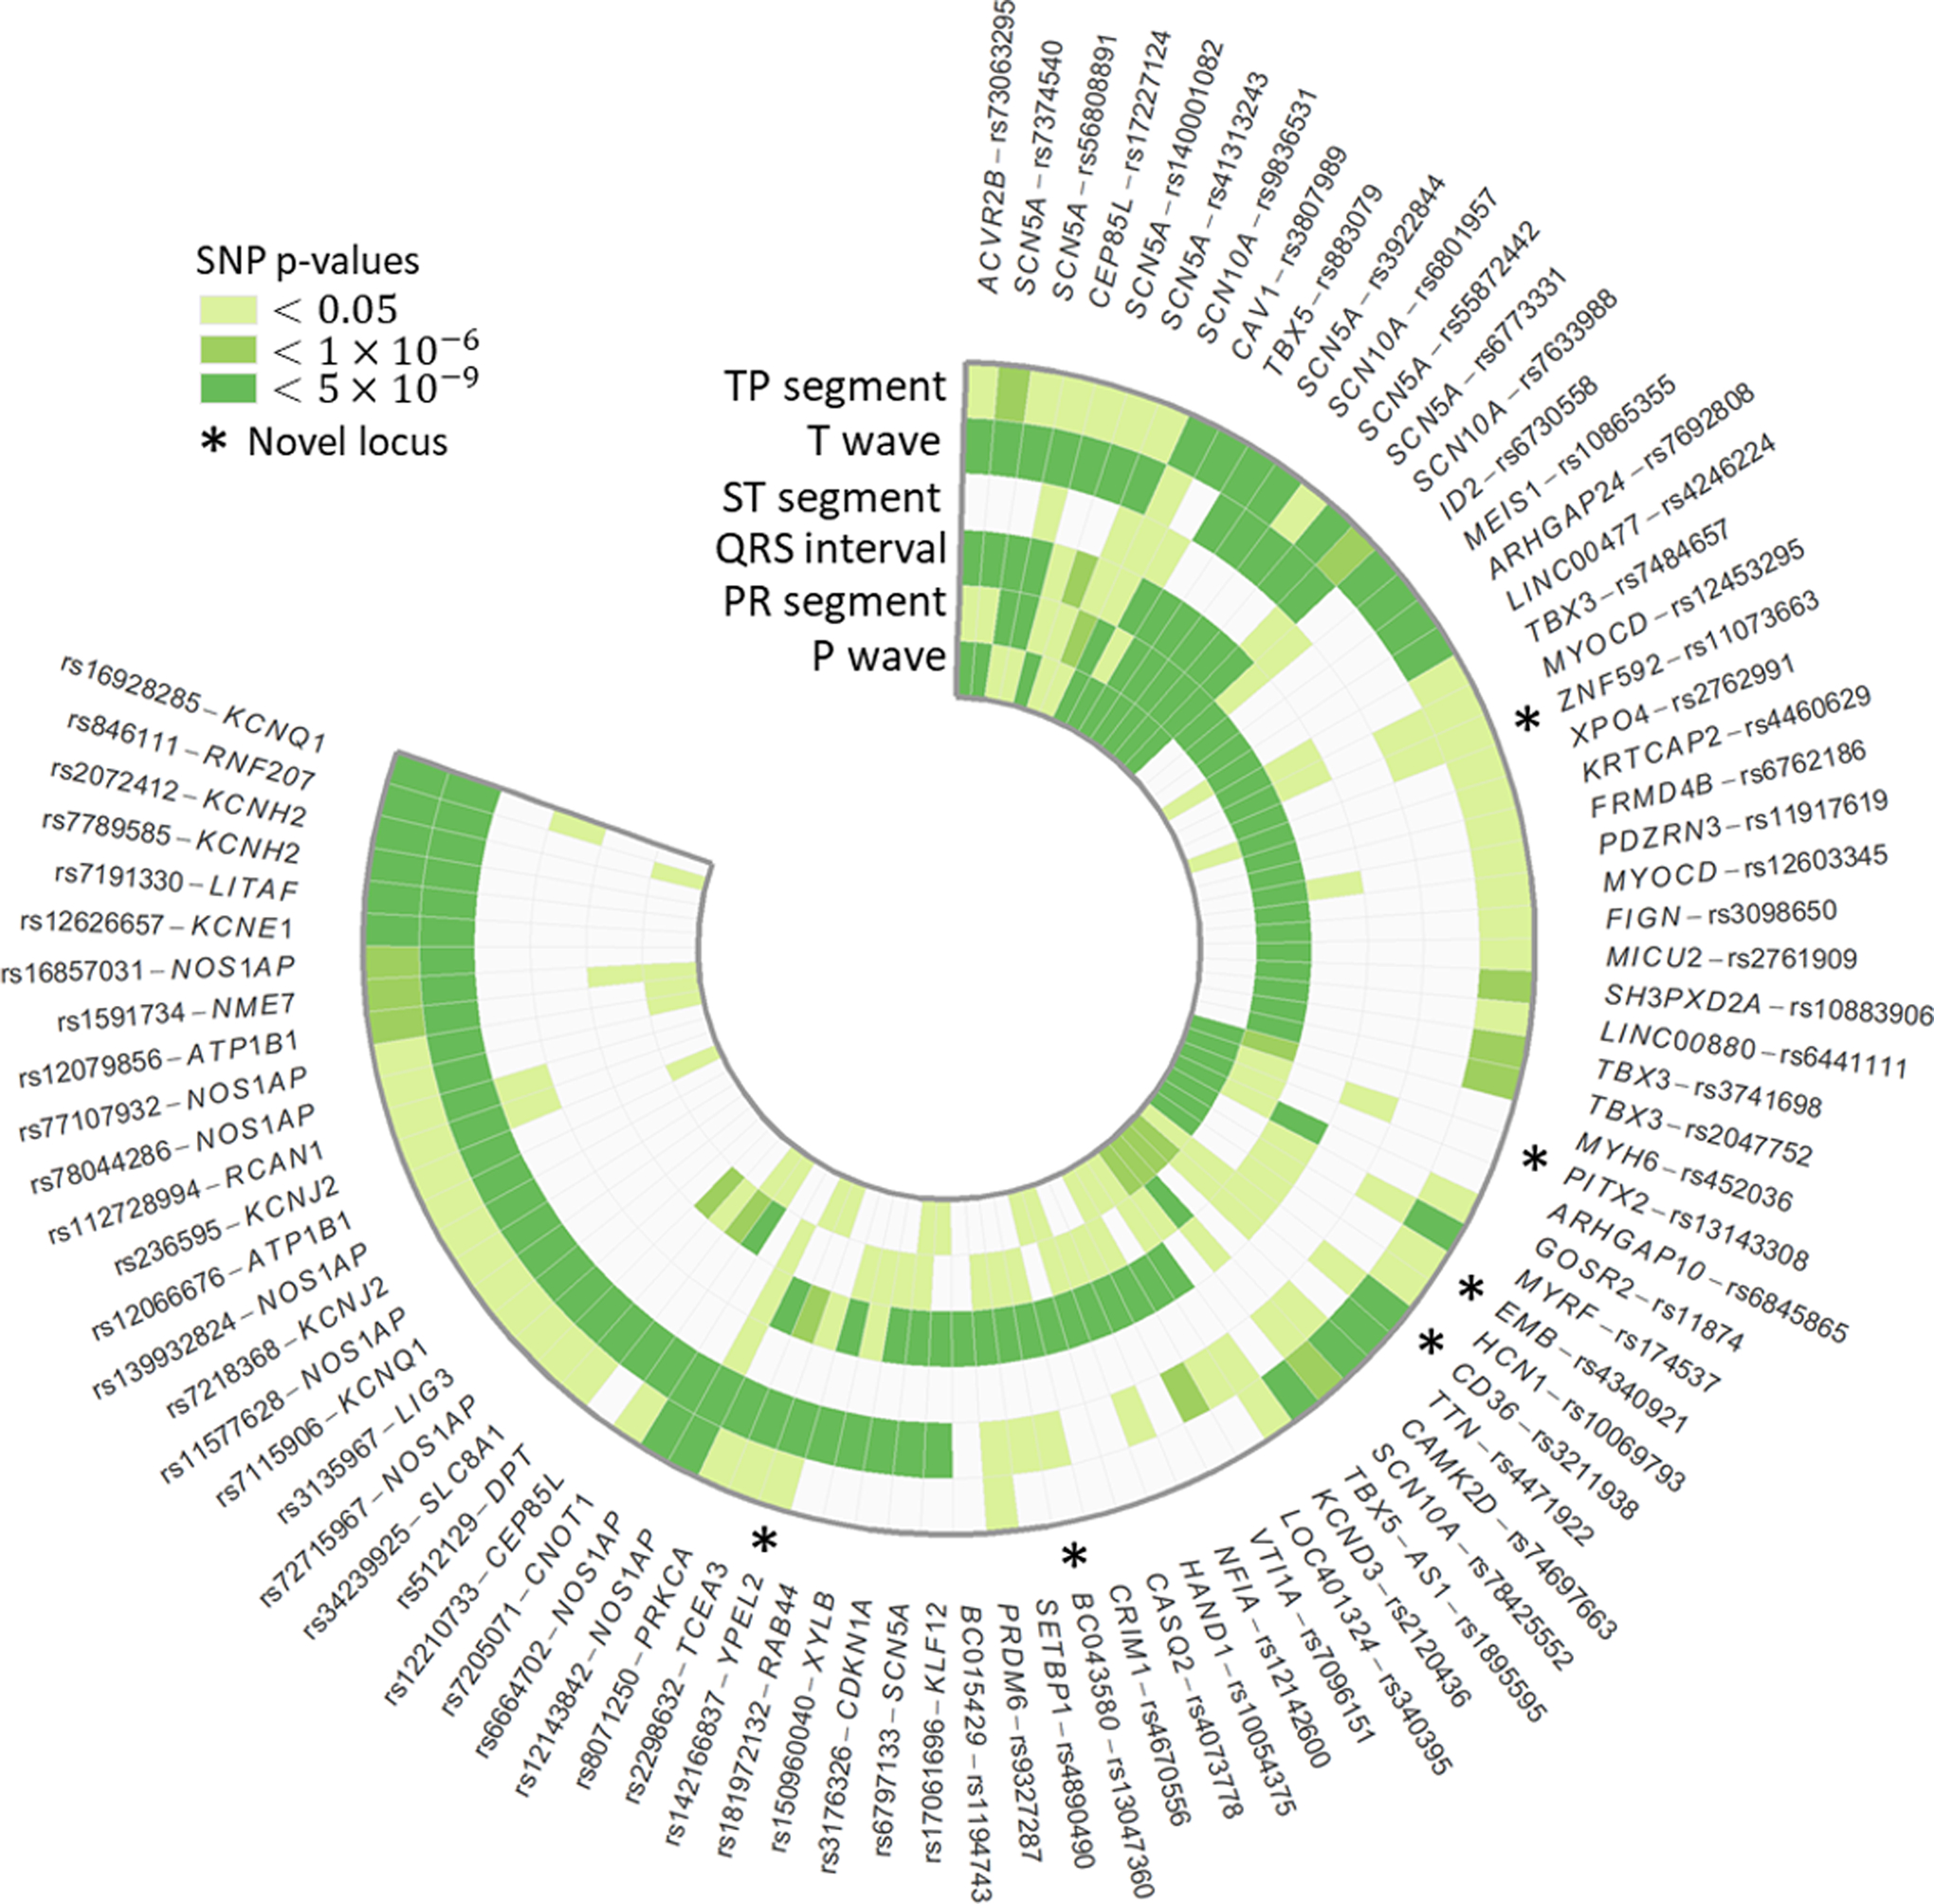
Lead SNPs at 87 loci significantly associated (paspu<5×10⁻⁹) with six contiguous ECG traits spanning an average heartbeat, in n=34,668 multi-ethnic participants in the Population Architecture Using Genomics and Epidemiology study and Multi-Ethnic Study of Atherosclerosis. Outer stars denote novel loci and darker shades of green indicate lower p-values. To aid interpretation, lead SNPs were organized into broadly similar groups using hierarchical cluster analysis.
Phenotype decomposition
Of the six novel loci identified in our primary multi-ethnic combined phenotype analysis, accompanying univariate analyses indicated that lead SNPs primarily affected P wave (PITX2, EMB), TP segment (CD36), PR segment (ZNF592), T wave (YPEL2), and QRS interval (BC043580). None of the novel loci were associated with ST segment. Further, the combined phenotype analysis did not identify novel loci beyond univariate analysis.
We then contrasted results for the six contiguous ECG traits with results from the two composite ECG traits, QT interval (QRS interval + ST segment + T wave) and PR interval (P wave + PR segment) (Figure S3). CD36 was the only novel locus identified for both a contiguous (TP segment) and a composite (QT interval) ECG trait (Table 1). We also examined evidence of consistency of SNP effects by grouping traits according to whether they affected atrial (PR interval, PR segment, and P wave) or ventricular (QT interval, QRS interval, T wave, and ST segment) conduction. For atrial traits, novel loci identified for the contiguous traits had varying directions of effects (Figure S3a, Table S9), which when combined resulted in near-zero estimated effects for the composite trait. For example, every copy of the T allele for PITX2 lead SNP rs13143308 increased P wave duration by 0.63 milliseconds [ms] (punivariate=2×10⁻¹¹), but shortened the PR segment by 0.58 ms (punivariate=6×10⁻⁴). However, when evaluated together as the composite trait PR interval, every copy of the rs13143308 T allele prolonged the PR interval by 0.03 ms (punivariate=0.84). Similarly, among the 59 loci associated with ventricular conduction, two of the three novel loci (rs142166837 and rs13047360) had opposite effects on QRS interval and T wave duration, which did not reach genome-wide significance when summed for the composite trait QT interval (Figure S3b, Table S9). There were no instances of either PR or QT interval identifying a novel locus not associated with any of the six contiguous traits at the genome-wide level.
Ancestral diversity
Lead SNPs at five of the six novel loci were common (MAF >5%) across ancestral populations, with modest evidence of heterogeneity of effect across race/ethnicity (Table S10). One locus (CD36) showed evidence of population specificity, with lead SNP rs3211938 near-monomorphic in European and Chinese populations (MAF<0.01%), infrequent in Hispanic/Latinos (MAF=1%), and common in African Americans (MAF=10%). Variant rs3211938 showed genome-wide significant associations with TP segment (punivariate=1×10⁻¹³) and QT interval (punivariate=6×10⁻¹⁰) and nominal associations with P wave (punivariate=2×10⁻⁵), PR segment (punivariate=0.008), and QRS interval (punivariate=0.005). Although no GWAS of TP segment has been published, each copy of the rs3211938 G allele increased QT interval by 3.70 ms. Reported effects for common (MAF>5%) QT lead SNPs range from 0.5 ms to 3.5 ms13. SNP rs3211938 was either genotyped or well-imputed across studies and ancestry groups (imputation quality > 0.98, Table S11).
Combined phenotype analyses
We found widespread evidence of shared genetic effects across ECG traits, with aSPU gamma scores that varied substantially across lead SNPs (Table S9). One fourth of lead SNPs identified as genome-wide significant (paspu<5×10⁻⁹) had univariate associations with at least two ECG traits (pUnivariate<5×10⁻⁹). Lead SNPs at ACVR2B, SCN5A, SCN10A, CEP85L, CAV1, and TBX5 were associated with three or more ECG traits at univariate genome-wide significance levels. As expected, traits that were more highly correlated also showed stronger evidence of shared genetic effects, with 10 of the 20 lead SNPs that were associated with PR segment also showing genome-wide associations with TP segment. However, evidence of shared genetic effects among uncorrelated traits was also observed. For example, eight genome-wide significant SNPs at SCN5A, SCN10A, CEP85L, and CNOT1 exhibited significant univariate associations with both the T wave and P wave, despite low correlation between the two traits (ρ = −0.01).
There also was evidence of allelic heterogeneity for multiple ECG traits. As an example, five signals in low LD (r2 < 0.1) were detected within a 500 kb region near the previously identified locus TBX5, each associated with a distinct combination of ECG traits. Lead variants at these five independent signals remained genome-wide significant after sequential conditional analyses (results not shown). Two of the five independent signals (rs3741698 and rs2047752) were largely specific to PR segment (Figure 3). The other three signals involved PR segment and QRS interval (lead SNP rs4784657), P wave, QRS interval, and TP segment (lead SNP rs883079), and the combined phenotype only (lead SNP rs1895595). Lead SNPs also showed some evidence of variation across traits, including the locus identified by lead SNP rs7484657, for which p-values for the QRS interval lead SNP differed by approximately three orders of magnitude from the rs7484657 p-value.
Figure 3.
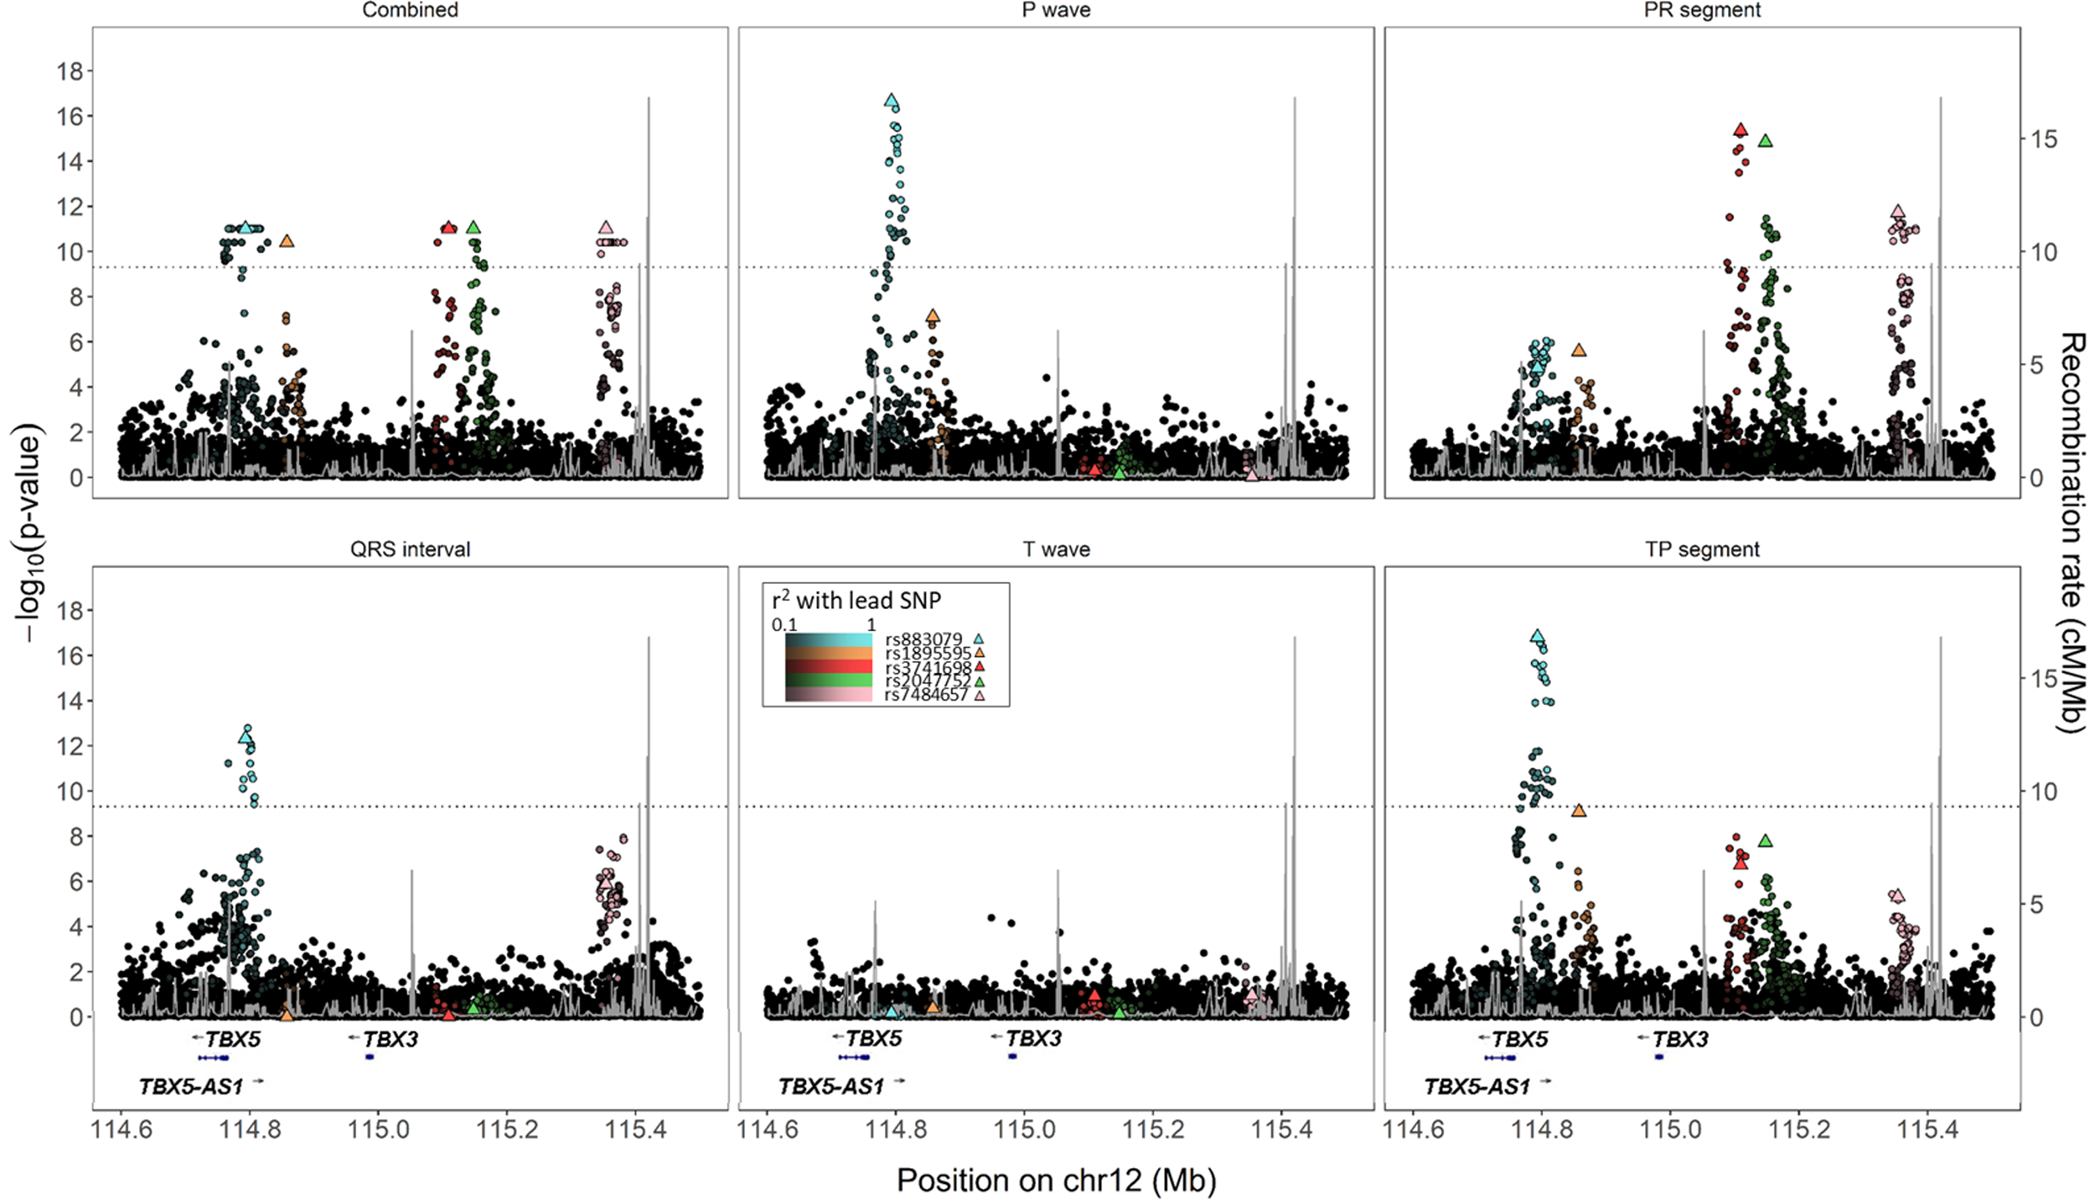
Regional SNP associations and linkage disequilibrium at four independent signals near TBX5 among 34,668 participants with electrocardiographic data in the Population Architectures using Genomics and Epidemiology (PAGE) study and Multi-Ethnic Study of Atherosclerosis. Lighter colors indicate greater linkage disequilibrium with lead SNPs, and black markers denote SNPs not in LD (r2 < 0.1) with any of the four lead SNPs. Combined phenotype p-values are truncated at 1×10⁻¹¹.
Bioinformatic characterization
The rs3211938 variant is a well-known, non-synonymous protein coding variant causing CD36 deficiency14. For the five remaining novel SNPs, bioinformatics characterization found evidence of genetic regulation, including chromatin marks, and regulatory motifs (Table S12). Each of the novel lead SNPs were either rated as evolutionarily conserved based on the GRASP conservation score, or were in high linkage disequilibrium with another SNP meeting that threshold (R2 > 0.9). In addition, rs1107366 was identified to regulate the expression of several long non-coding RNAs in ECG-relevant tissues (adipose, arterial, atrial tissue).
Discussion
In this study, we examined the extent to which combined multi-ethnic GWAS analyses of carefully selected phenotypes that map to well-defined biology improved detection and characterization of ECG trait loci. We identified six novel loci, five of which were detected only when examining the more precisely defined phenotypes, and a sixth locus that was specific to African ancestral populations. We also showed how leveraging evidence of a shared genetic architecture aided the characterization of known loci, particularly when loci harbored multiple independent signals that differed by trait. In this mega-GWAS era involving predominantly European ancestral populations, this study, conducted in a population one-third the size of the largest published ECG trait GWAS13,15, underscores the merits of prioritizing diversity and phenotype measurement.
Of the three GWAS challenges we examined, our deliberate selection of phenotype measures mapping to well-defined biology largely drove locus discovery, challenging current trends in GWAS that emphasize increased sample size. The growing scale of GWAS, which today can surpass one million participants16, has resulted in the prioritization of commonly available traits (e.g., body mass index) over traits that more precisely capture underlying biology (e.g., direct measures of body fat17). In our case, composite ECG traits PR interval and QT interval have been most commonly interrogated by GWAS. However, these traits represent aggregates of physiologically distinct mechanisms, which may obscure loci with effects localized to, or inconsistent across, individual contiguous traits. This phenomenon was illustrated by the PITX2 locus, a locus associated with atrial fibrillation18. Because PITX2 lead SNP rs13143308 had opposing associations with the contiguous P wave and PR segment, a standard approach using the composite PR interval yielded a near-zero effect, obscuring the potential importance of the locus on atrial function regardless of sample size. These results emphasize the need to balance ongoing investments in large-scale genome measurement with use of precision phenotyping, for instance through efforts like the ongoing Precision Medicine Initiative’s All of Us Research Program19.
The six traits we used in our ECG decomposition were motivated by their relations to physiology, and their coherence as an aggregate electrophysiologic phenotype. While an important complement to traditional, coarser measures like the PR and QT intervals, our phenotype decomposition approach that identified novel loci and improved characterization of known loci captured but a fraction of the full variation in ECG phenotypes. Further phenotypic specificity and additional biologic insight may be offered by GWAS of other ECG traits, including measures of waveform amplitudes, angles, or variability. For example, a recent, as yet unpublished of UK Biobank data used each of the sampled amplitudes recorded on the digital ECG, forming hundreds of distinct ECG measures for separate evaluation in GWAS (https://www.biorxiv.org/content/10.1101/648527v1). Another approach might focus on traits governed by a plausibly-shared genetic architecture, such as ion channel function or cardiac remodeling, potentially assisting efforts to map loci to specific biologic pathways. Further extending combined phenotype ECG trait GWAS to include other phenotypes and traits (e.g. cardiometabolic traits or cardiovascular diseases) also is warranted, given evidence that these traits represent interrelated manifestations of common biologic mechanisms12 and the success of prior combined phenotype studies to disentangle complex biology20. Overall, how to select intermediate traits and integrate such traits with other phenotypic data, including clinical and prognostic information, remains an open question, with best practices that likely will vary across complex traits.
There has been mounting interest in combined phenotype statistical approaches; however, their merits for novel locus discovery and locus characterization remain largely untested in practice. Here, combined phenotype analysis of contiguous ECG traits did not identify novel loci that eluded traditional univariate analyses, despite the theoretical potential demonstrated for aSPU and related methods. Nonetheless, our evaluation of TBX5, a locus harboring multiple independent signals, suggested that combined phenotype approaches may be informative for fine-mapping. Supporting the use of combined phenotype methods to fine-mapping are methods that have been specifically developed for this challenge21, including fastPAINTOR. When compared with single trait fine-mapping, fastPAINTOR reduced the number of SNPs required for follow-up in order to capture 90% of the causal variants, from 23 SNPs per locus using a single trait to 12 SNPs when fine-mapping two traits simultaneously.
The lack of diversity in GWAS has long been described22, but the literature remains dominated by studies of European ancestral populations. As a result, genomics research is confined to a narrow sliver of human genetic diversity, even as the US population becomes more diverse23. Our deliberate selection of an ancestrally diverse population enabled the identification of a novel CD36 locus, which was common only in populations of African descent. Lead SNP, rs3211938, had a large effect on QT interval, among the largest effects reported to-date13, although winner’s curse may be a concern13. Variant rs3211938, a ClinVar-indexed missense mutation known to cause CD36 deficiency, encodes a scavenger receptor central to formation and cellular uptake of long-chain fatty acids. Although CD36 and rs3211938 have been associated with a spectrum of cardiometabolic phenotypes24–31, the most intriguing finding is the potential linkage with sudden cardiac arrest (SCA), for which QT interval prolongation increases risk32. SCA accounts for approximately 10–20% of total mortality in industrial countries33, and several decades of research have suggested a contributory role of impaired fatty-acid uptake in cardiomyocytes14. Although genetic studies of CD36 and SCA were largely null34,35, the use of predominantly European ancestral populations constrained evaluation of rs3211938, which is near monomorphic in all populations except those of African descent. Overall, these results highlight the potential for racially/ethnically diverse studies to provide novel biological insights beyond the reach of studies conducted in predominantly European ancestral populations.
Limitations of our study point to several promising directions for future work. First, we lacked a replication cohort, reflecting the rarity of multi-ethnic studies with high-resolution ECGs from which to derive the six contiguous ECG traits. However, this study is the largest multi-ethnic GWAS of ECGs to-date, with excellent statistical power, and we identified loci that are biologically plausible. Second, we limited our evaluation to common variants, although previous studies have demonstrated the utility of interrogating rare variants, particularly in the context of multi-ethnic studies36,37. Our focus on common variants reflects the current limitations of combined phenotype methods for interrogating rare variants in complex samples or with summary data. Widespread interest in this approach suggests that this gap may be closed soon. Further, while this study helps address the lack of diversity in ECG trait GWAS, the small number of Chinese American participants limited our ability identify loci that were common only in populations of East Asian descent. Future efforts that further expand population racial/ethnic diversity represents an important next both for cardiac conduction studies and GWAS more broadly. Finally, in-depth fine-mapping was outside the scope of the proposed study, despite the value of multi-ethnic populations for fine-mapping38. We also were unable to leverage heterogeneity in allelic effects between ethnic groups to increase statistical power, as available methods are incompatible with the multi-phenotype methods presented herein39. Identification of allelic heterogeneity provides a clear impetus for future studies that leverage evidence of a shared genetic effects to further characterize the genetic architecture underlying ECG traits and, complex traits in general.
This study illustrates three strategies to improve the efficiency of locus discovery. Of these, our findings emphasize the importance of carefully constructed phenotypes and of ancestral diversity for novel locus identification. In contrast, combined phenotype methods did not enable identification of novel loci unapparent using traditional approaches, although combined phenotype studies did inform characterization of known loci. As researchers contemplate the next generation of genomics studies, increased phenotype resolution and ancestral diversity will be crucial to understanding the ever-expanding “phenome,” while ensuring equitable access to precision medicine.
Supplementary Material
Figure 1.
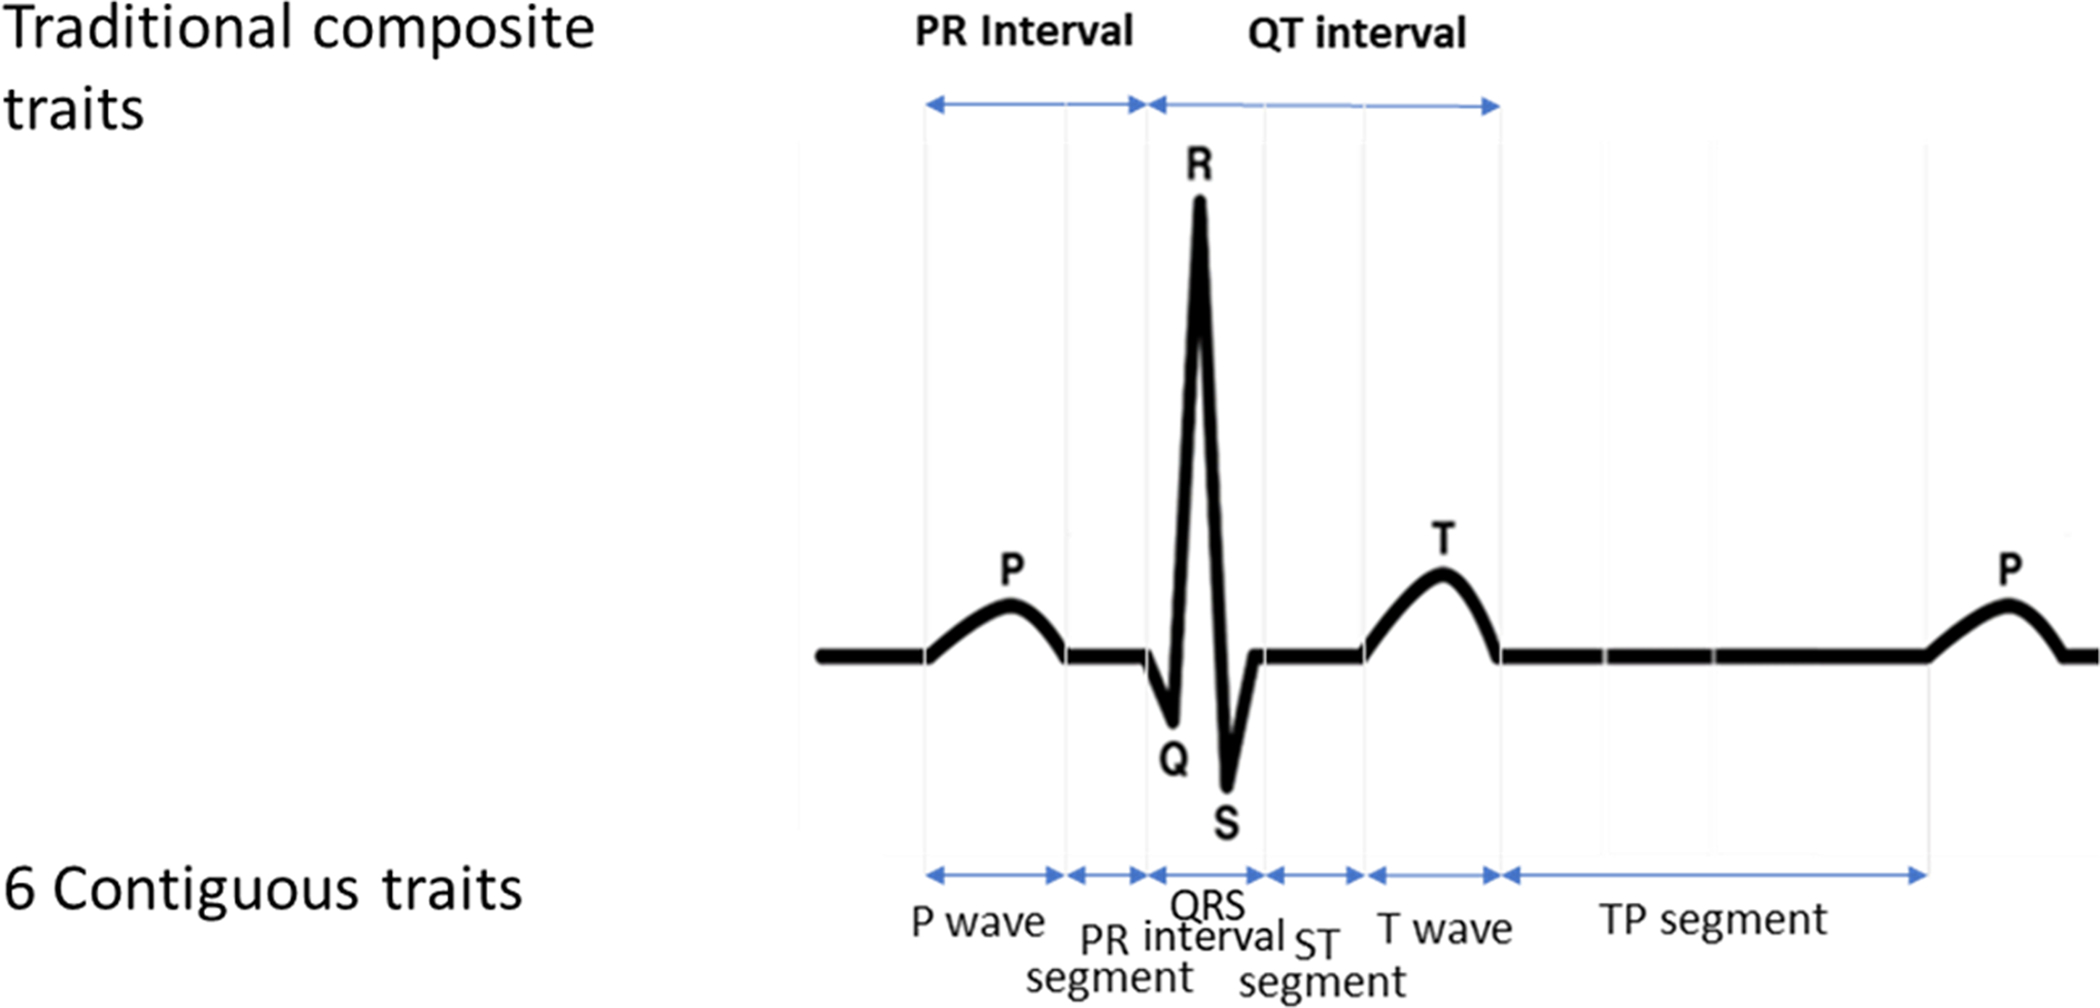
Illustration of the six contiguous (P wave, PR segment, QRS interval, ST segment, and TP segment) and two composite (QT interval and PR interval) ECG traits.
Acknowledgments:
The contents of this paper are solely the responsibility of the authors and do not necessarily represent the official views of the National Institutes of Health.
The PAGE consortium thanks the staff and participants of all PAGE studies for their important contributions. The complete list of PAGE members can be found at http://www.pagestudy.org.
The Stanford Global Reference Panel was created by Stanford - contributed samples and comprises multiple datasets from multiple researchers across the world designed to provide a resource for any researchers interested in diverse population data on the Multi-Ethnic Global Array (MEGA). The authors thank the researchers and research participants who made this dataset available to the community.
The authors thank the WHI investigators and staff for their dedication, and the study participants for making the program possible. A full listing of WHI investigators can be found at: http://www.whiscience.org/publications/WHI_investigators_shortlist.pdf.
The authors thank the staff and participants of the ARIC study for their important contributions. More detail about the ARIC study may be found at: https://sites.cscc.unc.edu/aric/.
Genotyping for MESA was performed at Affymetrix (Santa Clara, California, USA) and the Broad Institute of Harvard and MIT (Boston, Massachusetts, USA) using the Affymetrix Genome-Wide Human SNP Array 6.0. We also thank the other investigators, the staff and the participants of MESA for their valuable contributions. A full list of participating MESA investigators and institutions can be found online (http://www.mesa-nhlbi.org).
The contents of this paper are solely the responsibility of the authors and do not necessarily represent the official views of the National Institutes of Health.
Sources of Funding: PAGE: The Population Architecture Using Genomics and Epidemiology (PAGE) program is funded by the National Human Genome Research Institute with co-funding from the National Institute on Minority Health and Health Disparities. Assistance with data management, data integration, data dissemination, genotype imputation, ancestry deconvolution, population genetics, analysis pipelines, and general study coordination was provided by the PAGE Coordinating Center (NIHU01HG007419). Genotyping services were provided by the Center for Inherited Disease Research, which is fully funded through a federal contract from the National Institutes of Health to The Johns Hopkins University, contract number HHSN268201200008I. Genotype data quality control and quality assurance services were provided by the Genetic Analysis Center in the Biostatistics Department of the University of Washington, through support provided by the Center for Inherited Disease Research contract. PAGE data and materials included in this report were funded through following studies and organizations:
HCHS/SOL: Primary funding support to Dr. North and colleagues is provided by U01HG007416. Additional support was provided via R01DK101855 and 15GRNT25880008. The Hispanic Community Health Study/Study of Latinos was carried out as a collaborative study supported by contracts from the National Heart, Lung, and Blood Institute (NHLBI) to the University of North Carolina (N01-HC65233), University of Miami (N01-HC65234), Albert Einstein College of Medicine (N01HC65235), Northwestern University (N01-HC65236), and San Diego State University (N01-HC65237). The following Institutes/Centers/Offices contribute to the HCHS/SOL through a transfer of funds to the National Heart, Lung, and Blood Institute: National Institute on Minority Health and Health Disparities, National Institute on Deafness and Other Communication Disorders, National Institute of Dental and Craniofacial Research, National Institute of Diabetes and Digestive and Kidney Diseases, National Institute of Neurological Disorders and Stroke, NIH Institution - Office of Dietary Supplements.
PAGE Global Reference Panel: The creation of the Stanford Global Reference Panel was funded by the National Human Genome Research Institute PAGE program (NIH U01HG00 7419)
Women’s Health Initiative (WHI): Funding support for the “Exonic variants and their relation to complex traits in minorities of the WHI” study is provided through the National Human Genome Research Institute PAGE program (NIH U01HG007376). The WHI program is funded by the National Heart, Lung, and Blood Institute, National Institutes of Health, U.S. Department of Health and Human Services through contracts HHSN268201100046C, HHSN268201100001C, HHSN268201100002C, HHSN268201100003C, HHSN268201100004C, and HHSN271201100004C.
Atherosclerosis Risk in Communities Study (ARIC): The Atherosclerosis Risk in Communities study has been funded in whole or in part with Federal funds from the National Heart, Lung, and Blood Institute, National Institutes of Health, Department of Health and Human Services (contract numbers HHSN268201700001I, HHSN268201700002I, HHSN268201700003I, HHSN268201700004I and HHSN268201700005I), R01HL087641, R01HL086694; National Human Genome Research Institute contract U01HG004402; and National Institutes of Health contract HHSN268200625226C. Infrastructure was partly supported by Grant Number UL1RR025005, a component of the National Institutes of Health and NIH Roadmap for Medical Research.
Multi-Ethnic Study of Atherosclerosis (MESA): MESA and the MESA SHARe project are conducted and supported by the National Heart, Lung, and Blood Institute (NHLBI) in collaboration with MESA investigators. Support for MESA is provided by contracts 75N92020D00001, HHSN268201500003I, N01-HC-95159, 75N92020D00005, N01-HC-95160, 75N92020D00002, N01-HC-95161, 75N92020D00003, N01-HC-95162, 75N92020D00006, N01-HC-95163, 75N92020D00004, N01-HC-95164, 75N92020D00007, N01-HC-95165, N01-HC-95166, N01-HC-95167, N01-HC-95168, N01-HC-95169, UL1-TR-000040, UL1-TR-001079, UL1-TR-001420, UL1-TR-001881, and DK063491.. Funding for SHARe genotyping was provided by National Heart, Lung, and Blood Institute Contract N02-HL-64278. Genotyping was performed at Affymetrix (Santa Clara, California, USA) and the Broad Institute of Harvard and MIT (Boston, Massachusetts, USA) using the Affymetrix Genome-Wide Human SNP Array 6.0.
Christy L. Avery, Antoine R. Baldassari, and Colleen M. Sitlani were supported by R01HL142825; Christy L. Avery, Antoine R. Baldassari, and Chani J. Hodonsky, and Heather M. Highland were supported by NIH grant U01HG007416; Eimear E. Kenny is supported by NIH grants U01HG009080, U01HG009610, U01HG109391, and R01HL104608; Chani Hodonsky and Heather M. Highland were supported by T32HL129982; Antoine Baldassari was supported by NIH grant R01ES020836; Nona Sotoodehnia was supported by R01HL116747 and R01HL111089. Dawood Darbar was supported by R01HL138737 and T32HL139439.
Nonstandard Abbreviations and Acronyms
- AA
African-American
- ARIC
Atherosclerosis Risk in Communities Study
- aSPU
Adaptive Sum of Powered score test
- CHN
Chinese-American
- EA
European-American
- ECG
Electrocardiogram
- GWAS
Genome-wide Association Study
- HCHS/SOL
Hispanic Community Health Study / Study of Latinos
- HIS
Hispanic/Latino
- LD
Linkage Disequilibrium
- MAF
Minor Allele Frequency
- MESA
Multi-Ethnic Study of Atherosclerosis
- SNP
Single Nucleotide Polymorphism
- PAGE
Population Architecture using Genomics and Epidemiology study
Footnotes
Disclosures: None
References:
- 1.Visscher PM, Wray NR, Zhang Q, Sklar P, McCarthy MI, Brown MA, Yang J. 10 Years of GWAS Discovery: Biology, Function, and Translation. Am J Hum Genet. 2017;101:5–22. [DOI] [PMC free article] [PubMed] [Google Scholar]
- 2.LeBlanc M, Zuber V, Andreassen BK, Witoelar A, Zeng L, Bettella F, Wang Y, McEvoy LK, Thompson WK, Schork AJ, et al. Identifying Novel Gene Variants in Coronary Artery Disease and Shared Genes With Several Cardiovascular Risk Factors. Circ Res. 2016;118:83–94. [DOI] [PMC free article] [PubMed] [Google Scholar]
- 3.Kanai M, Akiyama M, Takahashi A, Matoba N, Momozawa Y, Ikeda M, Iwata N, Ikegawa S, Hirata M, Matsuda K, et al. Genetic analysis of quantitative traits in the Japanese population links cell types to complex human diseases. Nat Genet. 2018;50:390–400. [DOI] [PubMed] [Google Scholar]
- 4.Price AL, Spencer CCA, Donnelly P. Progress and promise in understanding the genetic basis of common diseases. Proc Biol Sci. 2015;282:20151684. [DOI] [PMC free article] [PubMed] [Google Scholar]
- 5.Popejoy AB, Fullerton SM. Genomics is failing on diversity. Nature. 2016;538:161–164. [DOI] [PMC free article] [PubMed] [Google Scholar]
- 6.Matise TC, Ambite JL, Buyske S, Carlson CS, Cole SA, Crawford DC, Haiman CA, Heiss G, Kooperberg C, Marchand LL, et al. The Next PAGE in Understanding Complex Traits: Design for the Analysis of Population Architecture Using Genetics and Epidemiology (PAGE) Study. Am J Epidemiol. 2011;174:849–859. [DOI] [PMC free article] [PubMed] [Google Scholar]
- 7.Goddard ME, Kemper KE, MacLeod IM, Chamberlain AJ, Hayes BJ. Genetics of complex traits: prediction of phenotype, identification of causal polymorphisms and genetic architecture. Proc Biol Sci. 2016;283. [DOI] [PMC free article] [PubMed] [Google Scholar]
- 8.Timpson NJ, Greenwood CMT, Soranzo N, Lawson DJ, Richards JB. Genetic architecture: the shape of the genetic contribution to human traits and disease. Nat Rev Genet. 2018;19:110–124. [DOI] [PubMed] [Google Scholar]
- 9.Silva CT, Kors JA, Amin N, Dehghan A, Witteman JCM, Willemsen R, Oostra BA, Duijn CM van, Isaacs A. Heritabilities, proportions of heritabilities explained by GWAS findings, and implications of cross-phenotype effects on PR interval. Hum Genet. 2015;134:1211–1219. [DOI] [PMC free article] [PubMed] [Google Scholar]
- 10.Food and Drug Administration, HHS. International Conference on Harmonisation; guidance on E14 Clinical Evaluation of QT/QTc Interval Prolongation and Proarrhythmic Potential for Non-Antiarrhythmic Drugs; availability. Notice. Fed Regist. 2005;70:61134–61135. [PubMed] [Google Scholar]
- 11.MacRae CA, Vasan RS. Next Generation GWAS: Time to Focus on Phenotype? Circ Cardiovasc Genet 2011;4:334–336. [DOI] [PMC free article] [PubMed] [Google Scholar]
- 12.MacArthur J, Bowler E, Cerezo M, Gil L, Hall P, Hastings E, Junkins H, McMahon A, Milano A, Morales J, et al. The new NHGRI-EBI Catalog of published genome-wide association studies (GWAS Catalog). Nucleic Acids Res. 2017;45:D896–D901. [DOI] [PMC free article] [PubMed] [Google Scholar]
- 13.Arking DE, Pulit SL, Crotti L, van der Harst P, Munroe PB, Koopmann TT, Sotoodehnia N, Rossin EJ, Morley M, Wang X, et al. Genetic association study of QT interval highlights role for calcium signaling pathways in myocardial repolarization. Nat Genet. 2014;46:826–836. [DOI] [PMC free article] [PubMed] [Google Scholar]
- 14.Love-Gregory L, Sherva R, Schappe T, Qi J-S, McCrea J, Klein S, Connelly MA, Abumrad NA. Common CD36 SNPs reduce protein expression and may contribute to a protective atherogenic profile. Hum Mol Genet. 2011;20:193–201. [DOI] [PMC free article] [PubMed] [Google Scholar]
- 15.van Setten J, Brody JA, Jamshidi Y, Swenson BR, Butler AM, Campbell H, Del Greco FM, Evans DS, Gibson Q, Gudbjartsson DF, et al. PR interval genome-wide association meta-analysis identifies 50 loci associated with atrial and atrioventricular electrical activity. Nat Commun. 2018;9. [DOI] [PMC free article] [PubMed] [Google Scholar]
- 16.Yengo L, Sidorenko J, Kemper KE, Zheng Z, Wood AR, Weedon MN, Frayling TM, Hirschhorn J, Yang J, Visscher PM, et al. Meta-analysis of genome-wide association studies for height and body mass index in |700000 individuals of European ancestry. Hum Mol Genet. 2018;27:3641–3649. [DOI] [PMC free article] [PubMed] [Google Scholar]
- 17.Blundell JE, Dulloo AG, Salvador J, Frühbeck G. Beyond BMI - Phenotyping the Obesities. Obesity Facts. 2014;7:322–328. [DOI] [PMC free article] [PubMed] [Google Scholar]
- 18.Syeda F, Kirchhof P, Fabritz L. PITX2-dependent gene regulation in atrial fibrillation and rhythm control. J Physiol. 2017;595:4019–4026. [DOI] [PMC free article] [PubMed] [Google Scholar]
- 19.Sankar PL, Parker LS. The Precision Medicine Initiative’s All of Us Research Program: an agenda for research on its ethical, legal, and social issues. Genet Med. 2017;19:743–750. [DOI] [PubMed] [Google Scholar]
- 20.VanderWeele TJ, Asomaning K, Tchetgen Tchetgen EJ, Han Y, Spitz MR, Shete S, Wu X, Gaborieau V, Wang Y, McLaughlin J, et al. Genetic variants on 15q25.1, smoking, and lung cancer: an assessment of mediation and interaction. Am J Epidemiol. 2012;175:1013–1020. [DOI] [PMC free article] [PubMed] [Google Scholar]
- 21.Kichaev G, Yang W-Y, Lindstrom S, Hormozdiari F, Eskin E, Price AL, Kraft P, Pasaniuc B. Integrating Functional Data to Prioritize Causal Variants in Statistical Fine-Mapping Studies. PLOS Genetics. 2014;10:e1004722. [DOI] [PMC free article] [PubMed] [Google Scholar]
- 22.Bustamante CD, De La Vega FM, Burchard EG. Genomics for the world. Nature. 2011;475:163–165. [DOI] [PMC free article] [PubMed] [Google Scholar]
- 23.Colby SL, Ortman JM. Projections of the Size and Composition of the U.S. Population: 2014 to 2060. Population Estimates and Projections. Current Population Reports. P25–1143. US Census Bureau; 2015. [Google Scholar]
- 24.Shibao CA, Celedonio JE, Ramirez CE, Love-Gregory L, Arnold AC, Choi L, Okamoto LE, Gamboa A, Biaggioni I, Abumrad NN, et al. A Common CD36 Variant Influences Endothelial Function and Response to Treatment with Phosphodiesterase 5 Inhibition. J Clin Endocrinol Metab. 2016;101:2751–2758. [DOI] [PMC free article] [PubMed] [Google Scholar]
- 25.Avery CL, He Q, North KE, Ambite JL, Boerwinkle E, Fornage M, Hindorff LA, Kooperberg C, Meigs JB, Pankow JS, et al. A phenomics-based strategy identifies loci on APOC1, BRAP, and PLCG1 associated with metabolic syndrome phenotype domains. PLoS Genet. 2011;7:e1002322. [DOI] [PMC free article] [PubMed] [Google Scholar]
- 26.Gautam S, Agrawal CG, Banerjee M. CD36 gene variants in early prediction of type 2 diabetes mellitus. Genet Test Mol Biomarkers. 2015;19:144–149. [DOI] [PubMed] [Google Scholar]
- 27.Love-Gregory L, Abumrad NA. CD36 genetics and the metabolic complications of obesity. Curr Opin Clin Nutr Metab Caree. 2011;14:527–534. [DOI] [PMC free article] [PubMed] [Google Scholar]
- 28.Elbers CC, Guo Y, Tragante V, van Iperen EPA, Lanktree MB, Castillo BA, Chen F, Yanek LR, Wojczynski MK, Li YR, et al. Gene-centric meta-analysis of lipid traits in African, East Asian and Hispanic populations. PloS One. 2012;7:e50198. [DOI] [PMC free article] [PubMed] [Google Scholar]
- 29.Musunuru K, Romaine SPR, Lettre G, Wilson JG, Volcik KA, Tsai MY, Taylor HA, Schreiner PJ, Rotter JI, Rich SS, et al. Multi-ethnic analysis of lipid-associated loci: the NHLBI CARe project. PloS One. 2012;7:e36473. [DOI] [PMC free article] [PubMed] [Google Scholar]
- 30.Ellis J, Lange EM, Li J, Dupuis J, Baumert J, Walston JD, Keating BJ, Durda P, Fox ER, Palmer CD, et al. Large multiethnic Candidate Gene Study for C-reactive protein levels: identification of a novel association at CD36 in African Americans. Hum Genet. 2014;133:985–995. [DOI] [PMC free article] [PubMed] [Google Scholar]
- 31.Love-Gregory L, Sherva R, Sun L, Wasson J, Schappe T, Doria A, Rao DC, Hunt SC, Klein S, Neuman RJ, et al. Variants in the CD36 gene associate with the metabolic syndrome and high-density lipoprotein cholesterol. Hum Mol Genet. 2008;17:1695–1704. [DOI] [PMC free article] [PubMed] [Google Scholar]
- 32.O’Neal WT, Singleton MJ, Roberts JD, Tereshchenko LG, Sotoodehnia N, Chen LY, Marcus GM, Soliman EZ. Association Between QT-Interval Components and Sudden Cardiac Death: The ARIC Study (Atherosclerosis Risk in Communities). Circ Arrhythm Electrophysiol. 2017;10. [DOI] [PMC free article] [PubMed] [Google Scholar]
- 33.Chugh SS. Sudden cardiac death in 2017: Spotlight on prediction and prevention. Int J Cardiol. 2017;237:2–5. [DOI] [PMC free article] [PubMed] [Google Scholar]
- 34.Lemaitre RN, Johnson CO, Hesselson S, Sotoodehnia N, Sotoodhenia N, McKnight B, Sitlani CM, Rea TD, King IB, Kwok P-Y, et al. Common variation in fatty acid metabolic genes and risk of incident sudden cardiac arrest. Heart Rhythm. 2014;11:471–477. [DOI] [PMC free article] [PubMed] [Google Scholar]
- 35.Johnson CO, Lemaitre RN, Fahrenbruch CE, Hesselson S, Sotoodehnia N, McKnight B, Rice KM, Kwok P-Y, Siscovick DS, Rea TD. Common variation in fatty acid genes and resuscitation from sudden cardiac arrest. Circ Cardiovasc Genet. 2012;5:422–429. [DOI] [PMC free article] [PubMed] [Google Scholar]
- 36.van de Bunt M, Cortes A, Consortium I, Brown MA, Morris AP, McCarthy MI. Evaluating the Performance of Fine-Mapping Strategies at Common Variant GWAS Loci. PLoS Genet. 2015;11:e1005535. [DOI] [PMC free article] [PubMed] [Google Scholar]
- 37.Mensah‐Ablorh A, Lindstrom S, Haiman CA, Henderson BE, Marchand LL, Lee S, Stram DO, Eliassen AH, Price A, Kraft P. Meta-Analysis of Rare Variant Association Tests in Multiethnic Populations. Genet Epidemiol. 2016;40:57–65. [DOI] [PMC free article] [PubMed] [Google Scholar]
- 38.Wojcik GL, Graff M, Nishimura KK, Tao R, Haessler J, Gignoux CR, Highland HM, Patel YM, Sorokin EP, Avery CL, et al. Genetic analyses of diverse populations improves discovery for complex traits. Nature. 2019;570:514–518. [DOI] [PMC free article] [PubMed] [Google Scholar]
- 39.Morris AP. Transethnic Meta-Analysis of Genomewide Association Studies. Genet Epidemiol. 2011;35:809–822. [DOI] [PMC free article] [PubMed] [Google Scholar]
Associated Data
This section collects any data citations, data availability statements, or supplementary materials included in this article.