

Abstract
Fc receptors (FcR) are an important bridge between the innate and adaptive immune system. Fc gamma receptor I (FcγRI, CD64), the high affinity receptor for immunoglobulin G (IgG), plays roles in inflammation, autoimmune responses, and immunotherapy. Stimulation of myeloid cells with cytokines, such as tumor necrosis factor-α (TNFα) and interferon-γ (IFNγ), increases the binding of FcγRI to immune complexes (ICs), such as antibody opsonized pathogens or tumor cells, through a process known as ‘inside-out’ signaling. Using super-resolution imaging, we found that stimulation of cells with IL-3 also enhanced the clustering of FcγRI both before and after exposure to ICs. The increased clustering was dependent on an intact actin cytoskeleton. We found that chemical inhibition of PP1 activity reduced FcγRI inside-out signaling, although the phosphorylation of FcγRI itself was unaffected. Furthermore, the antibody-dependent cytotoxic activity of human neutrophils towards CD20-expressing tumor cells was increased after stimulation with TNFα and IFNγ. These results suggest that nanoscale reorganization of FcγRI, stimulated by cytokine-induced, inside-out signaling, enhanced FcγRI cellular effector functions.
Introduction
Expressed on immune cells, Fc receptors (FcR) are required for the cellular effector functions of antibodies, including protection against bacteria and phagocytosis. In humans, the FcγR family comprises both the activating receptors FcγRI, FcγRIIa, FcγRIIc, and FcγRIIIa as well as one inhibitory receptor, FcγRIIb. Fc gamma receptor I (FCγRI, CD64), the high affinity receptor for IgG (KD of 10−8-10−9 M), associates with the FcR gamma chain and is constitutively expressed on monocytes, macrophages, eosinophils, and dendritic cells, as well as on neutrophils after activation. The docking mode between IgGs and the different FcγR, including FcγRI, is very similar and conserved (1). Because of its high affinity, FcγRI is constitutively saturated with monomeric IgG, even after extravasation of immune cells or isolation from the blood (2). Therefore, the in vivo role of FcγRI in immune responses remains unclear. However, several studies have implicated an important role for FcγRI during inflammation, autoimmune responses, and monoclonal antibody immunotherapy in tumor models (3–5). In addition, FcγRI can efficiently induce MHC class II antigen presentation (6).
FcγRI, saturated with prebound IgG, is capable of effective immune complex (IC) binding after cytokine stimulation (7). This phenomenon is termed ‘inside-out signaling’ because ligand binding of the receptor is rapidly enhanced after intracellular signaling without altering receptor expression. This is a well-known process for integrin activation (8), as well as two other FcR: FcαRI and FcγRIIa (9, 10). Prior studies utilizing the Ba/F3 transfection model, a murine cell line that is dependent on IL-3 for survival, indicate that IL-3 can stimulate inside-out signaling (7, 9). In primary human leukocytes, analogous cytokines such as IL-5, IFNγ, and TNFα stimulate ligand binding and receptor function (10). However, the mechanisms by which FcR increase their ligand binding are largely unknown. Cytokine stimulation induces a small but significant increase in monomeric IgG binding of FcγRI-expressing cells. Strikingly, stimulation with cytokines strongly enhances the binding of IC without altering FcγRI expression (7). This effect is inhibited by okadaic acid (OA), a phosphatase inhibitor of PP2a at low concentrations, and PP1 at higher concentrations (11). Furthermore, cytokine stimulation can also enhance anti-tumor responses of therapeutic antibodies mediated by FcR-bearing immune cells (10, 12).
How cytokine signaling alters FcγRI to increase its binding capacity is still unknown. Potential explanations include changes in FcγRI conformation, dynamics, and clustering. There is increasing evidence indicating that the membrane environment can modulate each of these aspects of receptor behavior (13–15). Furthermore, the plasma membrane is organized into microdomains, such as actin corrals, lipid rafts, and protein islands, that play an essential role in promoting signal transduction for a number of membrane proteins (13, 14). Previous work has provided evidence that FcγRI resides in lipid rafts and that disruption of lipid rafts could increase ligand binding (16). Here, we sought to elucidate the mechanism of FcγRI inside-out signaling by cytokine stimulation. To this end, we studied the mobility and nanoscale organization of FcγRI in the plasma membrane using single particle tracking (SPT) and super-resolution imaging, investigated the role of phosphorylation and the actin cytoskeleton, and measured the effect of cytokine stimulation on antibody-dependent cellular cytotoxicity (ADCC) of human neutrophils.
Results
Inside-out signaling of FcγRI enhances immune complex binding
For our studies, we made use of the previously characterized FcγRI-expressing Ba/F3 cell line (7) and fluorescently labeled polyclonal anti-DNP rabbit IgG. This system allowed us to use high-resolution imaging to study the dynamics and distribution of IgG-bound FcγRI receptors in both the presence and absence of IC formed by the addition of the model antigen DNP24-BSA (2,4-Dinitrophenylated-Bovine Serum Albumin). We found that IL-3 stimulation significantly enhanced the binding of Ba/F3-FcγRI cells to preformed IC and this effect could be blocked by the addition of OA (Fig. 1A). FcγRI surface expression was constant under all treatments (Fig. 1, B and C and Fig. S1), confirming that the cytokine-induced binding enhancement was not a result of increased receptor expression. By confocal imaging, we did not observe large-scale changes in receptor organization (Fig. S1B).
Figure 1. IL-3 stimulation enhances immune complex binding that is not correlated with changes in the lateral mobility of FcγRI.
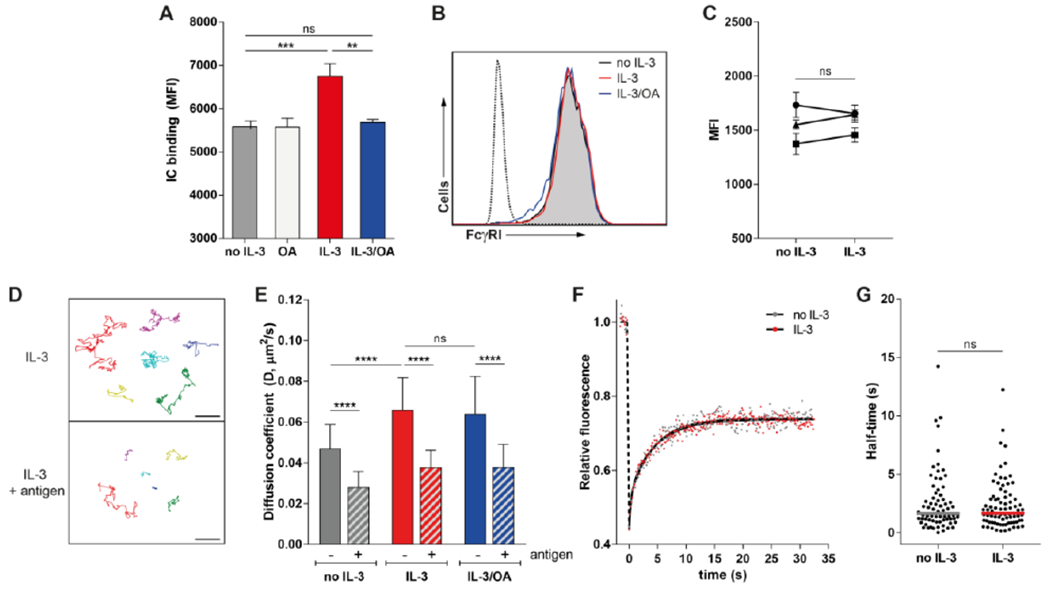
(A) Flow cytometry analysis of the binding of immune complexes (IC) to Ba/F3-FcγRI cells after IL-3 stimulation. Mean fluorescence intensity (MFI) data are representative of 3 independent experiments. (B) Flow cytometry analysis of FcγRI expression on Ba/F3-FcγRI cells stimulated as indicated. Dotted line represents the isotype control. Histogram plots are representative of 4 independent experiments. (C) Flow cytometry analysis of FcγRI expression on Ba/F3-FcγRI cells after IL-3 stimulation. MFI data of 3 independent experiments are depicted. (D and E) Single particle tracking (SPT) by microcopy analysis of the movement of QD655-labeled anti-DNP IgG in live Ba/F3-FcγRI cells stimulated with IL-3, with and without antigen (DNP24-BSA) to induce IC. Particle trajectories (D) are representative of at least 10 experiments. Diffusion coefficients for QD655-labeled IC mobility (E) were calculated using mean square displacement (MSD) analysis of individual SPT trajectories. For each trajectory, the diffusion coefficient (D) was calculated for control, IL-3-stimulated, and antigen-bound conditions. Data are representative of the analysis of 85-200 cells per condition pooled from all experiments. (F and G) Fluorescence recovery after photobleaching (FRAP) analysis of the mobility of FcγRI-eYFP in Ba/F3 cells stimulated with IL-3 as indicated. Normalized and corrected mean relative fluorescence data are pooled from 5 independent experiments and (F) fit by non-linear two phase regression (black line). The FcγRI half-time (G) was calculated per cell. Data and median from 70-81 cells per condition are pooled from all experiments. Scale bar, 1 μm. **P<0.01, ***P<0.001, ****P<0.0001, and ns: not significant by one-way analysis of variance (ANOVA) and Tukey’s post hoc test (A and E), or Student’s t test (C and G).
Cytokine stimulation enhances FcγRI clustering in the plasma membrane
To better understand how cytokine stimulation may be associated with spatio-temporal changes in receptor behavior, we characterized the mobility of FcγRI using single particle tracking (SPT) (Fig. 1D). We found that receptor mobility was reduced when the addition of multivalent antigen (DNP24-BSA) stimulated the formation of IC on the plasma membrane, consistent with crosslinker-induced receptor aggregation (20). Treatment of the cells with IL-3 increased FcγRI diffusion, both in resting and antigen bound receptors (Fig. 1E) but this was insensitive to OA pretreatment. Using the Kolmogorov-Smirnov test, we found that the diffusion coefficient of all conditions was significantly different from each other (p<0.001), except for IL-3 vs IL-3/OA (both with and without antigen). We also used fluorescence recovery after photobleaching (FRAP) to measure the ensemble mobility of FcγRI-eYFP in Ba/F3 cells. In these experiments, stimulation with IL-3 did not increase the diffusional behavior or recovery half-time of the receptor (Fig. 1, F and G). Thus, changes in FcγRI mobility were not correlated with IL-3 stimulated enhanced IC binding.
Because small aggregates of immune receptors are capable of robust signaling without inducing changes in mobility (17), we used dSTORM, a localization-based super-resolution imaging technique that provides ~20 nm resolution to gain insight into the nanoscale organization of FcγRI (18). Surface FcγRI on Ba/F3-FcγRI cells were labeled with fluorescent Alexa Fluor 647 (AF647)-labeled anti-DNP IgG. Super-resolution images of FcγRI distribution were reconstructed from independent localizations of AF647-IgG on the basal side of the Ba/F3-FcγRI cells with and without IL-3 or antigen stimulation (Fig. 2A and Fig. S2A). To quantify the images, we used the DBSCAN clustering algorithm (19) to classify localizations into clusters based on their relative local spatial density in multiple, nonoverlapping individual 4 μm2 regions of interest (ROIs). This approach allowed us to identify individual clusters and make comparisons between the distributions of clusters across different conditions (Fig. 2B). We found that the equivalent cluster radius, calculated as the radius of a circle with the same area as the boundary of all fits within a cluster, was a useful representation of cluster size (Fig. 2C). Other methods of dSTORM data analysis, such as changing the maximal distance between neighboring cluster points to an epsilon of 35 nm instead of 50 nm or using the Getis-G clustering method instead of DBSCAN gave similar results for all conditions.
Figure 2. Cytokine stimulation promotes FcγRI clustering.
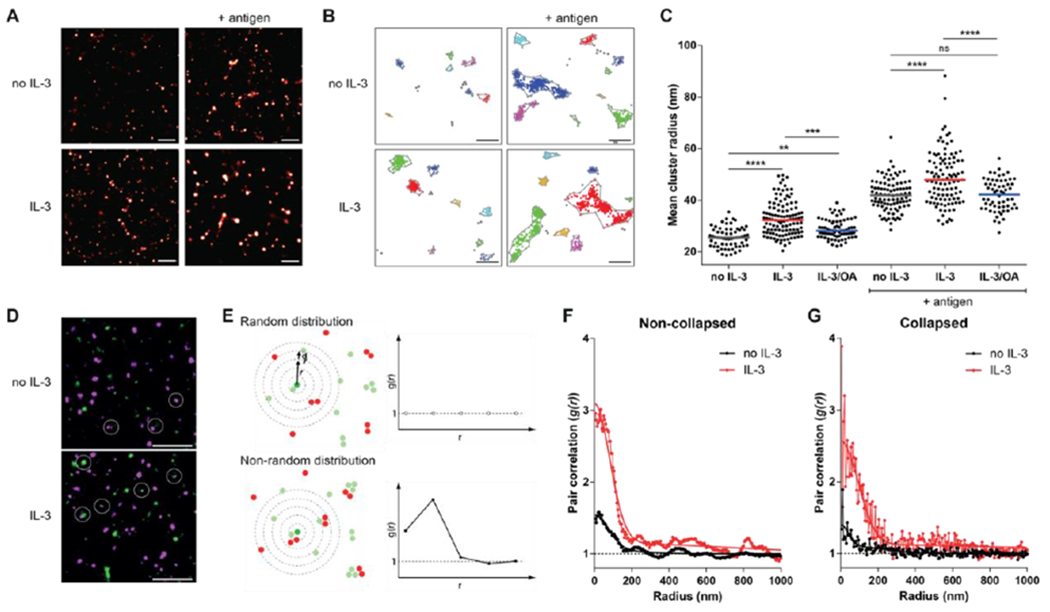
(A to C) dSTORM super-resolution microscopy analysis of fluorescently labeled anti-DNP IgG on Ba/F3-FcγRI cells stimulated as indicated. FcγRI-bound IgG clusters were identified by DBSCAN analysis (B) of the data in (A). Images (A and B) are representative of 3 independent experiments. Each symbol in (C) represents the mean IgG cluster radius per cell as calculated from multiple independent regions of interest in each cells. Data and median from 20-30 cells per condition are pooled from all experiments. (D to G) Two-color dSTORM super-resolution microscopy analysis of fluorescently labeled anti-DNP IgG in Ba/F3-FcγRI cells stimulated with or without IL-3. (D) Representative images from two independent experiments are shown. Circles indicate examples of observed overlap between AF647 (magenta) and Cy3B (green). (E) Cartoon demonstrating the concept of the two-color pair correlation function, g(r), that shows the mean number of particles at a distance between r and r + dr from a point of reference (middle green spot). g(r) is normalized such that randomly distributed particles give g(r) = 1 (top). If proteins are clustered, then the pair correlation will show a peak corresponding to the distribution of molecule separations (bottom). (F) Two-color dSTORM images were analyzed using pair correlation analysis. Data from multiple regions of interest across 3-4 cells per condition (n>6 regions per condition) were pooled to generate pair correlation curves. The dashed black line indicates a pair correlation of g(r) = 1, which is considered a random distribution. The data points (symbols) and the fit through the pair correlation function (solid line) are shown. (G) Pair correlation analysis of the same pooled data as in (F) using H-SET collapsed data. Scale bar, 500 nm (A), 200 nm (B), and 1 μm (D). **P<0.01, ***P<0.001, ****P<0.0001, and ns: not significant by Kruskal-Wallis test and Dunn’s multiple comparison test.
Consistent with other reports of antigen-induced receptor crosslinking (20), the formation of IC increased FcγRI cluster size in all conditions (Fig. 2C and Fig. S2B). Cluster size was dependent on antigen dose (Fig. S2C), verifying that these observed changes were antigen specific. In line with the increased antigen binding seen by flow cytometry, antigen-induced clusters were larger in IL-3 stimulated cells at all doses (Fig. S2C). IL-3 stimulation before the addition of antigen increased the size of receptor clusters, and these increased further with antigen exposure (Fig. 2C). This IL-3-induced increase in cluster size was reduced by pretreatment with OA, the same treatment that reversed the effect of IL-3 on IC binding (Fig. 1A and fig. 2C). Similar results were obtained when AF647-IgG IC were preformed in solution before addition to the Ba/F3-FcγRI cells (Fig. S2D) or when AF647-conjugated human IgG1 was used instead of rabbit IgG (Fig. S2E). These results demonstrate that cytokine stimulation leads to an enhanced clustering of FcγRI.
When performing dSTORM imaging, a minimum cluster size is generated from a single fluorophore due to repeated localizations and the precision of the measurement. Therefore, to confirm that the small shift in cluster radius observed with IL-3 stimulation was due to multiple proteins in a cluster, we performed two-color dSTORM. In these experiments, FcγRI was labeled stochastically with either AF647-labeled or Cy3B-labeled anti-DNP IgG (Fig. 2D) and receptor proximity was quantified using localization-based two-color pair correlation analysis (Fig. 2E–G) (21, 22). The pair correlation of dual-labeled surface FcγRI in the absence of IL-3 is close to 1, but shows a small increase at short distances (<200 nm), suggesting that a fraction of receptors exist in small clusters in the absence of crosslinking (Fig. 2F, black line). Upon stimulation with IL-3, the correlation at short distances dramatically increased (Fig. 2F, red line). To confirm that this difference is not due to an artifact of multiple localizations of the same fluorophore, we used H-SET analysis that collapses clusters of observations of blinking fluorophores into single estimates of their true locations (23). Analysis of the collapsed data shows the same relative increases of pair correlation at short distances (Fig. 2G). The higher pair correlation seen for FcγRI in the presence of IL-3 is consistent with IL-3 stimulation and increase in FcγRI clustering, as seen in the single-color dSTORM results (Fig. 2C). Altogether, the super-resolution imaging experiments demonstrate that FcγRI is found in small clusters on the plasma membrane and the clustering is increased with IL-3 stimulation. This change in spatial organization with IL-3 suggests that cytokine stimulation sensitizes the cells to engage antigen or IC by enhanced preclustering of FcγRI.
An intact actin cytoskeleton is required for increased FcγRI clustering
Because the intracellular tail (CY) of the FcγRI α-subunit interacts with the actin-binding proteins filamin A, periplakin and protein 4.1G (24–26), actin rearrangement may facilitate cytokine-induced changes in receptor clustering. Using IgG-coated beads we measured FcγRI-mediated rosette formation in the presence of Latrunculin A (LatA), an inhibitor of actin polymerization (Fig. 3). Consistent with previous data (7), we detected a nearly two-fold increase in the percentage of rosettes formed with Ba/F3-FcγRI cells after IL-3 stimulation (Fig. 3, A and B). In contrast, pretreatment of the cells with LatA before IL-3 stimulation significantly reduced the rosette formation, similar to OA. LatA did not abrogate the rosette formation completely, indicating that, at least to some extent, IC can still bind without an intact cytoskeleton. LatA treatment did not alter FcγRI surface expression (Fig. S3) or change FcγRI cluster size in control cells or prevent the formation of larger aggregates with antigen (Fig. 3C). However, LatA inhibited IL-3 enhancement of FcγRI cluster size both before and after antigen. These results suggested that cytokine-enhanced clustering of FcγRI requires an intact actin cytoskeleton, whereas IC-induced clustering may be independent of the actin cytoskeleton.
Figure 3. An intact actin cytoskeleton is required for increased clustering of FcγRI.
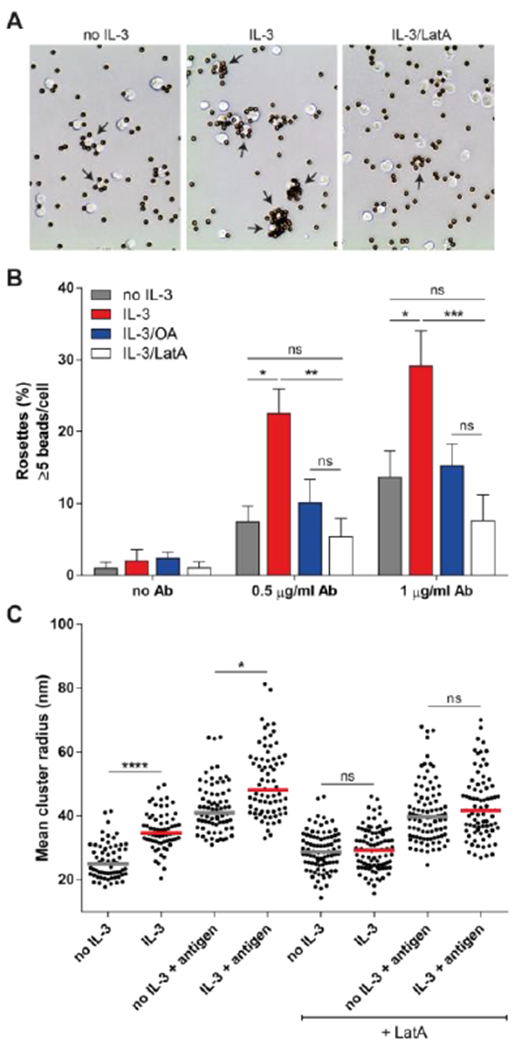
(A and B) Microscopic analysis of antibody-opsonized bead binding to Ba/F3-FcγRI cells stimulated with IL-3, latrunculin A (+ LatA), or okadaic acid (OA) as indicated. Rosettes were defined as cells bound with >5 beads. Images (A) are representative of 3 independent experiments, with arrows indicating rosettes. Quantified data (B) are pooled means ± SD at the indicated antibody concentrations. (C) dSTORM super-resolution microscopy analysis of fluorescently labeled anti-DNP IgG in Ba/F3-FcγRI cells stimulated as indicated. Data and median from 9-12 cells per condition are pooled from 2 independent experiments. *P<0.05, **P<0.01, ***P<0.001, ****P<0.0001, and ns: not significant by Kruskal-Wallis test and Dunn’s multiple comparison test.
Inhibiting PP1 phosphatase activity reduces FcγRI inside-out signaling, but does so without changes in total FcγRI phosphorylation
Inside-out signaling depends on phosphatase activity, which is inhibited by treatment with OA (7) that also blocks FcγRI nanoscale reorganization (Fig. 2). However, OA inhibits the phosphatase activity of PP2a at low concentrations and PP1 at higher concentrations (11). To determine if PP1 may be involved in FcγRI inside-out signaling, we treated cells with the inhibitor tautomycetin (TC), which has a ~40× higher selectivity for PP1 over PP2A. We found that TC was a much more potent inhibitor of IC binding by IL-3 stimulated Ba/F3-FtγRI cells than OA, showing inhibition at 10 nM whereas OA required concentrations of 100 nM or more to show an effect (Fig. 4A). Although these differences may be influenced by compound potency, these data suggested the involvement of PP1 in cytokine-stimulated FcγRI clustering.
Figure 4. Cytokine-stimulated FcγRI increases clustering independent of direct receptor phosphorylation.
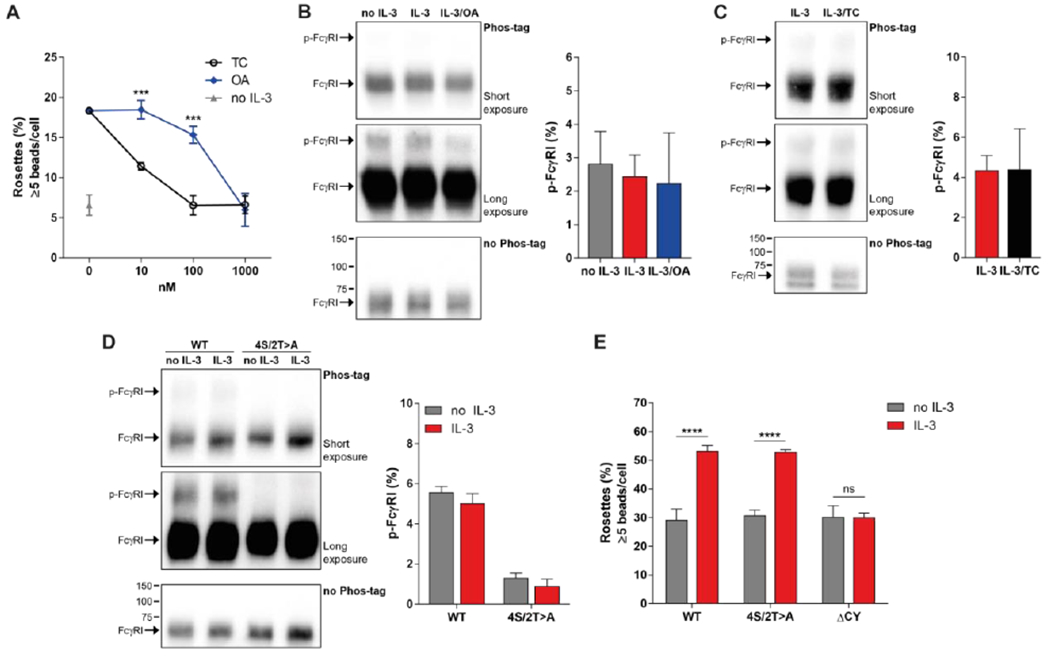
(A) Microscopic analysis of antibody-opsonized bead binding to Ba/F3-FcγRI cells stimulated with IL-3, tautomycetin (TC), or okadaic acid (OA) as indicated. Rosettes were defined as cells bound with >5 beads. Quantified data are means ± SD pooled from 3 independent experiments. (B-D) Phos-tag SDS-PAGE gel and Western Blot analysis (left) or quantification (right) of phosphorylation on FcγRI a-subunit immunoprecipitated from Ba/F3-FcγRI cells (B and C) or FcγRI 4S/2T>A (D) after stimulation with IL-3, OA or TC, as indicated. Short exposure blots (top), long exposure blots (middle) and control blots (bottom) are representative of 3 independent experiments. Increased band size indicates phosphorylation of FcγRI a-subunit (p-FcγRI: phosphorylated FcγRI). Numbers indicate the protein marker size in kDa. Quantified data are relative mean band intensity values ± SEM and pooled from 3 independent experiments. (D) Microscopic analysis of antibody-opsonized bead binding to Ba/F3 cells expressing FcγRI WT (wild-type), FcγRI 4S/2T>A, or FcγRI ΔCY (without intracellular domain) stimulated with or without IL-3. Data are representative of 3 independent experiments. ***P<0.001, ****P<0.0001 and ns: not significant by Student’s t test (A) or one-way analysis of variance (ANOVA) and Bonferroni’s multiple comparisons test (E).
Because PP1 is a serine/threonine phosphatase, and the CY domain of FcγRI contains four serine and two threonine residues, we next investigated whether FcγRI is directly phosphorylated. Neither IL-3 stimulation nor phosphatase inhibition influenced the abundance of phosphorylated FcγRI (p-FtyRI) as observed by Western blot and PhosTag SDS-PAGE analysis of FcγRI a-subunit immunoprecipitants (Fig. 4, B and C). Similarly, although the p-FcγRI was no longer present when the intracellular serines and threonines were mutated to alanines FcγRI 4S/2T>A mutant) (Fig. 4D), cytokine stimulation of the FcγRI 4S/2T>A mutant resulted in equal rosette formation compared to FcγRI wild-type. These data suggested that serine/threonine phosphorylation within the CY domain of FcγRI is not required for inside-out signaling. Rosette formation was not increased after IL-3 stimulation when a truncated version of FcγRI that lacked the CY domain was used(Fig. 4E). Together our data indicated that although the intracellular domain of FcγRI is required for inside-out signaling, the 4S/2T residues within this domain do not play a role.
Inside-out signaling increases FcγRI clustering and effector functions in human myeloid cells
The above experiments were performed using the Ba/F3 cell line expressing FcγRI. To confirm that cytokine-regulated FcγRI clustering also occurs in primary immune cells, we quantified receptor organization in human monocytes from healthy donors. Human monocytes endogenously express FcγRI, and treatment with IFNγ and TNFα induces inside-out signaling of FcγRI in these cells (7). Similar to our cell line results, we found that stimulation of monocytes with these cytokines did not alter FcγRI expression or diffusion (Fig. S4, A and B). By using single-color dSTORM we found that the cluster sizes observed in human monocytes were comparable to those measured in Ba/F3-FcγRI cells. Stimulation with IFNγ and TNFα increased FcγRI clustering, both before and after the addition of antigen (Fig. 5A), which was inhibited by pretreatment with OA. These data confirmed that cytokine stimulation increased FcγRI clustering in human monocytes.
Figure 5. Cytokines increase FcγRI clustering and IgG-mediated ADCC in human myeloid cells.
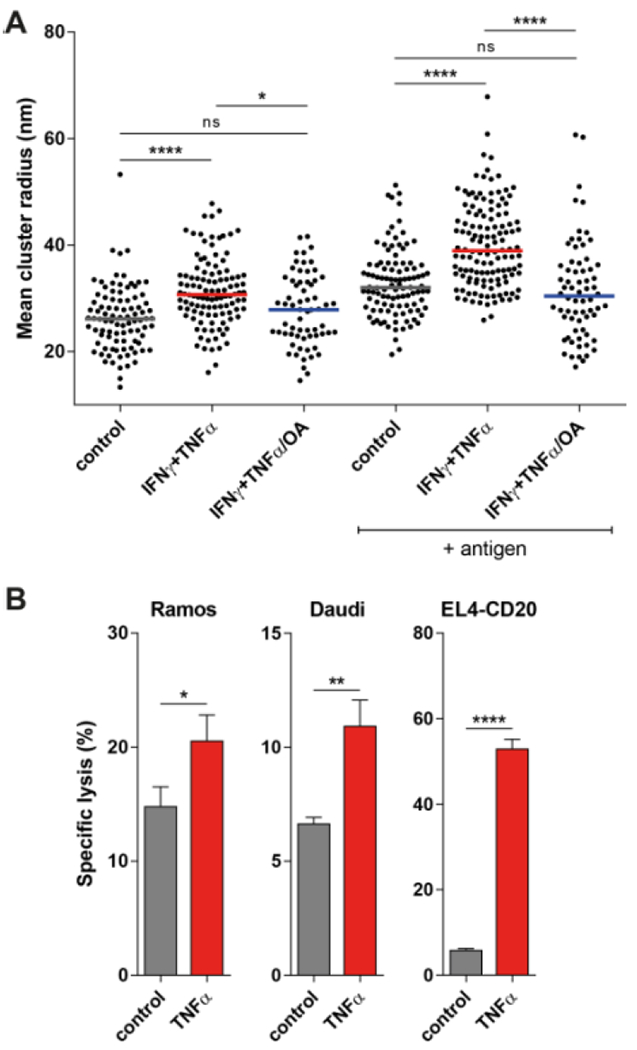
(A) dSTORM super-resolution microscopy analysis of fluorescently labeled anti-DNP IgG on human monocytes stimulated as indicated. Mean cluster radius data and median from 5-8 cells per donor are pooled from two independent experiments. (B) Specific lysis of CD20-expressing tumor cell lines in the presence of 1 μg/mL anti-CD20 antibody (rituximab) and human neutrophils, simulated as indicated. Data are representative of 2 independent experiments. *P<0.05, **P<0.01, and ****P<0.0001 by Kruskal-Wallis test and Dunn’s multiple comparison test (A) and Student’s t test (B).
Finally, we investigated if cytokine stimulation also enhanced FcγR effector functions. To study this, we measured ADCC of neutrophils in response to different CD20-expressing tumor cell lines in the presence of the therapeutic IgG-anti-CD20 antibody rituximab. Two activating FcγRs are expressed by neutrophils: FcγRI and FcγRIIa, both of which are under inside-out control. Neutrophils induced tumor cell lysis of Ramos, Daudi, and EL4-CD20 cells in the presence of an anti-CD20 antibody (Fig. 5B). Cytokine-stimulated neutrophils had significantly increased cytotoxic capacity, especially when EL4-CD20 cells were used as targets (Fig. 5B). Expression of both FcγRI and FcγRIIa on neutrophils did not change during these experiments (Fig. S4C). These results in primary human cells suggest that cytokine-induced FcγR activation can also augment immune cell function.
On the basis of our results, we propose a model in which FcγRI exists as monomers or small multimers bound by monomeric IgG in unstimulated immune cells. After cytokine stimulation, PP1 activity and actin polymerization together lead to enhanced FcγRI clustering in the plasma membrane (Fig. 6). This may lead to increased FcγRI-IC binding capacity and, ultimately, enhanced FcγRI effector functions.
Figure 6. Mechanisms of FcγRI inside-out signaling.
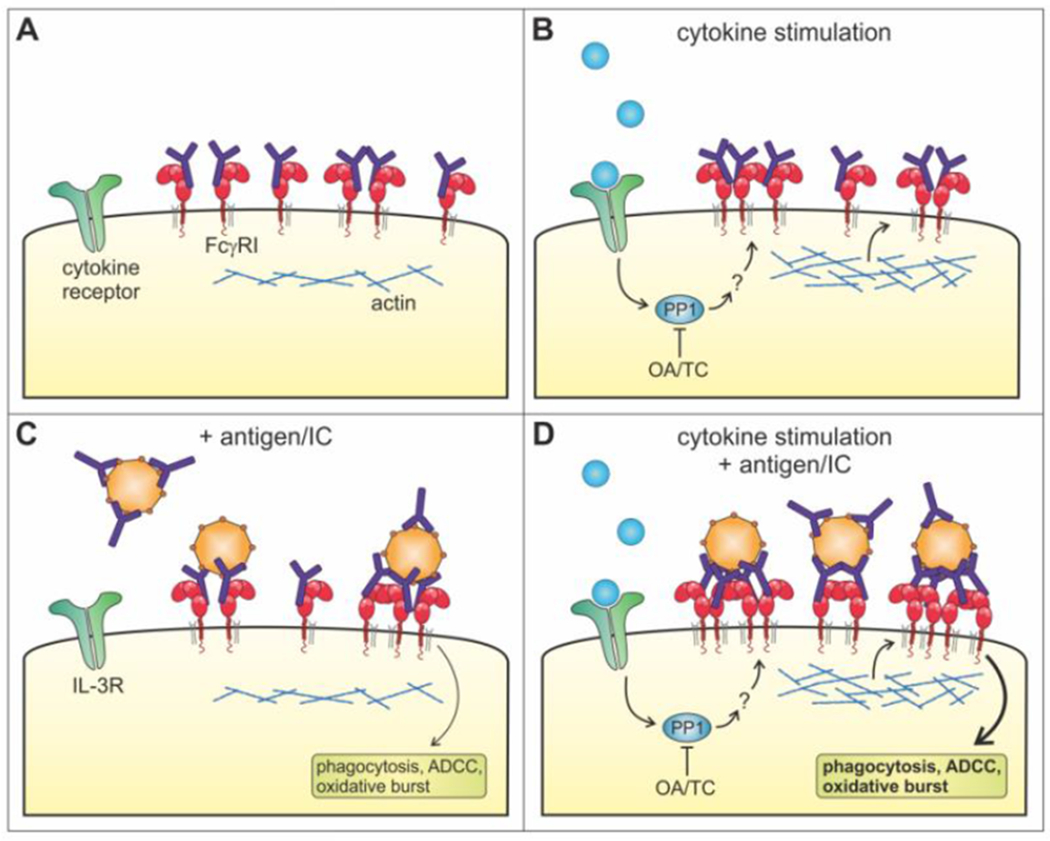
(A) In unstimulated cells, FcγRI is bound by monomeric IgG because of its high affinity. FcγRI might exist as monomers or possibly small multimers, as indicated by the two-color dSTORM data. (B) Cytokine stimulation of FcγRI-expressing cells first induces ‘outside-in’ signaling when a cytokine binds its cytokine receptor. Subsequently, inside-out signaling is initiated resulting in increased clustering of FcγRI in the plasma membrane. The phosphatase PP1 may be essential for this process, consistent with evident that inside-out signaling can be blocked by okadaic acid (OA) and tautomycetin (TC). Increased actin polymerization is likely to facilitate the clustering of FcγRI, although these clusters retain the same mobility as without cytokine stimulation. Together, this leaves the cell in a primed state that has a stronger immune complex (IC) binding capacity. (C) The presence of antigens or IC can induce clustering of FcγRI. These cluster sizes are approximately similar to the inside-out signaling induced clusters of FcγRI. However, the mobility of these clusters is decreased, since antigen or IC binding initiates crosslinking of FcγRI that leads to ITAM signaling and FcγRI effector functions. (D) Antigens or IC can bind more efficiently to FcγRI on cells stimulated with cytokines. Both the inside-out signaling and the antigen increase the FcγRI clusters, resulting in large FcγRI clusters in the plasma membrane and stronger effector functions like ADCC. FcγRI in these clusters is also less mobile compared to stimulated cells without antigen.
Discussion
Our results provide evidence of nanoscale reorganization of FcγRI in response to cytokine stimulation in both a cell line and primary human myeloid cells. The increase in receptor clustering was prevented when cells were treated with inhibitors of PP1 and actin polymerization, indicating an important role for phosphatase and cytoskeletal activity in FcγRI inside-out signaling. The specific dependence of cytokine-induced FcγRI activation on actin polymerization suggests that this process may induce cytoskeleton rearrangements that facilitates FcγRI clustering and sensitizes the cells to bind opsonized pathogens. Actin might also facilitate the binding or recruitment of other proteins, which in turn can enhance FcγRI clustering. The CY domain of FcγRI interacts with the actin-binding protein filamin A. This interaction between filamin A and FcγRI is reduced upon large IC binding to FcγRI, which may uncouple FcγRI from the actin cytoskeleton to allow efficient phagocytosis (27). In addition, the human interactome identified a significant interaction between filamin A and PP1 (28), suggesting that filamin A could facilitate interaction of FcγRI and PP1. However, FcγRI is not expressed in these cells (HeLa cells); therefore no direct evidence for an interaction between FcγRI and PP1 exists.
For many other immune receptors, receptor clustering by microdomains is important for their regulation and function. One well-known example is the role of clustering in integrin inside-out signaling, where even a subtle increase in clustering can lead to substantial increases in cellular adhesion (29). Furthermore, clustering facilitates antigen binding to FcεRI, regulates B cell receptor (BCR) activity, and enhances FcγRIIa binding to ligand (15, 20, 30). Besides clustering, conformational changes in the extracellular domain of receptors can be involved in receptor activation. For example, the activation of integrins requires a distinct conformational change from a bent to an extended conformation, essential for higher ligand-binding affinity (8). In case of the BCR, a more open conformation of the receptor is induced for its activation (31). Here, we focused on altered lateral mobility and clustering of FcγRI in the plasma membrane as possible mechanism of FcγRI inside-out activation. Alternatively, conformational changes in FcγRI may also alter its affinity for IgG-IC. The crystal structure of FcγRI in complex with the IgG Fc fragment indicates that the EC3 domain undergoes a conformational shift after IgG is bound (32, 33). Future research might elucidate whether the increased clustering of FcγRI after cytokine stimulation coincides with a conformational change of the receptor.
We demonstrated that the CY domain of FcγRI is necessary for inside-out signaling, but that the serine/threonine motifs within this domain do not play a role. In contrast, in FcγRI-transfected P388D1 cells, the CY-domain is constitutively serine phosphorylated as determined by an anti-phosphoserine Western Blot (34). Because this approach is not quantitative, we instead determined the degree of phosphorylation of FcγRI using a Phos-tag SDS-PAGE gel, which allowed for direct quantification of protein phosphorylation. We found that a phosphorylated fraction of FcγRI in unstimulated cells that is absent in FcγRI 4S/2T>A mutant cells, indicating that this signal represents serine/threonine phosphorylation. Edberg et al. also show that the CY-domain serines are transiently dephosphorylated upon FcγRI crosslinking (outside-in signaling), and this dephosphorylation is prevented by OA treatment (34). These data contrast with inside-out signaling, where OA inhibited enhanced IC binding of FcγRI but did not directly influence FcγRI phosphorylation. Furthermore, the 4S>A mutant generated by Edberg et al. results in reduced phagocytosis compared to FcγRI wild-type (34), while our 4S/2T>A mutant had no influence on IC binding after IL-3 stimulation (Fig. 5D). IL-3 stimulation led to inside-out activation of FcγRI, as measured by increased IC binding in the rosette assay, which was performed at temperatures that prevent outside-in signaling. However, phagocytosis is dependent on FcγRI outside-in signaling leading to ITAM phosphorylation of the Fc receptor γ-chain. Together, these observations suggest that outside-in and inside-out signaling are distinct processes and that dephosphorylation of these four serines, although important for outside-in signaling leading to phagocytosis, is not required for cytokine-induced inside-out signaling.
Receptor phosphorylation is not the only post-translational modification that can influence protein function. Because direct phosphorylation of the FcγRI α-subunit is excluded by our data, other modifications such as ubiquitination and methylation might also affect FcγRI function or localization. For other FcR, including FcεRI, FcγRIIa and FcγRIIIa, ligand-induced ubiquitination is essential for receptor internalization and degradation, providing a negative feedback on Fc receptor activity (35). For FcγRI, ubiquitination may play a role as well since this receptor is continuously internalized and recycled to the plasma membrane within minutes under steady state conditions. Therefore, in future studies, it would be very interesting to monitor the ubiquitination of FcγRI in resting, inside-out activated, and IC-bound cells.
One promising clinical application of cytokine stimulation is to enhance the activity of neutrophils (or other FcγRI-expressing immune cells) during administration of anti-tumor therapeutic antibodies (Fig. 6B) (10). Administration of cytokines in combination with therapeutic antibodies against several tumor antigens increases the efficacy of these antibodies both in vitro and in vivo (12, 35, 36). However, many of the tested cytokines in these in vivo studies are associated with processes that take hours or even days. G-CSF for example, is associated with increased FcγRI expression on neutrophils and increased recruitment of effector cells (38). The inside-out signaling of FcγRI we describe here occurs rapidly – on the order of minutes – to promote FcγRI-IC binding. Therefore, we expect that cytokine stimulation in combination with antibody therapy would increase the binding capacity of FcγRI-expressing cells to tumor cells directly after cytokine administration (minutes), while increasing FcγRI expression and recruiting more effector cells from the bone marrow occurs later (hours or days). Together this may lead to more effective anti-tumor responses, especially when the timing of cytokine administration is taken into account. A thorough understanding of the regulatory mechanisms of FcγRI activation may aid manipulation of immune responses using cytokines during infections, vaccinations, antibody immunotherapy, or autoimmune diseases.
Materials and Methods
Cell lines
Ba/F3 (murine pro-B cell line), Ramos, Daudi, and EL4-CD20 cells were cultured in RPMI medium (RPMI 1640; GIBCO) supplemented with 10% fetal calf serum (FCS), penicillin/streptomycin, and murine IL-3 [provided by P. Coffer, University Medical Center (UMC) Utrecht] (7, 9). The retroviral vector pMX human FcγRI was described previously (24). In addition, the human FcγRI in this vector was replaced with a fusion protein of human FcγRI and eYFP. Using site-directed mutagenesis the 4 serines (Ser328, Ser331, Ser339, and Ser340) and 2 threonines (Thr312 and Thr374) in the intracellular domain of FcγRI were mutated to alanine (4S/2T>A mutant); to generate FcγRI-ΔCY, first Thr312 was mutated to alanine and second Glu316 was mutated to a stopcodon. Amphotropic viral particles produced in HEK293T cells were used to transduce Ba/F3 cells. Ba/F3-FtγRI (with mutations) and Ba/F3-FtγRI-eYFP cells were sorted on a FACSAria (BD Biosciences) for FcγRI expression.
Reagents
Antibodies: anti-FcγRI, either unlabeled rabbit IgG1 (clone EPR4624; Abcam) or Alexa Fluor 488 (AF488)- or Alexa Fluor 647 (AF647)-labeled (mIgG1 clone 10.1; Biolegend); eFluor450-labeled anti-CD14 (61D3; eBioscience); Fluorescein isothiocyanate (FITC)-labeled goat-anti-rabbit IgG (Jackson ImmunoResearch); goat-anti-rabbit IgG HRP conjugated (Pierce); rabbit IgG-anti-dinitrophenyl (anti-DNP IgG, polyclonal; Vector Labs). Anti-DNP IgG was biotinylated and subsequently conjugated to Qdot655 (QD655) (Invitrogen) as described for IgE (20). Anti-DNP IgG and anti-trinitrophenyl (TNP) human IgG1 (38) were fluorescently labeled with AF647 or Cyanine 3B (Cy3B) (Life Technologies) following the same protocol as for biotinylation. Where indicated, 1 μM okadaic acid (OA; Enzo Life Sciences) or 1–1000 nM tautomycetin (TC; Tocris) was added for 30 min or 0.1 μg/mL latrunculin A (LatA; Life Technologies) was added 10 min before IL-3 stimulation. Phos-tag Acrylamide was from Wako-Chem. The anti-human CD20 antibody rituximab (Roche) was purchased from the pharmacy of UMC Utrecht. Eight-well Lab-Tek chambers (Nunc, Rochester, NY) were coated with poly-l-lysine (1 μg/mL in 10% 1× PBS, 90% water) for 30 min at room temperature (RT). Thrombin and fibrinogen were both from Enzyme Research Laboratories.
FcγRI (CD64) expression and IC binding
Ba/F3-FcγRI cells were cytokine-starved overnight in RPMI with 1% FCS (RPMI-1%FCS). The next day, cells were stimulated with IL-3 (in RPMI-1%FCS) for 1 hour at 37°C. For confocal microscopy, cells were added to eight-well Lab-Tek chambers, fixed with 4% paraformaldehyde (PFA; Sigma) and stained with AF488-labeled anti-FcγRI. Images were collected on a Zeiss LSM510 two-photon confocal microscope (Zeiss Axiovert 200M inverted microscope with X,Y-motorized stage) with a 63× oil-immersion objective using an argon laser.
For flow cytometry, 1×10⁵ Ba/F3-FcγRI cells/well were added to a 96-well plate, washed with cold PBS and stained with AF647-labeled anti-FcγRI for 1 hour at 4°C. Afterwards, cells were washed with PBS and fixed with 1% PFA. Expression of FcγRI was measured on a FACSCanto II (BD Biosciences). FcγRI expression after IL-3 stimulation was routinely measured. For monocyte flow cytometry, 2×10⁵ PBMCs/well were added to a 96-well plate and stimulated with TNF-α and IFN-γ (500 and 400 U/mL, respectively) for 1 hour in RPMI-1%FCS at 37°C. Afterwards, cells were washed once with cold PBS and stained with eFluor450 anti-CD14 and AF647 anti-FcγRI for 1 hour at 4°C. Cells were washed with PBS and fixed with 1% PFA. Expression of FcγRI on CD14high monocytes cells was measured on a FACSCanto II (BD Biosciences).
Binding of Ba/F3-FcγRI to monomeric anti-DNP IgG was measured by plating 1×10⁵ Ba/F3-FcγRI cells/well in a 96-well plate, washing the cells with cold PBS and incubating them with different concentrations of this antibody for 1 hour at 4°C. Afterwards, cells were washed with PBS and incubated with a FITC-labeled anti-rabbit IgG antibody for 45 min at 4°C. cells were washed with PBS and fixed with 1% PFA. IgG binding was measured on a FACSCanto II (BD Biosciences). IC binding was assessed with preformed IC (AF647-labeled anti-DNP IgG:DNP24-BSA mixed at 3:1 ratio) and measured on a HyperCyt Autosampler (Intellicyt).
Primary monocytes
De-identified blood was obtained from healthy donors (UNM Hospital Blood and Tissue Bank and MDD UMC Utrecht) and PBMCs were isolated by Ficoll-Paque gradient separation (GE Healthcare). PBMCs were allowed to rest for 1 hour in RPMI-1%FCS at 37°C in (uncoated) eight-well Lab-Tek chambers. Next, PBMCs were stimulated with human TNFα and IFNγ (500 and 400 U/mL, respectively) for 1 hour in RPMI-1%FCS at 37°C. During the last 10 min of incubation, 5 μg/mL IV.3 antigen binding fragments (F(ab’)2) and 1 μg/mL 3G8 F(ab’)2 were added to block the other FcγR (39). Wells were washed with RPMI-1%FCS to remove all unbound cells, leaving the adherent cells (monocytes) in the wells. Next, monocytes were stained for SPT or super-resolution imaging.
Sample preparation for single particle tracking (SPT)
Cytokine-starved Ba/F3-FcγRI cells were stimulated with IL-3, labeled with a low concentration of QD655-labeled anti-DNP IgG (2 nM) for 5 min at RT, and subsequently saturated with unlabeled anti-DNP IgG (100 nM) for 5 min at RT. This resulted in the QD655-labeling of single receptors (2-20 per cell). Cells were washed with PBS, resuspended in Hanks buffer and plated in eight-well Lab-Tek chambers.
SPT image registration and processing
SPT was performed as described previously (20, 40, 41). Images were acquired at 20 frames/s using an Olympus IX71 inverted microscope with a 60× 1.2-numerical-aperture water objective lens combined with an extra 0.6 magnification. An objective heater (Bioptechs) maintained samples at 34-35°C. A mercury lamp with a 436/10nm BP excitation filter provided wide-field excitation. Emission was collected by an electron multiplying charge-coupled device camera (Andor iXon 887) using a DuoView image splitter (Optical Insights) to image the QD655 (655/40 BP) probe. All data reported were collected after focusing on the apical surface of the cells. Image processing was performed using MATLAB (The MathWorks) functions in conjunction with the image processing software DIPImage (Delft University of Technology). Single molecule localization and trajectory elongation were performed as previously described (22). The diffusion coefficient (D) was calculated based on the mean square displacement (MSD) over all QD655 tracks within an experiment (20).
Fluorescence recovery after photobleaching (FRAP)
For FRAP experiments, Ba/F3-FcγRI-eYFP cells were washed twice in PBS and seeded in a fibrin-matrix: 2.5 mg/mL fibrinogen and 1×10⁻⁴ U/uL thrombin in RPMI 1640 without phenol red supplemented with 1% FCS/2 mM L-glutamin on a μ-Dish (35 mm, high; Ibidi). The cells were incubated overnight in this matrix; to prevent dehydration of the matrix RPMI without phenol red with 1% FCS/L-glutamin was added. The next day, FRAP measurements were performed on these cells (no IL-3) or after IL-3 stimulation for 30 min (IL-3). FRAP experiments were performed on a Zeiss LSM710 confocal microscope with a 63× oil objective lens and an environmental chamber for temperature (37°C) and CO2 (5%) control. An argon laser provided the 488nm excitation. 10 pre-bleach images were acquired, after which a small area (~1 μm2) spanning the membrane was bleached for 0.2 s to obtain a bleach of ~50%. The fluorescence in this region was monitored by acquiring images at 7.3 frames/s for 30-35 s per cell. For each condition, >70 cells were measured.
FRAP data analysis
The fluorescence intensity of the bleached area was corrected for loss of fluorescence during the measurement (by subtracting the background fluorescence intensity and correcting for the overall fluorescence intensity) and normalized (by setting the mean fluorescence before bleaching to 1; this corrects for differences in cell fluorescence between measurements). The relative mean fluorescence intensity of the bleached area of all cells per condition was plotted and a non-linear two-phase association (GraphPad Prism 6 software) was used to fit the experimental data. To determine the FcγRI half-time, the relative fluorescence intensity of the bleached area of each imaged cell was plotted individually and a non-linear one-phase association (GraphPad Prism 6 software) was used to fit the data and calculate the half-time.
Super-resolution imaging
Cytokine-starved Ba/F3-FcγRI were stimulated with IL-3 and labeled with AF647-labeled anti-DNP IgG (2 μg/mL), 1 μg/mL DNP24-BSA, preformed IC (AF647-labeled anti-DNP IgG:DNP24-BSA mixed at 3:1 ratio), or AF647-labeled anti-TNP human IgG1, as indicated. This anti-TNP antibody is cross-reactive with DNP and binds DNP24-BSA with a similar affinity as rabbit anti-DNP IgG (as measured with a DNP24-BSA binding ELISA). For two-color super-resolution imaging, cells were labeled with a mix of AF647-labeled anti-DNP IgG (0.667 μg/mL) and Cy3B-labeled anti-DNP IgG (1,333 μg/mL) at RT after IL-3 incubation. After labeling, cells were washed with PBS and incubated in Hanks buffer with or without antigen (DNP24-BSA at 1 μg/mL, unless other concentrations are indicated) for 10 min at 37°C, to induce IC. Cells were washed with Hanks buffer, plated in eight-well Lab-Tek chambers and allowed to adhere for 10 min at 37°C. Cells were then fixed with 4% PFA and 0.2% gluteraldehyde for 1-2 h. Prior to super-resolution imaging, 200 μL of fresh SRB (Super-resolution buffer: 50 mM Tris, 10 mM NaCl, 10% glucose, 168.8 U/mL glucose oxidase, 1404 U/mL catalase, 10 mM cysteamine hydrochloride, pH 8.0) was added to the well. Labeling of human monocytes followed the same protocol as for Ba/F3-FcγRI, with some adjustments: labeling and incubation with antigen were both done at 37°C and monocytes were fixed immediately after incubation with IC.
dSTORM imaging was performed using an inverted microscope (IX71; Olympus America) equipped with an oil-immersion objective 1.45-NA total internal reflection fluorescence objective (U-APO 150×; Olympus America) (18). A 637nm diode laser (HL63133DG; Thorlabs) was used for AF647 excitation and a 561nm frequency-doubled diode laser (Spectra-Physics Cyan Scientific; Newport, Irvine, CA) was used for Cy3B excitation. A quad-band dichroic and emission filter set (LF405/488/561/635-A; Semrock) was used for sample illumination and emission. Emission light was separated onto different quadrants of an AndorIxon 897 electron-multiplying charge-coupled device (EM CCD) camera (Andor Technologies, South Windsor, CT), using a custom built 2-channel splitter with a 585nm dichroic (Semrock) and additional emission filters (692/40 nm and 600/37). The sample chamber of the inverted microscope (IX71; Olympus America, Center Valley, PA) was mounted in a three-dimensional piezostage (Nano-LPS; Mad City Labs, Madison, WI) with a resolution along the xyz-axes of 0.2 nm. Sample drift was corrected for throughout the imaging procedure using a custom-built stage stabilization routine. Images were acquired at 57 frames/s in TIRF and between 10,00020,000 frames were collected for each image reconstruction.
Super-resolution image reconstruction and data analysis
dSTORM images were analyzed and reconstructed with custom-built MATLAB functions as described previously (42, 43). For each image frame, sub-regions were selected based on local maximum intensity. Each sub-region was then fitted to a pixelated Gaussian intensity distribution using a maximum likelihood estimator. Fitted results were rejected based on log-likelihood ratio and the fit precision, which was estimated using the Cramer-Rao lower bound values for each parameter, as well as intensity and background cut-offs.
Analysis of dSTORM FcγRI cluster data was performed using the density-based DBSCAN algorithm (19) implemented in MATLAB (44) as part of a package of local clustering tools (http://stmc.health.unm.edu). Parameters chosen were a maximal distance between neighboring cluster points of epsilon = 50 nm and a minimal cluster size of 6 observations. Cluster boundaries were produced with the MATLAB “boundary” function, using a default methodology that produced contours halfway between a convex hull and a maximally compact surface enclosing the points. The cluster areas within these boundaries were then converted into the radii of circles of equivalent area for a more intuitive interpretation. Regions of interest (ROIs) of size 2 μm × 2 μm (4 μm2) were selected from the set of images from which statistics for the equivalent radii were collected per ROI.
Two-color image analysis
Dual-color images were acquired by imaging AF647 and Cy3B sequentially. AF647 was imaged first to prevent photobleaching by Cy3B. To correct for shifts due to chromatic aberrations channels were aligned using multicolor beads (Tetraspek; Invitrogen). Using the piezostage, we placed a single Tetraspek bead at 36 locations (6χ6) uniformly distributed across the image window. The emission position in both channels was fitted and recorded. This transform was then used to convert fits from the Cy3B channel into the AF647 channel. A channel registration data set was always taken within 2 hours of any data acquisition. This was necessary to ensure that the registration transform was relevant and that no alignment drift occurred. Two-color super-resolution datasets were analyzed by localization-based pair correlation analysis similar to previously described methods (21, 45–48). Briefly, multiple sub-regions within the centers of each cell (of size 3 μm × 3 μm, excluding the lateral membrane region) were selected, and opposite color localizations were collected radially in 5 nm bins after being angularly averaged over a set of ROIs. The computation of the pair correlation function was based on MATLAB code originally developed by Sarah Veatch (21). In some of the analyses, the data was first run through H-SET (Hierarchical Single Emitter Hypothesis Test), a top-down hierarchical clustering algorithm implemented in MATLAB that collapses clusters of observations of blinking fluorophores into single estimates of their true locations (localizations) (23). Briefly, for a cluster of observations to be collapsed into a single localization, a hypothesis test is performed with the null hypothesis that all observations come from the same fluorophore. The null hypothesis is not rejected if the p-value, calculated using a log-likelihood ratio statistic, is larger than a specified level of significance (0.01 was used here).
Rosette assay
The rosette assay using Dynabeads was adapted from Van der Poel et al. (7). DNP24-BSA-Dynabeads were opsonized with anti-DNP IgG using the indicated concentrations. Ba/F3-FcγRI cells were stimulated with IL-3, and where indicated incubated with inhibitors prior to IL-3 stimulation. Ba/F3-FcγRI cells were combined with beads and incubated for 1 hour at 4°C on a shaker. Rosette formation was evaluated using microscopy, cells bound to ≥5 beads were defined as rosettes.
Phos-tag SDS-PAGE
To measure FcγRI phosphorylation, cytokine-starved Ba/F3-FcγRI cells stimulated with 1 ng/mL IL-3 for 45 min at 37°C (where indicated, IL-3 stimulation was preceded with treatment by inhibitors). Afterwards, cells were lysed in cold triton lysis buffer (50 mM Tris-HCl, 150 mM NaCl, 1% triton with Complete EDTA-free protein inhibitor cocktail and PhosSTOP cocktail, Roche). Lysates were incubated with protein G beads coupled to mouse-anti-FcγRI a-subunit antibody m22 for 4 hours at 4°C. Subsequently, beads were washed in triton lysis buffer and boiled in reducing sample buffer. Samples were loaded onto a 12% polyacrylamide separating gel (no Phos-tag) and a 7.5% polyacrylamide separating gel containing 100 μΜ Phos-tag (Wako-Chem) and 200 μΜ MnCk (49, 50). After electrophoresis, the Phos-tag gel was washed in a 1 mM EDTA solution, followed by a wash with EDTA-free solution, before transferring the proteins to a PVDF membrane. Membranes were blocked with BSA and incubated with rabbit anti-FcγRI a-subunit monoclonal antibody (clone EPR4624) for 2 hours at RT. After washing, membranes were incubated with goat anti-rabbit HRP conjugated secondary antibodies for 1 hour at RT. FcγRI was visualized using ECL prime (GE Healthcare, imaged with a ChemiDoc MP (Bio-Rad), and quantified using Image Lab software. For quantification, non-saturated images were used.
Antibody-Dependent Cellular Cytotoxicity
Antibody-dependent cellular cytotoxicity (ADCC) of 51Cr-labeled target cells was described previously (51). Briefly, 1×10⁶ target cells were labeled with 100 μCi (3.7MBq) 51Cr for 2 hours. After extensive washing, cells were adjusted to 105/mL. Blood was obtained from healthy donors at the UMC Utrecht. The neutrophil (PMN) fraction was isolated from blood by Ficoll/Histopaque separation (GE Healthcare; Sigma-Aldrich). PMNs were pretreated for 15 min at 37°C with TNFα (250 U/mL). Effector cells (40:1 effector-to-target ratio), the mAb rituximab at 1 μg/mL, medium and tumor cells were added to round-bottom microtiter plates (Corning Incorporated). After 4 hours incubation at 37°C, 51Cr release into the supernatant was assessed by measuring the radioactivity of supernatant samples in counts per minute (cpm). Percentage of specific lysis was calculated using the following formula: ((experimental cpm – basal cpm)/(maximal cpm – basal cpm)) × 100, with maximal lysis determined in the presence of 3% triton and basal lysis in the absence of Abs and effector cells.
Statistical analysis
Statistical analysis was performed using GraphPad Prism 6 software. An unpaired Student’s t test was used to compare mean values between two groups. The Kruskal-Wallis test that does not assume a normal distribution was used to compare the cluster size distribution. Statistical analysis for other multiple comparisons was performed using one-way analysis of variance (ANOVA) with the indicated post-hoc tests.
Supplementary Material
Supplementary Figure 1. FcγRI surface expression does not change after IL-3 stimulation.
Supplementary Figure 2. FcγRI clustering increases after cytokine stimulation.
Supplementary Figure 3. FcγRI surface expression does not change after latrunculin A pretreatment.
Supplementary Figure 4. FcγRI expression does not change after cytokine stimulation of human myeloid cells.
Acknowledgments:
We thank Dr. Cees van der Poel for generating the cell lines described in this paper. In addition, we wish to thank Dr. Maud Plantinga for generously providing us with human cytokines, Dr. Kendall Crookston for assistance with the isolation of PBMCs, and Dr. Paul Coffer for providing murine IL-3. We gratefully acknowledge use of the STMC Super-Resolution Core, the University of New Mexico (UNM) Cancer Center Fluorescence Microscopy Shared Resource, and the UNM Comprehensive Cancer Center. Funding: This work was supported by grants from the NIH (R01GM100114 to DSL, P50GM085273 to the New Mexico Spatiotemporal Modeling Center, and P30CA118100 to the UNM Comprehensive Cancer Center), an EFIS-IL World Fellowship (AMB), and KiKa grant 227 (TTB).
Abbreviations:
- dSTORM
direct stochastic optical reconstruction microscopy
- FcγRI
Fc gamma receptor I
- FRAP
fluorescence recovery after photobleaching
- IC
immune complex
- OA
okadaic acid
- PBMCs
peripheral blood mononuclear cells
- TC
tautomycetin
Footnotes
Competing interests: The authors declare that they have no competing interests.
Data and materials availability: All data needed to evaluate the conclusions in the paper are present in the paper or the Supplementary Materials.
References and Notes
- 1.Lu J and Sun PD. 2015. Structural mechanism of high affinity FcgammaRI recognition of immunoglobulin G. Immunol. Rev 268: 192–200. [DOI] [PubMed] [Google Scholar]
- 2.Nimmeijahn F and Ravetch JV. 2008. Fcgamma receptors as regulators of immune responses. Nat. Rev. Immunol 8: 34–47. [DOI] [PubMed] [Google Scholar]
- 3.Barnes N, Gavin AL, Tan PS, Mottram P, Koentgen F, and Hogarth PM. 2002. FcgammaRI-deficient mice show multiple alterations to inflammatory and immune responses. Immunity 16: 379–389. [DOI] [PubMed] [Google Scholar]
- 4.Ioan-Facsinay A, de Kimpe SJ, Hellwig SM, van Lent PL, Hofhuis FM, van Ojik HH, Sedlik C, da Silveira SA, Gerber J, de Jong YF, Roozendaal R, Aarden LA, van den Berg WB, Saito T, Mosser D, Amigorena S, Izui S, van Ommen GJ, van Vugt M, van de Winkel JG, and Verbeek JS. 2002. FcgammaRI (CD64) contributes substantially to severity of arthritis, hypersensitivity responses, and protection from bacterial infection. Immunity 16: 391–402. [DOI] [PubMed] [Google Scholar]
- 5.Bevaart L, Jansen MJ, van Vugt MJ, Verbeek JS, van de Winkel JG, and Leusen JH. 2006. The high-affinity IgG receptor, FcgammaRI, plays a central role in antibody therapy of experimental melanoma. Cancer Res. 66: 1261–1264. [DOI] [PubMed] [Google Scholar]
- 6.Heijnen IA, van Vugt MJ, Fanger NA, Graziano RF, de Wit TP, Hofhuis FM, Guyre PM, Capel PJ, Verbeek JS, and van de Winkel JG. 1996. Antigen targeting to myeloid-specific human Fc gamma RI/CD64 triggers enhanced antibody responses in transgenic mice. J. Clin. Invest 97: 331–338. [DOI] [PMC free article] [PubMed] [Google Scholar]
- 7.van der Poel CE, Karssemeijer RA, Boross P, van der Linden JA, Blokland M, van de Winkel JG, and Leusen JH. 2010. Cytokine-induced immune complex binding to the high-affinity IgG receptor, FcgammaRI, in the presence of monomeric IgG. Blood 116: 5327–5333. [DOI] [PubMed] [Google Scholar]
- 8.Springer TA and Dustin ML. 2012. Integrin inside-out signaling and the immunological synapse. Curr. Opin. Cell Biol 24: 107–115. [DOI] [PMC free article] [PubMed] [Google Scholar]
- 9.Bakema JE, Bakker A, de Haij S, Honing H, Bracke M, Koenderman L, Vidarsson G, van de Winkel JG, and Leusen JH. 2008. Inside-out regulation of Fc alpha RI (CD89) depends on PP2A. J. Immunol 181: 4080–4088. [DOI] [PubMed] [Google Scholar]
- 10.Brandsma AM, Jacobino SR, Meyer S, Ten Broeke T, and Leusen JH. 2015. Fc receptor inside-out signaling and possible impact on antibody therapy. Immunol. Rev 268: 74–87. [DOI] [PubMed] [Google Scholar]
- 11.Haystead TA, Sim AT, Carling D, Honnor RC, Tsukitani Y, Cohen P, and Hardie DG. 1989. Effects of the tumour promoter okadaic acid on intracellular protein phosphorylation and metabolism. Nature 337: 78–81. [DOI] [PubMed] [Google Scholar]
- 12.Valerius T, Repp R, de Wit TP, Berthold S, Platzer E, Kalden JR, Gramatzki M, and van de Winkel JG. 1993. Involvement of the high-affinity receptor for IgG (Fc gamma RI; CD64) in enhanced tumor cell cytotoxicity of neutrophils during granulocyte colony-stimulating factor therapy. Blood 82: 931–939. [PubMed] [Google Scholar]
- 13.Horejsi V and Hrdinka M. 2014. Membrane microdomains in immunoreceptor signaling. FEBS Lett. 588: 2392–2397. [DOI] [PubMed] [Google Scholar]
- 14.Garcia-Parajo MF, Cambi A, Torreno-Pina JA, Thompson N, and Jacobson K. 2014. Nanoclustering as a dominant feature of plasma membrane organization. J. Cell. Sci 127: 4995–5005. [DOI] [PMC free article] [PubMed] [Google Scholar]
- 15.Bournazos S, Hart SP, Chamberlain LH, Glennie MJ, and Dransfield I. 2009. Association of FcgammaRIIa (CD32a) with lipid rafts regulates ligand binding activity. J. Immunol 182: 8026–8036. [DOI] [PubMed] [Google Scholar]
- 16.Beekman JM, van der Linden JA, van de Winkel JG, and Leusen JH. 2008. FcgammaRI (CD64) resides constitutively in lipid rafts. Immunol. Lett 116: 149–155. [DOI] [PubMed] [Google Scholar]
- 17.Andrews NL, Pfeiffer JR, Martinez AM, Haaland DM, Davis RW, Kawakami T, Oliver JM, Wilson BS, and Lidke DS. 2009. Small, mobile FcepsilonRI receptor aggregates are signaling competent. Immunity 31: 469–479. [DOI] [PMC free article] [PubMed] [Google Scholar]
- 18.van de Linde S, Loschberger A, Klein T, Heidbreder M, Wolter S, Heilemann M, and Sauer M. 2011. Direct stochastic optical reconstruction microscopy with standard fluorescent probes. Nat. Protoc 6: 991–1009. [DOI] [PubMed] [Google Scholar]
- 19.Ester M, Kriegel H, Sander J, and Xu X. 1996. A Density-based Algorithm for Discovering Clusters a Density-based Algorithm for Discovering Clusters in Large Spatial Databases with Noise. 226–231. [Google Scholar]
- 20.Andrews NL, Lidke KA, Pfeiffer JR, Burns AR, Wilson BS, Oliver JM, and Lidke DS. 2008. Actin restricts FcepsilonRI diffusion and facilitates antigen-induced receptor immobilization. Nat. Cell Biol 10: 955–963. [DOI] [PMC free article] [PubMed] [Google Scholar]
- 21.Veatch SL, Machta BB, Shelby SA, Chiang EN, Holowka DA, and Baird BA. 2012. Correlation functions quantify super-resolution images and estimate apparent clustering due to over-counting. PLoS One 7: e31457. [DOI] [PMC free article] [PubMed] [Google Scholar]
- 22.Valley CC, Arndt-Jovin DJ, Karedla N, Steinkamp MP, Chizhik AI, Hlavacek WS, Wilson BS, Lidke KA, and Lidke DS. 2015. Enhanced dimerization drives ligand-independent activity of mutant epidermal growth factor receptor in lung cancer. Mol. Biol. Cell 26: 4087–4099. [DOI] [PMC free article] [PubMed] [Google Scholar]
- 23.Lin J, Wester MJ, Graus MS, Lidke KA, and Neumann AK. 2016. Nanoscopic cell-wall architecture of an immunogenic ligand in Candida albicans during antifungal drug treatment. Mol. Biol. Cell 27: 1002–1014. [DOI] [PMC free article] [PubMed] [Google Scholar]
- 24.Beekman JM, van der Poel CE, van der Linden JA, van den Berg DL, van den Berghe PV, van de Winkel JG, and Leusen JH. 2008. Filamin A stabilizes Fc gamma RI surface expression and prevents its lysosomal routing. J. Immunol 180: 3938–3945. [DOI] [PubMed] [Google Scholar]
- 25.Beekman JM, Bakema JE, van de Winkel JG, and Leusen JH. 2004. Direct interaction between FcgammaRI (CD64) and periplakin controls receptor endocytosis and ligand binding capacity. Proc. Natl. Acad. Sci. U. S. A 101: 1039210397. [DOI] [PMC free article] [PubMed] [Google Scholar]
- 26.Beekman JM, Bakema JE, van der Poel CE, van der Linden JA, van de Winkel JG, and Leusen JH. 2008. Protein 4.1G binds to a unique motif within the Fc gamma RI cytoplasmic tail. Mol. Immunol 45: 2069–2075. [DOI] [PubMed] [Google Scholar]
- 27.Ohta Y, Stossel TP, and Hartwig JH. 1991. Ligand-sensitive binding of actin-binding protein to immunoglobulin G Fc receptor I (Fc gamma RI). Cell 67: 275–282. [DOI] [PubMed] [Google Scholar]
- 28.Hein MY, Hubner NC, Poser I, Cox J, Nagaraj N, Toyoda Y, Gak IA, Weisswange I, Mansfeld J, Buchholz F, Hyman AA, and Mann M. 2015. A human interactome in three quantitative dimensions organized by stoichiometries and abundances. Cell 163: 712–723. [DOI] [PubMed] [Google Scholar]
- 29.Termini CM, Cotter ML, Marjon KD, Buranda T, Lidke KA, and Gillette JM. 2014. The membrane scaffold CD82 regulates cell adhesion by altering alpha4 integrin stability and molecular density. Mol. Biol. Cell 25: 1560–1573. [DOI] [PMC free article] [PubMed] [Google Scholar]
- 30.Treanor B, Depoil D, Bruckbauer A, and Batista FD. 2011. Dynamic cortical actin remodeling by ERM proteins controls BCR microcluster organization and integrity. J. Exp. Med 208: 1055–1068. [DOI] [PMC free article] [PubMed] [Google Scholar]
- 31.Klasener K, Maity PC, Hobeika E, Yang J, and Reth M. 2014. B cell activation involves nanoscale receptor reorganizations and inside-out signaling by Syk. Elife 3: e02069. [DOI] [PMC free article] [PubMed] [Google Scholar]
- 32.Lu J, Chu J, Zou Z, Hamacher NB, Rixon MW, and Sun PD. 2015. Structure of FcgammaRI in complex with Fc reveals the importance of glycan recognition for high-affinity IgG binding. Proc. Natl. Acad. Sci. U. S. A 112: 833–838. [DOI] [PMC free article] [PubMed] [Google Scholar]
- 33.Kiyoshi M, Caaveiro JM, Kawai T, Tashiro S, Ide T, Asaoka Y, Hatayama K, and Tsumoto K. 2015. Structural basis for binding of human IgG1 to its high-affinity human receptor FcgammaRI. Nat. Commun 6: 6866. [DOI] [PMC free article] [PubMed] [Google Scholar]
- 34.Edberg JC, Qin H, Gibson AW, Yee AM, Redecha PB, Indik ZK, Schreiber AD, and Kimberly RP. 2002. The CY domain of the Fcgamma RIa alpha-chain (CD64) alters gamma-chain tyrosine-based signaling and phagocytosis. J. Biol. Chem 277: 41287–41293. [DOI] [PubMed] [Google Scholar]
- 35.Molfetta R, Quatrini L, Gasparrini F, Zitti B, Santoni A, and Paolini R. 2014. Regulation of fc receptor endocytic trafficking by ubiquitination. Front. Immunol 5: 449. [DOI] [PMC free article] [PubMed] [Google Scholar]
- 36.Kushner BH and Cheung NK. 1989. GM-CSF enhances 3F8 monoclonal antibody-dependent cellular cytotoxicity against human melanoma and neuroblastoma. Blood 73: 1936–1941. [PubMed] [Google Scholar]
- 37.Wurflein D, Dechant M, Stockmeyer B, Tutt AL, Hu P, Repp R, Kalden JR, van de Winkel JG, Epstein AL, Valerius T, Glennie M, and Gramatzki M. 1998. Evaluating antibodies for their capacity to induce cell-mediated lysis of malignant B cells. Cancer Res. 58: 3051–3058. [PubMed] [Google Scholar]
- 38.Kruijsen D, Einarsdottir HK, Schijf MA, Coenjaerts FE, van der Schoot EC, Vidarsson G, and van Bleek GM. 2013. Intranasal administration of antibody-bound respiratory syncytial virus particles efficiently primes virus-specific immune responses in mice. J. Virol. 87: 7550–7557. [DOI] [PMC free article] [PubMed] [Google Scholar]
- 39.Golay J, Da Roit F, Bologna L, Ferrara C, Leusen JH, Rambaldi A, Klein C, and Introna M. 2013. Glycoengineered CD20 antibody obinutuzumab activates neutrophils and mediates phagocytosis through CD16B more efficiently than rituximab. Blood 122: 3482–3491. [DOI] [PubMed] [Google Scholar]
- 40.Low-Nam ST, Lidke KA, Cutler PJ, Roovers RC, van Bergen en Henegouwen PM, Wilson BS, and Lidke DS. 2011. ErbB1 dimerization is promoted by domain co-confinement and stabilized by ligand binding. Nat. Struct. Mol. Biol 18: 1244–1249. [DOI] [PMC free article] [PubMed] [Google Scholar]
- 41.Schwartz SL, Yan Q, Telmer CA, Lidke KA, Bruchez MP, and Lidke DS. 2015. Fluorogen-activating proteins provide tunable labeling densities for tracking FcepsilonRI independent of IgE. ACS Chem. Biol 10: 539–546. [DOI] [PMC free article] [PubMed] [Google Scholar]
- 42.Smith CS, Joseph N, Rieger B, and Lidke KA. 2010. Fast, single-molecule localization that achieves theoretically minimum uncertainty. Nat. Methods 7: 373–375. [DOI] [PMC free article] [PubMed] [Google Scholar]
- 43.Huang F, Schwartz SL, Byars JM, and Lidke KA. 2011. Simultaneous multiple-emitter fitting for single molecule super-resolution imaging. Biomed. Opt. Express 2: 1377–1393. [DOI] [PMC free article] [PubMed] [Google Scholar]
- 44.Daszykowski M, Walczak B, and Massart DL. 2002. Looking for natural patterns in analytical data. 2. Tracing local density with OPTICS. J. Chem. Inf. Comput. Sci 42: 500–507. [DOI] [PubMed] [Google Scholar]
- 45.Churchman LS and Spudich JA. 2012. Colocalization of fluorescent probes: accurate and precise registration with nanometer resolution. Cold Spring Harb Protoc. 2012: 141–149. [DOI] [PMC free article] [PubMed] [Google Scholar]
- 46.Semrau S, Holtzer L, Gonzalez-Gaitan M, and Schmidt T. 2011. Quantification of biological interactions with particle image cross-correlation spectroscopy (PICCS). Biophys. J 100: 1810–1818. [DOI] [PMC free article] [PubMed] [Google Scholar]
- 47.Sengupta P, Jovanovic-Talisman T, Skoko D, Renz M, Veatch SL, and Lippincott-Schwartz J. 2011. Probing protein heterogeneity in the plasma membrane using PALM and pair correlation analysis. Nat. Methods 8: 969–975. [DOI] [PMC free article] [PubMed] [Google Scholar]
- 48.Shelby SA, Holowka D, Baird B, and Veatch SL. 2013. Distinct stages of stimulated FcepsilonRI receptor clustering and immobilization are identified through superresolution imaging. Biophys. J 105: 2343–2354. [DOI] [PMC free article] [PubMed] [Google Scholar]
- 49.Kinoshita E, Kinoshita-Kikuta E, and Koike T. 2009. Separation and detection of large phosphoproteins using Phos-tag SDS-PAGE. Nat. Protoc 4: 1513–1521. [DOI] [PubMed] [Google Scholar]
- 50.Kawabata N and Matsuda M. 2016. Cell Density-Dependent Increase in Tyrosine-Monophosphorylated ERK2 in MDCK Cells Expressing Active Ras or Raf. PLoS One 11: e0167940. [DOI] [PMC free article] [PubMed] [Google Scholar]
- 51.Hamaguchi Y, Xiu Y, Komura K, Nimmerjahn F, and Tedder TF. 2006. Antibody isotype-specific engagement of Fcgamma receptors regulates B lymphocyte depletion during CD20 immunotherapy. J. Exp. Med 203: 743–753. [DOI] [PMC free article] [PubMed] [Google Scholar]
Associated Data
This section collects any data citations, data availability statements, or supplementary materials included in this article.
Supplementary Materials
Supplementary Figure 1. FcγRI surface expression does not change after IL-3 stimulation.
Supplementary Figure 2. FcγRI clustering increases after cytokine stimulation.
Supplementary Figure 3. FcγRI surface expression does not change after latrunculin A pretreatment.
Supplementary Figure 4. FcγRI expression does not change after cytokine stimulation of human myeloid cells.