

Abstract
An estimated 300,000 cases of Lyme disease occur in the United States annually. Disseminated Lyme disease may result in carditis, arthritis, facial palsy or meningitis, sometimes requiring hospitalization. We describe the epidemiology and cost of Lyme disease-related hospitalizations. We analysed 2005–2014 data from the Truven Health Analytics MarketScan Commercial Claims and Encounters Databases to identify inpatient records associated with Lyme disease based on International Classification of Diseases, Ninth Revision, Clinical Modification (ICD-9-CM) codes. We estimated the annual number and median cost of Lyme disease-related hospitalizations in the United States in persons under 65 years of age. Costs were adjusted to reflect 2016 dollars. Of 20,983,165 admission records contained in the inpatient databases during the study period, 2,823 (0.01%) met inclusion criteria for Lyme disease-related hospitalizations. Over half of the identified records contained an ICD-9-CM code for meningitis (n = 614), carditis (n = 429), facial palsy (n = 400) or arthritis (n = 377). Nearly 60% of hospitalized patients were male. The median cost per Lyme disease-related hospitalization was $11,688 (range: $140–$323,613). The manifestation with the highest median cost per stay was carditis ($17,461), followed by meningitis ($15,177), arthritis ($13,012) and facial palsy ($10,491). Median cost was highest among the 15- to 19-year-old age group ($12,991). Admissions occurring in January had the highest median cost ($13,777) for all study years. Based on extrapolation to the U.S. population, we estimate that 2,196 Lyme disease-related hospitalizations in persons under 65 years of age occur annually with an estimated annual cost of $25,826,237. Lyme disease is usually treated in an outpatient setting; however, some patients with Lyme disease require hospitalization, underscoring the need for effective prevention methods to mitigate these serious cases. Information from this analysis can aid economic evaluations of interventions that prevent infection and advances in disease detection.
Keywords: claims analysis, cost of illness, Lyme disease, tick borne diseases
1 |. INTRODUCTION
Lyme disease is a tickborne illness caused by select spirochaetes within the Borrelia burgdorferi sensu lato complex (Steere, 2015). In the United States, the majority of Lyme disease infections are caused by B. burgdorferi sensu stricto; Borrelia mayonii was also recently identified as a cause of infection in the upper Midwest (Pritt et al., 2016; Stanek, Wormser, Gray, & Strle, 2012). Most Lyme disease cases in the United States occur in the Northeast, mid-Atlantic and upper Midwest. Symptoms of early Lyme disease typically include erythema migrans, fever, chills and headache (Hu, 2016; Steere, 2015). Untreated Lyme disease may lead to severe manifestations such as arthritis, facial palsy, meningitis or carditis (Hu, 2016; Kwit, Nelson, Max, & Mead, 2017; Steere, 1989, 2015). Patients presenting with Lyme carditis often require hospitalization for cardiac monitoring; patients undergoing parenteral antibiotic therapy or those with neurologic or arthritic manifestations may also require hospitalization (Hu, 2016).
An estimated 300,000 cases of Lyme disease are diagnosed each year in the United States (Hinckley et al., 2014; Nelson et al., 2015). Previous analyses of claims data focused on patterns of disseminated Lyme disease manifestations and found that a higher proportion of patients with disseminated Lyme disease were male compared to patients with non-disseminated Lyme disease (Kwit et al., 2017). Other findings included a higher risk of complete heart block among males 15–29 years of age and a higher risk of meningitis among females 10–14 years of age and males 20–24 years of age (Kwit et al., 2017). National surveillance data collected by state and local jurisdictions and voluntarily submitted to CDC provide some information on clinical features (Schwartz, Hinckley, Mead, Hook, & Kugeler, 2017); however, hospitalization information is often unavailable or limited to admission and discharge dates. Healthcare claims data can provide more detailed information on Lyme disease-related hospitalizations.
Although several analyses have been conducted to ascertain the cost of Lyme disease in the United States, most of this research has focused on overall costs, and information about the cost of Lyme disease-associated hospitalization in the United States is lacking (Adrion, Aucott, Lemke, & Weiner, 2015; Maes, Lecomte, & Ray, 1998; Meltzer, Dennis, & Orloski, 1999; Zhang et al., 2006). We provide the results of an analysis of the costs of Lyme disease-related hospitalizations and some of the characteristics that may influence those costs. Cost estimates can guide future Lyme disease educational activities and aid public health officials when considering the cost effectiveness of primary and secondary prevention methods.
2 |. METHODS
2.1 |. Database
Truven Health Analytics® MarketScan Commercial Claims and Encounters Databases contain de-identified patient data for individuals under 65 years of age who are enrolled in a participating employer-sponsored health insurance plan. These databases contain detailed information on patient encounters with healthcare providers for over 40 million individuals per year (Hansen, 2017). The Inpatient Admissions databases were used for this analysis; these databases contain information on patient demographics, diagnosis codes, procedure codes, region of primary beneficiary residence and total cost of hospitalization. Principal diagnosis codes were available along with up to fourteen secondary diagnosis codes for each hospitalization (Hansen, 2017).
2.2 |. Inclusion criteria
The study population consisted of patients whose records were included in the MarketScan Inpatient Admissions database diagnosed with Lyme disease and hospitalized during 2005–2014. We identified such patients using the Lyme disease International Classification of Diseases, Ninth Revision, Clinical Modification (ICD-9-CM) code 088.81; ICD-10-CM was not implemented in the United States until October 2015. We included only those patients with either (a) a principal diagnosis code for Lyme disease or (b) a principal diagnosis code for a known manifestation or co-infection of Lyme disease plus a secondary diagnosis code for Lyme disease (Table S1). Using these criteria increased the likelihood of capturing records of individuals who were hospitalized as a result of Lyme disease.
We calculated the cost per hospital stay using the variable in the MarketScan database that represented the sum of all payments made by patients and insurance companies to providers for services provided during an inpatient stay. If the length of time between the discharge date and admit date of two hospitalizations for the same patient were within 14 days of each other, we considered those as the equivalent of one stay and combined the costs. Patients who were re-hospitalized outside of the 14-day window were included in the analysis as a separate hospitalization. For patients who had more than one Lyme disease-related manifestation, we attributed total cost of hospitalization to the manifestation expected to generate the most cost as determined by the manifestation’s rank order based on the median cost of hospitalization for those patients with one manifestation (carditis > meningitis >arthritis > facial palsy). In MarketScan, enrollee region of residence is determined by primary beneficiary residence. We grouped hospital stays by region of patient residence into the following four regions: Northeast, North Central, South and West as determined by the U.S. Census Bureau (Figure S1). We adjusted all costs to 2016 dollars using the personal consumption expenditures (PCE) healthcare price index (U.S. Bureau of Economic Analysis, 2017).
2.3 |. Calculation of median cost of hospitalization for any condition
To provide comparison costs, we used the 2016 MarketScan Inpatient Admissions database to calculate the median cost of a hospitalization due to any condition.
2.4 |. Estimation of annual cost
We estimated, for the population recorded in the MarketScan database, the incidence of Lyme disease-related hospitalization by age group for persons under 65 years of age using the Annual Enrollment Summary databases to provide denominator data in person-years. We then used the calculated incidences to derive the estimated number of Lyme disease-related hospitalizations in the 2010 US population by direct standardization. Finally, we estimated the annual cost of Lyme disease-related hospitalizations in the United States by multiplying the number of estimated Lyme disease-related hospitalizations by age group with the median cost per Lyme disease-related hospitalization per age group. Due to the skewed nature of healthcare costs in the United States, median cost was used for extrapolation calculations to avoid overstating costs.
3 |. RESULTS
Of the 20,983,165 admission records contained in the inpatient databases, 2,823 (0.01%) met inclusion criteria for Lyme disease-related hospitalization between 2005 and 2014. These hospitalizations consisted of 2,807 unique patients. Of the Lyme disease-related hospitalizations, 1,240 (44%) patients had a principal diagnosis code for Lyme disease (n = 1,173) or a Lyme disease co-infection (n = 67) but did not have an ICD-9-CM code for any of the specific predetermined manifestations. Of the hospitalizations that did have a code for a specific predetermined manifestation, 1,352 (48%) patients had diagnostic codes for one Lyme disease-related manifestation, and 231 (8%) patients had codes for more than one manifestation (Figure 1). Hospitalizations without a code for a predetermined manifestation were slightly older (median age = 46 years) compared to hospitalizations with a code for a predetermined manifestation (median age = 35 years). A slightly lower proportion of hospitalizations were among males (53%) in the group without a coded manifestation compared to the group with a coded manifestation (64%). Seasonality was similar between the two groups.
FIGURE 1.

Study population and number of patients with Lyme disease-related hospitalizations and manifestations. *Two individual patients had two separate hospitalization stays where the principal diagnosis code was Lyme disease on 1 stay and a manifestation on the other stay. †1,240 hospitalizations did not have a diagnosis code for a pre-specified manifestation
A total of 614 (22%) patients were diagnosed with meningitis, 429 (15%) patients were diagnosed with carditis, 400 (14%) patients were diagnosed with facial palsy, and 377 (13%) patients were diagnosed with arthritis. Combinations of manifestations included meningitis and facial palsy (n = 175), carditis and meningitis (n = 17), carditis and arthritis (n = 11), carditis and facial palsy (n = 10), meningitis and arthritis (n = 10), arthritis and facial palsy (n = 2), and facial palsy, carditis and meningitis (n = 6).
3.1 |. Demographics
3.1.1 |. Sex
Nearly 60% of hospitalized patients were male (n = 1,675). Male patients also comprised a larger proportion of those hospitalized with each manifestation compared to female patients: 79% of patients with carditis, 66% of patients with arthritis, 56% of patients with meningitis and 58% of patients with facial palsy were male.
3.1.2 |. Age
Median age of hospitalized patients was 41 years with a range of 0 to 64 years. Age distribution was bimodal with peaks in the 5- to 9-year age group and the age groups spanning 40–64 years (Table S2). Records for hospitalized children and young adults were more commonly coded with a specific manifestation—80% of patients in the 0-to 4-year age group, 79% of patients in the 5- to 9-year age group, 76% of patients in the 10- to 14-year age group, 68% of the 15- to 19-year age group and 62% of the 20- to 24-year age group had at least one specific manifestation. In comparison, the proportion of patients with at least one diagnosed manifestation ranged from 41% to 54% in age groups falling between 25 and 64 years. The most common manifestation among patients in the 0- to 4-year age group was arthritis; while in the 5- to 9-year and 10- to 14-year age groups, meningitis was most commonly reported closely followed by arthritis. In contrast, patients in age groups 15 to 49 most commonly presented with either meningitis or carditis (Figure 2). Facial palsy and meningitis were the most commonly coded manifestations in the 50- to 64-year age groups.
FIGURE 2.
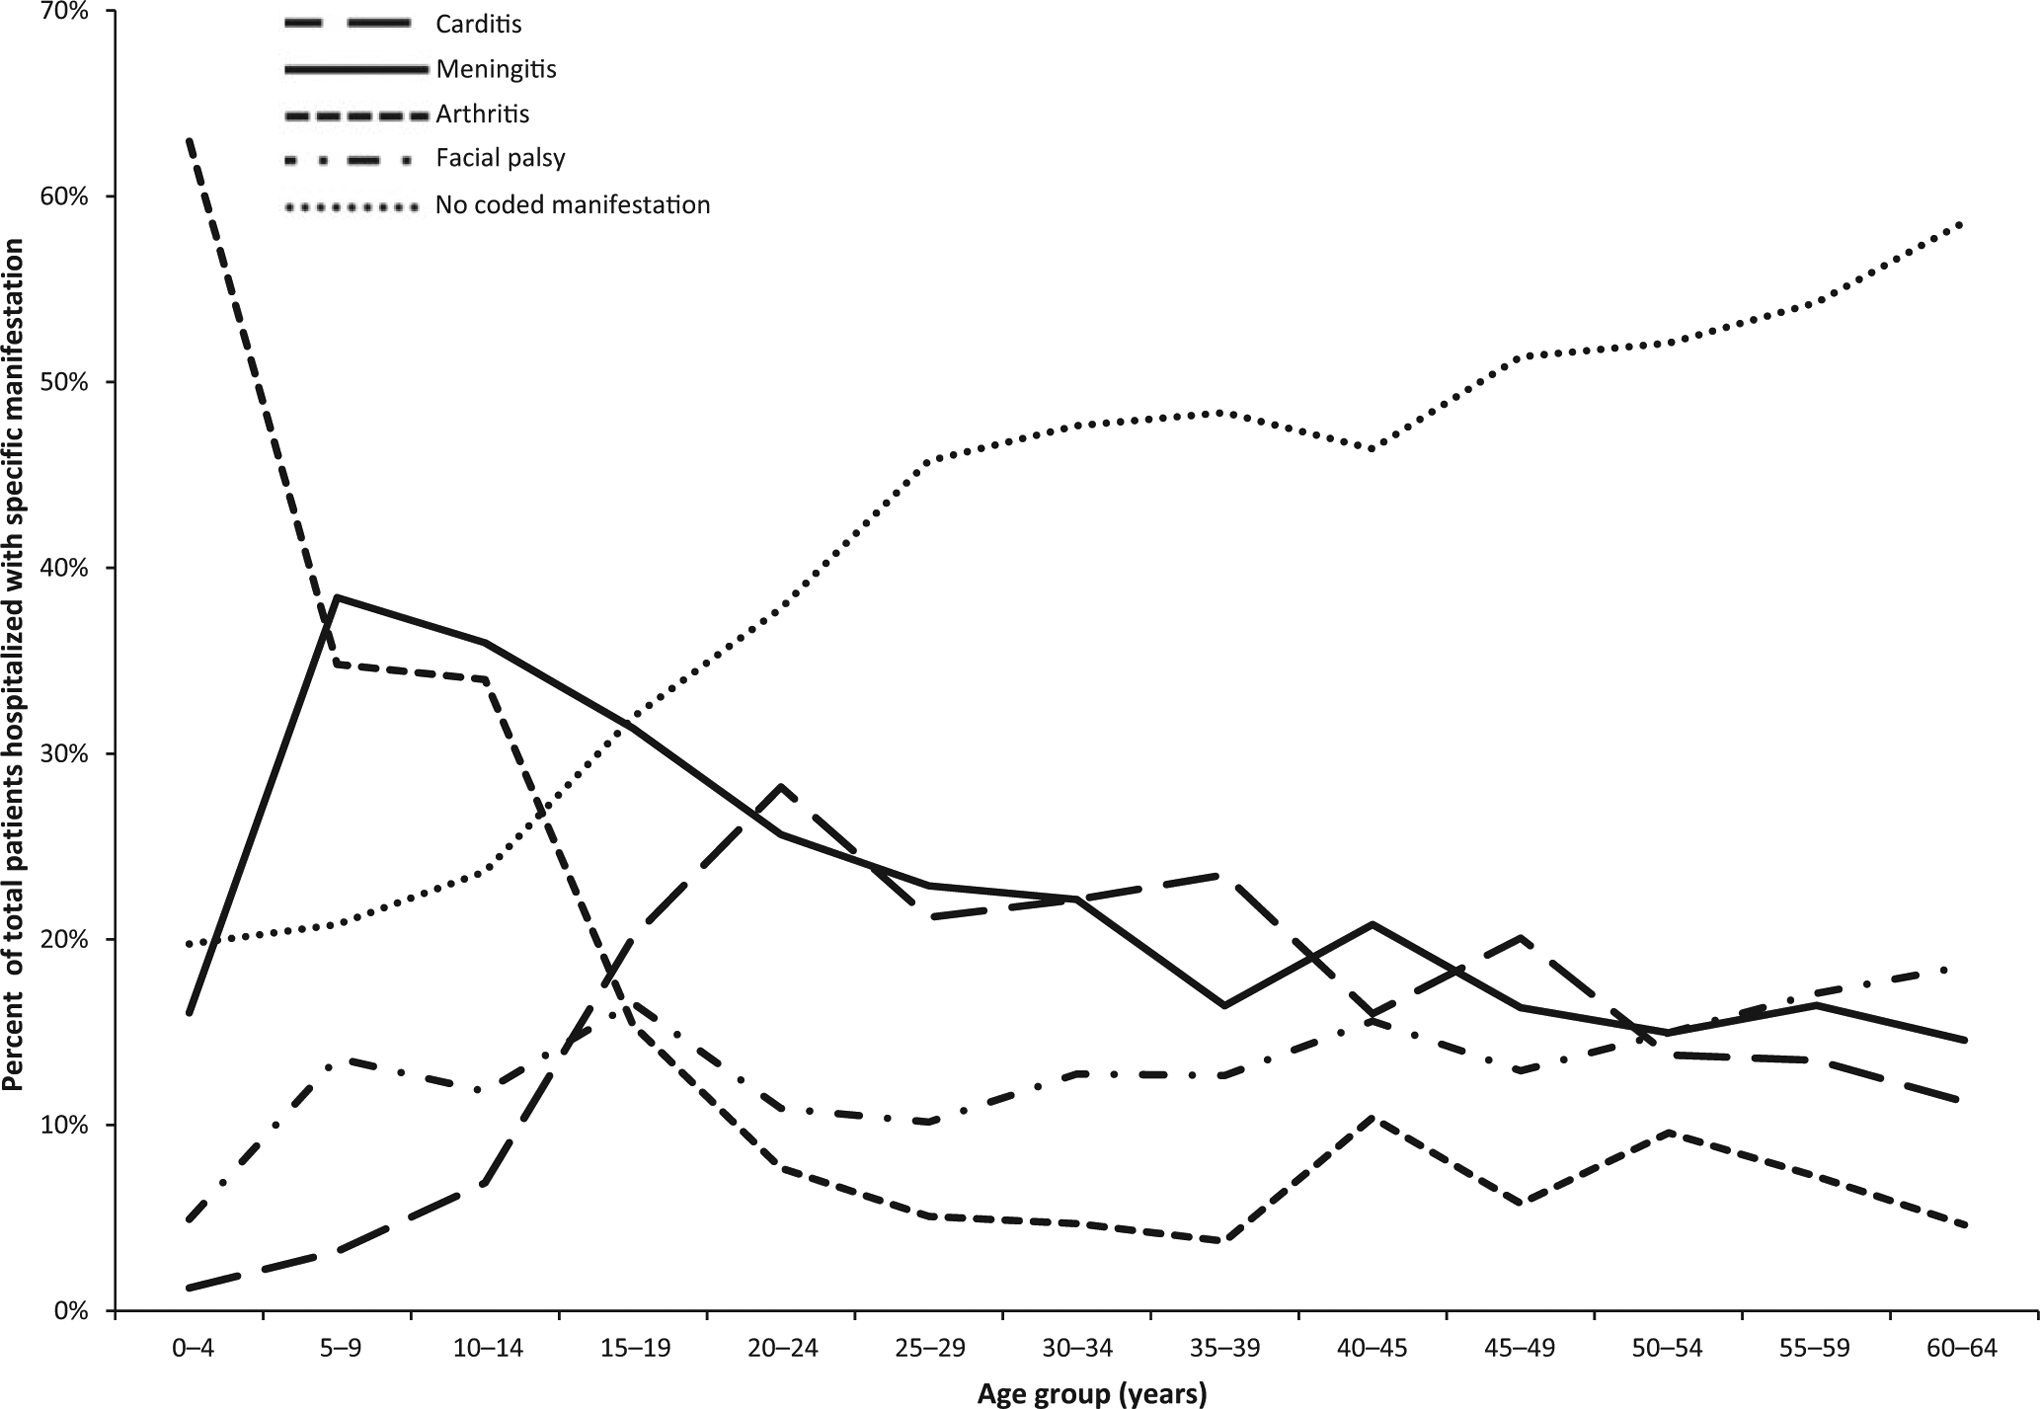
Proportion of Lyme disease-related hospitalizations by age group and manifestation—United States, 2005–2014
3.1.3 |. Seasonality and geographic distribution
Over 60% of hospitalizations had an admission date between June and August (Figure 3). The proportion of hospitalized patients with coded manifestations fluctuated by month (Figure 4). The majority of patients were residents of the Northeast region (61%), followed by residents of the South region (24%), North Central region (11%) and West region (2%); region of residence was unknown for 2% of patients. Among patients with information available for both place of hospitalization and region of residence (n = 2,394), most were hospitalized in the same region in which the primary beneficiary resided (96%). The highest incidence of Lyme disease hospitalizations occurred in residents of the Northeast (3.2 hospitalizations/100,000 persons), followed by the South (0.5/100,000 persons), North Central (0.4/100,000 persons) and West (0.1/100,000 persons). The North Central and Northeast regions had a higher percentage of patients with carditis (16%–17%) compared to the South (10%). The Northeast, South and West regions had a slightly higher percentage of patients with meningitis (22%–24%) compared to the North Central region (17%).
FIGURE 3.

Number, mean and median cost of Lyme disease-related hospitalizations by month of admission—United States, 2005–2014
FIGURE 4.

Proportion of manifestation in patients hospitalized for Lyme disease, by month—United States, 2005–2014
3.2 |. Cost of hospitalization
Overall, the median cost of hospitalization due to any condition (related and unrelated to Lyme disease) was $13,113. The median cost of Lyme disease-related hospitalization was $11,688 per hospitalization (Table 1; Figure 5), with a range of $140 to $323,613 per hospitalization. Costs were non-normally distributed (skewness = 7.5; kurtosis = 110.7). The median hospitalization costs among patients with one manifestation were ranked from high to low as follows: carditis ($17,557), meningitis ($14,916), arthritis ($13,012) and facial palsy ($10,491). Using these rankings to categorize costs for patients with more than one coded manifestation, hospitalization costs were attributed to carditis for 429 patients, meningitis for 591 patients, arthritis for 356 patients and facial palsy for 207 patients (Table 1). The manifestation with the highest median cost per stay after re-categorization was carditis ($17,461), followed by meningitis ($15,177) and arthritis ($13,012). Patients with facial palsy had hospitalizations with the lowest median cost among the manifestation groups ($10,491). The median hospitalization cost for patients who did not have a code for one of the categorized manifestations was $9,436.
TABLE 1.
Mean and median cost and length of stay of Lyme disease-related hospitalizations by manifestation—United States, 2005–2014
| Manifestation | N (%) | Mean cost (2016 USD) | Median cost (2016 USD) | Interquartile range (2016 USD) | Mean length of stay (days) | Median length of stay (days) |
|---|---|---|---|---|---|---|
| All Lyme disease-related hospitalizations | 2,823 (100.0) | 15,638 | 11,688 | 11,027 | 3.5 | 3 |
| Carditis | 429 (15.2) | 23,344 | 17,461 | 18,161 | 4.3 | 4 |
| Meningitis | 591 (20.9) | 18,412 | 15,177 | 14,402 | 3.6 | 3 |
| Arthritis | 356 (12.6) | 15,221 | 13,012 | 10,939 | 3.3 | 3 |
| Facial palsy | 207 (7.3) | 13,191 | 10,491 | 7,560 | 3.3 | 2 |
| No coded manifestation | 1,240 (43.9) | 12,179 | 9,436 | 7,309 | 3.1 | 2 |
FIGURE 5.

Cost of Lyme disease-related hospitalizations by manifestation—United States, 2005–2014
Among 1,352 patients with a single coded manifestation, the median hospitalization cost was $13,882. In contrast, 231 patients with two or more coded manifestations had a median hospitalization cost of $15,747. The median length of stay among all Lyme disease-related hospitalizations was 3 days (Table 1). Patients with carditis had a median length of stay of 4 days, while patients with meningitis and arthritis had a median length of stay of 3 days, and facial palsy patients had a median length of stay of 2 days.
Median cost was similar between male patients ($11,752) and female patients ($11,594). When comparing costs among age groups, the 15- to 19-year age group had the highest median cost ($12,991), closely followed by the 60- to 64-year age group ($12,843). The age group with the lowest median cost was 35- to 39-year-olds ($10,510) (Table S2).
Median cost of hospitalization fluctuated with month of admission; median costs were highest during the months of August, December and January ($13,050, $13,409 and $13,777, respectively) and lowest in the month of June ($9,830) (Figure 3; Table S3).
Median cost of hospitalization varied by the geographic region where the hospitalization occurred. The West had the highest median cost of hospitalization ($16,550), while the South had the lowest median cost of hospitalization ($9,977) (Figure S2).
Based on the estimated incidence of Lyme disease-related hospitalizations by age group in the MarketScan population among the total U.S. population, an estimated 2,196 Lyme disease-related hospitalizations among patients under 65 years of age occur each year resulting in an incidence of 0.82 hospitalizations/ 100,000 persons. Applying the calculated median costs by age group resulted in an estimated median annual cost of $25,826,237 (Table S4).
4 |. DISCUSSION
By examining commercial insurance claims data, we demonstrate that Lyme disease may be responsible for over 2,000 hospitalizations and nearly 26 million dollars’ worth of medical costs each year in the United States. Distribution of Lyme disease-related hospitalizations by month of onset reflects the seasonal pattern of cases reported through national surveillance (Schwartz et al., 2017). Lyme disease-related hospitalization costs were slightly higher in the months of August, December and January compared to other times of the year. High costs in the winter months may be due to disseminated illness, which can occur months after initial infection (Hu, 2016).
Incidence of Lyme disease-related hospitalization has been previously reported in European studies. A study conducted in England and Wales found that incidence increased from 0.08 to 0.53 Lyme disease-related hospitalizations/100,000 persons over an 18-year period; in Finland, incidence increased from 0.4 to 19 Lyme disease-related hospitalizations/100,000 persons over a 19-year period; incidence from other European studies also fell within that range, with the exception of Bleyenheuft et al., who reported a cumulative incidence of 228.8 Lyme disease-related hospitalizations/100,000 persons over an 8-year period in Belgium. (Bleyenheuft et al., 2015; Lohr et al., 2015; Sajanti et al., 2017; Septfons et al., 2019; Tulloch et al., 2019; Vandenesch et al., 2014). In the context of these international studies, our estimate of 0.82 U.S. hospitalizations/100,000 persons falls on the low end of this range; however, several factors may contribute to this difference. Lyme disease risk in the United States is highly focal, with 95% of cases occurring in just 14 high-incidence states (Schwartz et al., 2017). This is demonstrated when comparing incidences among regions in MarketScan; Lyme disease-related hospitalization incidence in the Northeast, the region comprised of nine high-incidence states, was much higher than other regions. Furthermore, the absence of persons aged 65 and older in our analysis likely resulted in a lower incidence estimate as this demographic group is at higher risk for Lyme disease overall and likely at higher risk for hospitalization and comorbidities than younger persons. In addition, incidence rates are dependent on several factors including regional tick infection prevalence, predominant species causing human illness and patterns of healthcare utilization. In the United States, most Lyme disease infections are caused by B. burgdorferi sensu stricto. In Europe, Lyme disease is also caused by B. garinii and B. afzelii; B. garinii has been more commonly associated with neuroborreliosis, a condition often requiring hospitalization (Rauter & Hartung, 2005).
To our knowledge, this is the first analysis to estimate the cost of Lyme disease-related hospitalization in the United States. Several European studies reported Lyme disease-related hospitalization costs that were much lower than the cost estimates we describe here. For example, the authors of a Scottish study reported the costs of an average inpatient stay by manifestation. After converting European costs to U.S. dollars using an exchange rate during the period of study and then inflating to 2016 cost using the PCE healthcare price index, the approximate cost of a neurologic (£5,857; $14,293 adjusted) inpatient stay was comparable to what we found in U.S. data, but costs for cardiac (£440; $1,074 adjusted), dermatologic (£2,198; $5,364 adjusted) and musculoskeletal/arthritic (£1,909; $4,659 adjusted) manifestations of Lyme disease were much lower than what we found in U.S. data (Board of Governors of the Federal Reserve System, 2020; Joss, Davidson, Ho-Yen, & Ludbrook, 2003; U.S. Bureau of Economic Analysis, 2017). In addition, the relative costs of manifestations compared with one another differed as well (Board of Governors of the Federal Reserve System, 2020; Joss et al., 2003; U.S. Bureau of Economic Analysis, 2017). After making similar adjustments using exchange rates and PCE inflation rates to estimates reported in other publications, the median cost of a Lyme disease-related hospitalization in Germany (€2,912; $4,619 adjusted) and the average cost of disseminated Lyme disease-related hospitalization in the Netherlands (€1,315; $1,839 adjusted) were also much lower than what we found in U.S. data (Board of Governors of the Federal Reserve System, 2020; Lohr et al., 2015; van den Wijngaard et al., 2017; U.S. Bureau of Economic Analysis, 2017). Whilst these comparisons between European and U.S. Lyme disease-related hospitalization costs indicate some differences, we note that large differences in health systems make it difficult to evaluate differences in specific costs.
This study is subject to several limitations. First, the MarketScan databases include information from employer-sponsored health plans and are not entirely representative of the U.S. population. Uninsured patients, members of the military, those enrolled in Medicare or Medicaid, and patients 65 years of age and older were not represented in the MarketScan databases used in this study, and the calculated estimates may not be generalizable to the national population. Nonetheless, the age and sex distributions among Lyme disease hospitalizations in this analysis were similar to what has been observed in national surveillance data (Schwartz et al., 2017). Second, while we attempted to minimize misclassification by using very specific inclusion criteria, it is possible that our study population included individuals who did not have Lyme disease. Conversely, some individuals who were hospitalized for a Lyme disease-related illness were likely not included in this analysis. In addition, this analysis relies on the assumption that diagnosis is accurate and complete; however, coding is subject to human error and may be influenced by factors related to billing, proficiency of the coding specialist and facility-specific policies (Sickbert-Bennett, Weber, Poole, MacDonald, & Maillard, 2010). In addition, this analysis is limited to hospitalization data, and we did not include any outpatient medical costs that may also have been associated with these hospitalizations. Finally, societal costs such as time away from work or school were not calculated; therefore, an important source of financial burden for society and for the patients themselves may have been excluded from this analysis.
Lyme disease is a common illness typically considered treatable in an outpatient setting; however, some cases of Lyme disease require inpatient care. In this analysis, we estimate that over 2,000 Lyme disease-related hospitalizations occur each year in the United States, resulting in millions of dollars’ worth of medical costs. These results underscore the need for innovations in Lyme disease prevention to mitigate these severe Lyme disease cases. Given the lack of progress in identifying effective environmental control measures and the difficulty with implementing sustained and consistent use of personal protective measures, these results underscore the need for innovations in Lyme disease prevention to reduce Lyme disease cases overall and mitigate severe manifestations (Gould et al., 2008; Poland & Jacobson, 2001; Shen, Mead, & Beard, 2011).
Supplementary Material
Impacts.
Based on analysis of an employer-sponsored health insurance database, the median cost of a Lyme disease-related hospitalization was $11,688. Median costs were higher for patients with an ICD-9-CM code for carditis ($17,461), meningitis ($15,177) and arthritis ($13,012).
We estimate that 2,196 Lyme disease-related hospitalizations in persons under 65 years of age occur annually with an estimated annual cost of $25,826,237.
Innovations are needed to prevent new B. burgdorferi infections and mitigate severe cases of Lyme disease.
ACKNOWLEDGEMENT
We are very grateful to Natalie Kwit and Paul Mead for helpful input and to Anna Perea for the creation of Supplementary Figure 1. We also thank IBM Watson Health™ and the Centers for Disease Control and Prevention’s Division of Health Informatics and Surveillance for facilitating access to and analysis of the Truven Health Analytics MarketScan® Research Databases.
Footnotes
CONFLICT OF INTEREST
The authors have no conflict of interest to declare. The views expressed in this article are those of the authors and do not necessarily represent the official position of the U.S. Centers for Disease Control and Prevention.
SUPPORTING INFORMATION
Additional supporting information may be found online in the Supporting Information section.
REFERENCES
- Adrion ER, Aucott J, Lemke KW, & Weiner JP (2015). Health care costs, utilization and patterns of care following Lyme disease. PLoS ONE, 10, e0116767 10.1371/journal.pone.0116767 [DOI] [PMC free article] [PubMed] [Google Scholar]
- Bleyenheuft C, Lernout T, Berger N, Rebolledo J, Leroy M, Robert A, & Quoilin S (2015). Epidemiological situation of Lyme borreliosis in Belgium, 2003 to 2012. Archives of Public Health, 73, 33 10.1186/s13690-015-0079-7 [DOI] [PMC free article] [PubMed] [Google Scholar]
- Board of Governors of the Federal Reserve System (2020). Foreign exchange rates - H.10. Retrieved from: https://www.federalreserve.gov/releases/h10/default.htm
- Gould LH, Nelson RS, Griffith KS, Hayes EB, Piesman J, Mead PS, & Cartter ML (2008). Knowledge, attitudes, and behaviors regarding Lyme disease prevention among Connecticut residents, 1999–2004. Vector-Borne and Zoonotic Diseases, 8, 769–776. 10.1089/vbz.2007.0221 [DOI] [PubMed] [Google Scholar]
- Hansen L (2017). The Truven Health MarketScan Databases for life sciences researchers. Retrieved from https://truvenhealth.com/Portals/0/Assets/2017-MarketScan-Databases-Life-Sciences-Researchers-WP.pdf
- Hinckley AF, Connally NP, Meek JI, Johnson BJ, Kemperman MM, Feldman KA, … Mead PS (2014). Lyme disease testing by large commercial laboratories in the United States. Clinical Infectious Diseases, 59, 676–681. 10.1093/cid/ciu397 [DOI] [PMC free article] [PubMed] [Google Scholar]
- Hu LT (2016). Lyme disease. Annals of Internal Medicine, 164, ITC65–ITC80. 10.7326/AITC201605030 [DOI] [PubMed] [Google Scholar]
- Joss AWL, Davidson MM, Ho-Yen DO, & Ludbrook A (2003). Lyme disease - What is the cost for Scotland? Public Health, 117, 264–273. 10.1016/S0033-3506(03)00067-2 [DOI] [PubMed] [Google Scholar]
- Kwit NA, Nelson CA, Max R, & Mead PS (2017). Risk factors for clinician-diagnosed Lyme arthritis, facial palsy, carditis, and meningitis in patients from high-incidence states. Open Forum Infectious Diseases, 5, 10.1093/ofid/ofx254 [DOI] [PMC free article] [PubMed] [Google Scholar]
- Lohr B, Müller I, Mai M, Norris DE, Schöffski O, & Hunfeld KP (2015). Epidemiology and cost of hospital care for Lyme borreliosis in Germany: Lessons from a health care utilization database analysis. Ticks and Tick-borne Diseases, 6, 56–62. 10.1016/j.ttbdis.2014.09.004 [DOI] [PubMed] [Google Scholar]
- Maes E, Lecomte P, & Ray N (1998). A cost-of-illness study of Lyme disease in the United States. Clinical Therapeutics, 20, 993–1008. 10.1016/S0149-2918(98)80081-7 [DOI] [PubMed] [Google Scholar]
- Meltzer MI, Dennis DT, & Orloski KA (1999). The cost effectiveness of vaccinating against Lyme disease. Emerging Infectious Diseases, 5, 321–328. 10.3201/eid0503.990302 [DOI] [PMC free article] [PubMed] [Google Scholar]
- Nelson CA, Saha S, Kugeler KJ, Delorey MJ, Shankar MB, Hinckley AF, & Mead PS (2015). Incidence of clinician-diagnosed Lyme disease, United States, 2005–2010. Emerging Infectious Diseases, 21, 1625–1631. 10.15585/mmwr.ss6622a110.3201/eid2109.150417 [DOI] [PMC free article] [PubMed] [Google Scholar]
- Poland GA, & Jacobson RM (2001). The prevention of Lyme disease with vaccine. Vaccine, 19, 2303–2308. 10.1016/S0264-410X(00)00520-X [DOI] [PubMed] [Google Scholar]
- Pritt BS, Mead PS, Johnson DKH, Neitzel DF, Respicio-Kingry LB, Davis JP, … Petersen JM (2016). Identification of a novel pathogenic Borrelia species causing Lyme borreliosis with unusually high spirochaetaemia: A descriptive study. The Lancet Infectious Diseases, 16, 556–564. 10.1016/S1473-3099(15)00464-8 [DOI] [PMC free article] [PubMed] [Google Scholar]
- Rauter C, & Hartung T (2005). Prevalence of Borrelia burgdorferi sensu lato genospecies in Ixodes ricinus ticks in Europe: A metaanalysis. Applied and Environmental Microbiology, 71, 7203–7216. 10.1128/AEM.71.11.7203-7216.2005 [DOI] [PMC free article] [PubMed] [Google Scholar]
- Sajanti E, Virtanen M, Helve O, Kuusi M, Lyytikäinen O, Hytönen J, & Sane J (2017). Lyme borreliosis in Finland, 1995–2014. Emerging Infectious Diseases, 23, 1282–1288. 10.3201/eid2308.161273 [DOI] [PMC free article] [PubMed] [Google Scholar]
- Schwartz AM, Hinckley AF, Mead PS, Hook SA, & Kugeler KJ (2017). Surveillance for Lyme disease - United States, 2008–2015. MMWR Surveillance Summaries, 66, 1–12. 10.15585/mmwr.ss6622a1 [DOI] [PMC free article] [PubMed] [Google Scholar]
- Septfons A, Goronflot T, Jaulhac B, Roussel V, De Martino S, Guerreiro S, … Couturier E (2019). Epidemiology of Lyme borreliosis through two surveillance systems: the national Sentinelles GP network and the national hospital discharge database, France, 2005 to 2016. Euro Surveillance, 24(11). 10.2807/1560-7917.ES.2019.24.11.1800134 [DOI] [PMC free article] [PubMed] [Google Scholar]
- Shen AK, Mead PS, & Beard CB (2011). The Lyme disease vaccine—a public health perspective. Clinical Infectious Diseases, 52, S247–S252. 10.1093/cid/ciq115 [DOI] [PubMed] [Google Scholar]
- Sickbert-Bennett EE, Weber DJ, Poole C, MacDonald PDM, & Maillard JM (2010). Utility of international classification of diseases, ninth revision, clinical modification codes for communicable disease surveillance. American Journal of Epidemiology, 172, 1299–1305. 10.1093/aje/kwq285 [DOI] [PubMed] [Google Scholar]
- Stanek G, Wormser GP, Gray J, & Strle F (2012). Lyme borreliosis. The Lancet, 379, 461–473. 10.1016/S0140-6736(11)60103-7 [DOI] [PubMed] [Google Scholar]
- Steere AC (1989). Lyme disease. New England Journal of Medicine, 321, 586–596. 10.1056/NEJM198908313210906 [DOI] [PubMed] [Google Scholar]
- Steere AC (2015). Lyme disease (Lyme Borreliosis) due to Borrelia burgdorferi In Bennett JE, Dolin R & Blaser MJ (Eds.), Mandell, Douglas, and Bennett’s principles and practice of infectious diseases (8th ed). Philadelphia, PA: Elsevier/Saunders. [Google Scholar]
- Tulloch JSP, Decraene V, Christley RM, Radford AD, Warner JC, & Vivancos R (2019). Characteristics and patient pathways of Lyme disease patients: A retrospective analysis of hospital episode data in England and Wales (1998–2015). BMC Public Health, 19, 1–11. 10.1186/s12889-019-7245-8 [DOI] [PMC free article] [PubMed] [Google Scholar]
- U.S. Bureau of Economic Analysis (2017). Table 2.5.4, Price Indexes for Personal Consumption Expenditures by Function. Retrieved from https://www.bea.gov/data/personal-consumption-expenditures-price-index
- van den Wijngaard CC, Hofhuis A, Wong A, Harms MG, de Wit GA, Lugnér AK, … van Pelt W (2017). The cost of Lyme borreliosis. The European Journal of Public Health, 27, 538–547. 10.1093/eurpub/ckw269 [DOI] [PubMed] [Google Scholar]
- Vandenesch A, Turbelin C, Couturier E, Arena C, Jaulhac B, Ferquel E, … Hanslik T (2014). Incidence and hospitalisation rates of Lyme borreliosis, France, 2004 to 2012. Eurosurveillance, 19, 1–8. 10.2807/1560-7917.ES2014.19.34.20883 [DOI] [PubMed] [Google Scholar]
- Zhang X, Meltzer MI, Peña CA, Hopkins AB, Wroth L, & Fix AD (2006). Economic impact of Lyme disease. Emerging Infectious Diseases, 12, 653–660. 10.3201/eid1204.050602 [DOI] [PMC free article] [PubMed] [Google Scholar]
Associated Data
This section collects any data citations, data availability statements, or supplementary materials included in this article.