Abstract
Background
MicroRNA‐126 (miR‐126) has been investigated in autoimmune diseases and organ failures, whereas its implication in sepsis is rarely reported. Our study initially explored the value of miR‐126 in diagnosing sepsis and predicting disease severity, degree of inflammation, and mortality.
Methods
Totally, 208 sepsis patients and 210 healthy controls were enrolled; then, their plasma samples were collected for detecting circulating miR‐126 by quantitative polymerase chain reaction. For sepsis patients, their cytokine levels in plasma samples were detected by enzyme‐linked immunosorbent assay.
Results
miR‐126 was upregulated in sepsis patients compared with healthy controls, and it was of certain value in distinguishing sepsis patients from healthy controls (AUC: 0.726 (95% CI: 0.678‐0.774)). miR‐126 expression was positively correlated with acute physiology and chronic health evaluation II score, serum creatinine, and C‐reactive protein but not albumin or white blood cell count in sepsis patients. Regarding cytokines, miR‐126 was positively correlated with tumor necrosis factor‐α, interleukin (IL)‐6, and IL‐8, but negatively correlated with IL‐10 in sepsis patients. As for mortality, miR‐126 expression was higher in deaths compared with survivors, and ROC curve displayed that it could predict mortality of sepsis patients to some extent with AUC of 0.619 (95% CI: 0.533‐0.705).
Conclusion
miR‐126 potentially serves as an assistant diagnostic and prognostic biomarker for sepsis.
Keywords: disease severity, inflammation, microRNA‐126, mortality, sepsis
1. INTRODUCTION
Sepsis is a complex and life‐threatening disorder, which develops from dysregulated host response to infections and causes organ dysfunction. 1 It is one of the most lethal systemic disorders globally and an important public health issue causing enormous expenses of hospitalization. It is estimated that more than 30 million individuals are diagnosed and 5 million die from sepsis worldwide each year. 2 The prevention, diagnosis, and management of sepsis have been considered as a global health priority, and the treatment developed in recent decades has substantially attenuated the organ dysfunction and improved prognosis of sepsis patients. 3 However, the speed recognition of the disease still lacks sensitivity, and currently, no biomarker for effectively prognosticating sepsis is available. Therefore, it is important to explore the potential value of different biomarkers in the diagnosis and prognosis of sepsis.
MicroRNAs (miRNAs) are small endogenous RNAs that regulate gene expression at the post‐transcriptional level. 4 miRNA‐126 (miR‐126) is a small non‐coding RNA encoded by the EGFL7 gene in human chromosome 9q34.3. 5 miR‐126 regulates gene transcription, translation, and degradation of mRNAs, which has been researched regarding its role in the pathogenesis of inflammation, autoimmunity, and organ failures. For instance, high miR‐126 level is associated with the development of kidney injury in diabetic patients and chronic kidney disease patients. 6 , 7 Furthermore, miR‐126 participates in the pathogenesis of active ulcerative colitis via regulating NF‐kappa B inhibitor (Iκ‐Bα). 8 , 9 Additionally, miR‐126 is correlated with increased disease severity of psoriasis, and inhibition of miR‐126 reduces IL‐1β‐induced‐chondrocyte inflammation in psoriasis. 10 , 11 The existing evidence illustrates the key role of miR‐126 in inflammation, autoimmunity, and organ damage; however, miR‐126 is rarely studied in sepsis. Therefore, we evaluated the value of circulating miR‐126 in predicting the vulnerability, mortality of sepsis, and the correlation of miR‐126 with disease severity and inflammation in sepsis patients.
2. MATERIALS AND METHODS
2.1. Participants
From July 2015 to June 2018, 208 sepsis patients admitted in our hospital were consecutively enrolled in this study. All patients were diagnosed as sepsis (aged above 18 years old; without hematological malignancies or solid tumors) according to the criteria in International Guidelines for Management of Severe Sepsis and Septic Shock: 2012. 12 Patients were excluded if they were pregnant or lactating women, and died within 24 hours after admission, with immunodeficiency (such as human immunodeficiency virus (HIV) and malignancies) or under inflammatory status. Meanwhile, 210 healthy subjects who underwent health examination in our hospital at the same period were recruited as healthy controls. All healthy controls were required to have no history of hematological malignancies, solid tumors, severe infection, or autoimmune diseases. The ethics committee of our hospital approved this study, and all participants or their guardians provided the written informed consents.
2.2. Data and samples collection
For sepsis patients, their demographic characteristics and biochemical indexes levels as well as the 28‐day mortality were collected from their medical records. The acute physiology and chronic health evaluation II (APACHE II) score was assessed within 24 hours after admission. As for healthy controls, their demographic characteristics were collected from health examination records. Peripheral blood (PB) samples of sepsis patients were collected within 24 hours after admission, and the PB samples of healthy controls were collected after signing the informed consents. All PB samples were centrifugalized at 1500 g for 15 minutes to separate plasma, and the isolated plasma samples were stored at −80°C until detection.
2.3. Inflammatory cytokines detection
For the sepsis patients, the inflammatory cytokine levels in plasma samples were detected by enzyme‐linked immunosorbent assay (ELISA). The commercial ELISA kits including Human Tumor Necrosis Factor‐α (TNF‐α) ELISA Kit, Human Interleukin (IL)‐1β ELISA Kit, Human IL‐6 ELISA Kit, Human IL‐8 ELISA Kit, Human IL‐10 ELISA Kit, and Human IL‐17 ELISA Kit were purchased from Abcam (Cambridge, USA). The procedures were conducted in accordance with the manufacturers’ instructions.
2.4. miR‐126 detection
For sepsis patients and healthy controls, the miR‐126 relative expressions in plasma samples were detected by quantitative polymerase chain reaction (qPCR). In detail, total RNA was extracted using TRIzol™ Reagent (Thermo Fisher Scientific). Then, RNA was reversely transcribed using TranScript First‐Strand cDNA Synthesis SuperMix Reagent (Takara). Afterward, PCR was conducted by SYBR Premix Ex Taq Reagent (Takara) using U6 as the internal reference. The relative expression of miR‐126 was calculated by 2−△△Ct method. 13 The primers used were as follows: miR‐126 forward primer: 5′‐ACACTCCAGCTGGGCATTATTACTTTTGGTAC‐3′; reverse primer: 5′‐ACACTCCAGCTGGGACTGCAGTGAAGGCACTT‐3′; U6 forward primer: 5′‐CTCGCTTCGGCAGCACATATACTA‐3′; reverse primer: 5′‐ACGAATTTGCGTGTCATCCTTGC‐3′.
2.5. Statistical analysis
Statistical analyses were performed using SPSS software version 24.0 (IBM). Figures were made using GraphPad Prism software version 7.01 (GraphPad Software). Normal distributed continuous variables were expressed as mean ± standard deviation (SD), and comparison of the variables between two groups was determined by Student's t test. Skewed distributed continuous variables were expressed as median (interquartile range, IQR), and comparison of the variables between two groups was determined by Wilcoxon rank sum test. Categorical variables were expressed as count (percentage), and comparison of the variables between two groups was determined by chi‐square test. Correlation between continuous variables was analyzed by Spearman's rank correlation test. Receiver operating characteristic (ROC) curve, the area under the curve (AUC), and the best cutoff point were used to assess the performance of miR‐126 in discriminating sepsis patients from healthy controls or discriminating survivors from deaths. P value < .05 was considered as significant.
3. RESULTS
3.1. Clinical characteristics of healthy controls and sepsis patients
The mean age was 57.6 ± 9.7 years for sepsis patients and 55.8 ± 10.0 years for healthy controls (Table 1). There were 71 (34.1%) females/137 (65.9%) males in sepsis patients and 76 (36.2%) females/134 (63.8%) males in healthy controls. No difference in age (P = .058), gender (P = .660), or BMI (P = .865) was observed between healthy controls and sepsis patients. In sepsis patients, the mean APACHE II score was 16.3 ± 5.6. As for the biochemical indexes of sepsis patients, the median value for serum creatinine (Scr), albumin, white blood cell (WBC), and C‐reactive protein (CRP) was 1.4 (1.1‐2.0) mg/dL, 26.8 (21.0‐35.8) g/L, 13.7 (4.3‐27.2) × 109/L, and 45.7 (27.2‐83.8) mg/dL, respectively.
Table 1.
Clinical characteristics
| Items | Healthy controls (N = 210) | Sepsis patients (N = 208) | P value |
|---|---|---|---|
| Age (years), mean ± SD | 55.8 ± 10.0 | 57.6 ± 9.7 | .058 |
| Gender, No. (%) | .660 | ||
| Female | 76 (36.2) | 71 (34.1) | |
| Male | 134 (63.8) | 137 (65.9) | |
| BMI (kg/m2), mean ± SD | 23.1 ± 4.1 | 23.2 ± 4.6 | .865 |
| Primary infection site, No. (%) | ‐ | ||
| Abdominal infection | ‐ | 79 (38.0) | |
| Respiratory infection | ‐ | 44 (21.2) | |
| Skin and soft tissue infection | ‐ | 39 (18.8) | |
| Blood stream infection | ‐ | 22 (10.6) | |
| CNS infection | ‐ | 12 (5.8) | |
| Other infections | ‐ | 12 (5.8) | |
| APACHE II score, mean ± SD | ‐ | 16.3 ± 5.6 | ‐ |
| ARDS, No. (%) | ‐ | 59 (28.4) | ‐ |
| ICU stay (day), mean ± SD | ‐ | 15.4 ± 9.0 | ‐ |
| Mechanical ventilation duration (day), mean ± SD | ‐ | 11.3 ± 8.6 | ‐ |
| Biochemical indexes, median (IQR) | |||
| Scr (mg/dL) | ‐ | 1.4 (1.1‐2.0) | ‐ |
| Albumin (g/L) | ‐ | 26.8 (21.0‐35.8) | ‐ |
| WBC (×109/L) | ‐ | 13.7 (4.3‐27.2) | ‐ |
| CRP (mg/dL) | ‐ | 45.7 (27.2‐83.8) | ‐ |
Comparison was determined by Student's t test or Wilcoxon rank sum test.
Abbreviations: APACHE II, acute physiology and chronic health evaluation II; BMI, body mass index; CNS, central nervous system; CRP, C‐reactive protein; ICU, intensive care unit; IQR, interquartile range; Scr, serum creatinine; SD, standard deviation; WBC, white blood cell.
3.2. The expression of miR‐126 in healthy controls and sepsis patients
miR‐126 relative expression was higher in sepsis patients (2.000 (0.830‐3.277)) than that in healthy controls (0.935 (0.436‐1.495)) (P < .001) (Figure 1A). The following ROC curve revealed that miR‐126 distinguishes sepsis patients from healthy controls with AUC of 0.726 (95% CI: 0.678‐0.774) (Figure 1B). In addition, when further dividing patients into sepsis, severe sepsis, and sepsis shock, the expression of miR‐126 was the highest in septic shock patients, followed by severe sepsis patients and the lowest in sepsis patients (all P < .05) (Figure S1).
Figure 1.
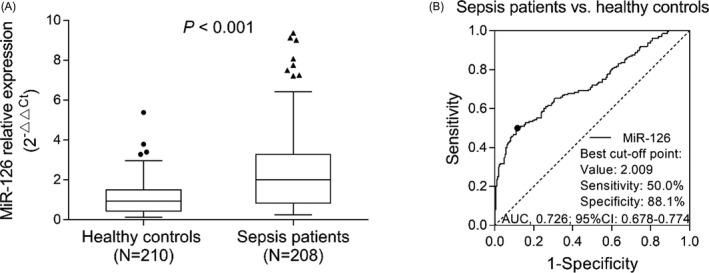
miR‐126 expression between sepsis patients and healthy controls. Comparison of miR‐126 expression between sepsis patients and healthy controls (A). The dots (the upper and lower whiskers) represented miR‐126 expression in healthy controls, and the triangles represents sepsis patients; the top/bottom of the box represented 1st/3rd quantile of miR‐126 expression; the bold line was the median value of miR‐126 expression. ROC curve analysis for miR‐126 in distinguishing sepsis patients and healthy controls (B). ROC, receiver operating characteristic; miR‐126, microRNA‐126
3.3. Correlation of miR‐126 with clinical characteristics in sepsis patients
miR‐126 expression was positively correlated with APACHE II score (P < .001, rs = 0.384) (Figure 2). In addition, miR‐126 was positively correlated with ICU stay (P < .001, rs = 0.311) (Figure 3) as well as mechanical ventilation duration (P < .001, rs = 0.367) (Figure 4), and miR‐126 was higher in ARDS patients than that in non‐ARDS patients (P < .001) (Figure 5). As for biochemical indexes, miR‐126 was positively correlated with Scr (P < .001, rs = 0.243) and CRP (P < .001, rs = 0.285) (Table 2). Regarding inflammatory cytokines, miR‐126 was positively correlated with TNF‐α (P < .001, rs = 0.238), IL‐6 (P = .027, rs = 0.153), and IL‐8 (P < .001, rs = 0.287), but negatively correlated with IL‐10 (P = .020, rs = −0.161).
Figure 2.
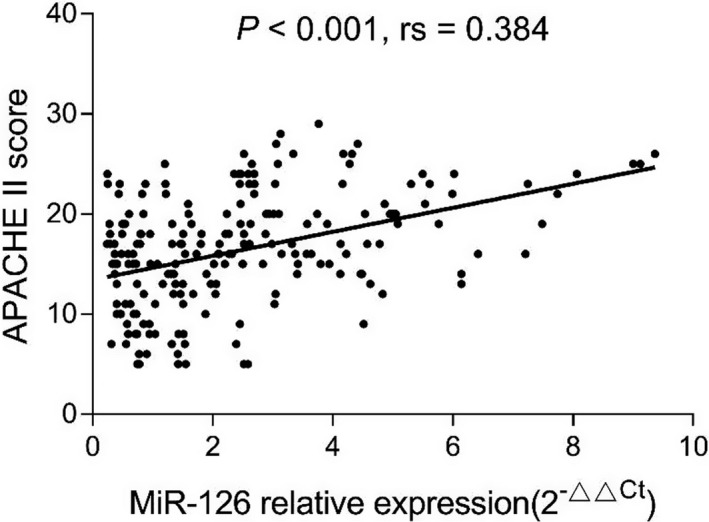
Correlation of miR‐126 with APACHE II score. APACHE II, acute physiology and chronic health evaluation II; miR‐126, microRNA‐126
Figure 3.
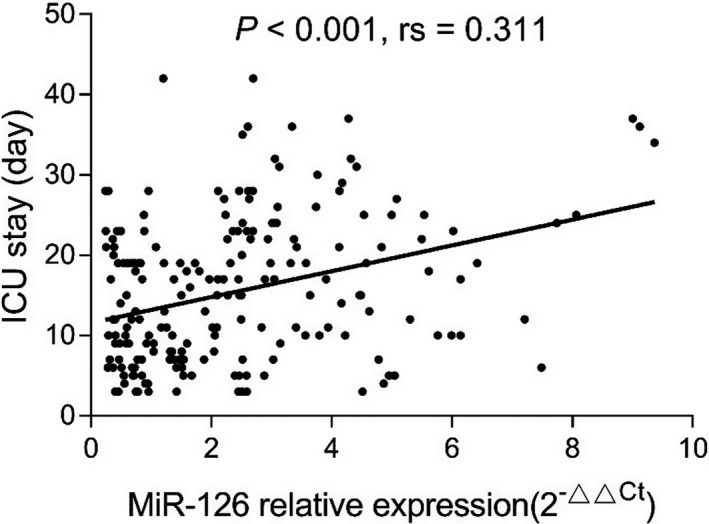
Correlation of miR‐126 with ICU stay. ICU, intensive care unit; miR‐126, microRNA‐126
Figure 4.
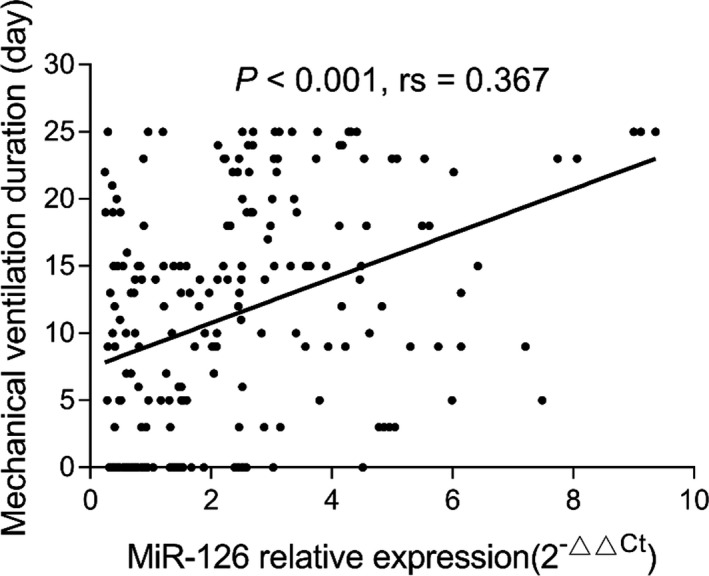
Correlation of miR‐126 with mechanical ventilation duration. miR‐126, microRNA‐126
Figure 5.
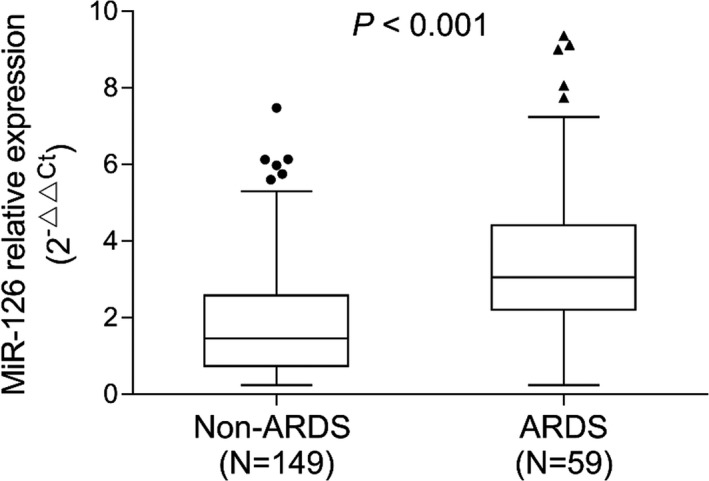
Comparison of miR‐126 between ARDS and non‐ARDS patients. The dots/triangles (the upper and lower whiskers) represented miR‐126 expression in non‐ARDS patients/ARDS patients; the top/bottom of the box represented 1st/3rd quantile of miR‐126 expression; the bold line was the median value of miR‐126 expression. ARDS, acute respiratory distress syndrome; miR‐126, microRNA‐126
Table 2.
Correlation of miR‐126 with biochemical indexes and inflammatory cytokines
| Items | miR‐126 expression | |
|---|---|---|
| P value | Spearman rs | |
| Biochemical indexes | ||
| Scr | <.001 | 0.243 |
| Albumin | .614 | −0.035 |
| WBC | .293 | 0.073 |
| CRP | <.001 | 0.285 |
| Inflammatory cytokines | ||
| TNF‐α | <.001 | 0.283 |
| IL‐1β | .139 | 0.103 |
| IL‐6 | .027 | 0.153 |
| IL‐8 | <.001 | 0.287 |
| IL‐10 | .020 | −0.161 |
| IL‐17 | .621 | 0.034 |
Correlation was determined by Spearman's rank correlation test.
Abbreviations: CRP, C‐reactive protein; IL, interleukin; Scr, serum creatinine; TNF‐α, tumor necrosis factor‐α; WBC, white blood well.
3.4. The expression of miR‐126 in survivors and non‐survivors of sepsis patients
There were 139 survivors and 69 deaths in sepsis patients, and there was no difference in clinical characteristics between survivors and deaths (Table S1). miR‐126 relative expression was higher in deaths (2.462 (0.824‐4.719)) than that in survivors (1.544 (0.823‐2.694)) (P = .005) in sepsis patients (Figure 6A). ROC curve analysis revealed that miR‐126 was able to predict mortality in sepsis patients with a relatively poor AUC of 0.619 (95% CI: 0.533‐0.705) (Figure 6B).
Figure 6.
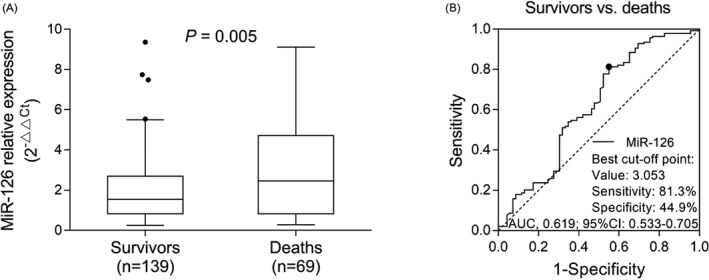
Expression of miR‐126 between deaths and survivors as well as its predictive value for mortality risk in sepsis patients. Comparison of miR‐126 between deaths and survivors in sepsis patients (A). The dots (the upper and lower whiskers) represented miR‐126 expression in healthy controls; the top/bottom of the box represented 1st/3rd quantile of miR‐126 expression; the bold line was the median value of miR‐126 expression. ROC curve analysis for miR‐126 in distinguishing deaths from survivors in sepsis patients (B). ROC, receiver operating characteristic; miR‐126, microRNA‐126
4. DISCUSSION
Sepsis is considered as a medical emergency that progresses to acute organ dysfunction and ultimately deaths, which affects millions of people globally each year. 14 Since there lacks speed diagnostic test, and the clinical signs of sepsis are indiscernible from other non‐life‐threatening conditions such as respiratory distress, the determination and treatment approaches for sepsis are not highly specific. Treatment with broad‐spectrum antibiotics always leads to complications such as development of drug‐resistant and atypical organisms. 15 Considering that the identification and management of sepsis remain a clinical challenge, it is necessary to explore potential biomarkers for assisting with diagnosis and treatment of sepsis.
In the present study, circulating miR‐126 was found to be upregulated in sepsis patients compared with healthy controls and fairly distinguished sepsis patients from healthy controls; it was positively correlated with APACHE II score, Scr, CRP, and pro‐inflammatory cytokines but negatively correlated with anti‐inflammatory cytokine; elevated miR‐126 was poorly predictive for sepsis mortality.
miR‐126 has been reported to participate in the development and progression of multiple autoimmune and inflammatory diseases. For instance, miR‐126 is upregulated in ulcerative colitis patients and negatively mediates the level of nuclear factor‐kappa B (NF‐κB) inhibitor alpha to activate NF‐κB signaling pathway. 9 In rheumatoid arthritis, miR‐126 promotes CD11a and CD70 expression, which contributes to T‐cell infiltration and secretion of inflammatory cytokines via the PI3K/AKT signaling pathway. 16 Besides, miR‐126 is also involved in inflammation and angiogenesis processes of juvenile dermatomyositis, 17 whereas in sepsis, the clinical implication of miR‐126 in predicting the susceptibility or mortality of sepsis is still unknown. In this current study, circulating miR‐126 was upregulated in sepsis patients and distinguished sepsis patients from healthy controls, which suggested that high sepsis susceptibility could be expected from miR‐126 high expression. In addition, miR‐126 was positively correlated with APACHE II score, Scr, CRP, and pro‐inflammatory cytokines (including TNF‐α, IL‐6, and IL‐8) but negatively correlated with anti‐inflammatory cytokine IL‐10, which illustrated that miR‐126 was associated with exacerbated disease severity and exaggerated inflammation in sepsis patients. The reasons might include the following: (1) miR‐126 might activate the infiltration of immune cells and activate the corresponding immunological activation, which subsequently elevated the inflammation level, as well as caused damage to the normal renal function. (2) miR‐126 might regulate signaling pathways such as NF‐Κb that was shown to be regulated by miR‐126 in other inflammatory diseases; thereby, miR‐126 was associated with increased the sepsis risk and disease severity. 9
Sepsis is a highly morbid clinical syndrome being the most common cause of deaths in intensive care units except for cardiac causes. 18 Due to the heterogeneity, the causes of sepsis mortality are hard to be scientifically analyzed; thus, the risk factors for predicting deaths in sepsis may help understand the causes underlying the mortality of sepsis. In this current study, we observed that circulating miR‐126 was higher in the deaths than that in survivals in sepsis patients, and miR‐126 could discriminate the deaths from survivals, which suggested that miR‐126 high expression could predict mortality in sepsis. Here are the explanations: (1) miR‐126, as observed in this study, was correlated with advanced APACHE II score, Scr, CRP, and pro‐inflammatory cytokines; thereby, it could predict higher mortality of sepsis patients. (2) miR‐126 was encoded from EGFL7 gene, which was involved in maturation of T helper 2 cells, regulation of TOM1 regulation, and IL‐1β/TNF‐α‐induced signaling pathways, as disclosed in cystic fibrosis epithelial cells. 5 Therefore, miR‐126 might aggravate the immune and inflammatory responses in sepsis as well and lead to high mortality, while this inferential explanation needed further validation.
Our study initially reported the clinical significance of miR‐126 in sepsis regarding its correlation with disease severity, inflammation, and its predictive value for sepsis susceptibility and mortality. However, there were still several shortcomings. First, the expression of plasma miR‐126 was detected at a single time rather than monitored throughout the course of disease; therefore, the role of miR‐126 during progression of sepsis was not evaluated. Second, the patients were recruited from a single hospital which was subject to selection bias. Third, the sample size was relatively small, which reduced the statistical power; thus, further studies with larger sample size were needed. In addition, the detailed mechanism of miR‐126 in pathogenesis of sepsis was not investigated.
In conclusion, circulating miR‐126 is sufficiently expressed, and its overexpression correlates with advanced disease severity, inflammation, and mortality in sepsis patients.
Supporting information
Figure S1
Table S1
Lin R, Hu H, Li L, Chen G, Luo L, Rao P. The potential of microRNA‐126 in predicting disease risk, mortality of sepsis, and its correlation with inflammation and sepsis severity. J Clin Lab Anal. 2020;34:e23408 10.1002/jcla.23408
REFERENCES
- 1. Cecconi M, Evans L, Levy M, Rhodes A. Sepsis and septic shock. Lancet. 2018;392(10141):75‐87. [DOI] [PubMed] [Google Scholar]
- 2. Fleischmann C, Scherag A, Adhikari NK, et al. Assessment of global incidence and mortality of hospital‐treated sepsis. Current estimates and limitations. Am J Respir Crit Care Med. 2016;193(3):259‐272. [DOI] [PubMed] [Google Scholar]
- 3. Armstrong BA, Betzold RD, May AK. Sepsis and septic shock strategies. Surg Clin N Am. 2017;97(6):1339‐1379. [DOI] [PubMed] [Google Scholar]
- 4. Lu TX, Rothenberg ME. MicroRNA. J Allergy Clin Immunol. 2018;141(4):1202‐1207. [DOI] [PMC free article] [PubMed] [Google Scholar]
- 5. Casciaro M, Di Salvo E, Brizzi T, Rodolico C, Gangemi S. Involvement of miR‐126 in autoimmune disorders. Clin Mol Allergy. 2018;16:11. [DOI] [PMC free article] [PubMed] [Google Scholar]
- 6. Beltrami C, Simpson K, Jesky M, et al. Association of elevated urinary miR‐126, miR‐155, and miR‐29b with diabetic kidney disease. Am J Pathol. 2018;188(9):1982‐1992. [DOI] [PubMed] [Google Scholar]
- 7. Fourdinier O, Schepers E, Metzinger‐Le Meuth V, et al. Serum levels of miR‐126 and miR‐223 and outcomes in chronic kidney disease patients. Sci Rep. 2019;9(1):4477. [DOI] [PMC free article] [PubMed] [Google Scholar]
- 8. Zhao S, Wang Y, Liang Y, et al. MicroRNA‐126 regulates DNA methylation in CD4+ T cells and contributes to systemic lupus erythematosus by targeting DNA methyltransferase 1. Arthritis Rheum. 2011;63(5):1376‐1386. [DOI] [PubMed] [Google Scholar]
- 9. Feng X, Wang H, Ye S, et al. Up‐regulation of microRNA‐126 may contribute to pathogenesis of ulcerative colitis via regulating NF‐kappaB inhibitor IkappaBalpha. PLoS One. 2012;7(12):e52782. [DOI] [PMC free article] [PubMed] [Google Scholar]
- 10. Feng S, Wang L, Liu W, Zhong Y, Xu S. MiR‐126 correlates with increased disease severity and promotes keratinocytes proliferation and inflammation while suppresses cells' apoptosis in psoriasis. J Clin Lab Anal. 2018;32(9):e22588. [DOI] [PMC free article] [PubMed] [Google Scholar]
- 11. Duan Y, Zou J, Mao J, et al. Plasma miR‐126 expression correlates with risk and severity of psoriasis and its high level at baseline predicts worse response to Tripterygium wilfordii Hook F in combination with acitretin. Biomed Pharmacother. 2019;115:108761. [DOI] [PubMed] [Google Scholar]
- 12. Dellinger RP, Levy MM, Rhodes A, et al. Surviving Sepsis Campaign: international guidelines for management of severe sepsis and septic shock, 2012. Intensive Care Med. 2013;39(2):165‐228. [DOI] [PMC free article] [PubMed] [Google Scholar]
- 13. Wei X, Sun Y, Han T, et al. Upregulation of miR‐330‐5p is associated with carotid plaque's stability by targeting Talin‐1 in symptomatic carotid stenosis patients. BMC Cardiovasc Disord. 2019;19(1):149. [DOI] [PMC free article] [PubMed] [Google Scholar]
- 14. Angus DC, van der Poll T. Severe sepsis and septic shock. N Engl J Med. 2013;369(9):840‐851. [DOI] [PubMed] [Google Scholar]
- 15. Prescott HC, Angus DC. Enhancing recovery from sepsis: a review. JAMA. 2018;319(1):62‐75. [DOI] [PMC free article] [PubMed] [Google Scholar]
- 16. Yang G, Wu D, Zeng G, et al. Correlation between miR‐126 expression and DNA hypomethylation of CD4+ T cells in rheumatoid arthritis patients. Int J Clin Exp Pathol. 2015;8(8):8929‐8936. [PMC free article] [PubMed] [Google Scholar]
- 17. Kim E, Cook‐Mills J, Morgan G, Sredni ST, Pachman LM. Increased expression of vascular cell adhesion molecule 1 in muscle biopsy samples from juvenile dermatomyositis patients with short duration of untreated disease is regulated by miR‐126. Arthritis Rheum. 2012;64(11):3809‐3817. [DOI] [PMC free article] [PubMed] [Google Scholar]
- 18. Moskowitz A, Omar Y, Chase M, et al. Reasons for death in patients with sepsis and septic shock. J Crit Care. 2017;38:284‐288. [DOI] [PMC free article] [PubMed] [Google Scholar]
Associated Data
This section collects any data citations, data availability statements, or supplementary materials included in this article.
Supplementary Materials
Figure S1
Table S1


