SUMMARY
Parkinson disease is characterized by loss of dopamine neurons in the substantia nigra1. Similar to other major neurodegenerative disorders, no disease-modifying treatment exists. While most treatment strategies aim to prevent neuronal loss or protect vulnerable neuronal circuits, a potential alternative is to replace lost neurons to reconstruct disrupted circuits2. Herein we report an efficient single-step conversion of isolated mouse and human astrocytes into functional neurons by depleting the RNA binding protein PTB. Applying this approach to the mouse brain, we demonstrate progressive conversion of astrocytes into new neurons that can innervate into endogenous neural circuits. Astrocytes in different brain regions are found to convert into different neuronal subtypes. Using a chemically induced model of Parkinson’s disease, we show conversion of midbrain astrocytes into dopaminergic neurons whose axons reconstruct the nigro-striatal circuit. Significantly, re-innervation of striatum is accompanied by restoration of dopamine levels and rescue of motor deficits. Similar disease phenotype reversal is also accomplished by converting astrocytes to neurons using antisense oligonucleotides to transiently suppress PTB. These findings identify a potentially powerful and clinically feasible new approach to treating neurodegeneration by replacing lost neurons.
Regenerative medicine holds great promise for addressing disorders that feature cell loss3. Given the plasticity of certain somatic cells4, trans-differentiation approaches for switching cell fate in situ have gained momentum2, which would avoid immune recognition. In mouse brain, glial cell plasticity5 have been leveraged to generate new neurons that lead to behavioral benefits in disease models6,7. However, evidence is still limited for trans-differentiated cells replacing lost neurons to reconstitute an endogenous neuronal circuit8.
Most in vivo reprogramming relies on using lineage-specific transcription factors (TFs). We recently elucidated roles for the RNA binding protein PTB and its neuronal analog nPTB in controlling neuronal induction and maturation and demonstrated efficient conversion of both mouse and human fibroblasts to functional neurons through sequential depletion of these RNA binding proteins9,10. Importantly, sequential down-regulation of PTB and nPTB occurs naturally during neurogenesis11, and once triggered, both loops become self-enforcing9,10.
We now explore this strategy to directly convert astrocytes into dopaminergic (DA) neurons in substantia nigra. In a chemically induced mouse Parkinson’s disease (PD) model, we demonstrate that PTB depletion-induced DA neurons potently restore striatal dopamine, reconstitute the nigral-striatal circuit, and reverse PD-relevant motor phenotypes. Given the emerging power of antisense oligonucleotides (ASOs) in modulating brain disorders12, we also provide evidence for anti-PTB ASO as a feasible, single-step strategy for treating PD and perhaps other neurodegenerative diseases.
PTB/nPTB-regulated loops in astrocytes
Astrocytes offer several advantages for in vivo reprogramming in the brain. These non-neuronal cells are abundant, proliferate upon injury, and are highly plastic for switching cell fate5. As established earlier in fibroblasts9,10, PTB suppresses a neuronal induction loop where the microRNA miR-124 inhibits the transcriptional repressor REST that suppresses numerous neuronal genes, including miR-124 (Fig. 1a, loop I). PTB down-regulation induces nPTB, which suppresses the transcription activator Brn2 and the microRNA miR-9, both required for neuronal maturation (Fig. 1a, loop II). Through impacting both loops, sequential down-regulation of PTB and nPTB generates functional neurons from human fibroblasts10.
Fig. 1 |. PTB knockdown induces neurogenesis in mouse and human astrocytes.
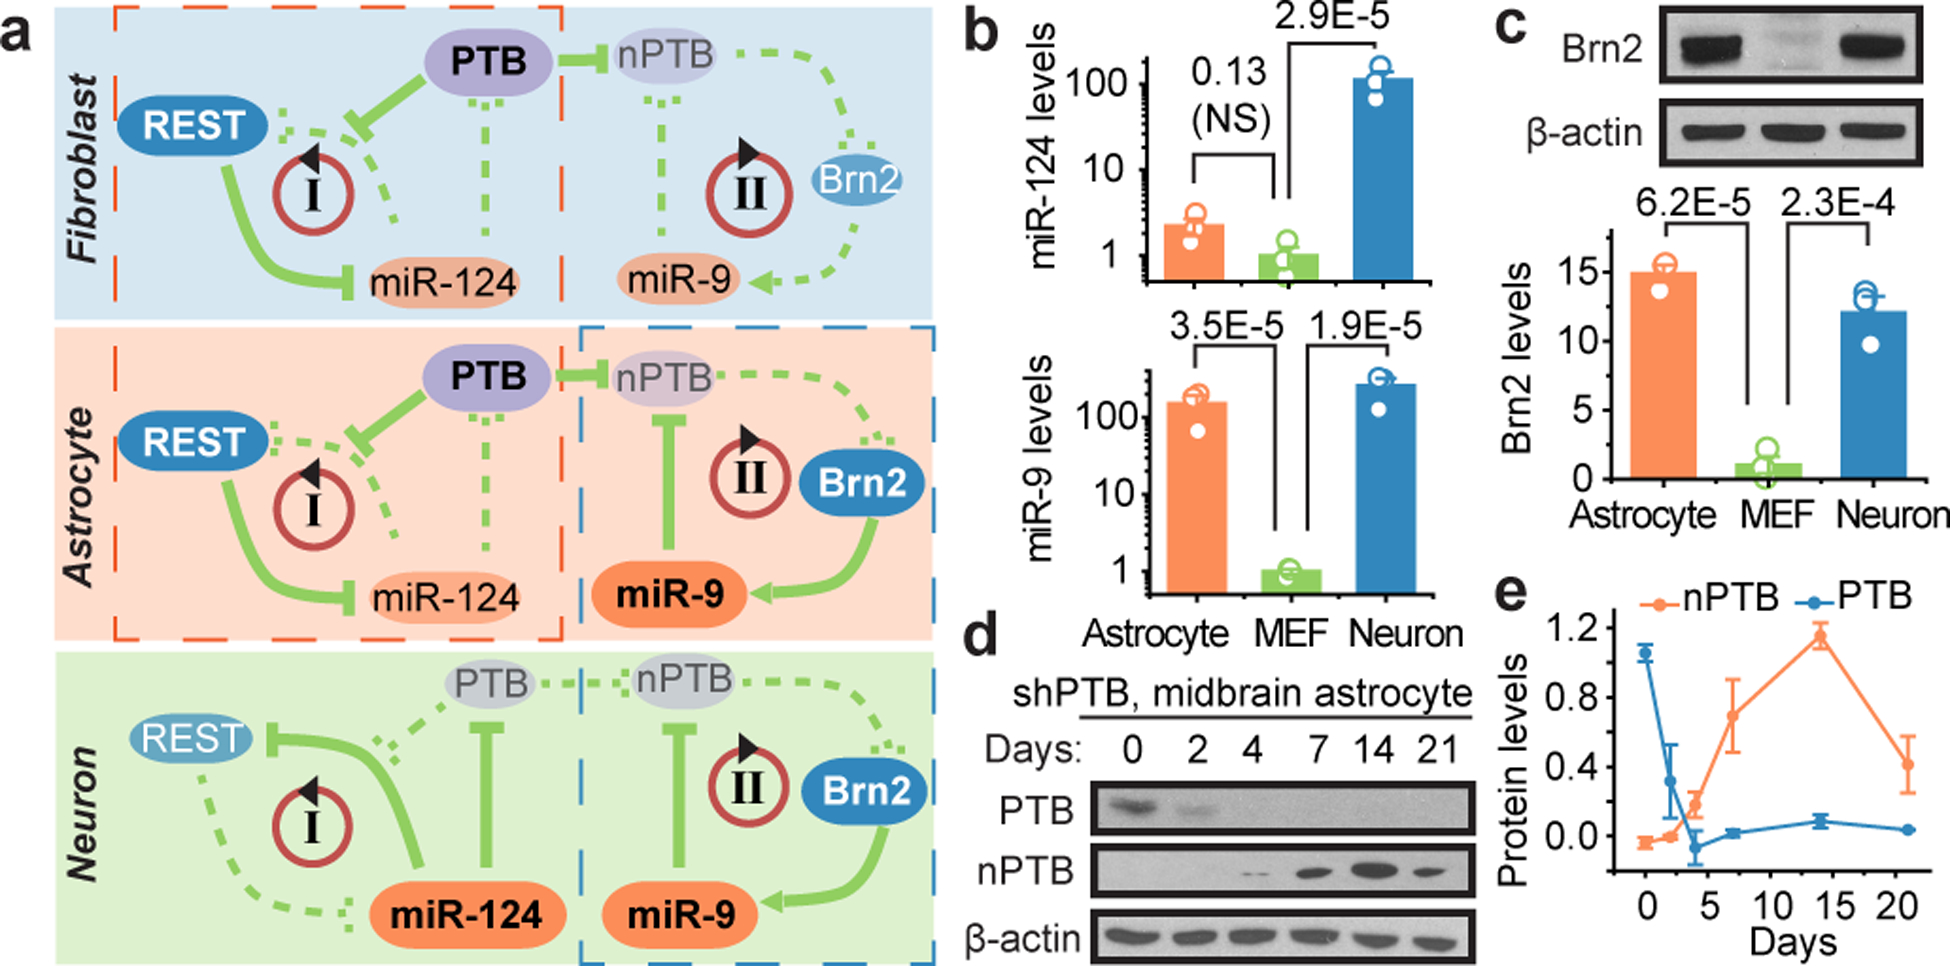
a, PTB and nPTB-regulated loops critical for neuronal induction and maturation in fibroblasts, astrocytes, and neurons. Bold and regular font sizes indicate high and low expression levels, respectively. Red dashed box: Similarity between fibroblasts and astrocytes in PTB-regulated loop; blue dashed box: Similarity between astrocytes and neurons in nPTB-regulated loop.
b,c, Levels of miR-124 and miR-9 determined by RT-qPCR, normalized against U6 snRNA (b) and Brn2 by Western blotting, normalized against β-actin (c) in mouse astrocytes, mouse embryonic fibroblasts (MEF) and mouse neurons. Statistical results are represented as mean+/−SEM (n=3 biological repeats) and indicated P-values are based on ANOVA with post-hoc Tukey test. NS: not significant.
d,e, Time-course analysis of nPTB levels upon PTB knockdown (d) in mouse midbrain astrocytes and quantified in (e). 3=biological repeats. Error bars: SEM.
To explore this cascade for astrocyte-to-neuron conversion, we isolated mouse astrocytes from cerebral cortex and midbrain of postnatal day 4 to 5 pups13 and obtained commercial human fetal cortical astrocytes. These cells express astrocytic markers GFAP and ALDH1L1, but not markers for neurons and other common non-neuronal cell types in the brain (Extended Data Fig. 1a). Similar to fibroblasts, RT-qPCR analysis showed low miR-124 in mouse and human astrocytes (Fig. 1b; Extended Data Fig. 1b). Unexpectedly, both miR-9 and Brn2 were highly expressed astrocytes (Fig. 1b,c; Extended Data Fig. 1c). We further confirmed these expression patterns in endogenous astrocytes and neurons (Extended Data Fig. 1d). Note that REST is reduced, but not eliminated in DA neurons marked by tyrosine hydrolase (TH), consistent with its requirement for sustaining viability of mature neurons in brain14. Thus, while astrocytes resemble fibroblasts in the PTB-regulated loop (Fig. 1a, red-dashed box), they are neuron-like in the nPTB-regulated loop (Fig. 1a, green-dashed box). This property allowed for prediction that PTB knockdown-induced nPTB would immediately be counteracted by miR-9 in astrocytes, as seen during neurogenesis from neural stem cells15. Indeed, unlike human dermal fibroblasts (HDFs), PTB-depleted astrocytes all showed transient nPTB induction (Fig. 1d,e; Extended Data Fig. 1e,f). This reveals a unique property of astrocytes for conversation into functional neurons by PTB knockdown alone in both mice and humans.
Efficient astrocyte-neuron conversion in vitro
To demonstrate the functionality of converted neurons, we transduced mouse cortical astrocytes with a lentivirus expressing a small hairpin RNA against PTB (shPTB). After four weeks, 50 to 80% of shPTB-expressing cells showed neuronal morphology and stained positive for the pan-neuronal markers Tuj1 and MAP2, while control virus transduction showed no effect (Fig. 2a). RNA-seq performed before and after conversion (Supplementary Table 1) compared to public gene expression profiles of astrocytes and neurons (Extended Data Fig. 2a) showed a degree of heterogeneity between independent isolates of cortical or midbrain astrocytes, but both produced more homogeneous transcriptomes upon conversion to neurons (Extended Data Fig. 2b,c). During conversion, typical astrocytic genes were suppressed while neuronal genes were induced (Extended Data Fig. 2b,c). Notably, midbrain astrocytes gave rise to neurons expressing many DA neuron-specific genes (Extended Data Fig. 2d).
Fig. 2 |. Conversion of astrocytes to functional neurons in vitro and in mouse brain.
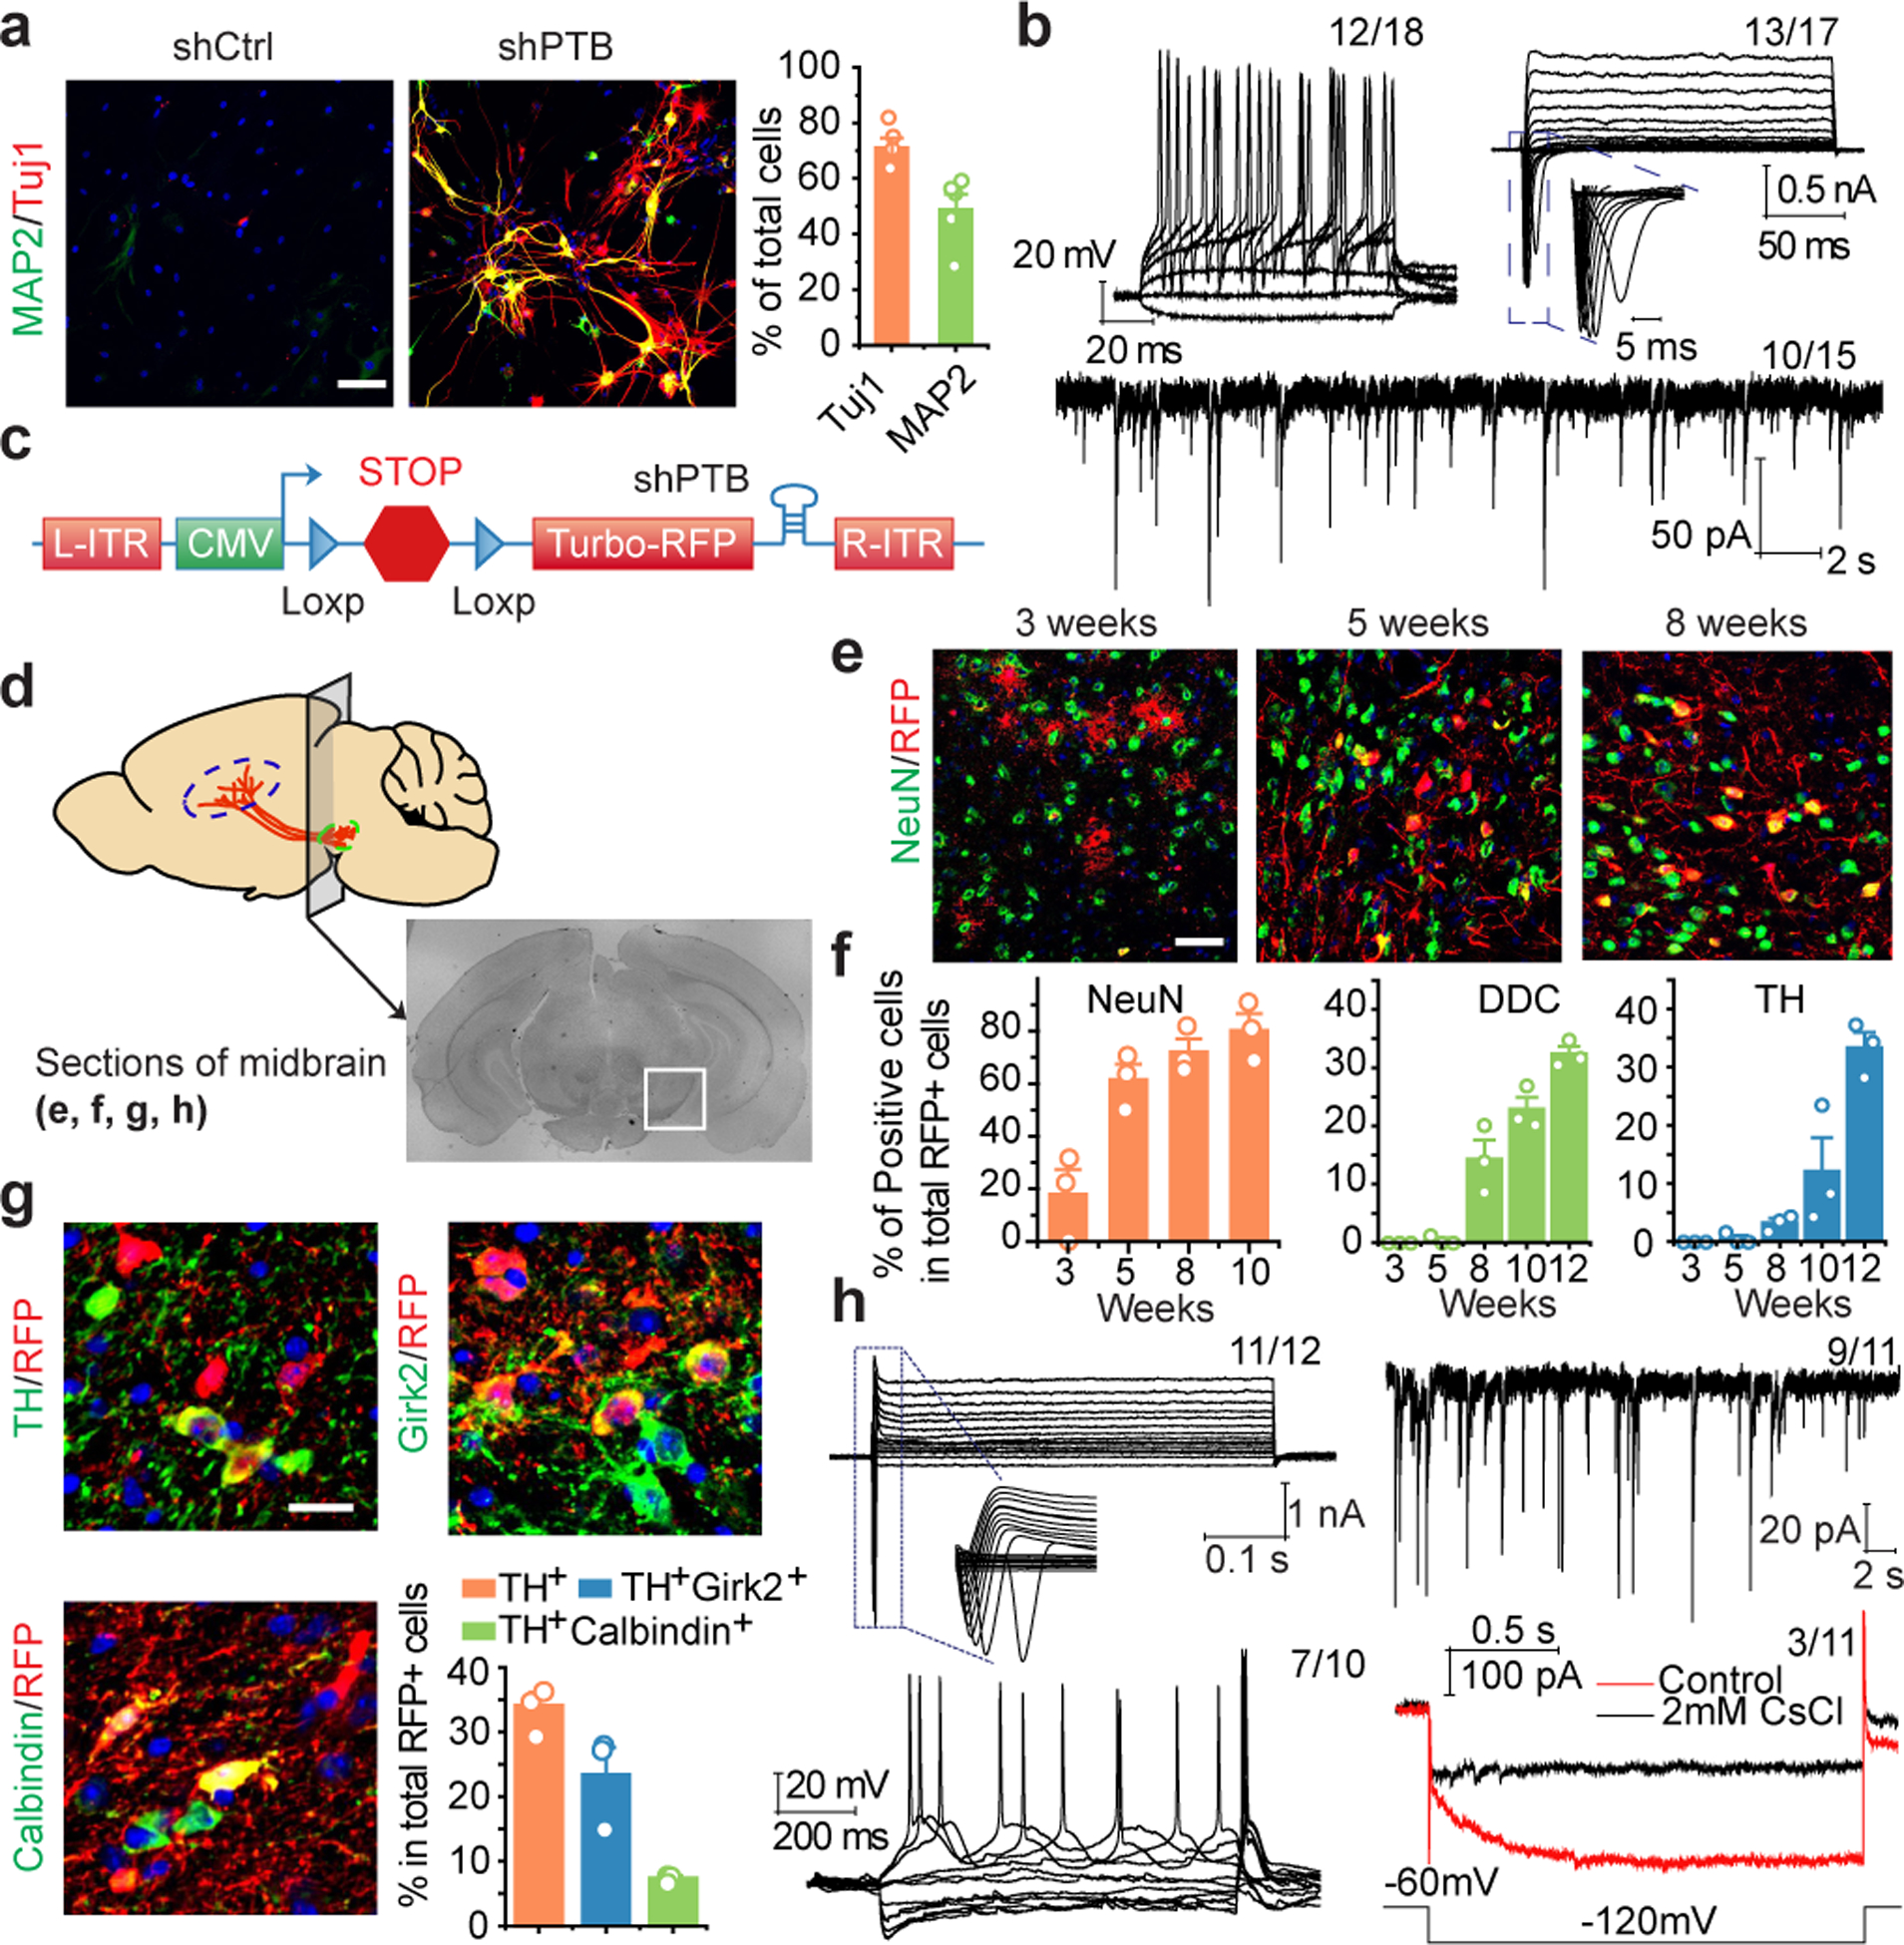
a.b, Mouse cortical astrocytes (a) treated with shCtrl or shPTB lentivirus, stained for Tuj1 (red) and MAP2 (green). Scale bar: 80 μm. Right: quantified results (n= 5 biological repeats). Error bars: SEM. Electrophysiological recordings (b), showing repetitive action potentials (top left), large currents of voltage-dependent sodium and potassium channels (top right), and spontaneous post-synaptic currents after co-culture with rat astrocytes (bottom). Indicated in each panel is the number of cells that showed the recorded activity versus the number of cells examined.
c,d, Design of the AAV-shPTB vector (c). AAV-Empty: same vector without shPTB. Schematic of the midbrain section for immunochemical analysis in the indicated panels (d).
e,f, Gradual conversion of midbrain astrocytes to NeuN+ neurons (e). Shown are representative images (Scale bar: 50 μm) at 3 time points and quantified RFP+ cells that showed positive staining for NeuN (left), DDC (middle), and TH (right). n=3 biological repeats (f). Error bars: SEM.
g, Converted TH+ DA neurons marked by Girk2 or Calbindin. Scale bar: 20 μm. Bottom right: Quantified results were based on 3 mice. Error bars: SEM.
h, Electrophysiological recordings on brain slices showing large currents of voltage-dependent sodium and potassium channels (top, left), spontaneous post-synaptic currents (top, right), repetitive action potentials (bottom, left), and mature DA neuron-associated HCN channel activities, specifically blocked with 2 mM CsCl (bottom, right). Indicated in each panel is the number of cells that showed the recorded activity versus the number of cells examined.
Mouse and human astrocyte-derived neurons were NeuN+ and NSE+ and most expressed glutamatergic (marked by VGlut1) or GABAergic (marked by GAD67) markers (Extended Data Fig. 3a,b). Patch clamp recording 6 to 8 weeks after conversion showed currents of voltage-gated sodium/potassium channels and repetitive action potential firing on both mouse and human astrocyte-derived neurons, and by co-culturing with freshly isolated rat astrocytes, spontaneous postsynaptic events of varying frequencies were also recorded (Fig. 2b; Extended Data Fig. 3c,d). Sequential addition of antagonists of ionotropic glutamatergic receptors (NBQX+APV) and an antagonist of GABAA receptors (PiTX) blocked the signals, pointing to the response of converted neurons to synaptic inputs from both glutamatergic and GABAergic neurons. No neuronal electrophysiological properties were detectable in astrocytes transduced with control virus (Extended Data Fig. 3e–h). These data demonstrate single-step conversion to functional neurons by depleting PTB.
Generating new neurons in mouse brain
We next attempted to directly reprogram astrocytes into neurons in mouse brain. We designed an AAV (serotype 2) vector to express shPTB (Fig. 2c), with the corresponding empty vector lacking shPTB as control. To enable lineage tracing, 5’ to the shPTB hairpin we placed a red fluorescent protein (RFP)-coding unit that was initially silenced (by a LoxP-Stop-LoxP cassette), but activated in cells expressing Cre recombinase. Focusing on the substantia nigra of midbrain wherein DA neurons reside (Fig. 2d), we found that RFP+ cells were virtually absent 10 weeks after injecting either AAV-Empty or AAV-shPTB in wild-type mice at postnatal 1 to 2 months, a developmental stage when astrocytes have already lost their neurosphere-generating potential in midbrain16. In contrast, RFP was expressed from both AAVs in GFAP-Cre transgenic mice expressing Cre recombinase from the astrocyte-specific GFAP promoter17 (Extended Data Fig. 4a,b).
Ten weeks after AAV-Empty injection in substantia nigra, most RFP+ cells were astrocytes, as evidenced by typical astrocytic morphology and expression of the astrocyte markers S100b and Aldh1L1 (Extended Data Fig. 4c), with no evidence for viral transduction in NG2 cells (Extended Data Fig. 4d). We detected RFP in ~1% NeuN+ neurons (Extended Data Fig. 4e), demonstrating minimal Cre expression in endogenous neurons in young adult mice. In contrast, 3 weeks after AAV-shPTB injection, ~20% of RFP+ cells expressed NeuN; the percentage of RFP+NeuN+ cells more than tripled by 5 weeks, and by 10 weeks ~80% of RFP+ cells were NeuN+GFAP– (Fig. 2e,f). At this time point, most converted neurons also expressed multiple mature neuron markers, e.g. MAP2, NSE and PSD-95 (Extended Data Fig. 4f), and markers for glutamatergic (VGlut2) or GABAergic (GAD65) neurons (Extended Data Fig. 4g). These data show a PTB shRNA-mediated, time-dependent astrocyte-to-neuron conversion in mouse midbrain.
Progressive maturation of new DA neurons
We next monitored gradual appearance of DA neurons among RFP-labeled cells from 3 to 12 weeks post AAV-shPTB injection in midbrain (Fig. 2e,f). Based on staining with the DA neuron markers DOPA decarboxylase (DDC) and TH, we detected a progressive increase in the number of converted DA neurons, reaching 30 to 35% by 12 weeks (Fig. 2f, Extended Data Fig. 5a,b). All RFP+TH+ DA neurons were detected proximal to but not distal from the site of injection wherein endogenous TH+RPF- DA neurons reside (Extended Data Fig. 5c–e), indicating restricted astrocyte-to-DA neuron conversion within the dopamine domain. Converted neurons also expressed multiple DA neuron markers DAT, VMAT2, EN1, Lmx1a, and Pitx3 (Extended Data Fig. 5f) with morphology similar to endogenous DA neurons (Extended Data Fig. 5g). A significant population of RFP+ cells (~22%) expressed TH and Girk2 (a marker of A9 DA neurons and a subpopulation of A10 neurons), while a minor population (~7%) expressed TH and calbindin-D28k (a marker of A10 DA neurons) (Fig. 2g), indicating that different subtypes of DA neurons were generated. Furthermore, Sox6-marked RFP+ DA neurons were confined to the substantia nigra (SN) and Otx2-marked RFP+ DA neurons to the ventral tegmental area (VTA); both types expressed a common DA neuron marker Aldh1a1 (Extended Data Fig. 5h–j). No RFP+TH+ cells were detected with AAV-Empty (Extended Data Fig. 5k).
Patch clamp recordings (illustrated in Extended Data Fig. 6a,b) showed typical voltage-dependent currents of sodium and potassium channels, repetitive action potential firing, and spontaneous postsynaptic currents. We also recorded the activity of hyperpolarization-active and cyclic nucleotide-gated (HCN) channels that could be specifically blocked with CsCl (Fig. 2h) and relatively wider action potential compared to that of GABAergic neurons (Extended Data Fig. 6c,d), both characteristic of mature DA neurons18,19. We recorded no HCN channel activities and rather infrequent firing of spontaneous action potentials at 6 weeks, but both HCN activities and increased firing of spontaneous action potentials in a fraction of RFP+TH+ DA neurons by 12 weeks (Extended Data Fig. 6e–g). These data demonstrate progressive functional maturation of new DA neurons within the dopaminergic neuron-containing domain of midbrain.
Regional specificity in neuronal conversion
Initially as controls for neuronal conversation in midbrain, we injected AAV-shPTB into cortex and striatum. While the overall conversion efficiency, based on RFP+NeuN+ cells, was similar in these three brain regions, RFP+TH+ DA neurons were mainly detected in midbrain (Fig. 3a,b) and RFP+Ctip2+ or RFP+Cux1+ cortical neurons in cortex (Extended Data Fig. 6h). This apparent regional specificity agrees with the RNA-seq data showing that astrocytes from different brain regions exhibited different gene expression programs20. In our culture models, we treated cortical astrocytes with lentiviral shPTB and generated ~2% TH+ neurons, as additionally characterized by induction of DA neuron-specific genes SLC6a3 and FoxA2 and positive staining for DAT, VMAT2, TH, Lmx1a, Ptx3, and DDC (Extended Data Fig. 7a–d). In contrast, cultured midbrain-derived astrocytes produced a 5-fold higher percentage (~10%) of TH+ neurons (Extended Data Fig. 7e–g).
Fig. 3 |. Regional specificity in astrocyte-to-neuron conversion and axonal targeting.
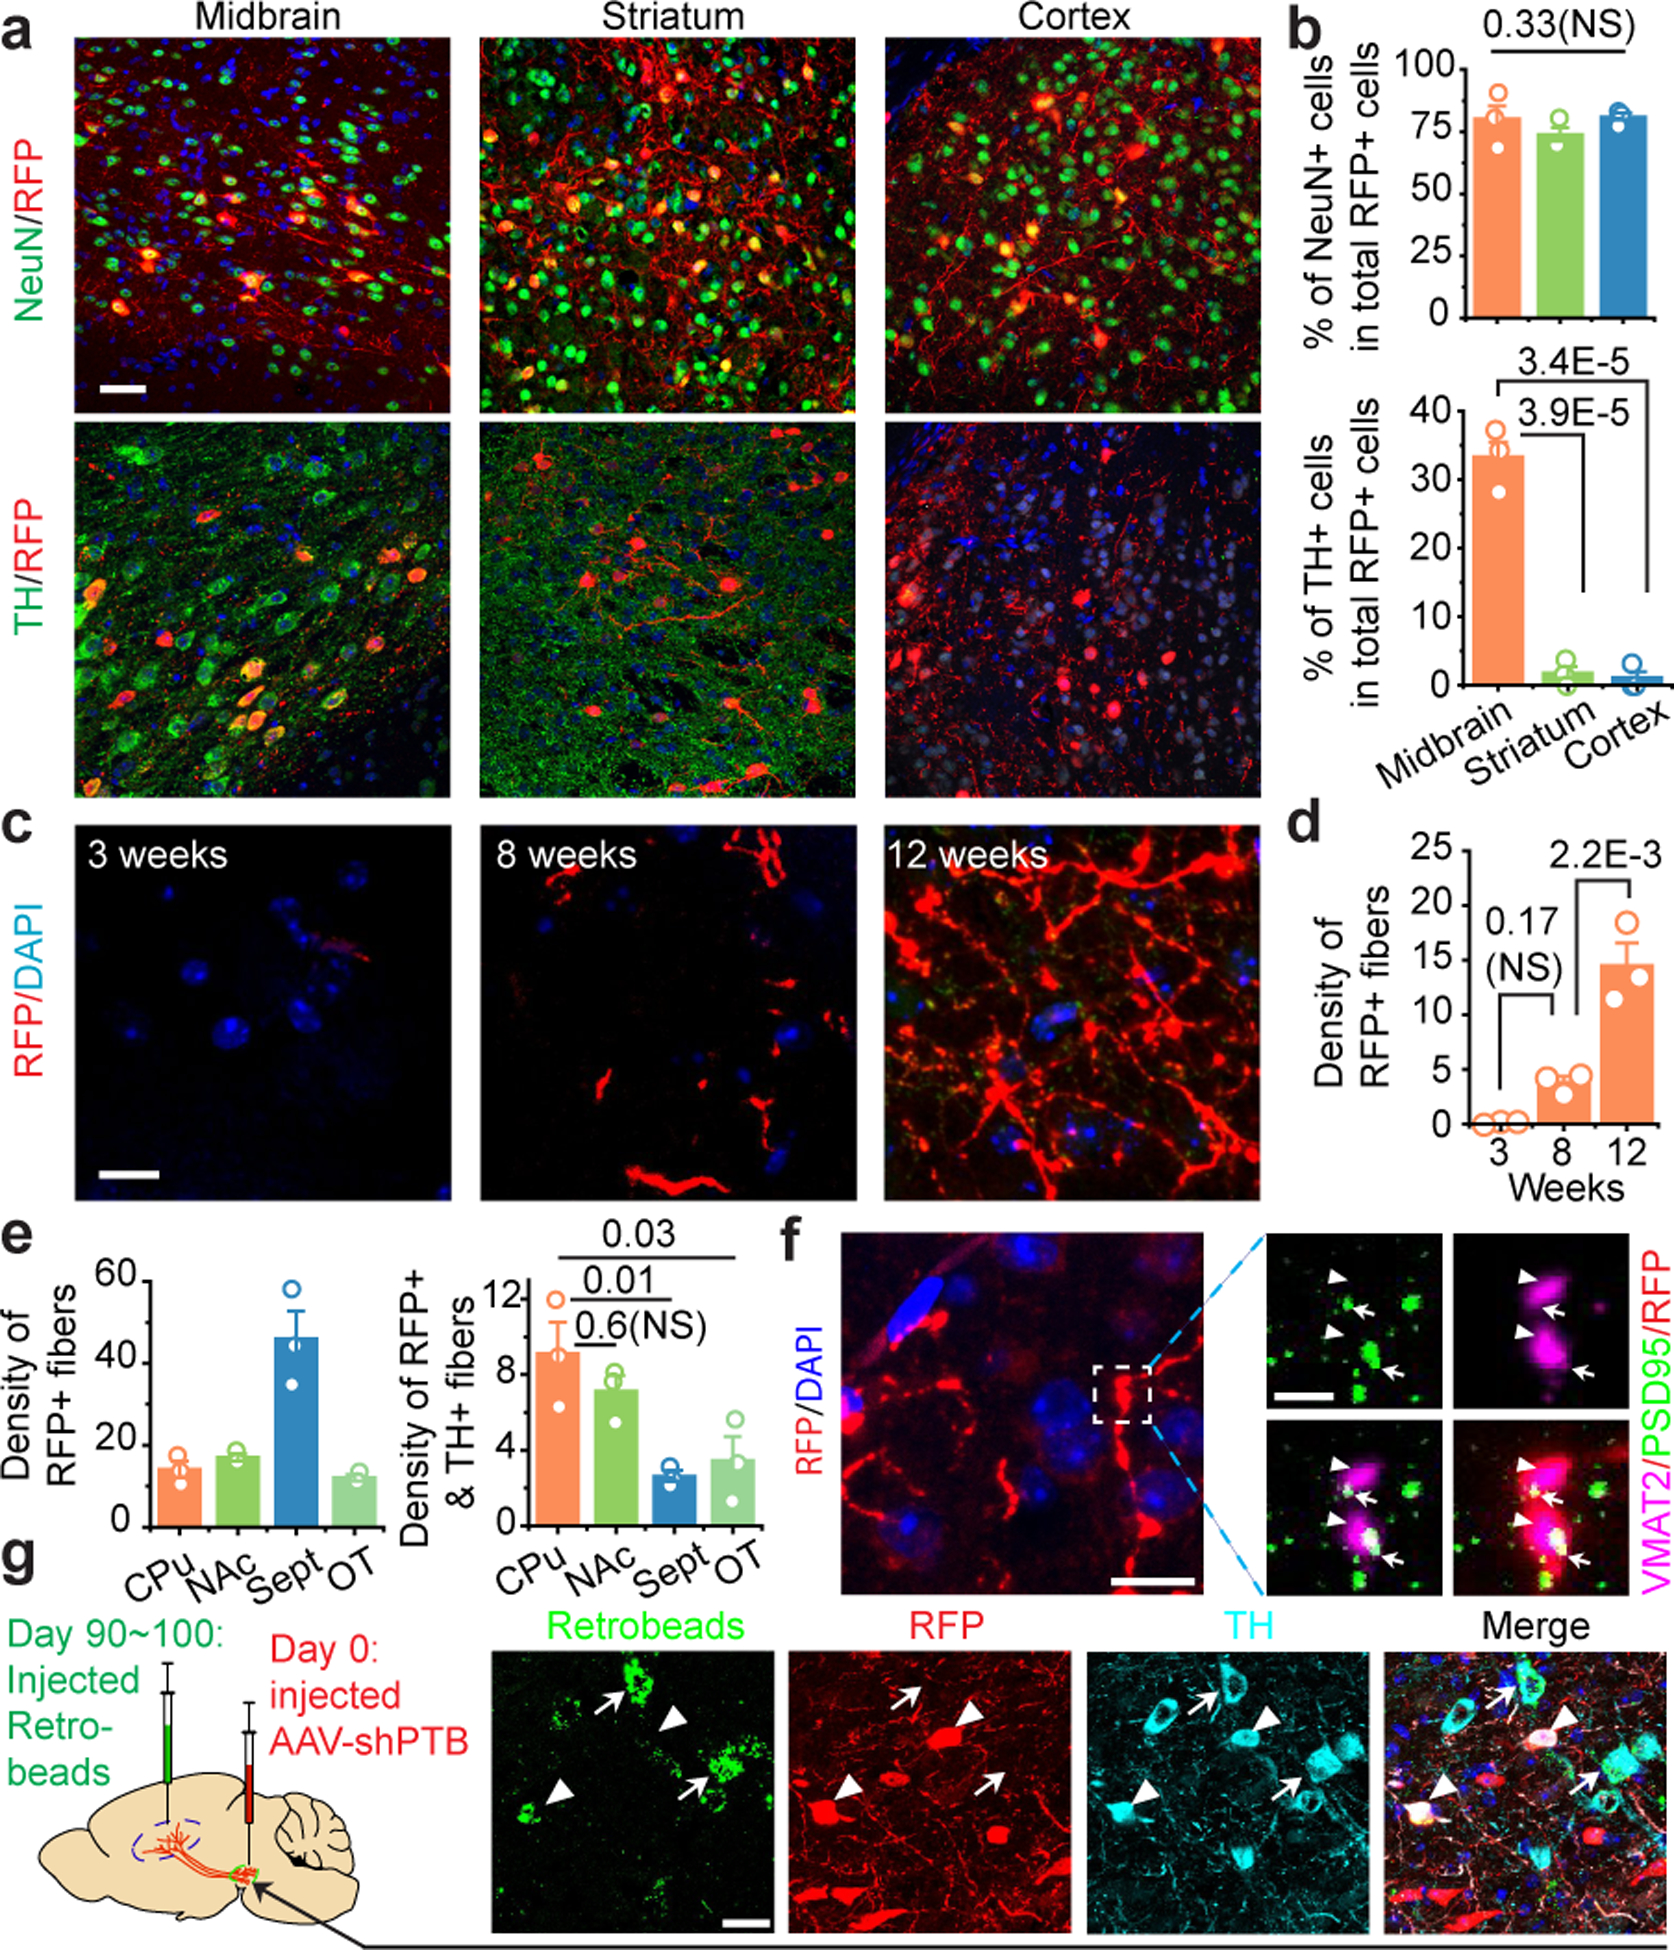
a,b, Induced NeuN+ neurons in 3 brain regions examined with TH+ neurons detected only in midbrain (a). Scale bar 30 μm. Quantified results were based on 3 mice (b).
c,d, Progressive targeting of RFP+ fibers to striatum over a course of 12 weeks (c). Scale bar: 10 μm. RFP+ fiber density was determined by the sphere method and quantified from images (n=3 biological repeats) at each time point (d).
e, Targeting of RFP+ fibers to multiple subregions around striatum, particularly Septal nuclei (left), but RFP+TH+ fibers mainly to caudate-putamen (CPu) and nucleus accumbens (NAc) (right). Quantification was performed on images collected at week 12 (n=3 mice).
f, Evidence for synaptic connection in caudate-putamen, as indicated by colocalization in the amplified window between the presynaptic marker VMAT2 (arrowheads) and the postsynaptic marker PSD95 (arrows) on RFP+ fibers. Scale bar: 10 μm; enlarged window: 2 μm.
g, Labeling of RFP+TH+ cells in substantia nigra with retrograde beads injected into striatum 90 to 100 days after reprogramming (left). Arrowheads: beads-labeled converted cells; arrows: beads-labeled endogenous (TH+ RFP-) DA neurons. Scale bar: 20 μm.
Statistical significance in (b), (d), (e) was determined by ANOVA with post-hoc Tukey test and represented as mean+/−SEM. NS: not significant. Specific P-values are indicated in each panel. (f), (g) was each based on 3 independently repeated experiments with similar results.
We found no evidence that conditioned media from cultured midbrain astrocytes enhanced the conversion of cortical astrocytes into TH+ neurons (Extended Data Fig. 8a,b), which prompted us to explore other potential cell autonomous contributions to the regional specificity by performing RT-qPCR analysis on isolated cortical and midbrain astrocytes. Relative to cortical astrocytes, midbrain astrocytes expressed higher basal levels of TFs enriched DA neurons (Extended Data Fig. 8c,d) and in response to PTB depletion, these TFs were more robustly induced in midbrain astrocytes relative to cortical astrocytes (Extended Data Fig. 8e,f). These findings suggest that distinct promoter-enhancer networks may underlie the regional specificity for astrocytes from different brain regions, as recently observed in microglia21. The higher DA neuron conversion rate also enabled us to record dopamine release from midbrain astrocyte-derived neurons (Extended Data Fig. 8g,h,i). These in vitro studies strongly suggest that both higher basal levels and more robust induction of lineage-specific TFs may contribute to the higher propensity of midbrain astrocytes to generate DA neurons. Importantly, the much higher conversion efficiency in the mouse midbrain (~35%) as compared to isolated midbrain astrocytes (~10%) points to the contribution of local microenvironement to DA neuron conversion from midbrain astrocytes.
Innervation in the nigrostriatal pathway
We next investigated the dynamics of fiber outgrowth from newly converted neurons in the brain. We initially monitored the outgrowth of RFP+ fibers along the nigrostriatal bundle (NSB) (Extended Data Fig. 9a,b). Using the sphere method22, we quantified the fiber density, revealing a time-dependent appearance of RFP+ fibers in the NSB, reaching 29.6±5.4 fibers by 12 weeks, with 5.75±0.5 fibers being RFP+TH+ (Extended Data Fig. 9c,d). As DA neurons normally target striatum, we also detected progressively increased RFP+ fibers in this distal region, reaching 14.5±3.6 fibers per area by 12 weeks (Fig. 3c,d). Examining brain regions broadly, we found that RFP+ fibers targeted caudate-putamen (CPu) as well as nucleus accumbens (NAc), septal nuclei (Sept) and olfactory tubercle (OT) (Extended Data Fig. 9e), as observed earlier with grafted neuronal stem cells23. A fraction of these RFP+ fibers were also TH+ (Extended Data Fig. 9f). Importantly, despite ~3-fold more RFP+ fibers in Sept, RFP+TH+ processes were ~4-fold higher in both CPu and NAc regions (Fig. 3e). Focusing on CPu, we detected colocalization on RFP+ fibers of the presynaptic marker VMAT2 and the postsynaptic marker PSD-95, suggestive of synaptic connections (Fig. 3f).
To further substantiate functional targeting to striatum, we injected green fluorescent retrobeads into the CPu region of mice 1 or 3 months after AAV-shPTB delivery to allow for axonal uptake and retrograde labeling of the corresponding cell bodies (Fig. 3g, first panel). One day after injection, we saw green retrobeads in both endogenous TH+/RFP– cells and converted TH+/RFP+ cells within substantia nigra. We could only detect labeling of endogenous DA neurons 1 month after AAV-shPTB transduction (Extended Data Fig. 9g,h), but after 3 months, we detected retrobeads in both endogenous (RFP–) and newly converted (RFP+TH+) neurons (Fig. 3g). These data demonstrate time-dependent incorporation of new DA neurons into the nigrostriatal pathway.
Replenishing lost DA neurons in a PD model
Given the success in generating new DA neurons, we then explored the potential to reconstitute an injured nigrostriatal pathway. To this end, we selected a widely used Parkinson’s Disease (PD) mouse model in which DA neurons were efficiently ablated by 6-hydroxydopamine (6-OHDA), a dopamine analog toxic to DA neurons24. Although this model does not recapitulate all essential features of PD pathogenesis25, it does result in a critical endpoint, the loss of substantia nigra neurons and depletion of striatal dopamine. One month after 6-OHDA injection into one side of the medial forebrain bundle (Fig. 4a), we saw unilateral loss of TH+ cell bodies in midbrain (Fig. 4b, upper), accompanied by a marked increase of GFAP+ astrocytes (Fig. 4b, bottom), indicative of the expected reactive astrocytic response26. One month after the lesion, we injected AAV-Empty or AAV-shPTB in the lesioned side and observed increased RFP+TH+ cell bodies 10~12 weeks later with AAV-shPTB, but not AAV-Empty (Fig. 4c, Extended Data Fig. 10). We also detected a significant increase in RFP+TH+ fibers in striatum of AAV-shPTB, but not AAV-Empty, treated mice (Fig. 4d,e, Extended Data Fig. 11a,b).
Fig. 4 |. Replenishing lost DA neurons to reverse parkinsonian phenotype.
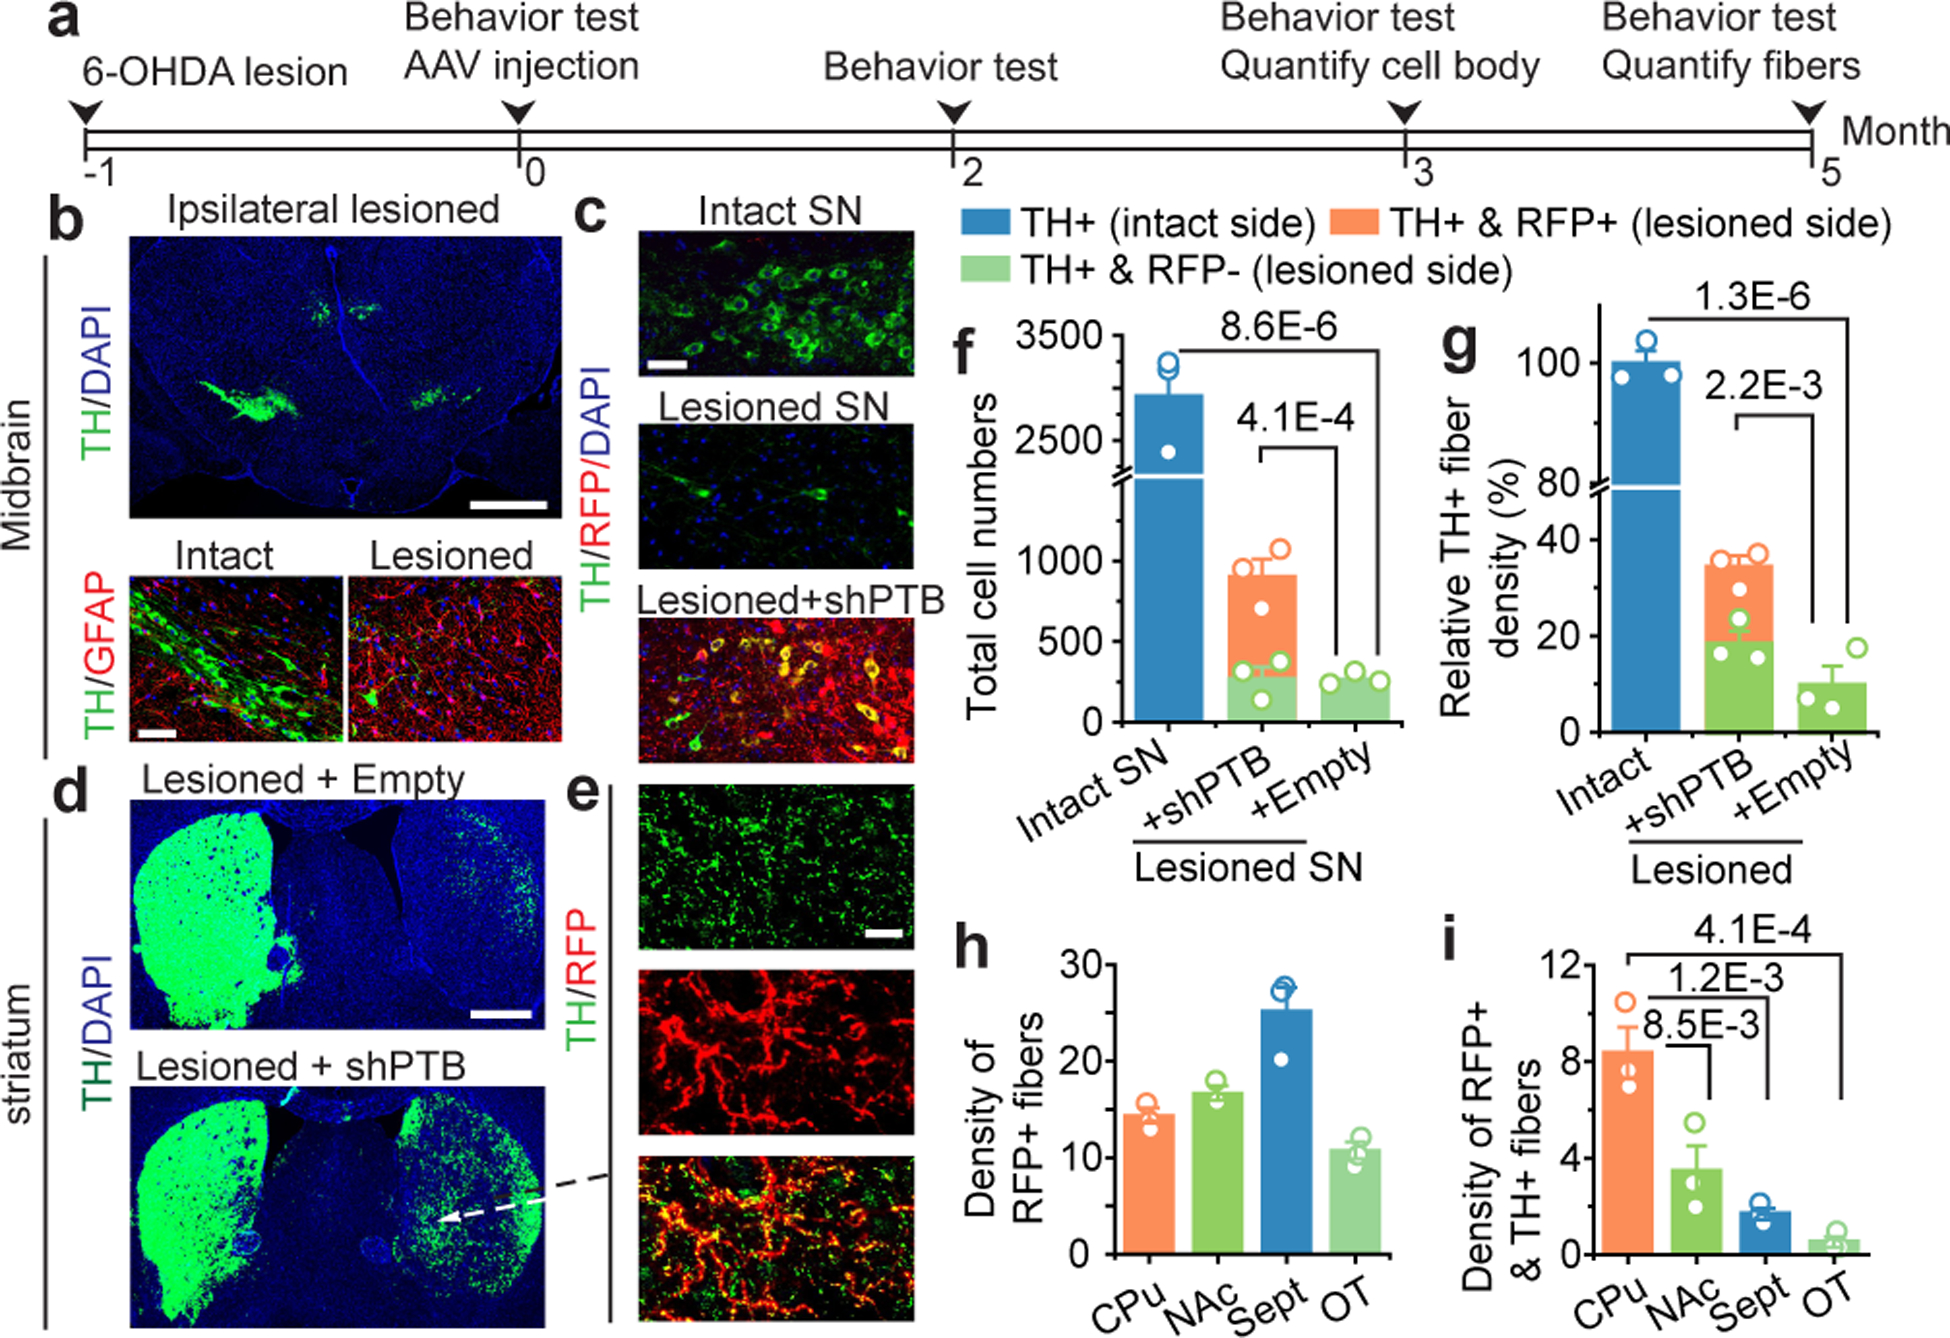
a, Schematic of the experimental schedule for 6-OHDA-induced lesion in substantia nigra (SN) followed by AAV-shPTB treatment and behavioral tests.
b, 6-OHDA-induced unilateral loss of TH+ cells in midbrain (top, Scale bar: 500 μm), accompanied with increased GFAP+ astrocytes (bottom, Scale bar: 50 μm).
c, Comparison between unlesioned (top) and 6-OHDA-lesioned nigra (middle), showing converted DA neurons (yellow) after AAV-shPTB treatment (bottom). Scale bar: 50 μm.
d,e, TH+ fibers in striatum treated with AAV-Empty (top) or AAV-shPTB (bottom) (d). Scale bar: 500 μm. Amplified views from (d), showing extensive RFP+TH+ fibers (e). Scale bar: 10 μm. (b) to (e) were each based on 3 independently repeated experiments with similar results.
f,g, Quantified DA neuron cell bodies (f) or fibers (g) in the unlesioned side (blue), remaining endogenous RFP–TH+ DA neurons in the lesioned side (green), and converted RFP+TH+ DA neurons in the lesioned side (orange). Data were from two sets of mice (n=3 in each set) transduced with AAV-shPTB or AAV-Empty.
h,i, Quantification of RFP+ (h) or RFP+TH+ (i) fiber density in different subbrain regions, as indicated at bottom (n=3 mice in each group).
Statistical significance from panel (f) to (i) was determined by ANOVA with post-hoc Tukey test and represented as mean+/− SEM. NS: not significant. Specific P-values are indicated in each panel.
Quantitative analysis revealed that the initial 2926±273 TH+ neuronal cell bodies in substantia nigra were reduced ~90% (to 266±22) upon lesion and AAV-shPTB induced 634±38 new RFP+TH+ neurons (Fig. 4f), thereby restoring TH+ neurons to ~1/3 (904±108) of the initial number. Similarly, 6-OHDA lesioning reduced TH+ fibers by ~90% and AAV-shPTB restored total TH+ fiber density to ~30% of the unlesioned brain (Fig. 4g). We detected a slight increase in TH+RFP– fiber density following AAV-shPTB treatment as compared to AAV-Empty (Extended Data Fig. 11c,d), suggesting that AAV-shPTB treatment might aid recovery of some remaining damaged endogenous DA neurons. Quantification of total RFP+ fibers versus RFP+TH+ fibers in different striatal regions revealed that while Sept was enriched with RFP+ fibers (Fig. 4h), CPu contained the highest proportion of RFP+TH+ fibers (Fig. 4i, Extended Data Fig. 12). Thus, without any additional treatment to specify neuronal subtypes, AAV-shPTB is sufficient to induce new DA neurons from endogenous midbrain astrocytes that partially restore lost DA neurons and their axons within the nigrostriatal dopamine pathway.
Restoration of striatal dopamine
We next asked whether AAV-shPTB-induced neurons would restore dopamine levels in striatum by preparing extracts from striatum and quantifying dopamine levels by high performance liquid chromatography (HPLC) (Fig. 5a). Known amounts dopamine were spiked-in to define the DA elution position and to establish a linear correlation between signal intensities and the amount of dopamine (Extended Data Fig. 13a,b). We detected similar amounts of dopamine in both sides of unlesioned mice (Fig. 5b) and found 6-OHDA lesion reduced dopamine to ~25% of the normal level (Fig. 5c). Treatment with AAV-shPTB, but not AAV-Empty, dramatically increased dopamine compared to lesioned striatum (Fig. 5d), reaching ~65% of the unlesioned level (Fig. 5e).
Fig. 5 |. Restoration of dopamine biogenesis and activity-induced dopamine release.
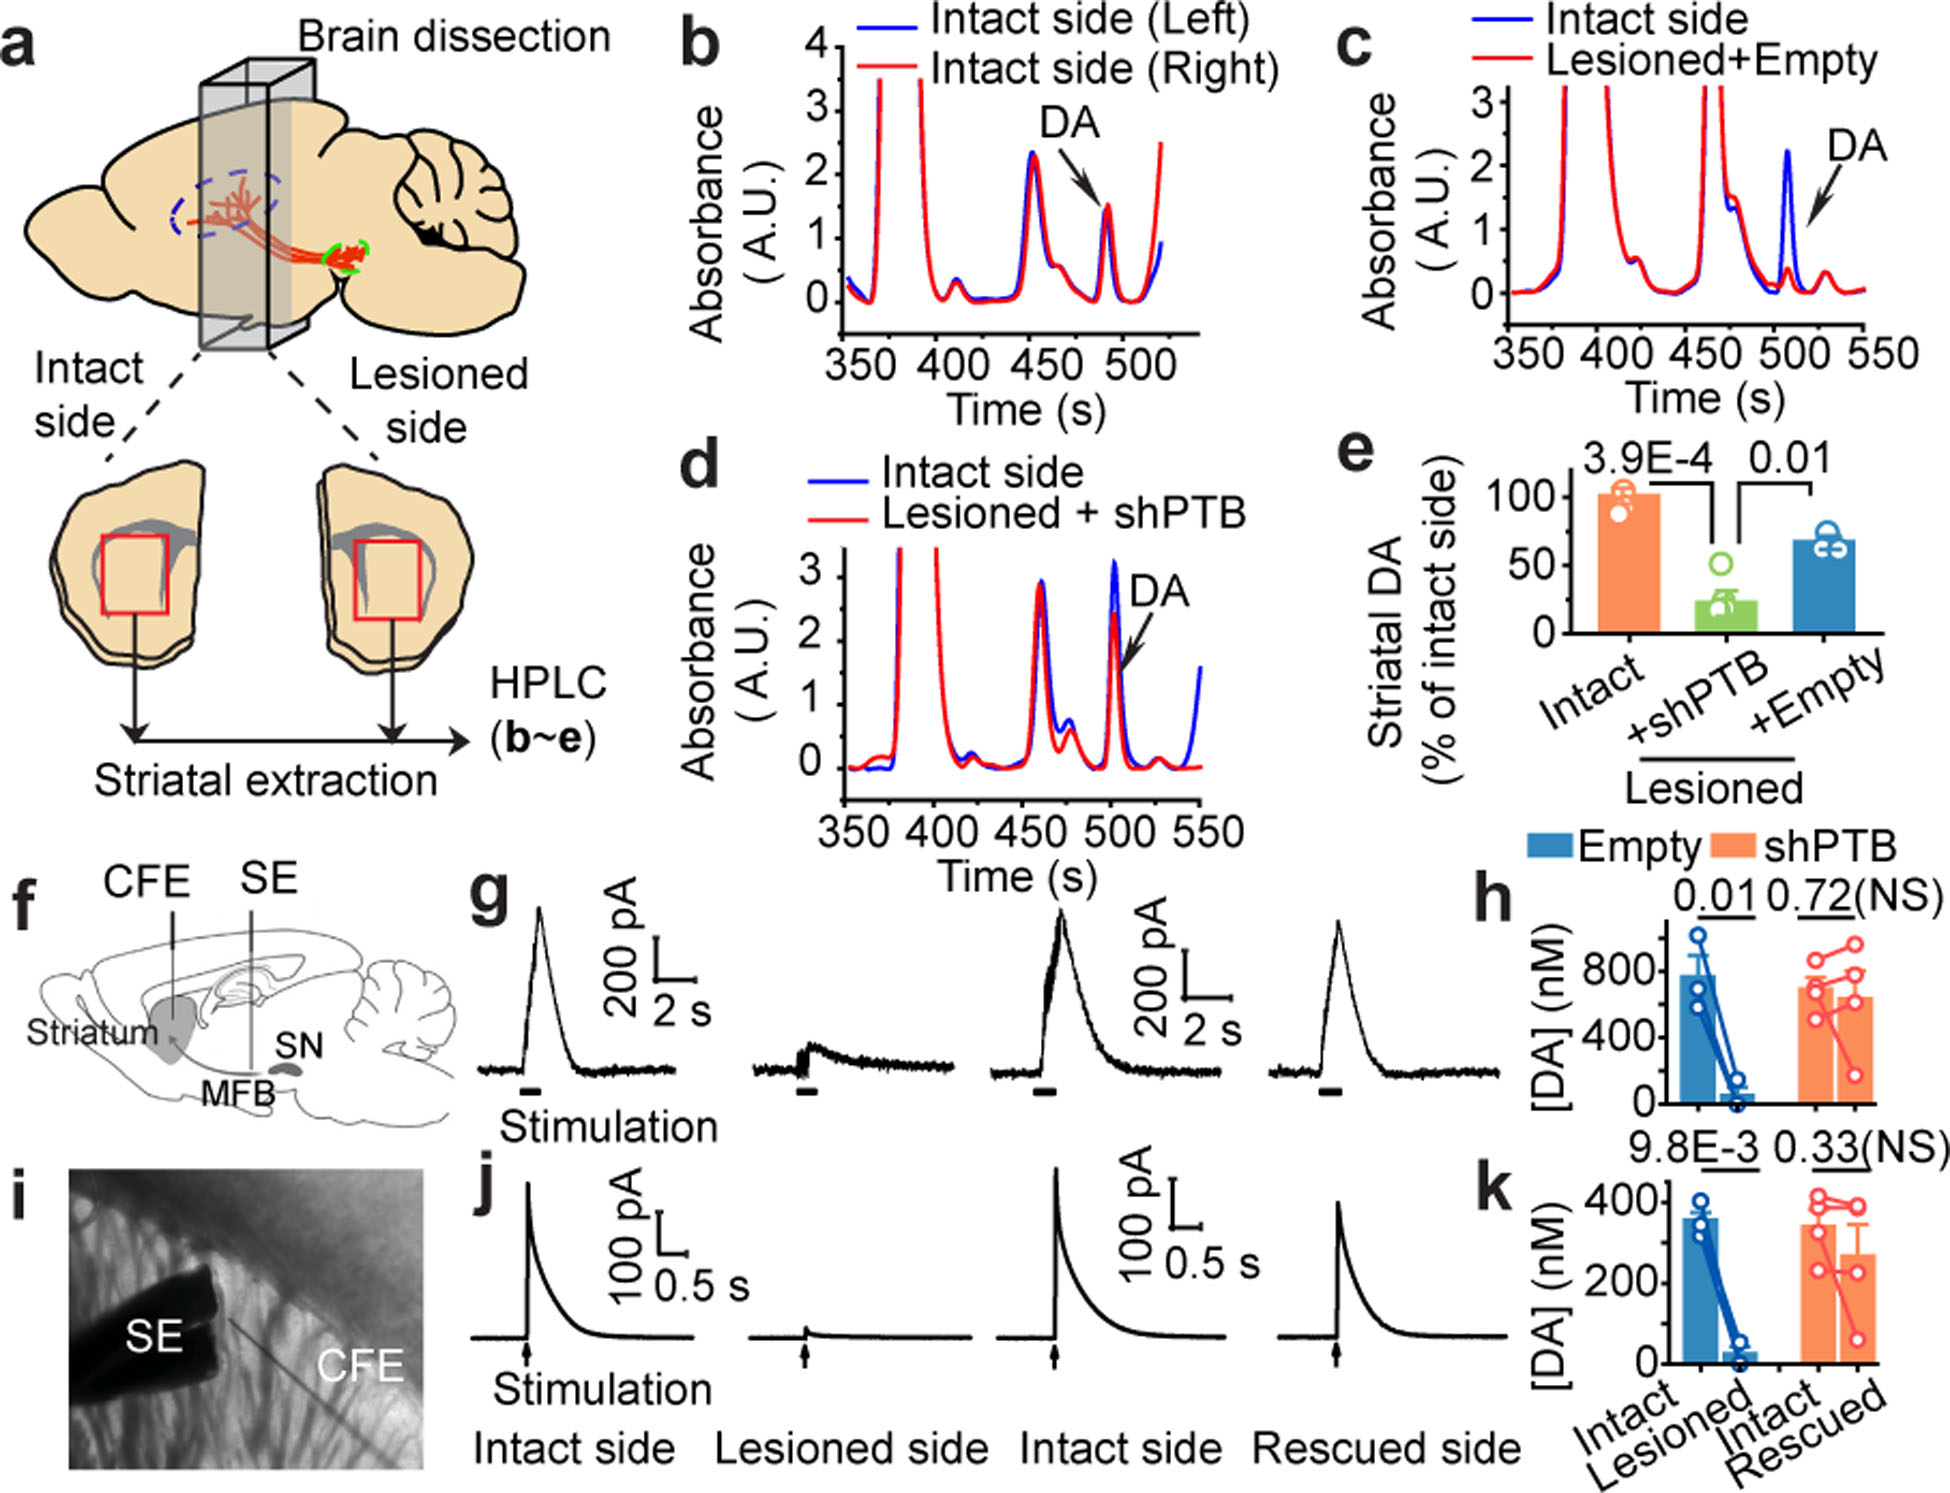
a, Schematic depiction of the measurement of striatal dopamine levels by HPLC.
b,c,d, Striatal dopamine levels in two sides of unlesioned mouse brain (b), comparison between unlsioned and 6-OHDA lesioned sides (c), and restoration in the lesioned side after reprogramming in ipsilateral nigra (d). Arrow in each panel: the DA position in HPLC.
e, Striatal dopamine restoration after reprogramming with AAV-shPTB in ipsilateral nigra (n=3 unlesioned mice or lesioned mice treated with AAV-shPTB; n=4 lesioned treated with AAV-Empty).
f,g,h, Activity-induced dopamine release in striatum. Depicted is striatal dopamine recording with insertion of a carbon fiber electrode (CFE) in striatum and stimulation electrode (SE) in medial forebrain bundle (MFB) next to substantia nigra (SN) in live animals (f). Representative traces of activity-induced dopamine release recorded on the unlesioned and 6-OHDA-lesioned striatum before and after neuronal conversion (g). Shown are statistics of the recorded results (n=3 for AAV-Empty treated; n=4 for AAV-shPTB treated mice) (h). Circles: individual mice; lines: same mice before and after reprogramming.
i,j,k, Dopamine release recorded on striatal slices from the same set of mice analyzed in (g) as diagrammed in (i). Shown are representative traces (j) and the statistics of the recorded results (k) as in (h).
Statistical significance was determined by ANOVA with post-hoc Tukey test in (e) or by Student’s t-test in (h, k), both represented as mean+/− SEM. NS: not significant. Specific P-values are indicated in each panel.
To test if DA neuron function was restored, we directly measured activity-induced dopamine release to demonstrate restored DA neuron functions by inserting in live animals a stimulating electrode (SE) in medial forebrain bundle (MFB) and a carbon fiber electrode (CFE) in striatum (Fig. 5f). In lesioned mice treated with AAV-Empty, we recorded stimulation-dependent dopamine release in the unlesioned side but a greatly diminished signal in the lesioned side (Fig. 5g, left). In lesioned mice treated with AAV-shPTB, activity-induced dopamine release was detected in both the unlesioned and lesioned sides (Fig. 5g, right). Three out of four animals showed significant restoration of DA release (Fig. 5h). Placing SE and CFE on striatal slices from the same set of animals (Fig. 5i), we recorded activity-induced dopamine release (Fig. 5j), with the same mouse showing reduced release as in live recording (Fig. 5k), ruling out a misplaced electrode as a cause for reduced release in vivo. These data demonstrate robust restoration of striatal dopamine and activity-induced dopamine release in AAV-shPTB reprogrammed mice.
Reversing PD-relevant motor phenotypes
Next, we tested the ability to restore motor function to 6-OHDA lesioned mice with AAV-shPTB. We performed three commonly used behavior tests, the first two based on drug-induced rotation and the third on spontaneous motor activities27. Both contralateral rotation induced by apomorphine and ipsilateral rotation triggered by amphetamine were markedly increased following lesion with 6-OHDA; both phenotypes were progressively restored to nearly wild-type levels within 3 months after AAV-shPTB treatment (Fig. 6a,b). No correction was recorded in mice treated with either AAV-Empty (Fig. 6a) or non-specific AAV-shGFP (Extended Data Fig. 13c).
Fig. 6 |. Behavioral benefits and chemical genetic evidence for induced neurons in brain repair.
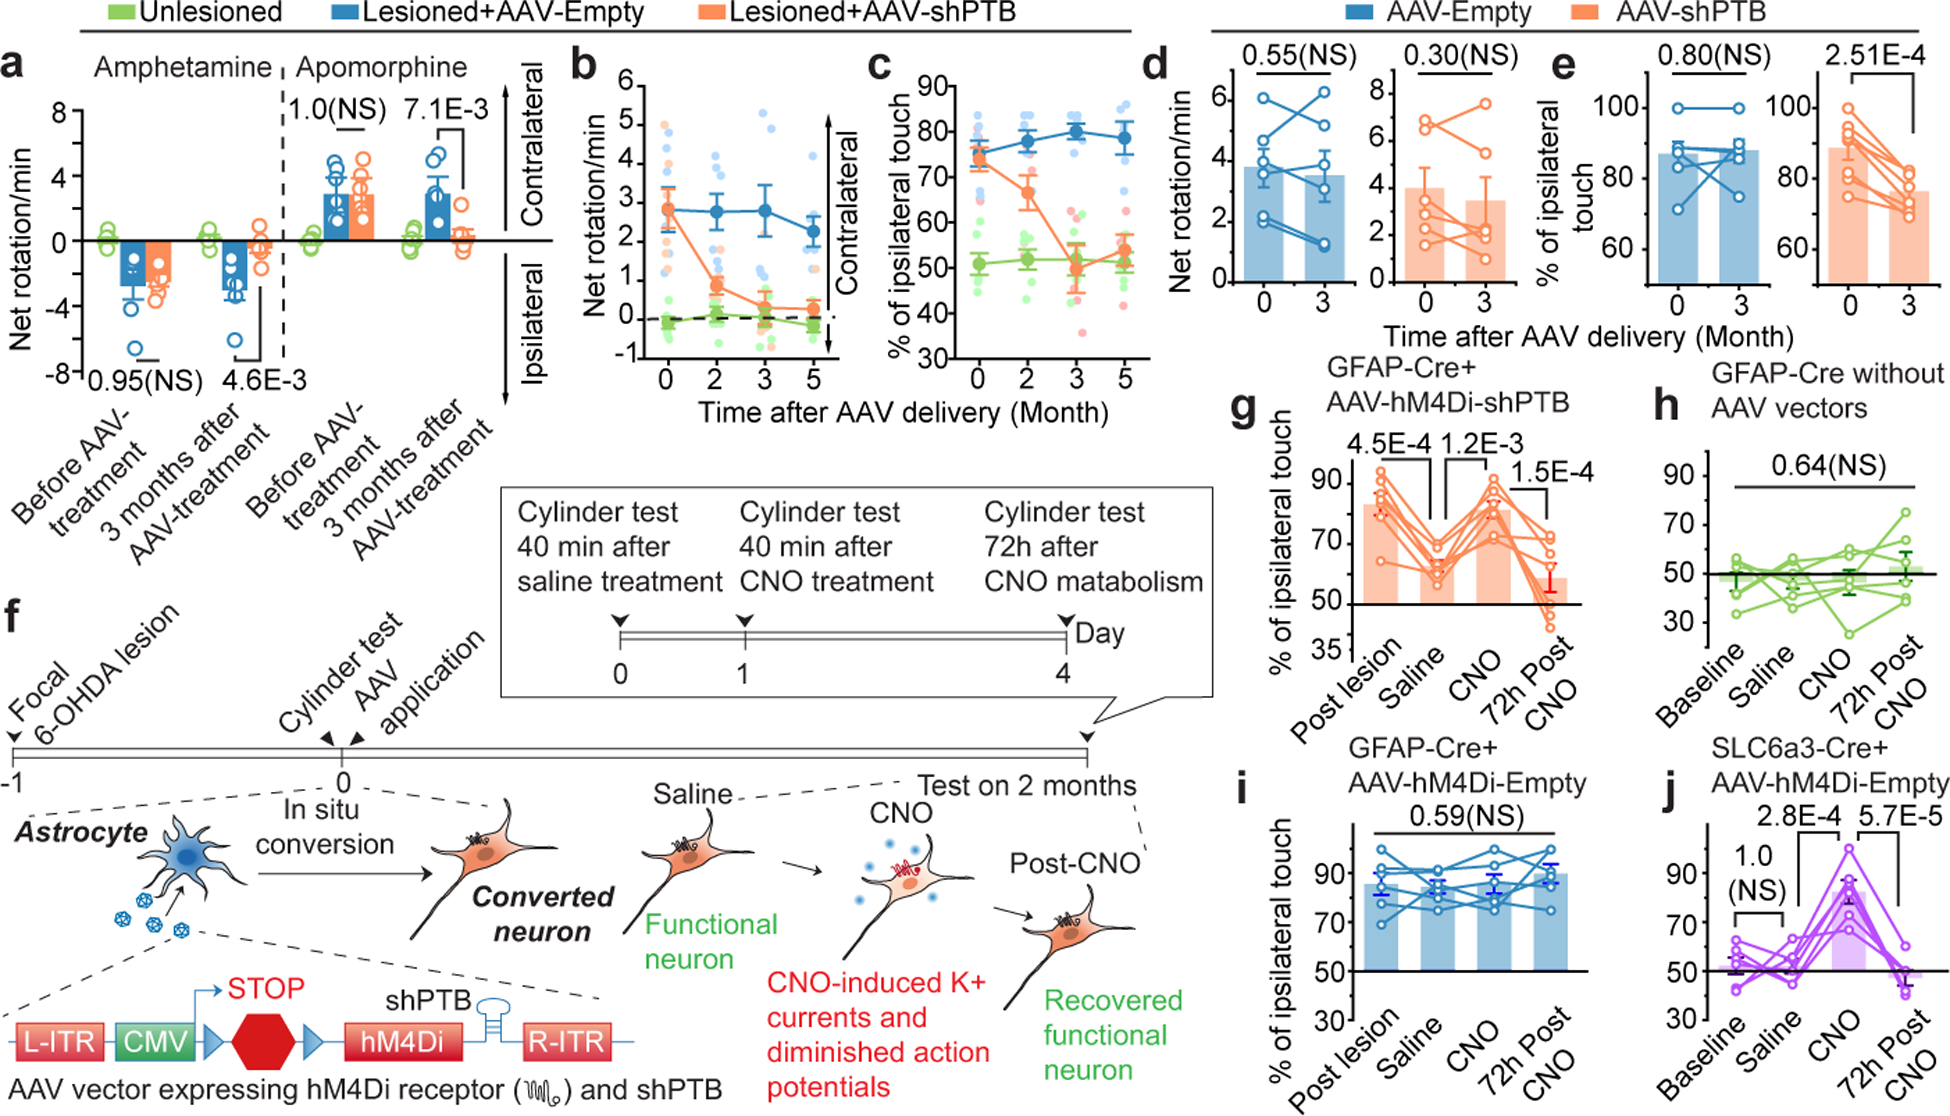
a, Parkinsonian behaviors in mock-treated (green), 6-OHDA-lesioned mice treated with AAV-Empty (blue) or AAV-shPTB (orange). Rotation was induced by amphetamine (left) or apomorphine (right). n=7 mice used for lesioned/treated with AAV-Empty or AAV-shPTB in apomorphine test. n=6 mice used for the rest conditions.
b,c, Time-course analysis of behavioral restoration. Rotation induced by apomorphine (b) and cylinder test for ipsilateral touches (c) in unilateral lesioned mice (n=6 or 7 mice analyzed in each group as in (a). Error bar: SEM.
d,e, Apomorphine-induced rotation test (d) and cylinder test (e) on 1-year old lesioned mice 3 months after treatment with AAV-Empty or AAV-shPTB (n=8 mice used for lesioned/treated with AAV-shPTB in cylinder test. n=6 mice for the rest conditions). Circles: individual mice; lines: same mice before and after reprogramming.
f, Schematic of the chemogenetic strategy to demonstrate converted neurons directly responsible for phenotypic recovery, emphasizing the rapid effect of injected CNO in inhibiting activities of reprogrammed neurons and reappearance of parkinsonian phenotype after CNO metabolism.
g,h,i, Results of cylinder test before and after injecting AAV-hM4Di-shPTB, treatment with saline or CNO or 3 days after drug withdrawal (g) in unlesioned mice mock-treated or treated with CNO (h) or lesioned mice treated with AAV-hM4Di-Empty vector (i). n=7 GFAP-Cre mice for (g), 6 for (h) and (i).
j. The cylinder test results on unlesioned SLC6a3 transgenic mice (n=6) treated with AAV-hM4Di, which specifically targets endogenous DA neurons due to DA neuron-restricted Cre expression by the SLC6a3 promoter.
Statistical significance in (a, b, c, g, h, i, j) was determined by ANOVA with post-hoc Tukey test and represented as mean+/− SEM. NS: not significant. Specific P-values are indicated in each panel.
To examine spontaneous motor activity, we scored limb use bias. Unlesioned mice used both limbs with relatively equal frequency, while unilaterally lesioned mice showed preferential ipsilateral touches, indicating disabled contralateral forelimb function. In lesioned mice transduced with AAV-shPTB, we observed a time-dependent improvement in contralateral forelimb use, while AAV-Empty transduced mice failed to show any improvement (Fig. 6c). These data demonstrate essentially full correction of the motor phenotypes in this chemically induced PD model. As PD and most other types of neurodegenerative diseases show age-dependent onset, we extended our approach from relatively young (postnatal 2 months) to 1-year old mice, an age comparable to PD onset in humans. Interestingly, while the behavior benefits based on apomorphine-induced rotation did not reach statistical significance, perhaps due to relatively unstable phenotype scored by this assay on aged animals (Fig. 6d), significant behavioral improvement was recorded with the forelimb use asymmetry test (Fig. 6e). These observations point to age-related decrease in neuronal reprogramming, a critical challenge to be met in future studies.
Chemogenetic analysis of new DA neurons
To test if new DA neurons are directly responsible for the restoration of motor function, we employed a chemogenetic approach known as the DREADD platform28 (Fig. 6f). We replaced RFP in our AAV-shPTB vector with a gene encoding an engineered inhibitory muscarinic receptor variant hM4Di, which no longer responds to acetylcholine but instead to clozapine-N-oxide (CNO)29. As with the original AAV-shPTB, the expression of both hM4Di and shPTB was activated in astrocytes in GFAP-Cre mice. Neurons converted from astrocytes would be expected to incorporate this receptor into their plasma membrane and respond to CNO to activate Gi signaling, leading to hyperpolarization and suppression of electrical activity30. CNO is metabolized 2 to 3 days after administration to allow functional restoration of hM4Di-expressing neurons29.
As expected, 2 months after AAV-hM4Di-shPTB transduction, motor performance of 6-OHDA lesioned GFAP-Cre mice was restored based on the limb use bias test. The lesioned-induced phenotype re-appeared within 40 min of intraperitoneal injection of CNO, but not saline; the CNO-provoked motor phenotype disappeared within 3 days (Fig. 6g). CNO injection into unlesioned mice showed no effect, indicating that the drug did not impact endogenous DA neurons (Fig. 6h). AAV-hM4Di-Empty showed no benefit to lesioned mice and no impact on unlesioned mice with or without CNO (Fig. 6i, Extended Data Fig. 13d), demonstrating that the observed behavior improvement with AAV-hM4Di-shPTB was reprogramming-dependent.
Importantly, targeted expression of hM4Di within endogenous DA neurons (by injecting AAV-hM4Di-Empty into the midbrain of mice expressing Cre from the DA neuron-specific SLC6a3 gene promoter) was sufficient to induce the parkinsonian phenotype, but only in the presence of CNO (Fig. 6j), indicating that the introduction of the receptor into endogenous DA neurons had the intended, CNO-mediated inactivating effect. Collectively, these data provide unequivocal evidence that activity-induced signaling by astrocyte-derived neurons is responsible for phenotypic recovery.
ASO-based neuronal conversion and rescue
The PTB-regulatory loop is self re-enforcing once triggered by initial PTB knockdown (see Fig. 1a). In response to PTB reduction, miR-124 becomes more efficient in targeting REST (due to the ability of PTB to directly compete with the miRNA targeting site in the 3’UTR of the mRNA encoded by REST), resulting in reduced REST, an action that drives further de-repression of miR-124 and thus further suppression of PTB9,10. This suggested that transient suppression of PTB might be sufficient to generate new neurons through ASO-mediated PTB mRNA degradation by intranuclear RNase H12. We thus synthesized and screened anti-PTB ASOs containing a phosphorothioate backbone12 and a 3’ fluorescein. An ASO targeting GFP served as control. Three PTB-ASOs, but not GFP-ASO, reduced PTB expression upon transfection into mouse astrocytes (Fig. 7a). The best targeting PTB-ASO (#4), but not GFP-ASO, induced multiple neuronal markers, including Tuj1, MAP2, NSE and NeuN after 5 weeks (Fig. 7b). A fraction of converted neurons were dopaminergic, as indicated by positive TH staining (Fig. 7b). Patch clamp recording showed that these in vitro converted neurons were functional (Extended Data Fig. 14a–c).
Fig. 7 |. Proof-of-concept experiments with the ASO-based strategy.
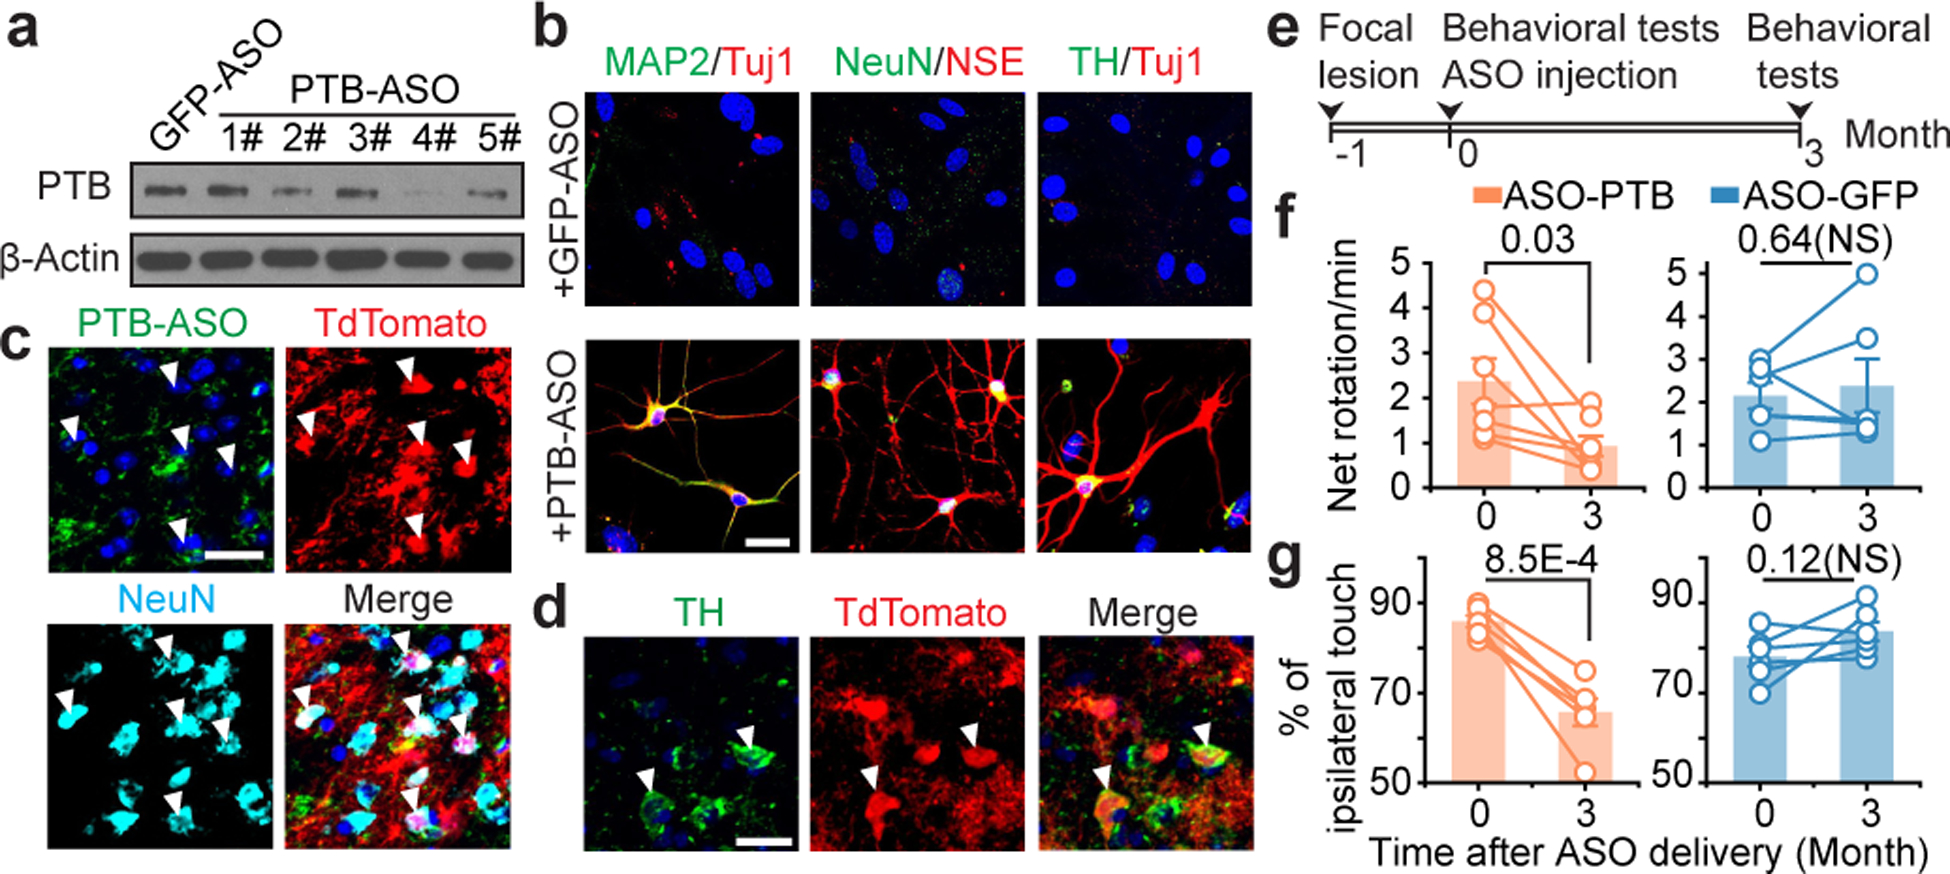
a,b, Screening for PTB-ASOs by Western blotting in mouse astrocytes (a). PTB-ASO induced neurons in isolated mouse cortical astrocytes in vitro (b), positively stained for Tuj1 and MAP2 (left), NSE and NeuN (middle), with a small fraction of converted neurons stained positively for TH (right). n=3 biological repeats for both (a) and (b). Scale bar: 20 μm.
c,d, A portion of tdTomato-labeled cells became NeuN+ by 8 weeks (c) and TH+ by 12 weeks (d) after PTB-ASO injection into midbrain of GFAP-CreER™/Rosa-tdTomato transgenic mice. n=4 biological repeats for both (c) and (d). Scale bar: 20 μm.
e,f,g, Schematic of 6-OHDA induced lesion, ASO treatment, and behavioral tests (e). Results of apomorphine-induced rotation (f) and cylinder test (g). Circles: individual mice; lines: same mice before and after reprogramming (n=7 used for lesioned/treated with PTB-ASO in apomorphine test. n=6 for the rest conditions, both on wild-type C57BL/6 mice). Statistical significance in (f) and (g) was determined by two-sided Students’ t-test. NS: not significant. Specific P-values are indicated in each panel.
We next injected PTB-ASO or control GFP-ASO into the midbrain of transgenic mice carrying a tamoxifen-inducible Cre selectively expressed in astrocytes and a TdTomato encoding gene activated by Cre (Extended Date Fig. 14d,e). We induced Cre in these mice at postnatal day 35 and 2 weeks later stereotactically injected ASOs unilaterally into their substantia nigra. PTB-ASO turned a fraction of TdTomato-labeled cells into NeuN+ neurons by 8 weeks (Fig. 7c) and TH+ neurons by 12 weeks (Fig. 7d). Patch clamp recording demonstrated that these in vivo converted neurons displayed functional neuro-physiological properties (Extended Date Fig. 14f–i). Most importantly, PTB-ASO, but not control GFP-ASO, significantly rescued the 6-OHDA lesion-induced phenotype 3 months post injection based on both apomorphine-induced rotation and ipsilateral touch bias tests (Fig. 7e–g).
In summary, we report a single-step strategy to convert brain astrocytes into functional neurons. Our approach takes advantage of the genetic underpinnings of a neuronal differentiation program that is present, but latent in astrocytes. Taking advantage of the regional specificity in neuronal reprogramming, we efficiently converted midbrain astrocytes into functional DA neurons that integrate into the nigrostriatal dopamine pathway. Applying this approach to a chemically induced PD model, we demonstrated partial replenishment of lost DA neurons and the restoration of striatal dopamine, leading to significant reversal of motor deficits. Significantly, our ASO-based experiments illustrate a potentially clinically feasible approach for treatment of PD patients. Eventual application of our approach to humans will need to surmount many hurdles, including age-related restrictions to reprogramming, understanding any potential adverse effects caused by local astrocyte depletion (although we only converted only a small fraction of injury-induced astrocytes), specifically targeting regions that harbor vulnerable neurons, and detecting potential side-effects due to mis-targeted neurons. Importantly, each of these objectives can now be experimentally addressed to develop this promising therapeutic strategy, one that may be applicable to not only PD, but also other different neurodegenerative disorders.
METHODS
Vectors and virus production
To build the lentiviral vector to express shPTB in mouse astrocytes, the target sequence 5’-GGGTGAAGATCCTGTTCAATA-3’ was shuttled into the pLKO.1-Hygromycin vector (Addgene, #24150). To express shPTB in human astrocytes, the target sequence 5’-GCGTGAAGATCCTGTTCAATA-3’ was used. Viral particles were packaged in Lenti-X 293T cells (Takara bio) co-transfected with the two package plasmids: pCMV-VSV-G (Addgene, #8454) and pCMV-dR8.2 dvpr (Addgene, #8455). Viral particles were concentrated by ultracentrifugation in a Beckman XL-90 centrifuge with SW-28 rotor at 20,000 rpm for 120 minutes at 4°C.
To construct AAV vectors, the same target sequence against mouse PTB was first inserted into the pTRIPZ-RFP vector (Dharmacon) between the EcoR I and Xho I sites. The segment containing RFP and shPTB was next subcloned to replace CaMP3.0 in the Asc I-digested AAV-CMV-LOX-STOP-LOX-mG-CaMP3.0 vector (Addgene, #50022). The empty vector contains only RFP subcloned into the same vector. To construct a control vector expressing non-target shRNA, the shPTB was replaced with 5’-CAACAAGATGAAGAGCACCAA-3’ to target GFP. The resulting vectors are referred to as AAV-shPTB, AAV-Empty or AAV-shGFP. The AAV-hM4Di-shPTB vector was constructed by replacing RFP in AAV-shPTB with the cDNA of hM4Di, which was subcloned from pAAV-CBA-DIO-hM4Di-mCherry vector (Addgene, #81008). To express RFP and shPTB under the GFAP promoter, a segment containing floxed/off RFP and shPTB was used to replace EGFP in the AAV-GFAP-EGFP vector (Addgene, #50473) between the Sal I and Hind III sites.
Viral particles of AAV2 were packaged in co-transfected HEK293T cells with the other two plasmids: pAAV-RC and pAAV-Helper (Agilent Genomics). After harvest, viral particles were purified with a heparin column (GE HEALTHCARE BIOSCIENCES) and then concentrated with an Ultra-4 centrifugal filter unit (Amicon, 100,000 molecular weight cutoff). Titers of viral particles were determined by qPCR to achieve >1×10¹² particles/ml.
Synthesis of antisense oligonucleotides
Antisense oligonucleotides (ASOs) were synthesized at Integrated DNA Technologies (IDT). The sequence of the target region in mouse PTB for ASO synthesis is 5’-GGGTGAAGATCCTGTTCAATA-3’, and the target sequence in Turbo GFP is 5’- CAACAAGATGAAGAGCACCAA-3’. The backbones of all ASOs contain phosphorothioate modifications. Fluorescein (FAM) was attached to the 3’ end of those ASOs for fluorescence detection.
Western blot and RT-qPCR
For Western blotting, cells were lysed in 1xSDS loading buffer, and after quantification, bromophenol blue was added to a final concentration of 0.1%. 25~30ug of total protein was resolved in 10% Nupage Bis-Tris gel and probed with primary antibodies listed in the Supplementary Table 3.
For RT-qPCR, total RNA was extracted with Trizol (Life Technology) and 10ug/ml of glycogen was used to enhance precipitation of small RNAs. Total RNA was first treated with DNase I (Promega) followed by reverse transcription with the miScript II RT Kit (QIAGEN, 218160, for microRNA analysis) or the SuperScript™ III First-Strand Synthesis System (ThermoFisher, 18080051, for mRNA analysis). RT-qPCR was performed using the miScript SYBR Green PCR Kit (QIAGEN, 218073 for microRNA) or the Luna Universal qPCR Master Mix (NEB, M3003L, for mRNA) on a step-one plus PCR machine (Applied Biosystems). The primers used are listed in Supplementary Table 4.
Cell culture and trans-differentiation in vitro
Mouse astrocytes were isolated from postnatal (P4~P5) pups. Cortical or midbrain tissue was dissected from whole brain and incubated with Trypsin before plating onto dishes coated with Poly-D-lysine (Sigma). Isolated astrocytes were cultured in DMEM (GIBCO) plus 10% fetal bovine serum (FBS) and penicillin/streptomycin (GIBCO). Dishes were carefully shaken daily to eliminate non-astrocytic cells. After reaching ~90% confluency, astrocytes were disassociated with Accutase (Innovative Cell Technologies) followed by centrifugation for 3 min at 800 rpm, and then cultured in astrocyte growth medium containing DMEM/F12 (GIBCO), 10% FBS (GIBCO), penicillin/streptomycin (GIBCO), B27 (GIBCO), 10 ng/ml epidermal growth factor (EGF, PeproTech), and 10 ng/ml fibroblast growth factor 2 (FGF2, PeproTech).
To induce trans-differentiation in vitro, mouse astrocytes were re-suspended with astrocyte culture medium containing the lentivirus that targets mouse PTB, and then plated on Matrigel Matrix (Corning)–coated coverslips (12 mm). After 24 hrs, cells were selected with hygromycin B (100ug/ml, Invitrogen) in fresh astrocyte culture medium for 72 hrs. The medium was next switched to the N3/basal medium (1:1 mix of DMEM/F12 and Neurobasal, 25 μg/ml insulin, 50 μg/ml transferring, 30 nM sodium selenite, 20 nM progesterone, 100 nM putrescine,) supplemented with 0.4% B27, 2% FBS, a cocktail of 3 small molecules (1 μM ChIR99021, 10 μM SB431542 and 1mM Db-cAMP), and neurotrophic factors (BDNF, GDNF, NT3 and CNTF, all in 10ng/ml). The medium was half-changed every the other day. To measure synaptic currents, converted cells after 5~6 weeks were added with fresh GFP-labeled rat astrocytes, and after further 2 to 3 weeks of co-culture, patch-clamp recordings were performed. To test the effect of PTB-ASO in vitro, mouse astrocytes were cultured in 6-well plates with astrocyte growth medium. When cells reached 70%~80% confluency, ASO-PTB or ASO-GFP (75pmol per well) were transfected with Lipofectamine RNAimax (ThermoFisher Scientific). 48 hrs post ASO treatment, cells were either harvested for immunoblotting or switched to the N3/basal medium for further differentiation.
Human astrocytes were purchased from a commercial source (Cell Applications), taken from cerebral cortex at the gestational age of 19 weeks. Cells were grown in astrocyte medium (Cell Applications) and sub-cultured until reaching ~80% confluency. For trans-differentiation in vitro, cultured human astrocytes were first disassociated with Trypsin; re-suspended in astrocyte medium containing the lentivirus that targets human PTB; and plated on Matrigel Matrix–coated coverslips. After 24 hrs, cells were selected with hygromycin B (100ug/ml, Invitrogen) for 72 hrs. The medium was switched to the N3/basal medium supplemented with 0.4% B27, 2% FBS and neurotrophic factors (BDNF, GDNF, NT3 and CNTF, all in 10ng/ml). To measure synaptic currents, converted cells after 3 weeks were added with fresh GFP-labeled rat astrocytes, and after further 2 to 3 weeks of co-culture, patch-clamp recordings were performed.
Other cell lines used were checked for morphology by microscopy and immunostaining with specific markers. HEK293T cells were from a common laboratory stock. Lenti-X 293T cells were purchased from Takara Bio (#632180). Mouse Embryonic Fibroblasts (MEF) were isolated from E14.5 C57BL/6 mouse embryos. Mouse neurons were isolated from E17~18 C57BL/6 mouse embryos. Human dermal fibroblasts (HDF) were purchased from ATCC (PCS-201–012). Human neurons were trans-differentiated from human neuronal progenitor cells, which is a gift from Dr.Alysson Muotri’s lab. All cell lines tested negative for mycoplasma contamination by Hoechst staining of the cells.
RNA-seq and data analysis
Total RNA was extracted from cultured cells with the Direct-zol RNA MiniPrep kit (Zymo Research). RNA-seq was performed as previously described31. In brief, 2ug of total RNA was first converted to cDNA by the superscript III first strand synthesis kit with primer Biotin-B-T. The cDNA was purified on a PCR Clean-Up Kit (Clontech) column to remove free primer and enzyme. Terminal transferase (NEB) was applied to block the 3’ end of cDNA. Streptavidin-coaged magnetic beads (Life Technology) were used to isolate cDNAs. After RNA degradation by sodium hydroxide, the second-strand was synthesized by random priming and then eluted from beads by heat denaturing. The cDNA was then used as template to construct RNA-seq libraries. Sequencing was run on the Hiseq 4000 system. Low-quality reads were filtered and adaptors trimmed by using the software cutadapt with parameters “-a A{10} -m 22” (ref32). Cleaned reads were mapped to the pre-indexed mm10 transcriptome using the software salmon with parameters: “quant -l A --validateMappings --seqBias” (ref33). Raw counts of each library were applied to the R package DEseq2 for analysis of differential gene expression (DEG) with FDR < 0.05 and hierarchical clustering was performed, as described34. The raw data from RNA-seq experiments have been deposited into NCBI under the accession number GSE142250.
Immunocytochemistry
Cultured cells grown on glass slides were fixed with 4% paraformaldehyde (PFA, Affymetrix) for 15 min at room temperature followed by permeabilization with 0.1% Triton X-100 in PBS for 15 min on ice. After washing twice with PBS, cells were blocked in PBS containing 3% BSA for 1 hr at room temperature. Fixed cells were incubated with primary antibodies (listed in Supplementary Table 3) overnight at 4°C in PBS containing 3% BSA. After washing twice with PBS, cells were incubated with secondary antibodies conjugated to Alexa Fluor 488, Alexa 546, Alexa 594 or Alexa 647 (1:500, Molecular Probes) for 1 hr. 300 nM DAPI in PBS was applied to cells for 20 min at room temperature to label nuclei. After washing three times with PBS, the Fluoromount-G mounting medium was applied onto the glass slides, and images were examined and recorded under Olympus FluoView FV1000. Counting of cell numbers and percentages were all based on multiple biological replicates, as detailed indicated in specific figure legends.
For staining brain sections, mice were sacrificed with CO2 and immediately perfused, first with 15~20mL saline (0.9% NaCl) and then with 15 mL 4% PFA in PBS to fix tissues. Whole brains were extracted and fixed in 4% PFA overnight at 4°C, and then cut into 14~18μm sections on a cryostat (Leica). Before staining, brain sections were incubated with sodium citrate buffer (10 mM Sodium citrate, 0.05% Tween 20, pH 6.0) for 15 min at 95°C for antigen retrieval. The slides were next treated with 5% normal donkey serum and 0.3% Triton X-100 in PBS for 1 hr at room temperature. The rest of steps were performed as with cultured cells on coverslips.
Quantification of neuronal cell body and fiber density
Coronal sections across midbrain were sampled at intervals of 120~140 μm for immunostaining of TH and RFP. The total number (Nt) of cell types of interest was calculated by the stereological method correcting with the Abercrombie formula35. The formula used is Nt = Ns*(St/Ss)*M/(M+D), where Ns is the number of neurons counted, St is the total number of sections in the brain region, Ss is the number of sections sampled, M is the thickness of section, and D is the average diameter of counted cells, as previously described36,37.
RFP-positive and RFP/TH-double positive fibers were quantified using a previously published sphere method38. For analyzing striatal fibers, three coronal sections (A/P +1.3, +1.0 and +0.70) were selected from each brain36. For analyzing fibers in the nigrostriatal bundle (NSB), the coronal section closed to position Bregma −1.6 mm was selected. For each selected section, three randomly chosen areas were captured from one section of z-stack images at intervals of 2 μm using a 60x oil-immersion objective. A sphere (diameter: 14 μm) was then generated as a probe to measure fiber density within the whole z-stack. Each fiber crossing the surface of sphere was given one score. All images were analyzed by Image-J 1.47v (Wayne Rasband, Bethesda, MD)39,40.
Electrophysiological recording
Patch clamp recordings were performed with Axopatch-1D amplifiers or Axopatch 200B amplifier (Axon Instruments) connecting to a Digidata1440A interface (Axon Instruments). Data were acquired with pClamp 10.0 or Igor 4.04 software and analyzed with MatLab v2009b. For neurons in vitro converted from mouse astrocytes, small molecules were removed from medium 1 week before patch clamp recording. Both cultured mouse and human cells were first incubated with oxygenated (95% O2 and 5% CO2) artificial cerebrospinal fluid (150 mM NaCl, 5 mM KCl, 1 mM CaCl2, 2 mM MgCl2, 10 mM glucose, 10 mM HEPES, pH 7.4) at 37°C for 30 min and whole-cell patch clamp was performed on selected cells.
For recording activities of in vivo converted neurons, cortical slices (300 μm) were prepared 6 or 12weeks after injection of AAV. Brain slices were prepared with a vibratome in oxygenized (95% O2 and 5% CO2) dissection buffer (110.0 mM choline chloride, 25.0 mM NaHCO3, 1.25 mM NaH2PO4, 2.5 mM KCl, 0.5 mM CaCl2, 7.0 mM MgCl2, 25.0 mM glucose, 11.6 mM ascorbic acid, 3.1 mM pyruvic acid) at 4°C followed by incubation in oxygenated ACSF (124 mM NaCl, 3 mM KCl, 1.2 mM NaH2PO4, 26 mM NaHCO3, 2.4 mM CaCl2, 1.3 mM MgSO4, 10 mM dextrose and 5 mM HEPES; pH 7.4) at room temperature for 1 hr before experiments.
Patch pipettes (5 – 8 MΩ) solution contained 150 mM KCl, 5 mM NaCl, 1 mM MgCl2, 2 mM ethylene glycol tetra acetic acid (EGTA)-Na, and 10 mM Hepes pH 7.2. For voltage-clamp experiments, the membrane potential was typically held at −75 mV. The following concentrations of channel blockers were used: PiTX: 50uM; NBQX: 20uM; APV: 50uM. All of these blockers were bath-applied following dilution into the external solution from concentrated stock solutions. All experiments were performed at room temperature.
Transgenic mice
The GFAP-Cre transgenic mouse (B6.Cg-Tg(Gfap-cre)77.6Mvs/2J) was used in AAV-shPTB induced in vivo reprogramming experiments. The SLC6a3-Cre transgenic mouse (B6.SJL-Slc6a3tm1.1(cre)Bkmn/J) was used for chemogenetic experiments. For testing the effect of ASOs in vivo, the GFAP-CreER™ mouse (B6.Cg-Tg(GFAP-cre/ERT2)505Fmv/J) was crossed with the Rosa-tdTomato mouse (B6.Cg-Gt(ROSA)26Sortm14(CAG-tdTomato)Hze/J). Offsprings of these double GFAP-CreER™;Rosa-tdTomato transgenic mice at age of postnatal 30–40 days were injected with tamoxifen (dissolved in corn oil at a concentration of 20 mg/ml) via intraperitoneal injection once every 24 hrs for a total of 5 consecutive days. The dose of each injection was 75 mg/kg. Two weeks after tamoxifen administration, PTB-ASO or control ASO was injected into substantia nigra of those mice to investigate ASO-induced in vivo reprogramming.
All transgenic mice were purchased from The Jackson Laboratory. All procedures were conducted in accordance with the guide of The University of California San Diego Institutional Animal Care and Use Committee (Protocol# S99116). Both male and female mice were used and randomly grouped in this study. No pre-tests were performed to determine sample sizes. Most studies used mice at age of postnatal day 30–40. As indicated in Fig. 6d,e, mice at postnatal age of 1 year were also tested for AAV-shPTB mediated reprogramming and behavioral tests.
Ipsilateral lesion with 6-OHDA and stereotaxic injections
Adult WT and GFAP-Cre mice at age of postnatal day 30–40 were used to perform surgery to induce lesion. Animals were anaesthetized with a mix of ketamine (80–100 mg/kg) and xylazine (8–10 mg/kg) and then placed in a stereotaxic mouse frame. Before injecting 6-hydroxydopamine (6-OHDA, Sigma), mice were treated with a mix of desipramine (25 mg/kg) and pargyline (5 mg/kg). 6-OHDA (3.6 μg per mouse) was dissolved in 0.02% ice-cold ascorbate/saline solution at a concentration of 15 mg/ml and used within 3 hrs. The toxic solution was injected into the medial forebrain bundle (MFB) at the following coordinates (relative to bregma): anterior–posterior (A/P) = −1.2mm; medio-lateral (M/L) = 1.3mm and dorso-ventral (D/V) = 4.75mm (from the dura). Injection was applied in a 5 μl Hamilton syringe with a 33G needle at the speed of 0.1 μl/min. The needle was slowly removed 3 min after injection. Cleaning and suturing of the wound were performed after lesion.
AAVs or ASOs were injected into substantia nigra ~30 days after 6-OHDA induced lesion. 4 μl of AAV or 2 μl of ASO (1 ug/ul) was injected into lesioned nigra at the following coordinates A/P = −3.0 mm; M/L = 1.2 mm; and D/V = 4.5 mm. Injections were made using the same syringe and needle, at a rate of 0.5 μl/min. The needle was slowly removed 3 min after injection. For injecting AAV in striatum and visual cortex, the following coordinates were employed: A/P= +1.2 mm; M/L= 2.0 mm; D/V= 3.0 mm (for striatum), and A/P= −4.5 mm; M/L= 2.7 mm; D/V= 0.35 mm (visual cortex).
Retrograde tracing
For retrograde tracing of the nigrostriatal pathway, GFAP-Cre mice with or without 6-OHDA induced lesion were first injected with AAV-shPTB. 1 or 3 months after AAV delivery, green Retrobeads IX (Lumafluor, Naples, FL) were unilaterally injected at two sites into the striatum on the same side of AAV injection, using following two coordinates: A/P = + 0.5mm, M/L = 2.0 mm; D/V= 3.0 mm; and A/P= +1.2 mm; M/L= 2.0 mm; D/V= 3.0 mm. ~2 μl of beads were injected. After 24 hrs, animals were sacrificed and immediately perfused. Their brains were fixed with 4% PFA for sectioning and immunostaining.
Measurement of striatal dopamine
Dopamine levels in mouse striatum were measured by Reverse-phase High-performance Liquid Chromatography (HPLC). The HPLC analysis was performed on an Agilent 1260 Infinity HPLC system with an Agilent Zorbax SB-C18 semi-prep column (ID 9.4 × 250 mm, 5 μm, 80Å) using a water/methanol gradient containing 0.1% formic acid. Each substance was characterized by retention time and 260 nm absorbance under Variable Wavelength Detector (VWD), as previously described41,42. Striatal samples were directly prepared from brain tissue. Briefly, striatal dissection was carried out immediately after euthanization. After homogenized in 200 μl of 0.1 M hydrochloric acid with a squisher, the sample was centrifuged (12,000g, 10 min, 4°C). The resulting supernatant was filtered by a 0.2 μm Nanosep MF centrifugal device and then applied to HPLC analysis42,43. Investigators were masked to group identity for measurements of striatal dopamine.
Amperometric dopamine recording
The amperometric recording of dopamine release in vivo was conducted, as described previously44,45. Anesthetized mice were fixed on a stereotaxic instrument (Narishige, Japan). Body temperature was monitored and maintained at 37°C using a heating pad (KEL-2000, Nanjing, China). A bipolar stimulating electrode was implanted in medial forebrain bundle (MFB: 2.1 mm AP, 1.1 mm ML, 4.0 – 5.0 mm DV). The recording carbon fiber electrode (CFE) (7 μm diameter, 400 μm long) was implanted in the caudate–putamen of dorsal striatum (CPu: 1.1 mm AP, 1.7 mm ML, 3.4 mm DV). An Ag/AgCl reference electrode was placed in the contralateral cortex. Electric stimulation was generated using an isolator (A395, WPI, USA) as a train of biphasic square-wave pulses (0.6 mA, 1 ms duration, 36 pulses, 80 Hz). The CFE was maintained at 780 mV to oxidize the substance. The amperometric signal was amplified by a patch-clamp amplifier (PC2C, INBIO, Wuhan, China), low pass-filtered at 50 Hz and recorded by MBA-1 DA/AD unit v4.07 (INBIO, Wuhan, China). Investigators were masked to group identity for measurements of dopamine release.
Amperometric recordings of dopamine release on dorsal striatum slices were conducted, as described previously46,47. Anesthetized mice were transcardially perfused with ~20 ml ice-cold artificial cerebrospinal fluid (“sectioning aCSF”) containing 110 mM C5H14NClO, 2.5 mM KCl, 0.5 mM CaCl2, 7 mM MgCl2, 1.3 mM NaH2PO4, 25 mM NaCO3, 25 glucose (saturated with 95% O2 and 5% CO2). The brain was rapidly removed and cut into 300-μm horizontal slices on a vibratome (Leica VT 1000s; Nussloch, Germany) containing ice-cold sectioning solution. Slices containing striatum were allowed to recover for 30 min in “recording aCSF”: 125 mM NaCl, 2.5 mM KCl, 2 mM CaCl2, 1.3 mM MgCl2, 1.3 mM NaH2PO4, 25 mM NaCO3, 10 mM glucose (saturated with 95% O2 and 5% CO2) at 37°C, and then kept at room temperature for recording. CFEs (7 μm diameter, 200 μm long) holding at 780 mV were used to measure dopamine release in striatum. The exposed CFE tip was completely inserted into the subsurface of the striatal slice at an angle of ~30°. Single electrical field stimulation (E-stim) pulses (0.2 ms, 0.6 mA) were delivered through a bipolar platinum electrode (150 μm in diameter) and generated by a Grass S88K stimulator (Astro-Med). The amperometric current (Iamp) was low-pass filtered at 100 Hz and digitized at 3.13 kHz. Off-line analysis was performed using Igor software (WaveMetrix). Amperometric recording in cultured cells was conducted as previously described48. Reprogrammed neurons were pre-treated with 100 μM L-DOPA for 30 min for signal enhancement. During recording, CFEs (WPI, CF30–50) were held at +750 mV to measure dopamine release. For baseline recording, cells were kept in normal aCSF (150 mM NaCl, 5 mM KCl, 1 mM CaCl2, 2 mM MgCl2, 10 mM glucose, 10 mM HEPES, pH 7.4). The solution was then switched to a high potassium aCSF (130 mM NaCl, 25 mM KCl, 1 mM CaCl2, 2 mM MgCl2, 10 mM glucose, 10 mM HEPES, pH 7.4) to induce the release of dopamine. No spike-like events were detected when the electrode was held to −750 mV under the same conditions48.
Behavioral testing
All behavioral tests were carried out 21–28 days after 6-OHDA induced lesion or 2, 3, and 5 months after the delivery of AAVs or ASOs. For rotation test, apomorphine-induced rotations in mice were recorded after intraperitoneal injection of apomorphine (Sigma, 0.5 mg/kg) under a live video system. Mice were injected with apomorphine (0.5 mg/kg) on two separate days prior to performing the rotation test (for example, if the test was to be performed on Friday, the mouse would be first injected on Monday and Wednesday), which aimed to prevent a ‘wind-up’ effect that could obscure the final results. Rotation was measured 5 min following the injection for 10 min, as previously described49,50 and only full-body turns were counted. Rotations induced by D-amphetamine (Sigma, 5 mg/kg) were determined in the same system51,52. Data were expressed as net contralateral or ipsilateral turns per min.
To perform the cylinder test, mice were individually placed into a glass cylinder (diameter 19 cm, height 25 cm), with mirrors placed behind for a full view of all touches, as described49,53. Mice were recorded under a live video system and no habituation of the mice to the cylinder was performed before recording. A frame-by-frame video player (KMPlayer version 4.0.7.1) was used for scoring. Only wall touches independently with the ipsilateral or the contralateral forelimb were counted. Simultaneous wall touches (touched executed with both paws at the same time) were not included in the analysis. Data are expressed as a percentage of ipsilateral touches in total touches.
For chemogenetic experimenst, cylinder tests were carried out 21–28 days after 6-OHDA induced lesion and 2 months after the delivery of AAV-hM4Di-shPTB. In the later test, each animal was firstly injected with saline to record the baseline of recovery. Subsequent recording was performed 40 min after intraperitoneal injection of CNO (Biomol International, 4 mg/kg) or 72 hrs after metabolism of the drug54.
Data analysis, statistics, and availability
The numbers (n) of biological replicates or mice were indicated in individual figure legends. Experimental variations in each graph were represented as mean+/−SEM. All measurements were performed on independent samples. Independent t-test, one-way ANOVA and repeat measurement ANOVA were employed for statistical analysis, as indicated in individual figure legends. For multiple comparisons, combining ANOVA, post-hoc Tukey test was applied. Assumptions of normal data distribution and homoscedasticity were adopted in t-test and one-way ANOVA. All statistical tests were two-sided. For Fig. 1b and Extended Data Fig. 1d, the original data were transformed to logarithm with base 10 for one-way ANOVA to fulfill the requirement of homoscedasticity. To estimate the effect size, Cohen’s d for t-test and eta-squared (η2) for one-way ANOVA were calculated as previously described55,56. Statistical report for all figure panels is summarized in Supplementary Table 5.
All data generated or analyzed in this study are included in this published article (and its supplementary information files). Repeats of individual experiments are summarized in Supplementary Table 2, which has been independently verified.
The RNA seq data have been deposited in NCBI GEO under GSE142250. Independently generated data are available upon request. Methods have been converted into step-wise protocols and deposited in Nature Protocol Exchange.
Extended Data
Extended Data Fig. 1 |. Characterization and functional analysis of astrocytes from mice and humans.
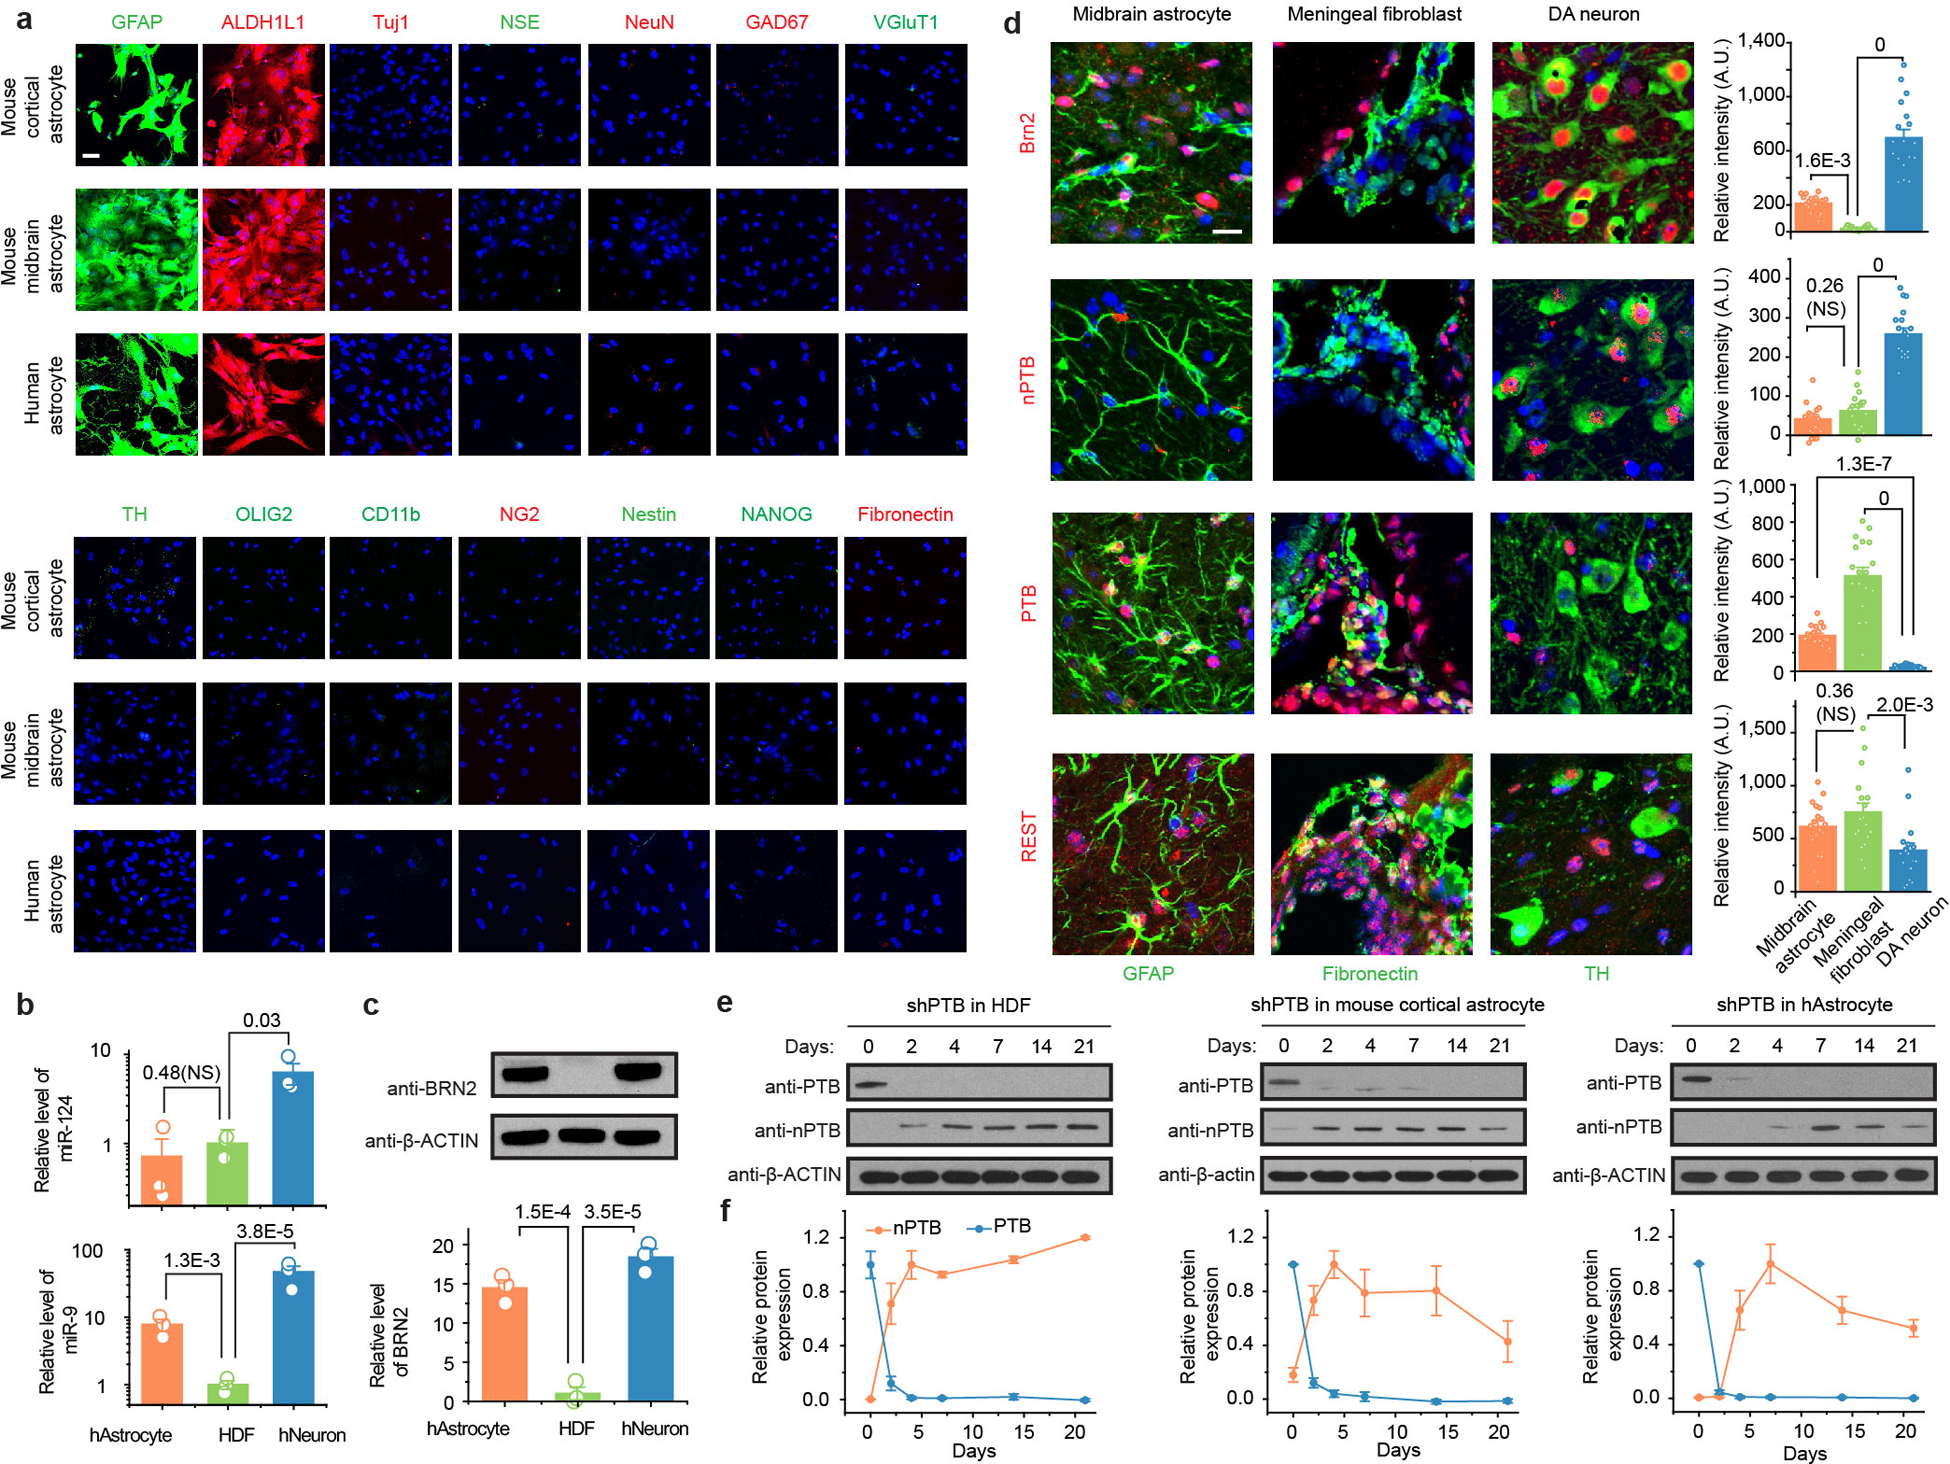
a, Relative purity of mouse and human astrocytes. Astrocytes isolated from mouse cortex and midbrain or obtained from human embryonic brain (Cell Applications) were probed with a panel of markers for neurons and common non-neuronal cell types in the central nervous system, including those for astrocytes: GFAP (green) and ALDH1L1 (red); for neurons: Tuj1, NSE, NeuN, GAD67, VGluT1, TH; for oligodendrocyte: OLIG2; for microglia marker: CD11b; for NG2 cells: NG2; for neural progenitors: Nestin; for pluripotenct stem cells: NANOG; and for fibroblasts: Fibronectin). Scale bar: 30 μm. These data demonstrated that isolated astrocytes are largely free of neurons and common non-neuronal cells. The experiment was independently repeated twice with similar results.
b,c, Levels of key components in the regulatory loops controlled by PTB and nPTB in mouse midbrain. Levels of miR-124 (b, upper) and miR-9 (b, bottom) were quantified by RT-qPCR in human astrocytes, human dermal fibroblasts (HDF), and human neurons differentiated from human neuronal progenitor cells. Data were normalized against U6 snRNA and the levels in HDF were set to 1 for comparative analysis. Levels of Brn2 were determined by Western blotting, normalized against β-actin (c). Results show that low miR-124, but high miR-9 and Brn2 in human astrocytes, suggesting inactive PTB-regulated loop and active components of the nPTB-regulated loop in human astrocytes. NS: not significant.
d, Levels of PTB, nPTB, and Brn2 in mouse midbrain. Cell types in mouse midbrain were marked by GFAP for astrocytes, TH for DA neurons, and Fibronectin for adjacent meningeal fibroblasts and double-stained for Brn2, PTB, nPTB, and REST. Scale bar: 20 μm. Relative immunofluorescence intensities in different cell types were quantified (right in each panel). n=3 mice with a total of 54 cells counted in each. Note that REST is reduced, but not eliminated, in endogenous DA neurons, which is in agreement with the documented requirement of REST for viability of mature neurons.
e,f, Dynamic nPTB expression in response to PTB knockdown. nPTB expression was monitored by Western blotting after PTB knockdown for different days in human dermal fibroblasts (HDF, e, left), mouse cortical astrocytes (mAstrocyte, e, middle) and human astrocytes (hAstrocytes, e, right). The data from 3 biological repeats were quantified (f). Results show that nPTB remains stably expressed in human dermal fibroblasts, but undergoes transient expression in astrocytes from both mice and humans.
Statistical results in (b), (c), (d), (f) are based on ANOVA with post-hoc Tukey test and represented as mean+/−SEM (n=3 biological repeats). Specific P-values are indicated. All except one pairwise comparison in panel b are considered statistically significant.
Extended Data Fig. 2 |. Global evidence for programmed switch of gene expression from astrocytes to neurons in response to PTB depletion.
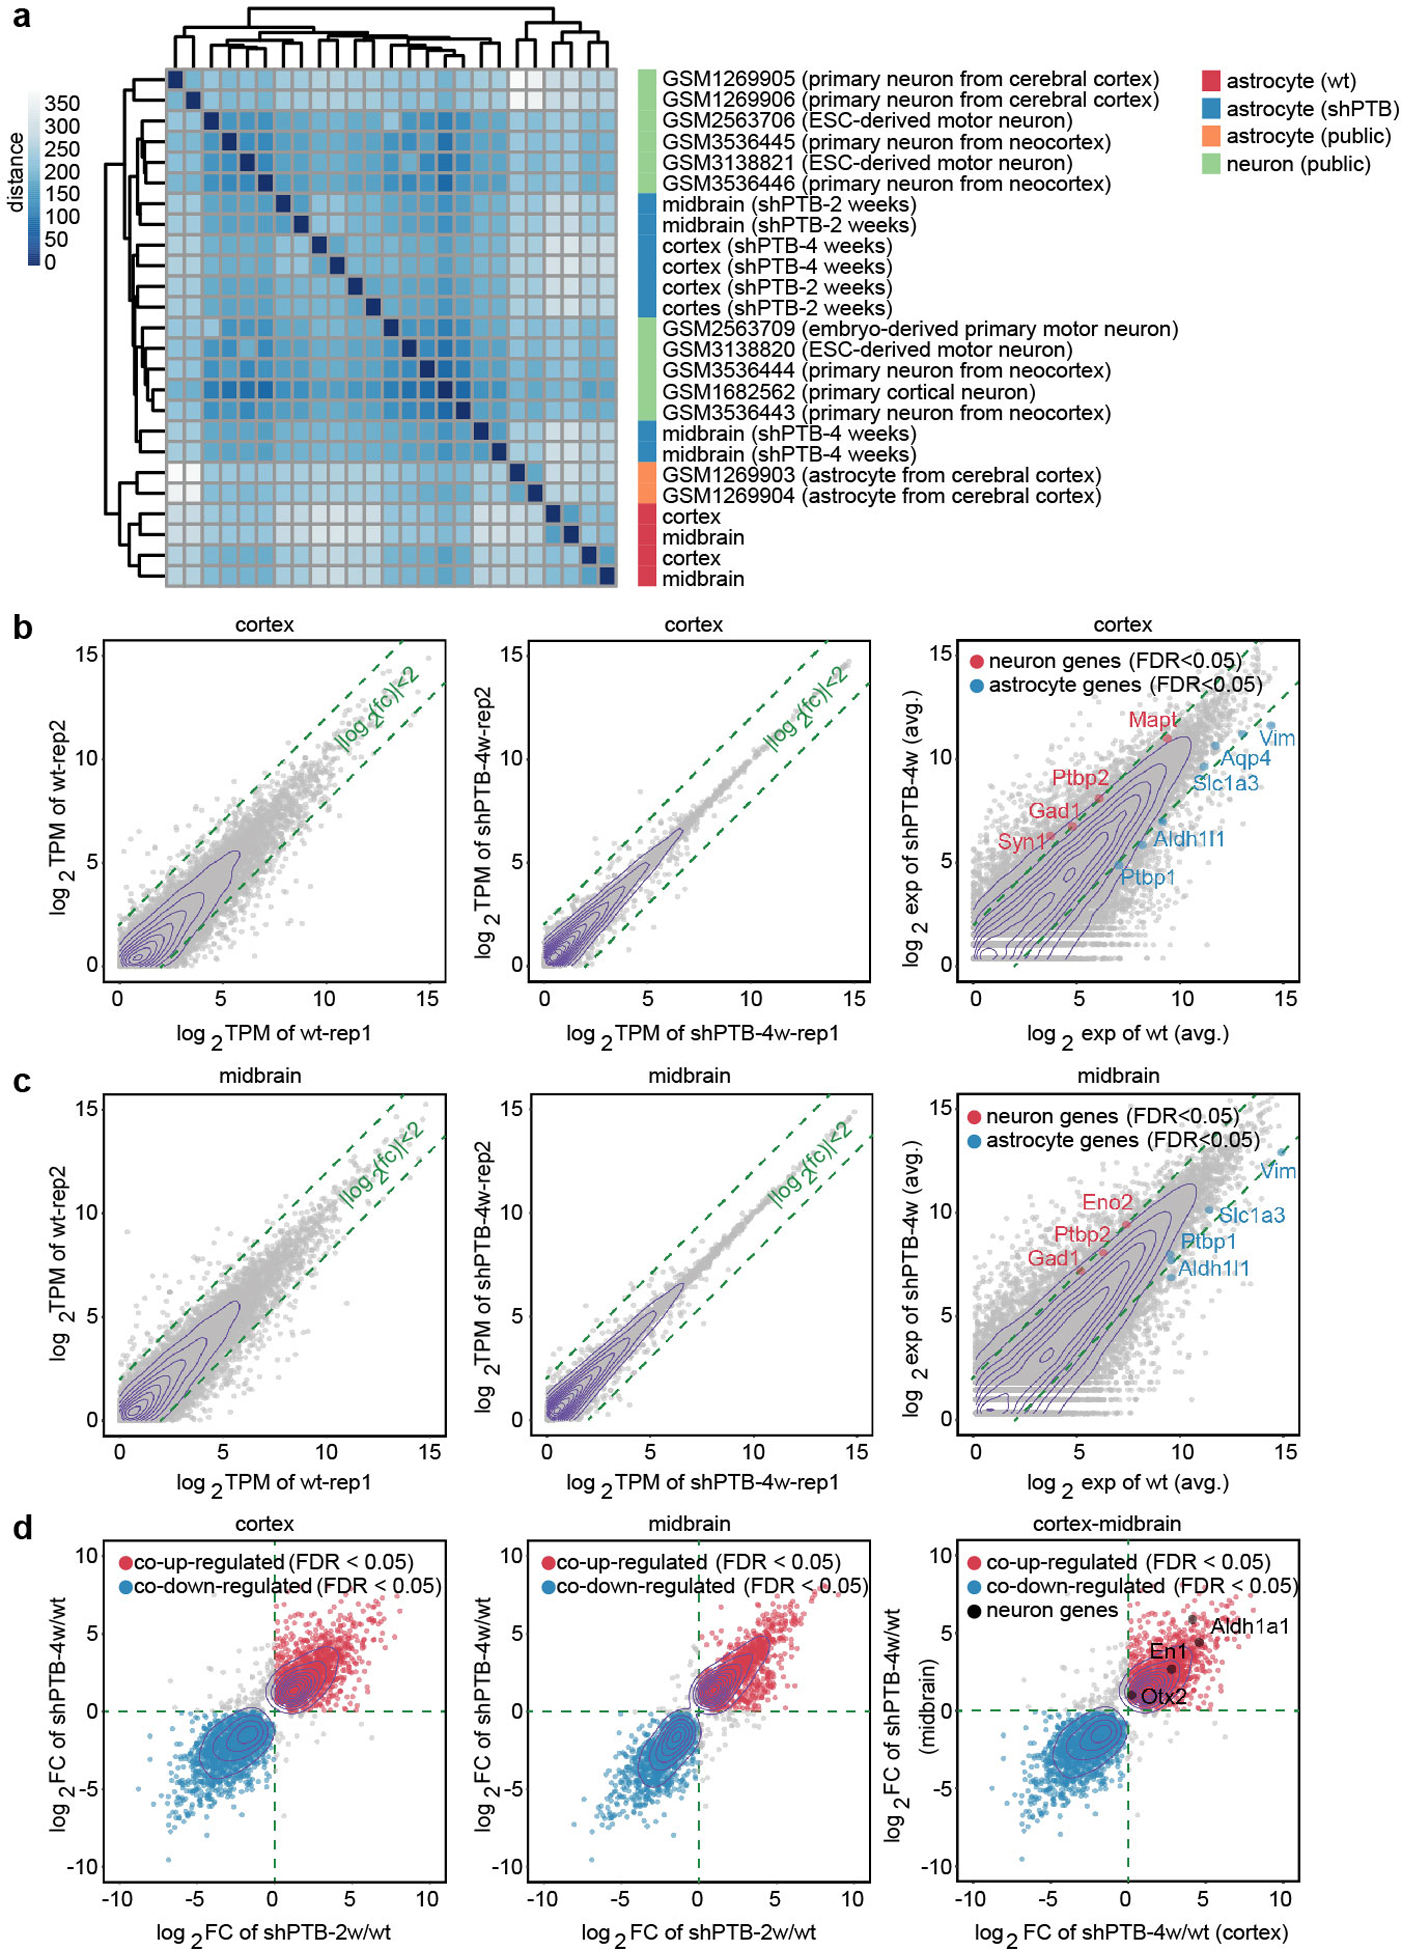
a, Clustering analysis. RNA-seq data (available under GSE142250) were generated on independent isolates of astrocytes from mouse cortex or midbrain before and after conversion to neurons by depleting PTB for 2 or 4 weeks. By clustering analysis, the global gene expression profiles were compared with the public datasets for astrocytes or neurons as indicated by the color key and the data sources on the right. The selection of these public data for comparison was based on astrocytes without further culture and on neurons directly isolated from mouse brain or differentiated from embryonic stem cells (ESCs).
b,c, Comparison of gene expression profiles between independent libraries prepared from mouse cortical (b) or midbrain (c) astrocytes before and after PTB depletion for 2 or 4 weeks. Selective astrocyte-specific (green) and neuron-specific (red) genes are highlighted. Results show a degree of heterogeneity between independent isolates of astrocytes, but interestingly, their converted neurons became more homogeneous.
d, Comparison between induced gene expression upon PTB depletion in cortical versus midbrain astrocytes. Several commonly induced DA neuron-specific genes (i.e. Otx2, En1, Aldh1a1) are highlighted when comparing between neurons derived from cortical versus midbrain astrocytes (right panel). Significantly induced DA neuron-associated genes are listed in Supplementary Table 1. Note that most genes are enriched, but not “uniquely expressed”, in DA neurons (thus, not specific markers for DA neurons), as evidenced from their induction to different degrees in shPTB-treated cortical astrocytes.
Extended Data Fig. 3 |. Characterization of converted neurons from mouse and human astrocytes.
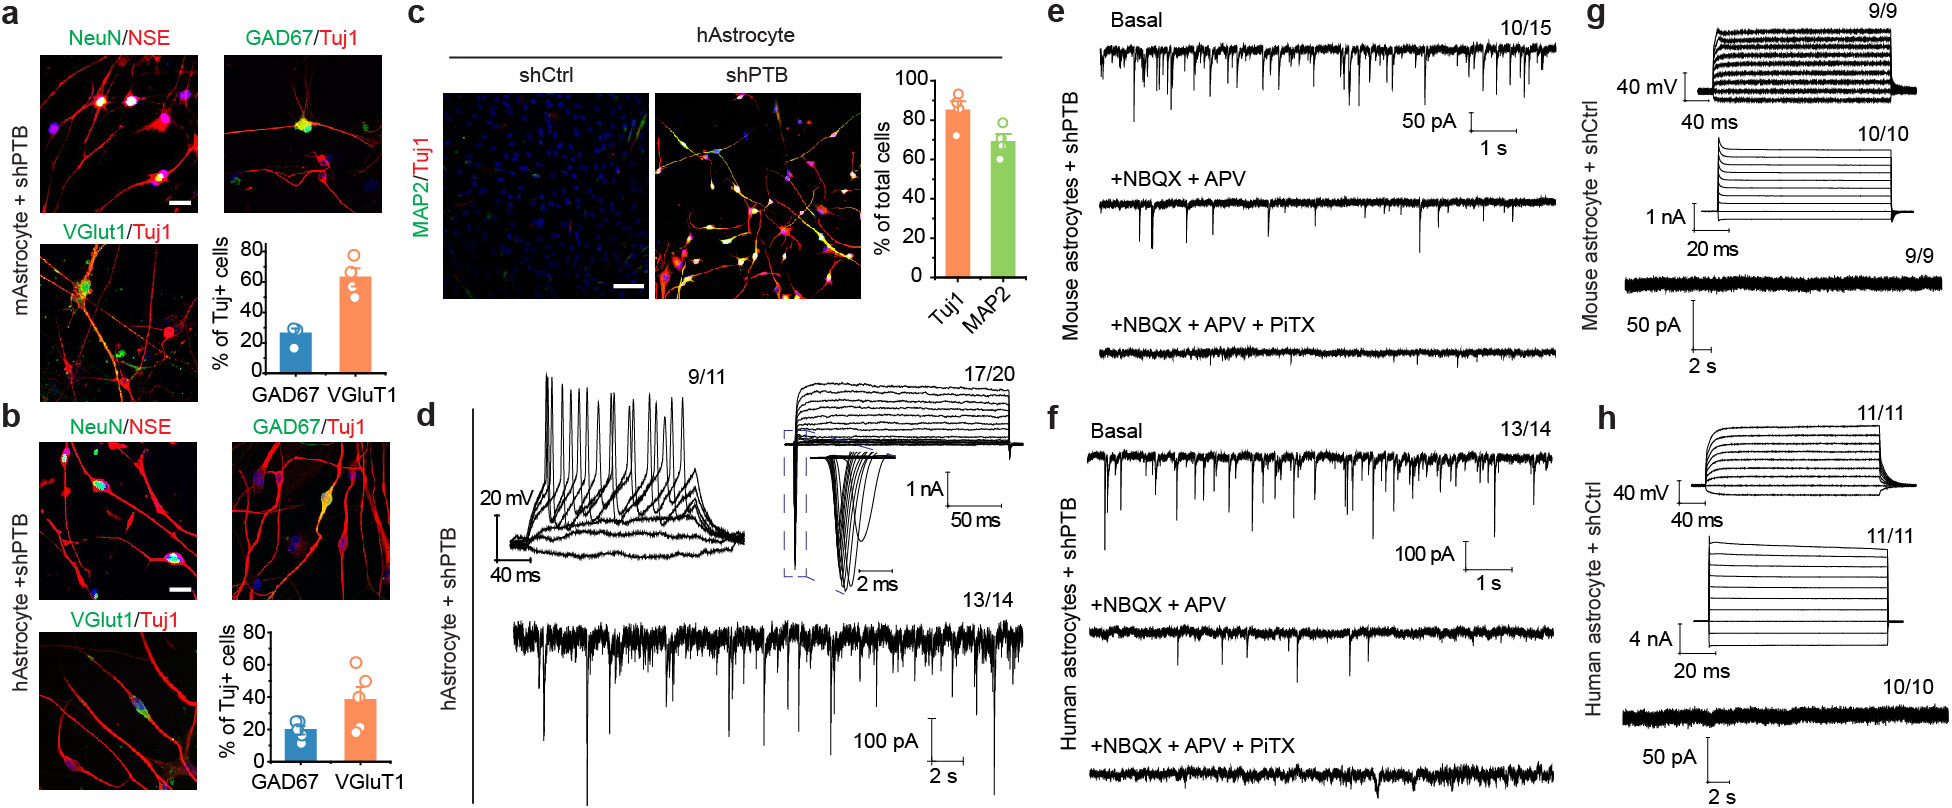
a,b, Conversion of mouse and human astrocytes to neurons. Cells were immunostained with the indicated markers after conversion from mouse cortical astrocytes (a) or human astrocytes (b). Converted glutamatergic (marked by VGlut1) and GABAergic (marked by GAD67) neurons constituted ~90% and ~80% of total Tuj1-marked neurons from mouse and human astrocytes, respectively. Data were based on 4 (a) or 5 (b) biological repeats and represented as mean+/−SEM. Scale bar: 30 μm (a) and 40 μm (b).
c,d, Efficient conversion from human astrocytes to neurons. Converted neurons were characterized by immunostaining with Tuj1 and MAP2 (c). Scale bar: 80 μm. n=4 biological repeats. These neurons are functional as indicated by repetitive action potentials (top left), large currents of voltage-dependent sodium and potassium channels (top right), and spontaneous post-synaptic currents after co-culture with rat astrocytes (bottom) (d). Indicated in each panel is the number of cells that showed the recorded activity versus the number of cells examined.
e,f,g,h, Electrophysiological characterization of neurons converted from mouse (e) and human (f) astrocytes, showing spontaneous excitatory and inhibitory postsynaptic currents that could be sequentially blocked with the inhibitors against the excitatory {2,3-dihydroxy-6-nitro-7-sulfamoyl benzo[f]quinoxaline-2,3-dione (NBQX) plus D(−)-2-amino-5-phosphonovaleric acid or APV} and inhibitory {Picrotoxin (PiTX)} receptors (e.f), indicative of their secretion of glutamine and GABA neurotransmitters. Control shRNA (shCtrl)-treated mouse (g) and human astrocytes (h) failed to show action potentials (top), currents of voltage-dependent channels (middle) or postsynaptic events (bottom). The number of cells that showed the recorded activity versus the total number of cells examined is indicated on top right of each panel.
Extended Data Fig. 4 |. Cre-dependent expression of RFP in injected mouse midbrain.
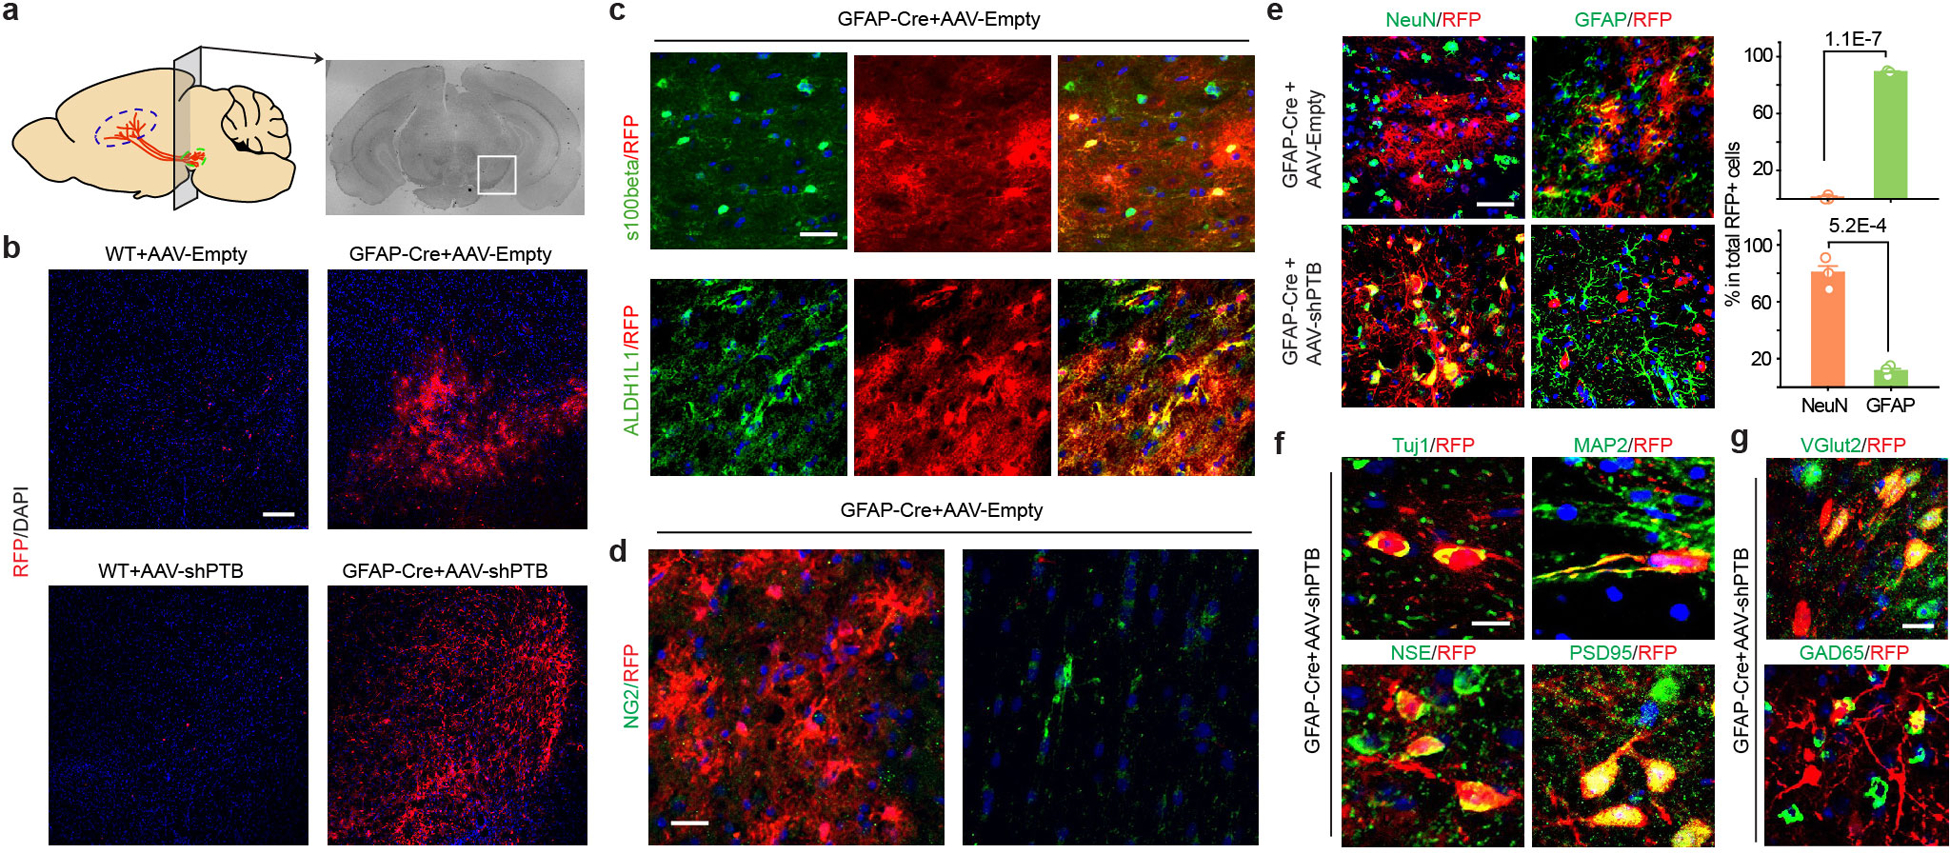
a, Schematic of the substantial nigral region (while box) for AAV injection and immunochemical analysis.
b, Cre-dependent RFP expression. RFP+ cells were not detected in midbrain of wild-type mouse injected with either AAV-Empty or AAV-shPTB (left). In comparison, both viruses generated abundant RFP signals in GFAP-Cre transgenic mice. Scale bar: 150 μm.
c,d, Co-staining of RFP+ cells with the astrocyte markers S100b and Aldh1L1 10 weeks after injecting AAV-Empty (c), indicating that most RFP+ cells in AAV-Empty-transduced midbrain were astrocytes. Scale bar: 25 μm. No RFP expression was detectable in NG2-labled cells (d). Scale bar: 15 μm. Experiments in (b) to (d) were independently repeated 3 times with similar results.
e, Reprogramming-dependent conversion from astrocytes to neurons. Immunostaining with the astrocyte marker GFAP and the pan-neuronal marker NeuN was performed 10 weeks after injection of AAV-Empty or AAV-shPTB in midbrain. Scale bar: 30 μm. Quantified results show that AAV-Empty transduced cells were all GFAP+ astrocytes whereas AAV-shPTB transduced cells were mostly NeuN+ neurons. Quantified data were based on 3 mice as shown on the right. P-values as indicated are based on two-sided Student t-test. Error bar: SEM.
f,g, Further characterization of AAV-shPTB induced neurons in midbrain with additional neuronal markers, including pan-neuronal specific markers Tuj1, MAP2, NSE, and PSD-95 (f, Scale bar: 10 μm) and specific markers for glutamatergic (VGlut2) and GABAergic (GAD65) neurons (g, Scale bar: 20 μm).
Extended Data Fig. 5 |. Progressive conversion of AAV-shPTB treated astrocytes to DA neurons within the dopamine domain.
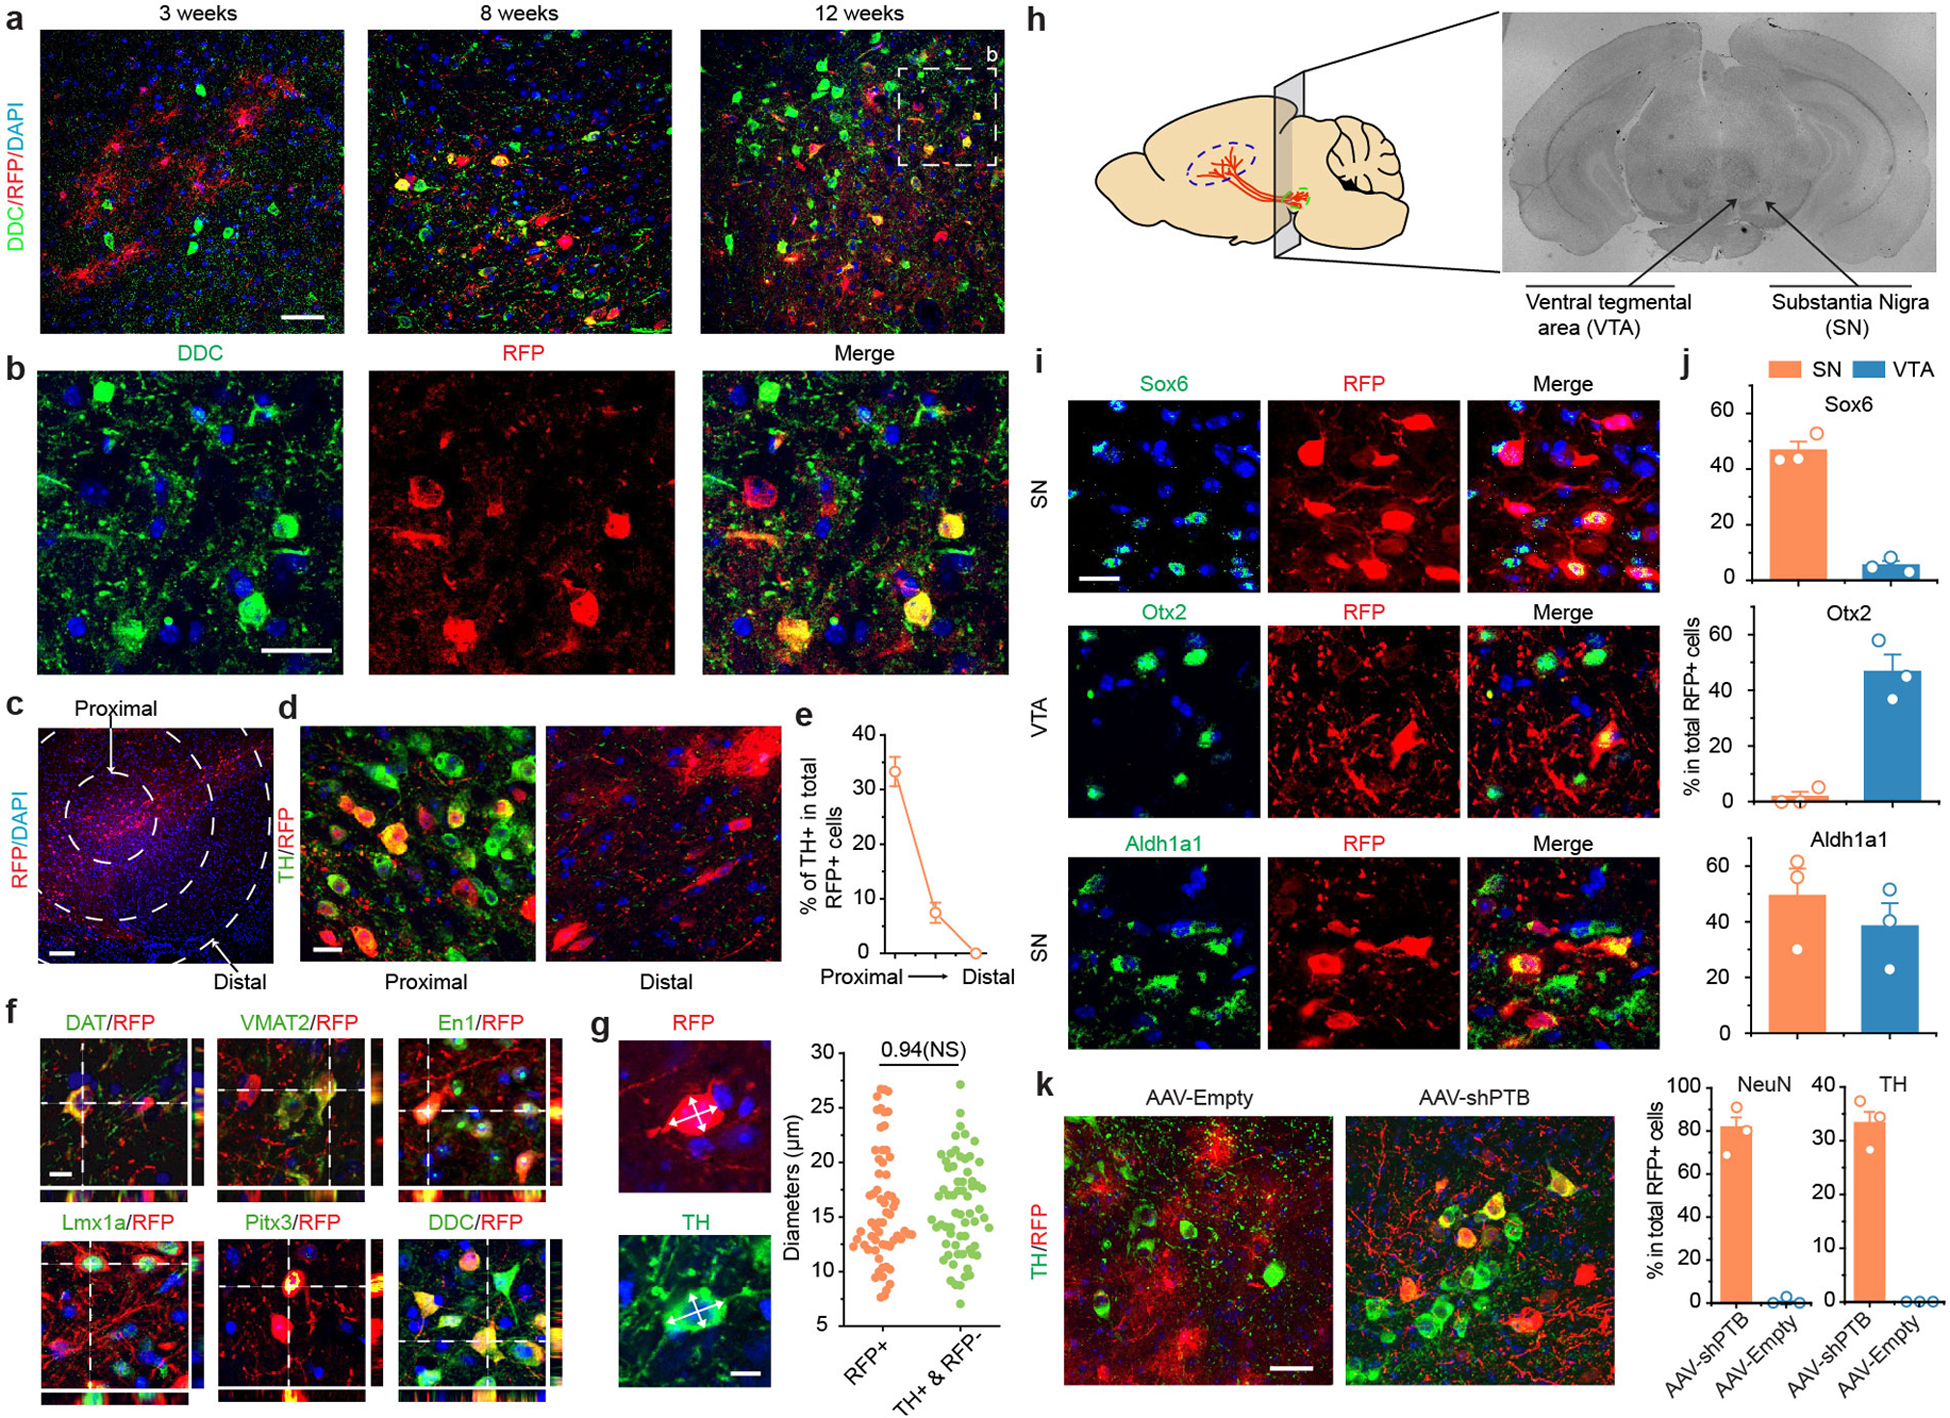
a,b, Time-dependent appearance of RFP+DDC+ DA neurons. AAV-shPTB transduced midbrain was characterized for time-dependent appearance of DA neurons with another dopaminergic neuron marker DDC (a, Scale bar: 50 μm). Little initial RFP+ cells were co-stained DDC 3 weeks after AAV-shPTB transduction, and the fraction of RFP+DDC+ cells progressively increased 8 and 12 weeks post AAV-shPTB injection. Images from substantia nigra 12 weeks post AAV-shPTB transduction were enlarged to highlight RFP+DDC+ neurons (b, Scale bar: 25 μm).
c,d,e, Conversion of midbrain astroyctes to DA neurons within the dopamine domain. AAV-shPTB induced neuronal reprogramming was determined relative to the site of injection. Shown is a low magnification view of substantial nigra (SN) dorsal to the globus pallidus and posterior to the dorsal striatum (c). Circles mark brain areas with progressive increased diameters from the center of the injection site. Scale bar: 100 μm. Enlarged views show the representative proximal and distal sites from the injection site 12 weeks after AAV-shPTB transduction, positively stained for TH (green) over RFP-labeled cells, (d). Scale bar: 10 μm. Note RFP+TH+ cells in proximal site, but only and RFP+TH- cells in distal site. The percentages of TH+ cells among total RFP+ cells in three different areas defined in (c) were quantified based on 3 mice with at least 100 cells counted in each (e). Error bar: SEM. These data show the generation of TH+ neurons within the dopamine domain of midbrain.
f,g, Further characterization of converted DA neurons with additional DA neuron-specific markers DAT, VMAT2, En1, Lmx1a, Pitx3 and DDC, all showing positive signals (f). RFP+TH+ cell bodies are highlighted by orthogonal views of z-stack images, attached on right and bottom of the main image (Scale bar: 10 μm). Cell body diameters were compared between newly converted RFP+TH+ neurons and endogenous RFP-TH+ DA neurons (g, left, Scale bar: 5 μm). The size distribution of both populations of neurons shown on the right suggests that converted TH+ cells have similar cell size to endogenous TH+RFP– DA neurons (g, right). Quantified data were based on 62 RFP+ cells and 64 RFP-TH+ cells from 3 mice. The indicated P-value is based on two-sided Student t-test. NS: not significant.
h, Schematic depiction for further analysis of converted neurons in substantial nigra (SN) and ventral tegmental area (VTA).
i,j, Representative immunostaining for Sox6, Otx2, and Aldh1a1, showing that Sox6-marked RFP+ cells were confined in SN whereas Otx2-marked RFP+ cells in VTA; the DA neuron marker Aldh1a1 was detected in both SN and VTA (i, Scale bar: 25 μm). Quantified data were based on 3 mice with at least 100 cells counted (j). Error bar: SEM. Results further support the generation of different subtypes of DA neurons.
k, Minimal leaked Cre expression in endogenous DA neurons in midbrain. As GFAP-Cre is known to have a degree of leaked expression in neurons, raising a concern that AAV-shPTB might infect some endogenous DA neurons, mice treated with AAV-Empty (which expresses RFP, but not shPTB) were carefully examined. Scale bar: 30 μm. In comparison with AAV-shPTB treated mice, no RFP+ cells stained positively for either NeuN or TH in midbrain of mice transduced with AAV-Empty, as quantified on the right based on 3 mice with at least 100 cells counted in each. Error bar: SEM. Results show little, if any, leaked Cre expression in endogenous DA neurons at least in our hands and on midbrain regions of mice at the age (2 months) used in our studies.
Extended Data Fig. 6 |. Electrophysiological properties of gradually matured DA neurons.
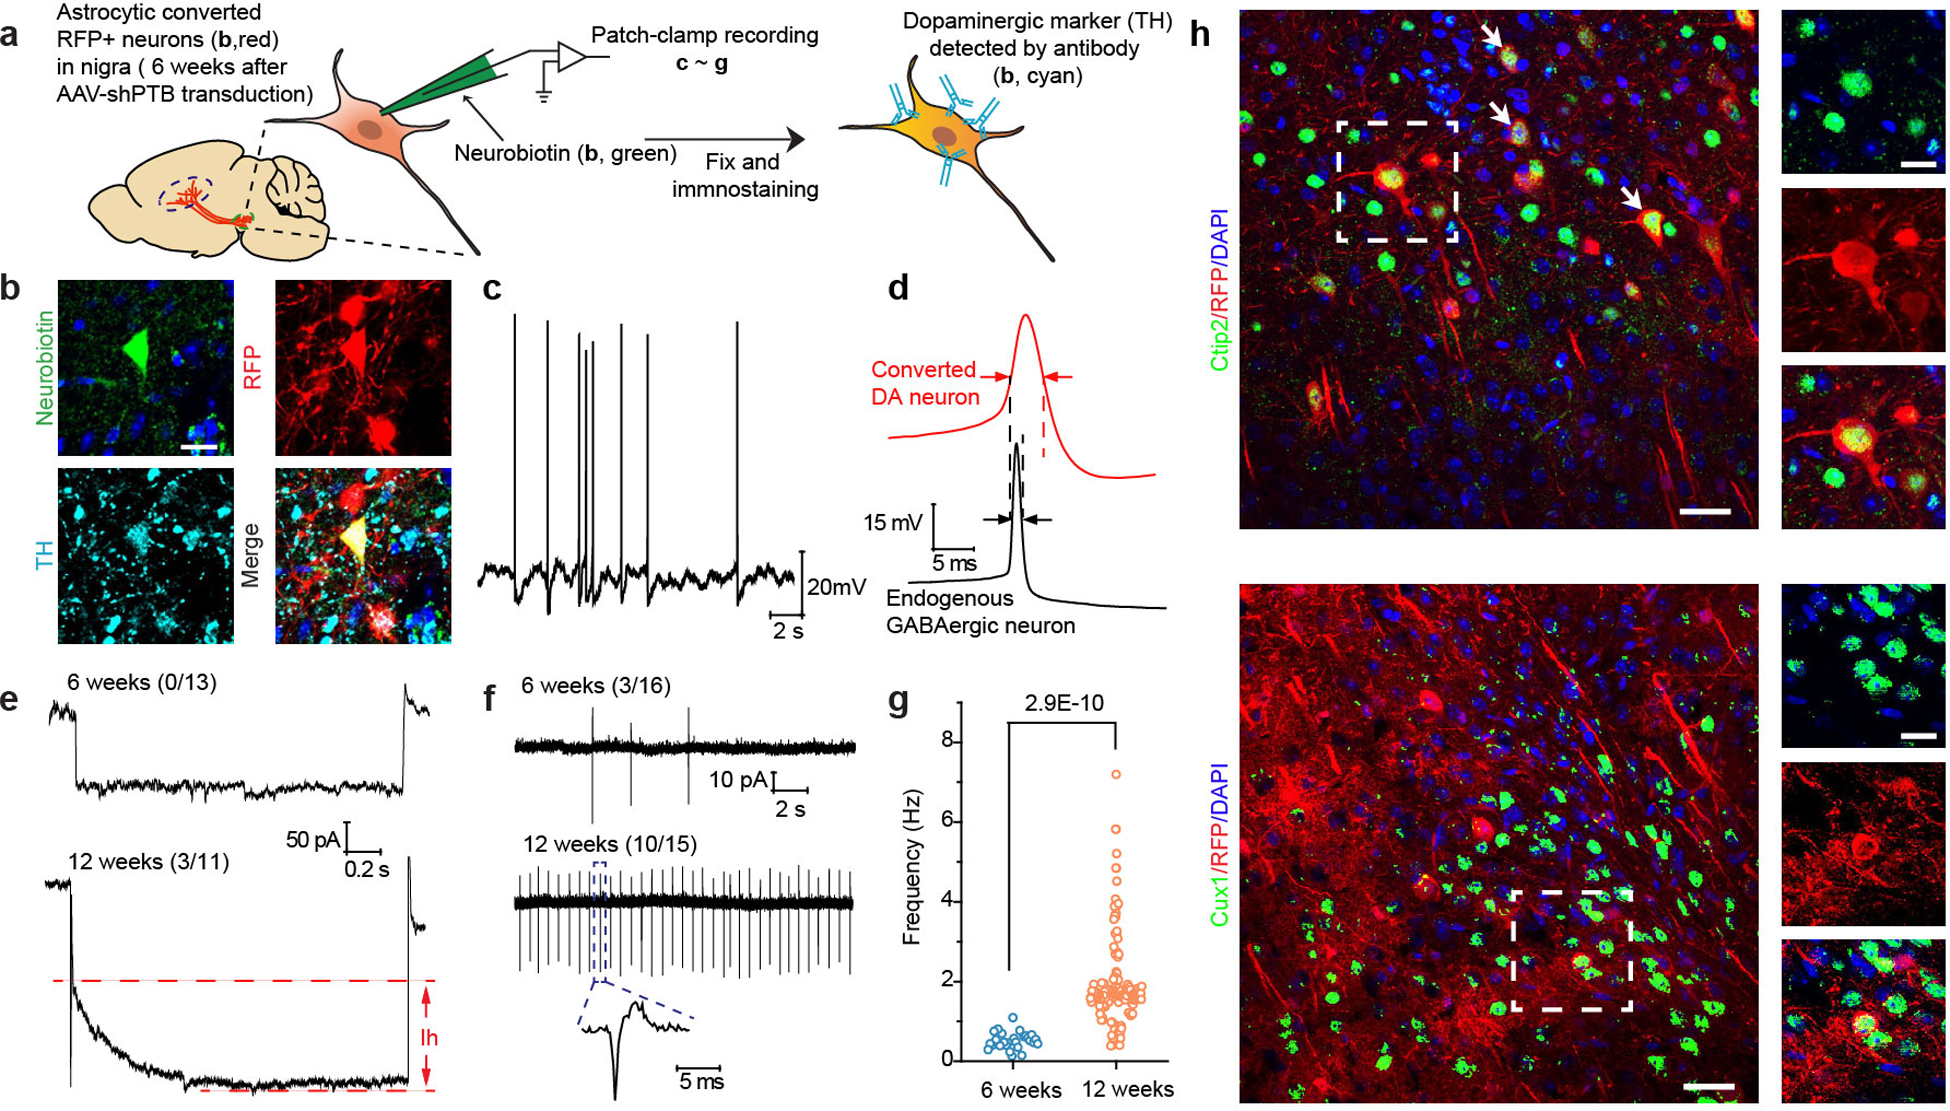
a,b, Schematic depiction of patch recording of converted neurons in midbrain (a). According to this scheme, the fluorescent dye Neurobiotin 488 (green) was first injected in substantia nigra to mark cell bodies for patch clamp recording on brain slices. After recording, the patched cells were confirmed to be RFP+TH+ to demonstrate the recording being performed on newly converted neurons (b, Scale bar: 20 μm). Experiments were independently repeated 4 times with similar results.
c,d,e, Detection of spontaneous action potential (c) and relatively wider action potential generated by newly converted neurons in comparison with endogenous GABAergic neurons (d). Importantly, hyperpolarization-activated currents of HCN channels (Ih currents) were recorded 12 weeks, but not 6 weeks, after AAV-shPTB induced neuronal conversion, which could be specifically blocked with CsCl (e). The numbers of cells that showed the recorded activity versus the total number of cells examined are indicated. Note that the trace in bottom is also shown in main Fig. 2h.
f,g, Extracellular recording, showing more converted neurons firing spontaneous action potentials 12 weeks than 6 weeks after AAV-shPTB transduction. The numbers of cells that showed the recorded activity versus the total number of cells examined are indicated. The frequency of spontaneous spikes that increased upon further maturation was further quantified (g). Data were based on a total of 31 cells from 4 mice. Results show progressive maturation of newly converted DA neurons in the brain.
h, Cortical neurons generated in AAV-shPTB transduced cortex in contrast to a large population of RFP+TH+ cells in midbrain. As a control, AAV-shPTB was injected in cortex and by 12 weeks, RFP+ cells were co-stained with the cortical neuron marker Ctip2 (top) and Cux1 (bottom). Scale bar: 40 μm; enlarged window: 15 μm. Note that RFP+Cux1+ cells are quite rare compared to RFP+Ctip2+ cells, indicative of different conversion efficiency in different layers of cortex. Experiments were independently repeated twice with similar results.
Extended Data Fig. 7 |. Characterization of cortical astrocyte-derived neurons in comparison with midbrain astrocyte-derived neurons.
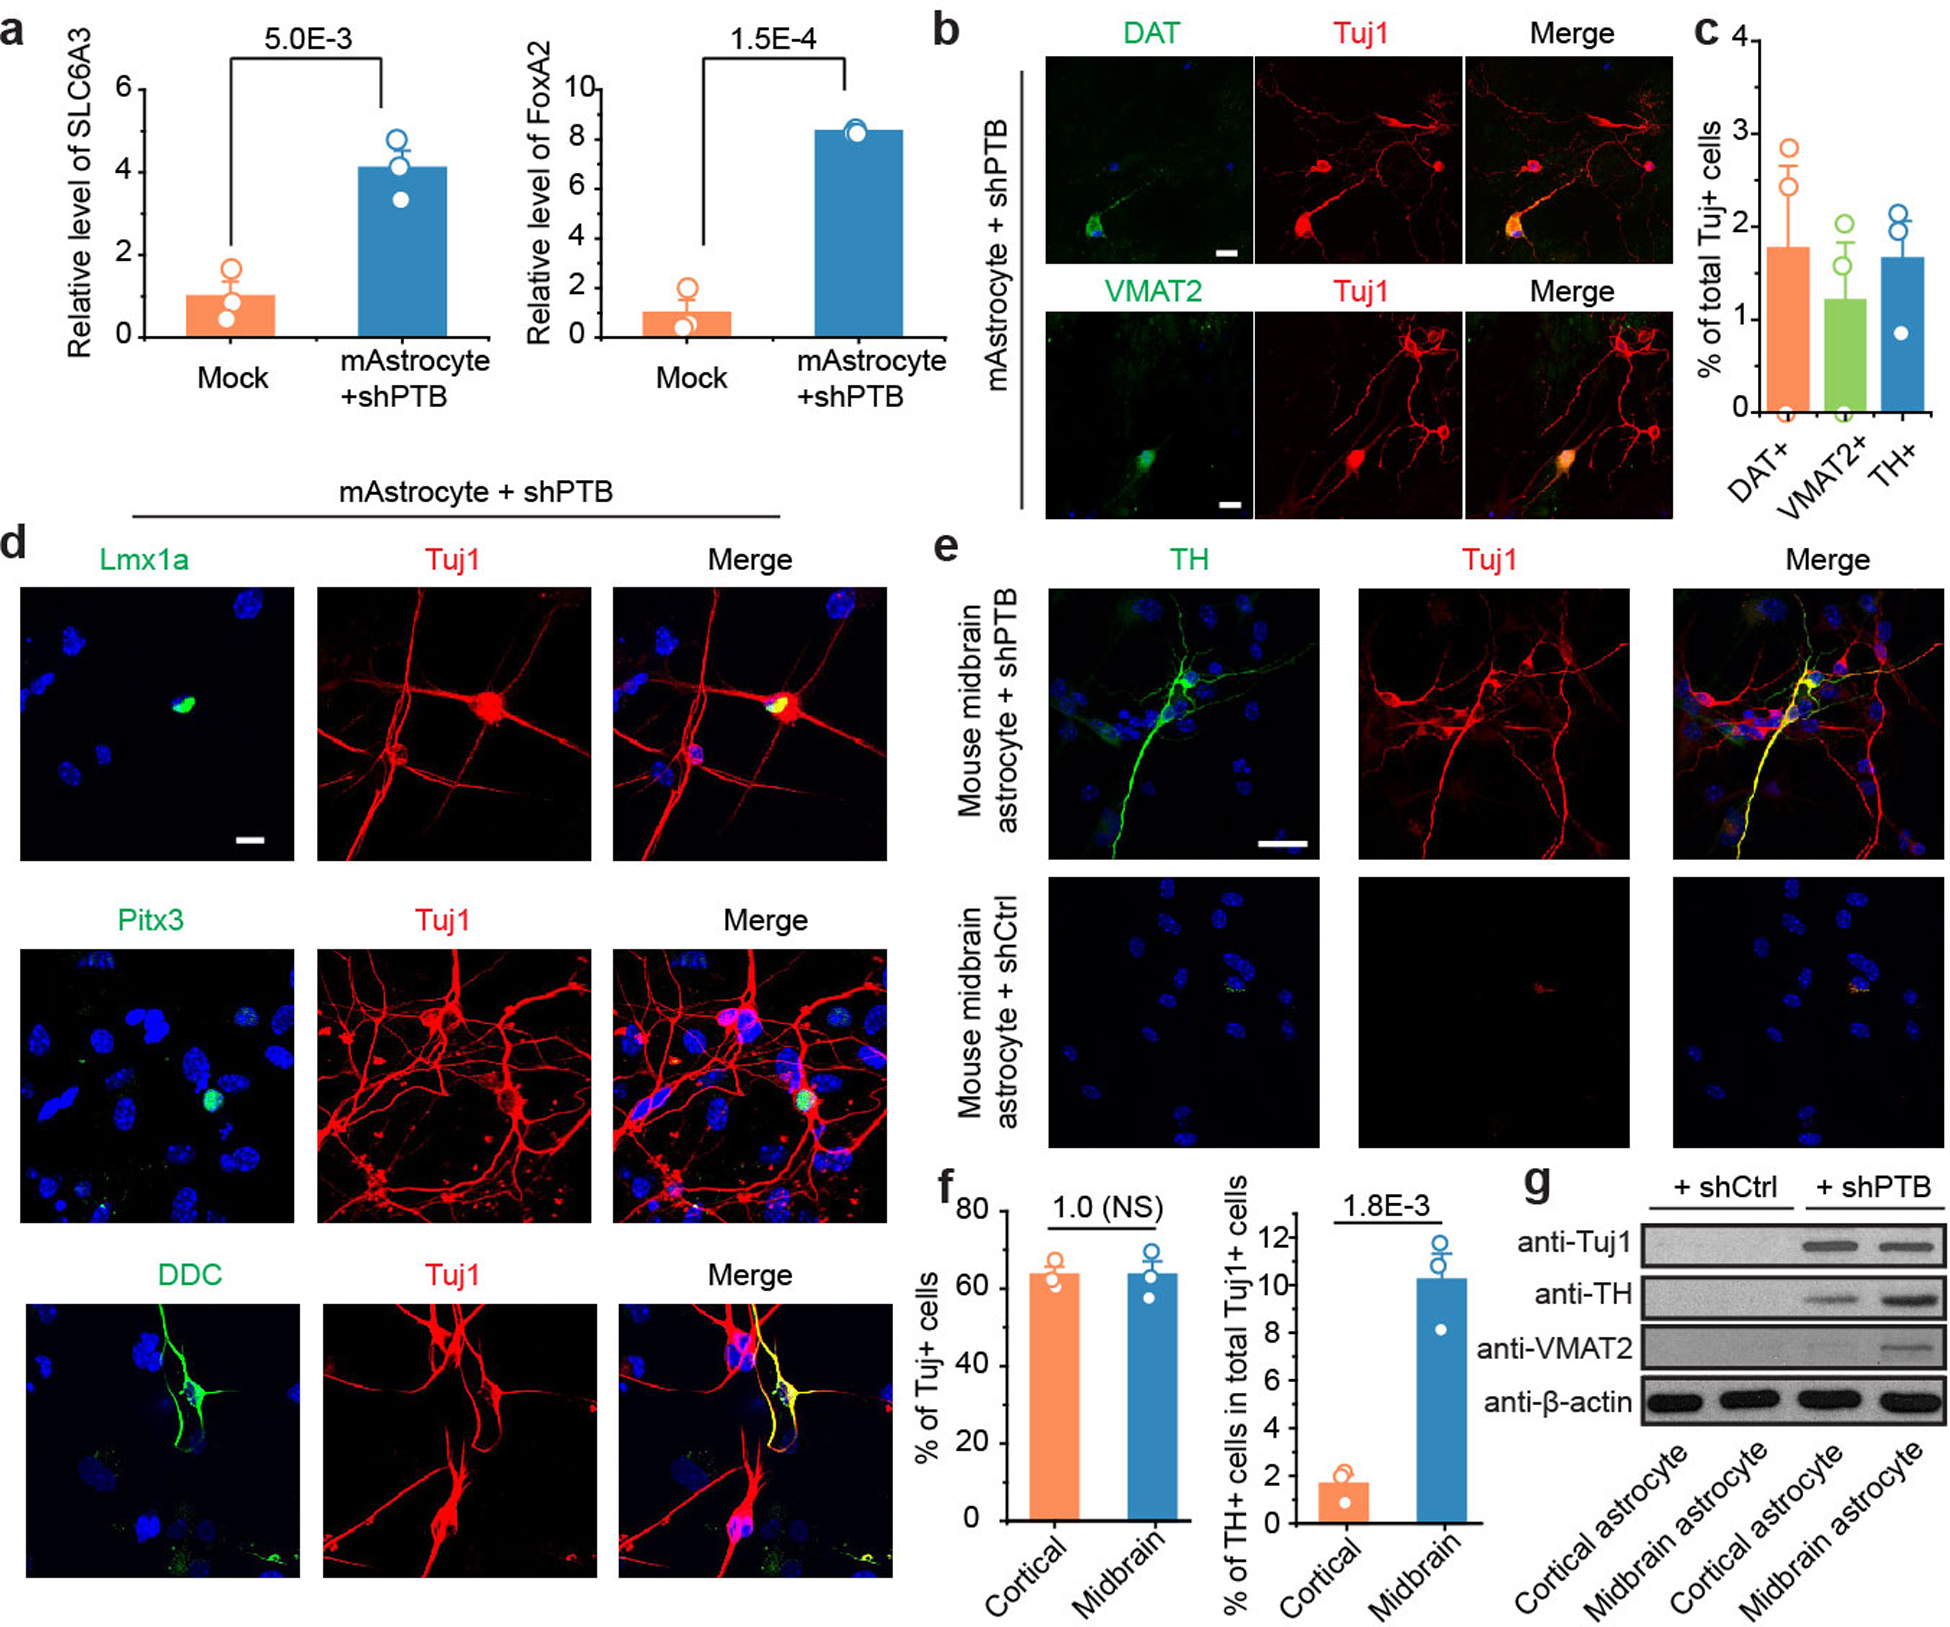
a,b,c, A small fraction of cortical astrocyte-derived neurons express DA neuron markers. RT-qPCR showed the induction of DA neuron-specific genes SLC6A3 and FoxA2 in isolated cortical astrocytes treated lentiviral shPTB. These DA-like neurons were further characterized by immunostaining for additional DA neuron markers DAT and VMAT2 (b, Scale bar: 20 μm) and quantified among Tju1+ cells based on 3 biological repeats with at least 100 cells counted in each (c). Statistical significance was determined by two-sided Student’s t-test and represented as mean+/−SEM. Specific P-values are indicated. Results indicate that despite cortex does not contain DA neurons and RFP+TH+ DA-like neurons were never detected in AAV-shPTB transduced cortex in the brain, isolated cortical astrocytes were able to give rise a fraction of DA-like neurons in vitro. This implies that astrocytes may become more plastic in culture than within specific brain environments.
d, Additional immunochemical evidence for the expression of DA neuron-specific markers (Lmx1a, Pitx3, and DDC) in a subpopulation of Tuj1+ cells derived from cortical astrocytes. Scale bar: 20 μm. Experiments were independently repeated 3 times with similar results.
e,f,g, TH staining of Tuj1+ neurons from astrocytes derived from midbrain and comparison with cortical astrocyte-derived neurons. Lentiviral shPTB, but not control shRNA, converted midbrain astrocytes into TH+ DA neurons in culture (e). Scale bar: 25 μm. Comparison of the conversion efficiencies with cortical and midbrain astrocytes, showing similar high percentage of Tuj1+ neurons (left), but a significantly higher percentage of DA neurons converted from midbrain astrocytes compared to cortical astrocytes (right) (f). Data are based on 3 biological repeats with at least 200 cells counted in each. Statistical significance was determined by two-sided Student’s t-test and represented as mean+/− SEM. Specific P-values are indicated. NS: not significant. Western blotting analysis of a pan-neuronal marker (Tuj1) and two specific markers for DA neurons (TH and VMAT2) in shPTB reprogrammed astrocytes from cortex and midbrain, showing much higher levels of the DA neuron markers in neurons generated from midbrain astrocytes compared to cortical astrocytes (g). Experiments were independently repeated twice with similar results. Together, these data strongly suggest intrinsic cellular differences that are responsible the generation of different neuron subtypes from astrocytes from different brain regions.
Extended Data Fig. 8 |. Cell autonomous mechanisms for the regional specificity in neuronal conversion.
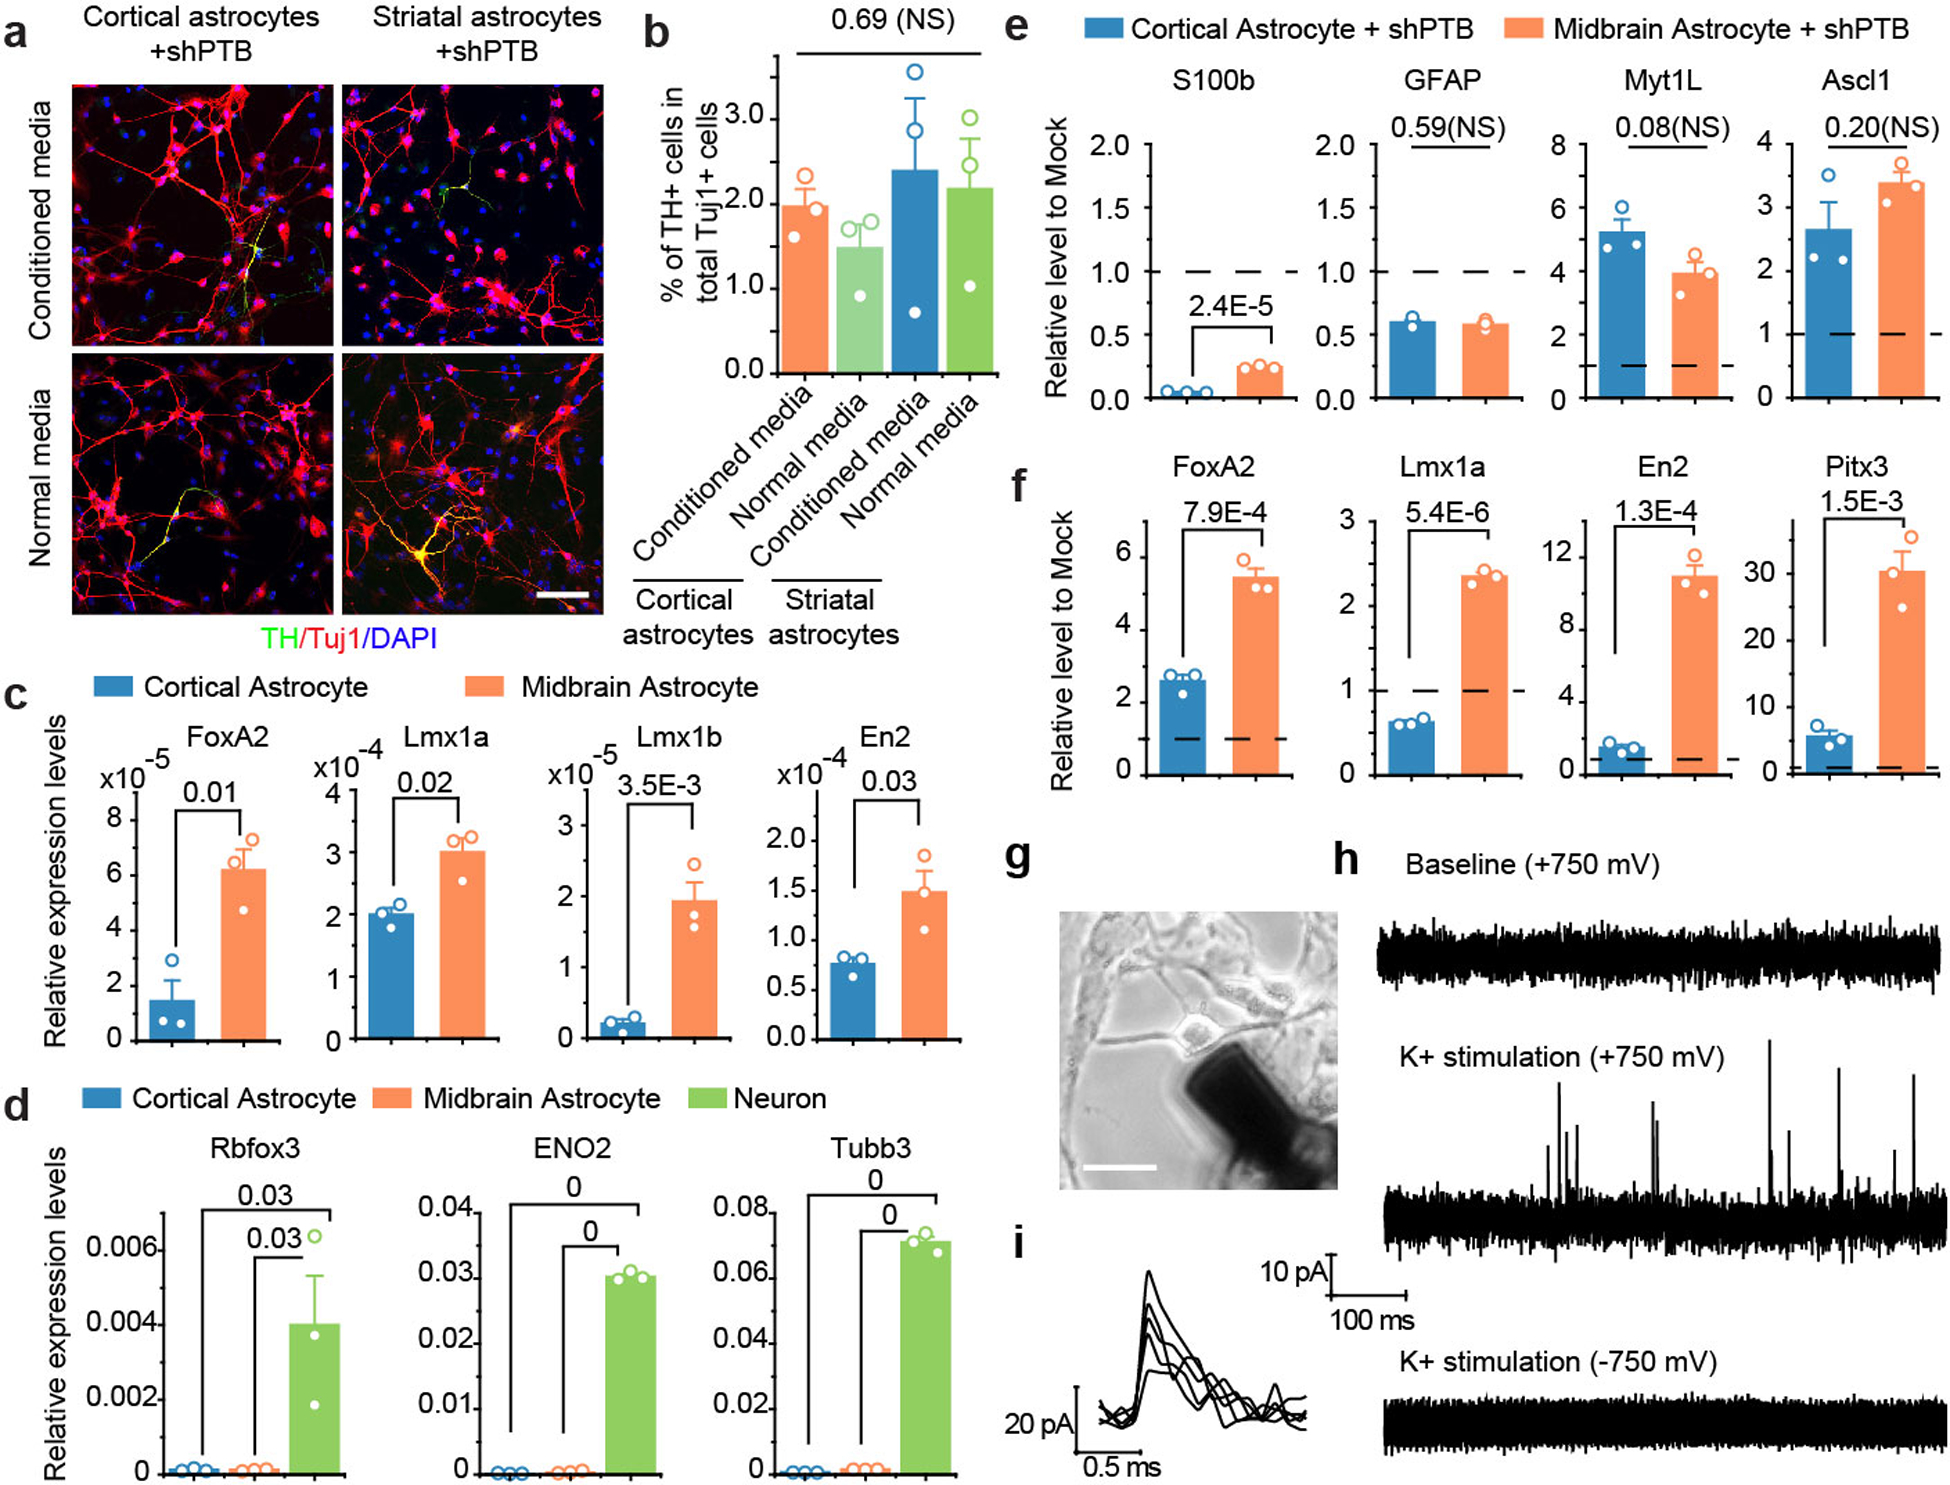
a,b, Comparable levels of TH+ neurons generated from cortical astrocytes with either normal and conditional media from cultured midbrain astrocytes (a). Scale bar: 100 μm. Quantified data were based on 3 biological repeats with at least 100 cells counted in each (b). Statistical significance was determined by ANOVA with post-hoc Tukey test and represented as mean+/− SEM. NS: Not Significant.
c,d,e,f, RT-qPCR analysis of DA neuron-specific transcription factors (TFs) in cortical and midbrain astrocytes before and after lentiviral shPTB-induced neuronal conversion. The indicated TFs were quantified by real time PCR and normalized against β-actin mRNA (c). To ensure that the isolated astrocytes were free of contaminated neurons, RT-qPCR was also performed with the 3 indicated DA-neuron markers with isolated neurons as control (d). In response to PTB knockdown, astrocyte-specific genes S100b and GFAP were repressed, while pan-neuronal TFs Myt1L and Ascl1 were activated in astrocytes derived from both cortex and midbrain (e). Dashed lines: levels before shPTB treatment, which was set to 1 for comparison with levels after shPTB treatment. Under the same conditions, the 4 DA-neuron-specific TFs were more robustly induced in response to PTB depletion in midbrain astrocytes compared to cortical astrocytes (f). Statistical significance was determined by ANOVA with post-hoc Tukey test for (d) and two-sided Student’s t-test for (c,e,f), all based on 3 biological repeats, and represented as mean+/− SEM. Specific P-values are indicated. NS: not significant. Results suggest higher basal levels and more robust induction of DA neuron-specific TFs in midbrain astrocytes compared to cortical astrocytes, thus evidencing for the differences in cell intrinsic gene expression programs in giving rise to distinct subtypes of neurons.
g,h,i, Schematic of amperometric recording of monoamine release, showing the placement of a carbon fiber electrode on midbrain astrocyte-derived neuron (g). Scale bar: 30 μm. Spike-like events were captured by holding the electrode at +750 mV after K+ (25mM) stimulation (h). A high-resolution of dopamine release events in (h) is shown in (i). Results demonstrate a key functional property of midbrain astrocyte-derived DA neurons. Experiments were independently repeated twice with similar results.
Extended Data Fig. 9 |. Time-course analysis of fiber outgrowth from converted neurons.
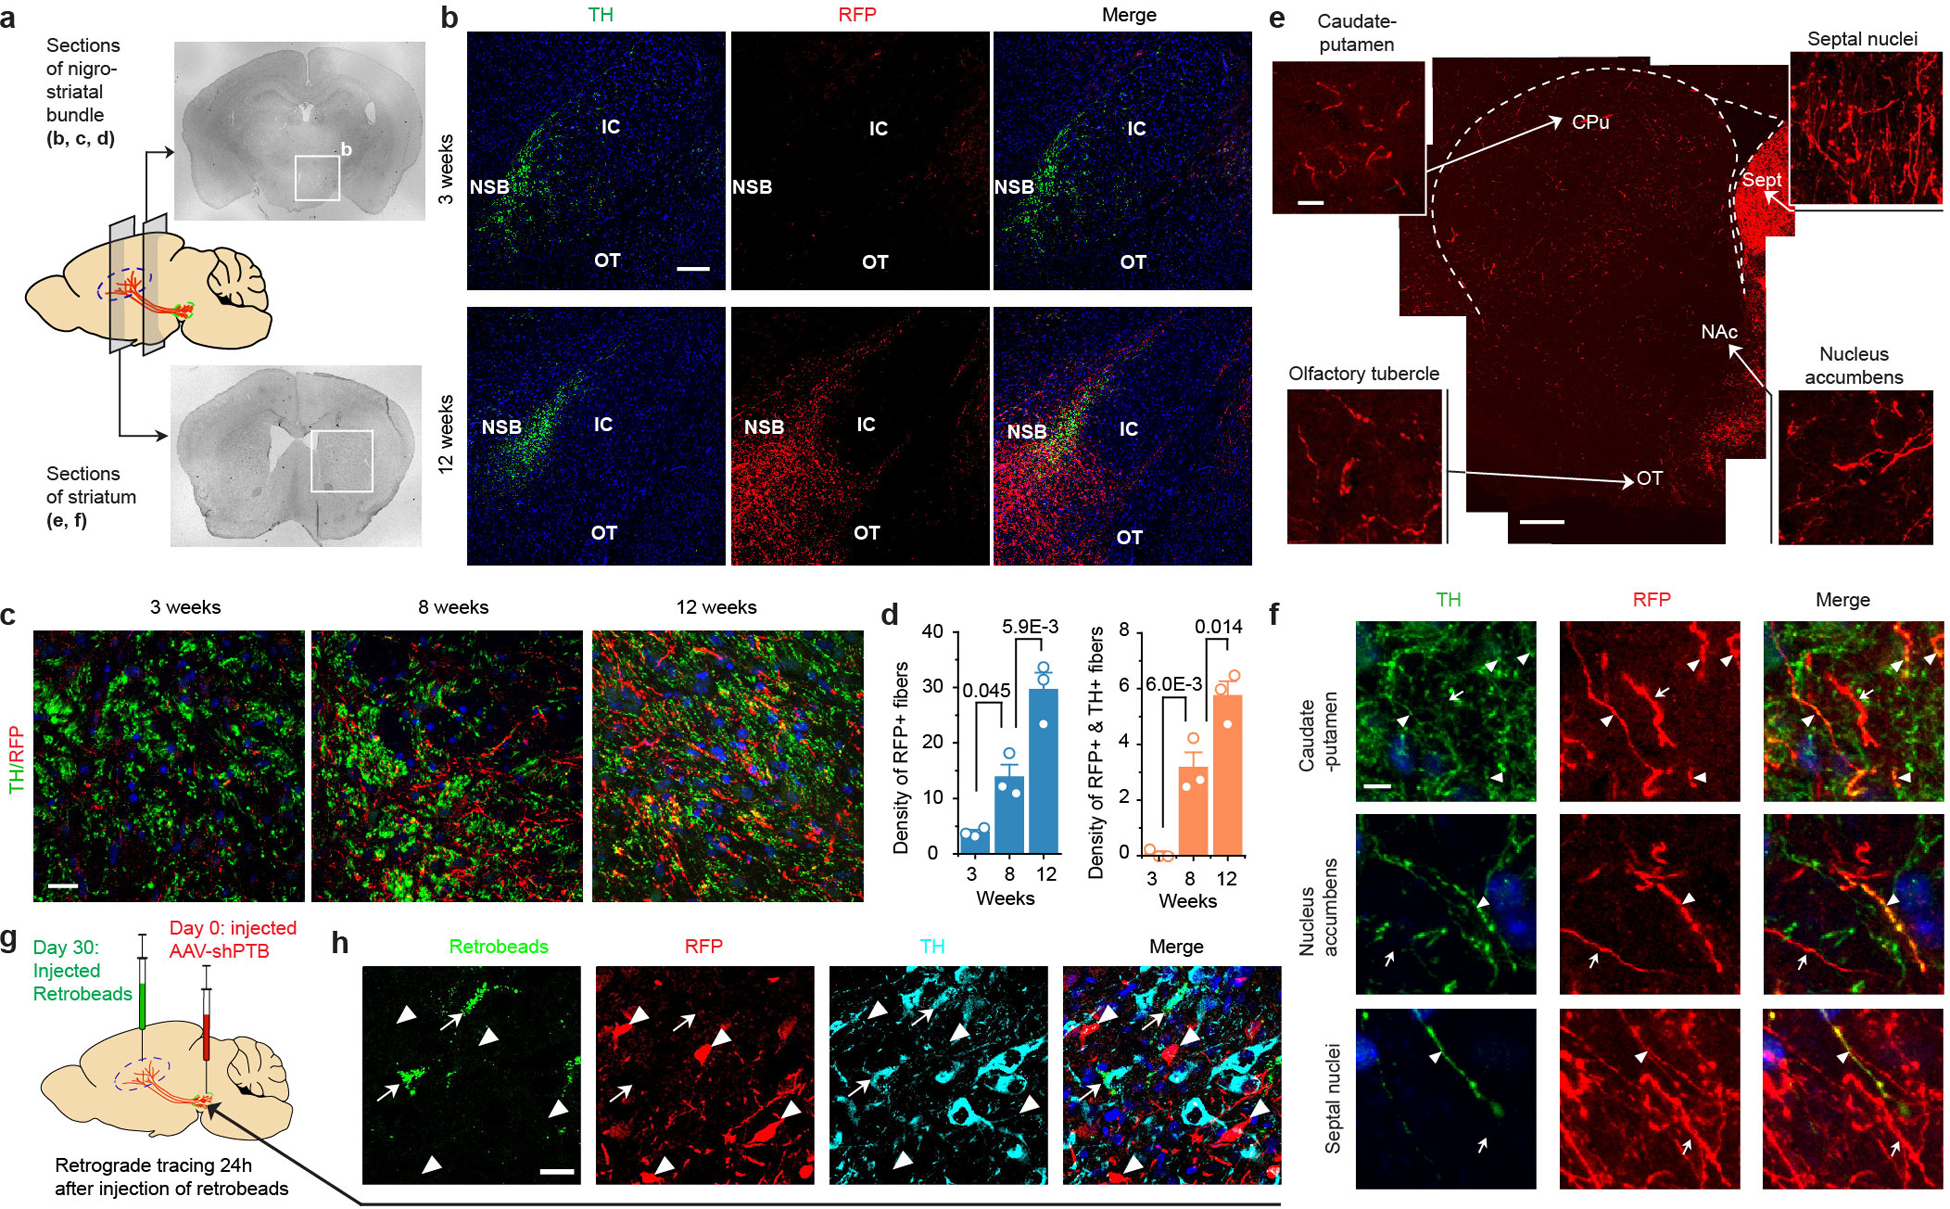
a, Schematic of coronal sections for analyzing fiber density in the nigrostriatal pathway.
b,c,d, Sphere-determined density of RFP+ fibers that were progressively increased along the nigrostriatal bundle (NSB). Shown are low magnification views (b, Scale bar: 150 μm) and enlarged views (c, Scale bar: 35 μm). IC: internal capsule; OT: optical tract. Quantified RFP+ (left) or RFP+TH+ fibers (right) were based on 3 independent biological sections (d). Statistical significance was determined by ANOVA with post-hoc Tukey test and represented as mean+/− SEM. Specific P-values are indicated in each case. Results show time-dependent increase in fiber density, a portion of which also exhibits colocalization of the DA neuron marker TH.
e,f, Low magnification view of striatum innervated by RFP+ projections (e). Scale bar: 300 μm. Shown in both sides are amplified views of RFP+ projections in different regions: CPu: Caudate-Putamen; NAc: Nucleus Accumbens; Sept: Septal nuclei; OT: Olfactory Tubercle. Scale bar: 15 μm. Note highly bright RFP signals in Septal nuclei. c, Three selected striatal regions were further amplified to highlight a fraction of RFP+ fibers with (arrowheads) or without (arrows) co-staining with the DA neuron marker TH. Scale bar: 5 μm. Results emphasize that converted DA neurons targeted more broad regions in striatum than endogenous DA neurons, which might cause certain side effect, a potential caveat of neuronal reprogramming to be investigated in future studies.
g,h, Retrograde tracing of TH+ neurons from striatum to substantial nigra. Depicted is the AAV-shPTB injection site at Day 0 and the injection site of retrobeads at Day 30 (g). Retrograde tracing was monitored 24 hours post injection of retrobeads. After treatment of AAV-Empty for 10~12 weeks, TH+ cells, but not TH+RFP+ cells in substantial nigra were labeled with retrograde beads (h). Arrowheads: RFP+ cells; arrows: cell bodies of endogenous TH+ DA neurons labeled with retrobeads. Scale bar: 20 μm. These data provide a critical control for AAV-shPTB converted DA neurons that could be traced from striatum to substantia nigra, as described in the main text.
All experiments show in this figure were independently repeated 3 times with similar results.
Extended Data Fig. 10 |. shPTB-converted neurons replenish lost dopaminergic neurons in substantia nigra.
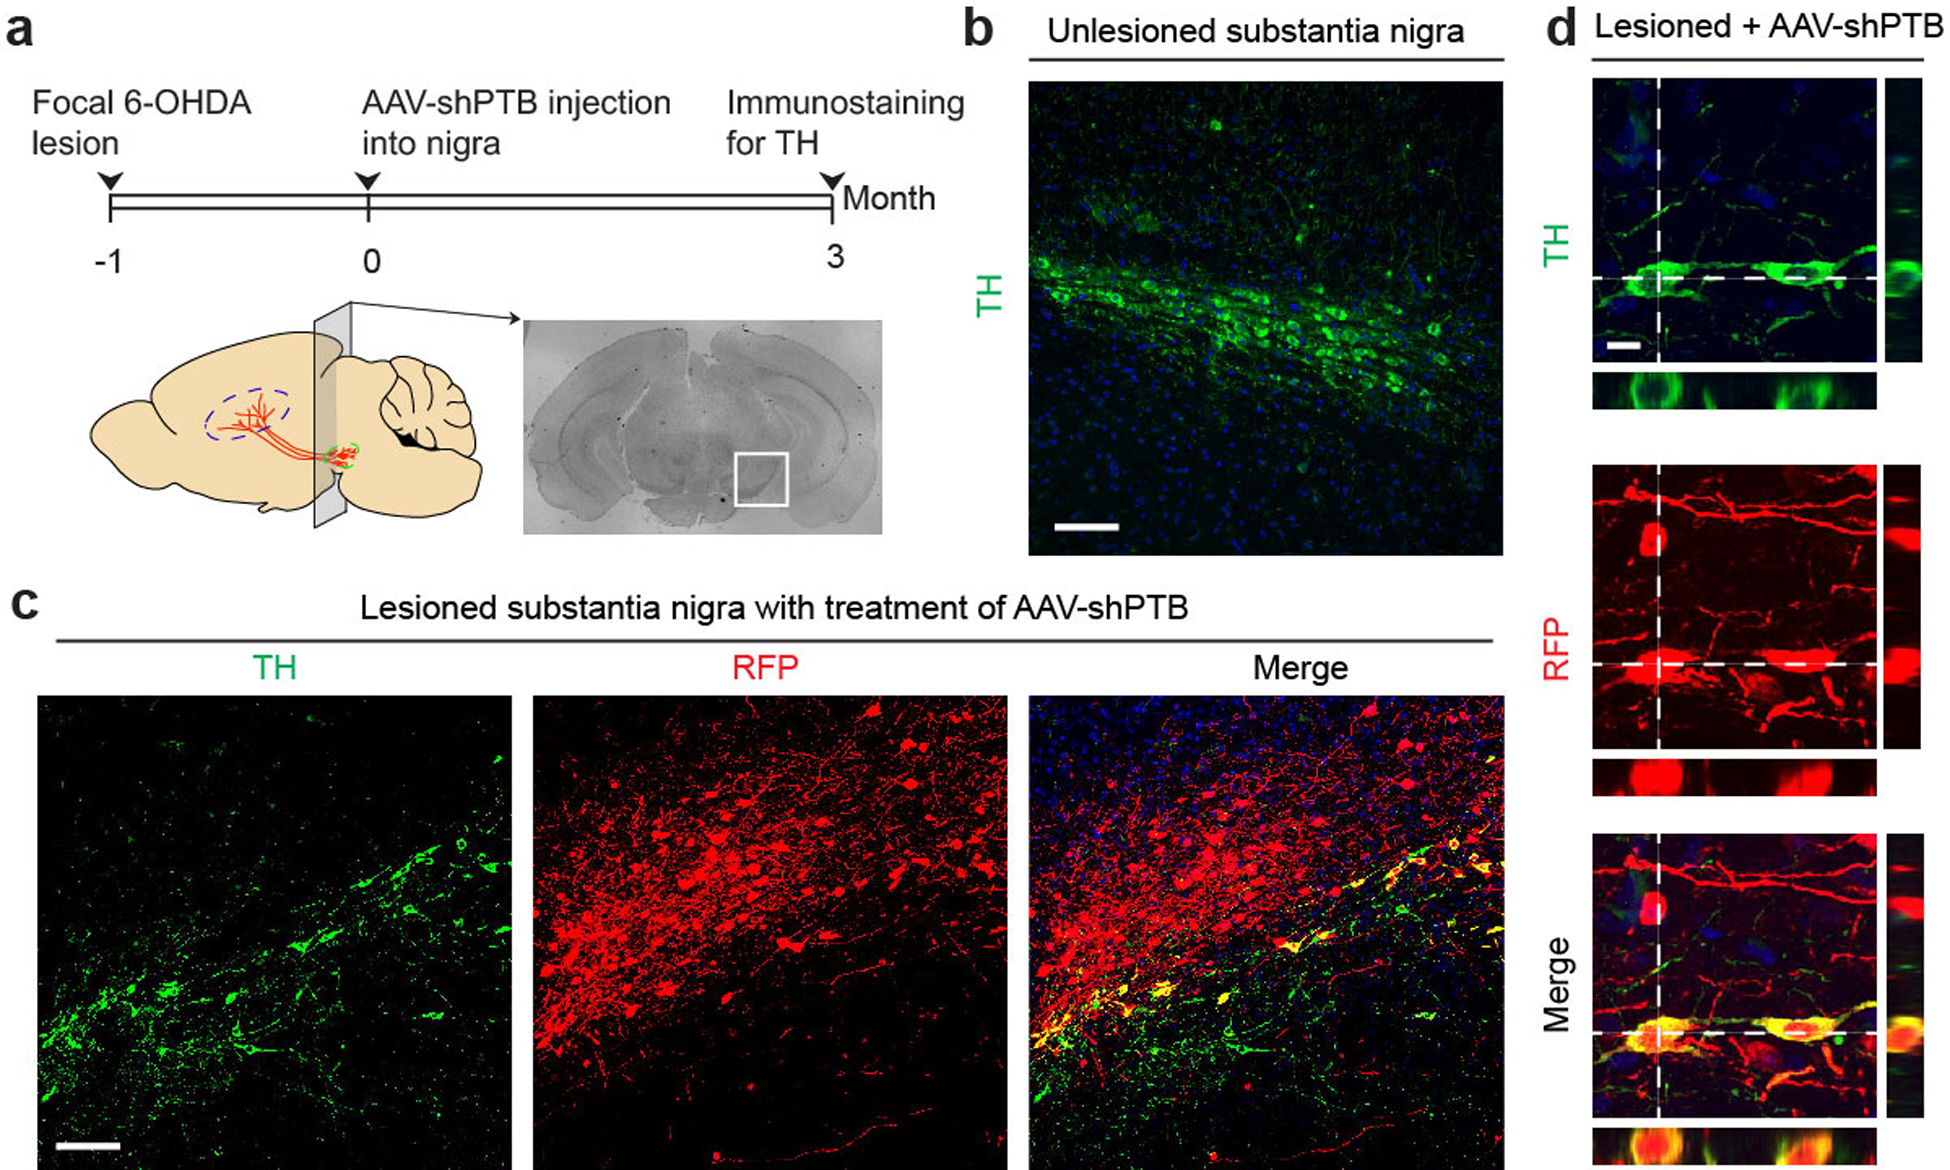
a, Schematic of the experimental schedule for 6-OHDA-induced lesion followed by reprogramming with AAV-PTB and then TH staining.
b,c, Low magnification views of unlesioned substantia nigra stained for TH (b) and nigra lesioned with 6-OHDA and transduced with AAV-shPTB (c). Scale bar: 80 μm. These data were used to provide quantitative information shown in main Fig. 4f,g.
d, Enlarged view of RFP+ cells that co-expressed TH in substantia nigra. Two RFP+TH+ cell bodies are highlighted by orthogonal views of z-stack images, attached on right and bottom of the main image in each panel. Scale bar: 10 μm. Results show the generation of TH+ DA neurons in a highly regional specific manner in substantia nigra, as a large population of RFP+ cells not labeled by TH staining in the same image.
All experiments show in this figure were independently repeated 3 times with similar results.
Extended Data Fig. 11 |. Restoration of TH+ neurons in striatum of 6-OHDA lessioned mice.
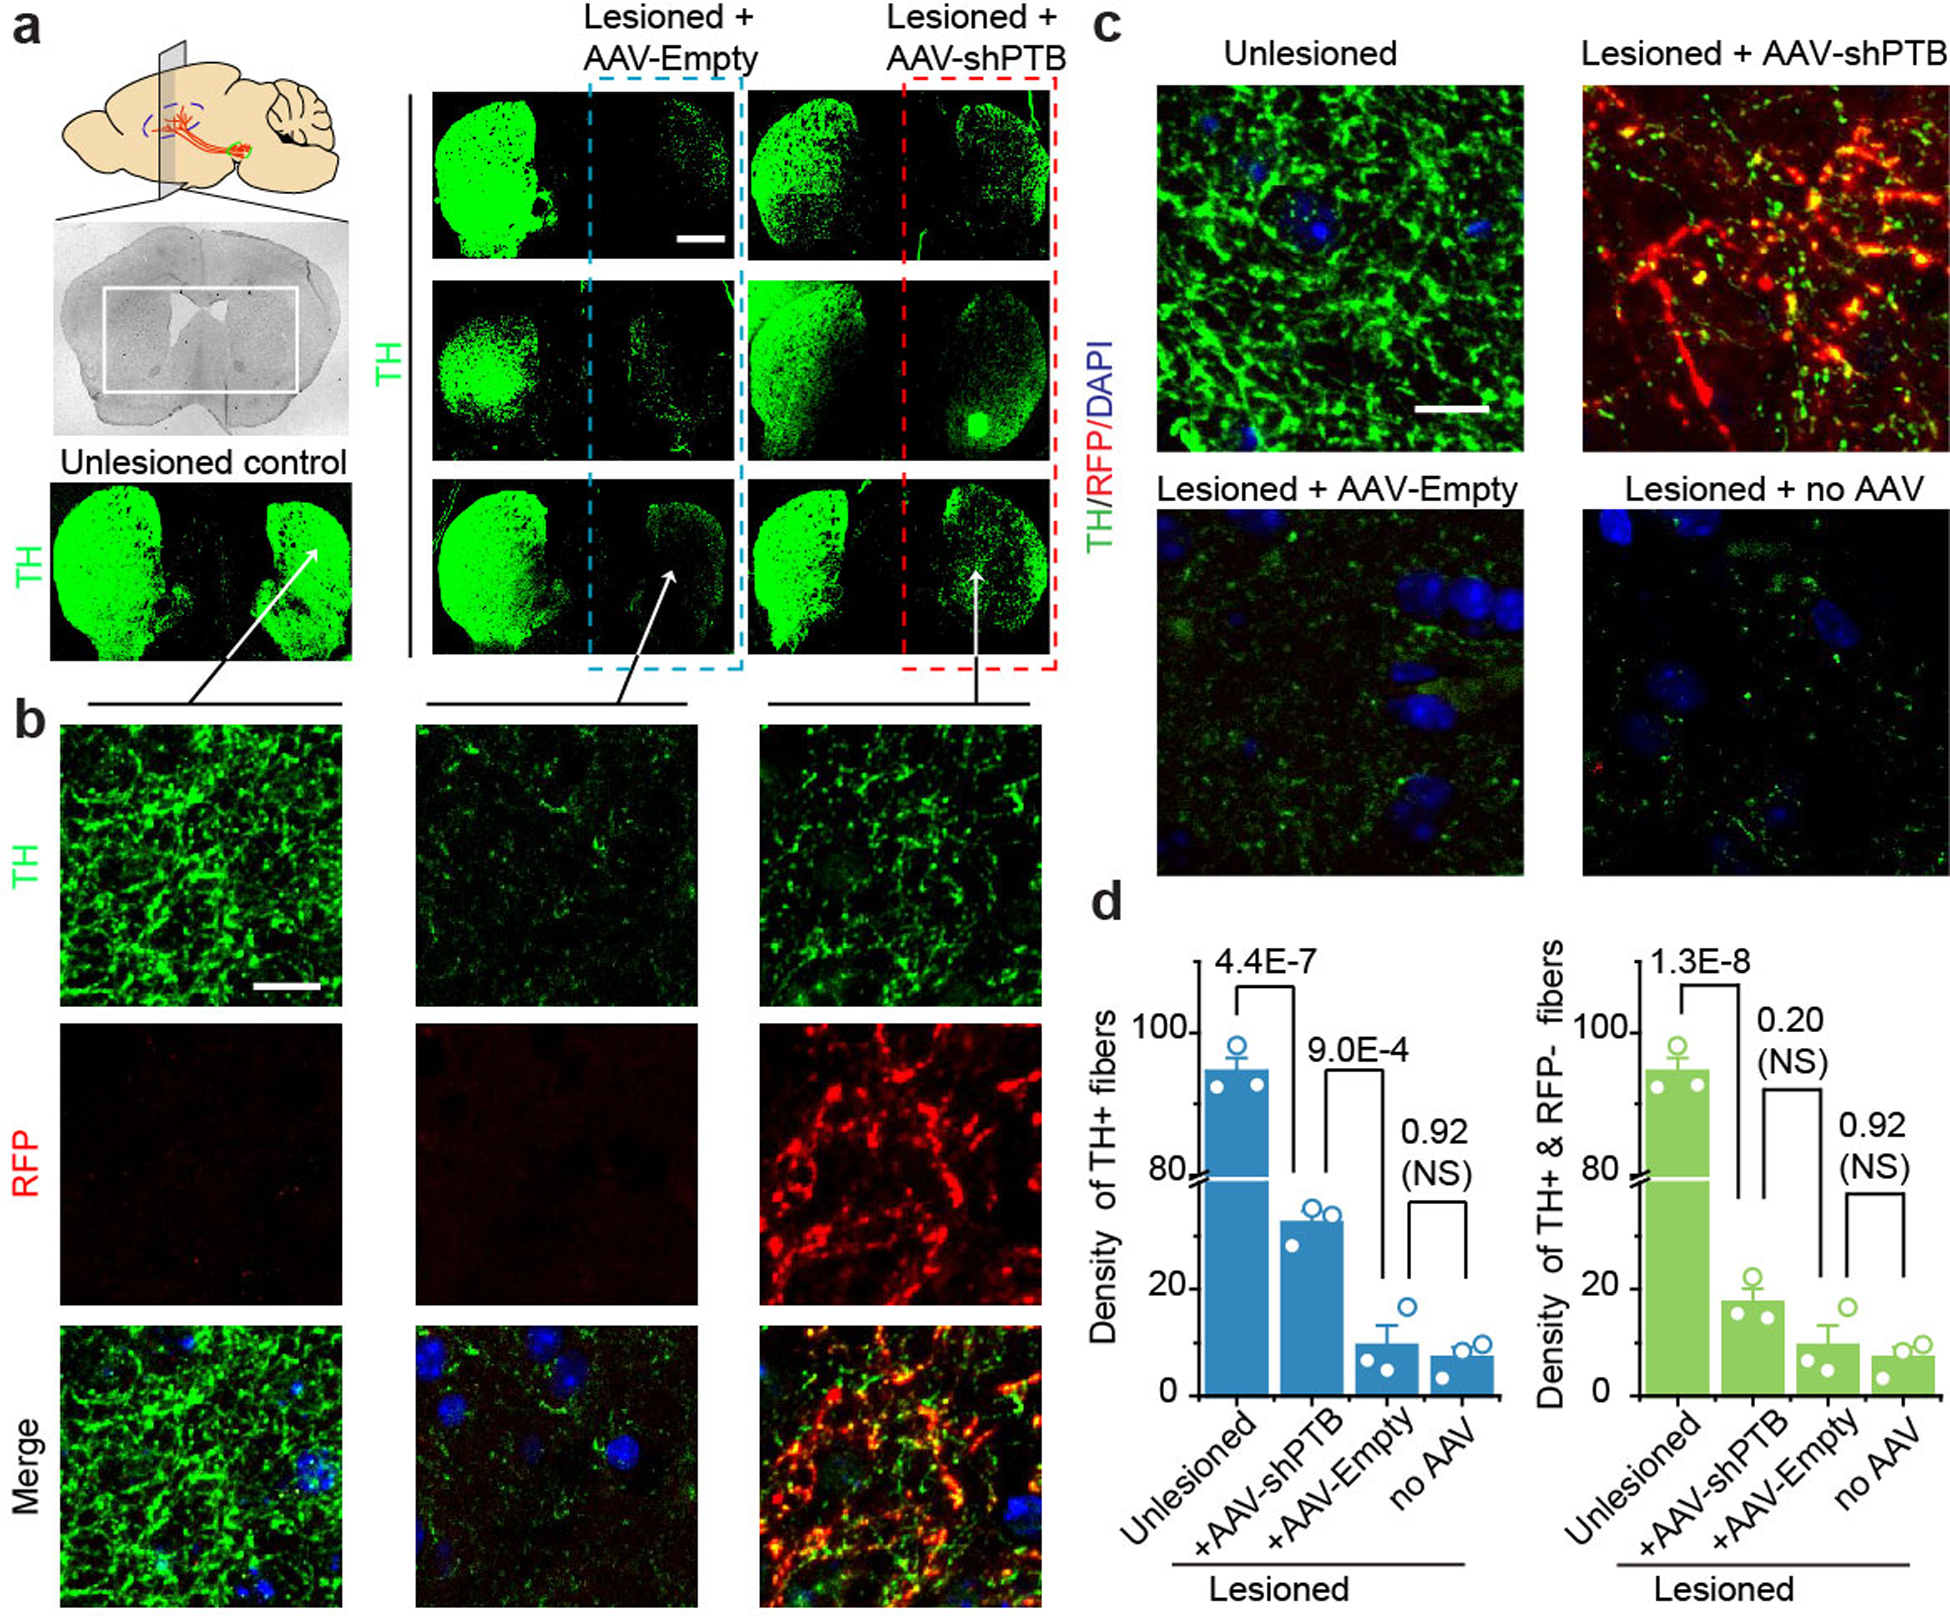
a,b, Schematic of the coronal section of striatum and images of striatum of unlessioned control and lessioned on the right side of the brain treated with either AAV-Empty or AAV-shPTB (a). Scale bar: 150 μm. Amplified images showed extensive colocalization of TH with RFP-labeled fibers (b). Scale bar: 10 μm. Results show a significant degree of restoration of TH+ fibers in striatum. Experiments were independently repeated 3 times with similar results.
c,d, Quantitative analysis of TH+ fibers in striatum under different treatment conditions. TH staining of striatum under different treatment conditions, as indicated on top of each panel (c). Scale bar: 10 μm. Quantification of total TH+ or TH+RFP– fiber density in striatum under different treatment conditions based on 3 biological repeats (d). Statistical significance was determined by ANOVA with post-hoc Tukey test and represented as mean+/− SEM. Specific P-values are indicated. NS: Not Significant. Results show that most TH+ fibers seem to derive from AAV-shPTB converted dopaminergic neurons; however, the data do not rule out the possibility that the axons of some endogenous neurons also responded to the environment created by newly converted neurons.
Extended Data Fig. 12 |. Reconstruction of the nigrostriatal pathway by converted dopaminergic neurons.
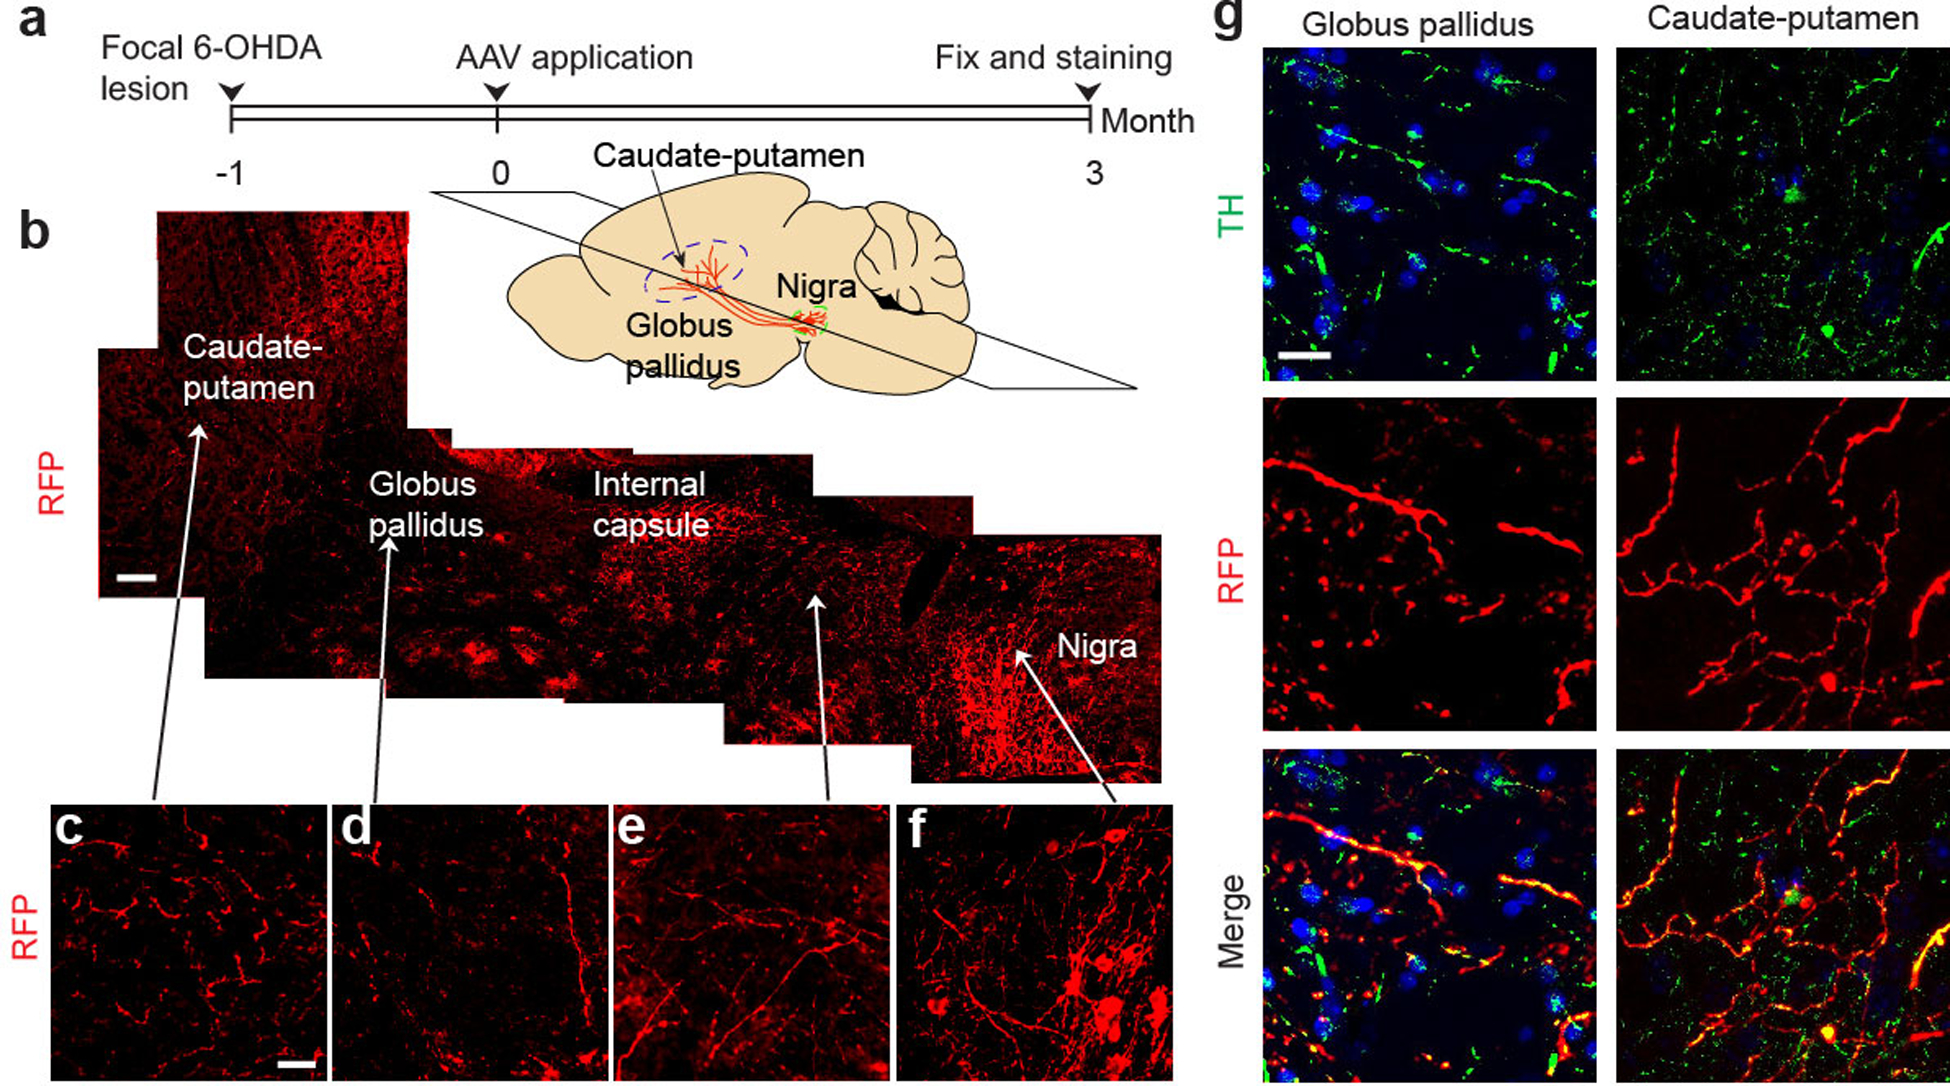
a, Schematic of the experimental schedule for 6-OHDA-induced lesion and reconstruction of the nigrostriatal pathway.
b to f, Images of RFP+ projections extended from nigra to striatum. The schematic diagram shows the dorso-ventral level of horizontal section. Scale bar: 100 μm. Amplified views show different brain regions (c to f). Scale bar: 25 μm.
g, Amplified views of RFP-positive fibers that co-stained with TH in caudate-putamen and globus pallidus. Scale bar: 20 μm. These data were used to provide quantitative information shown in main Fig. 4h,i.
All experiments show in this figure were independently repeated twice with similar results.
Extended Data Fig. 13 |. Measurement of striatal dopamine by HPLC and controls with AAV-shGFP and AAV-hM4Di.
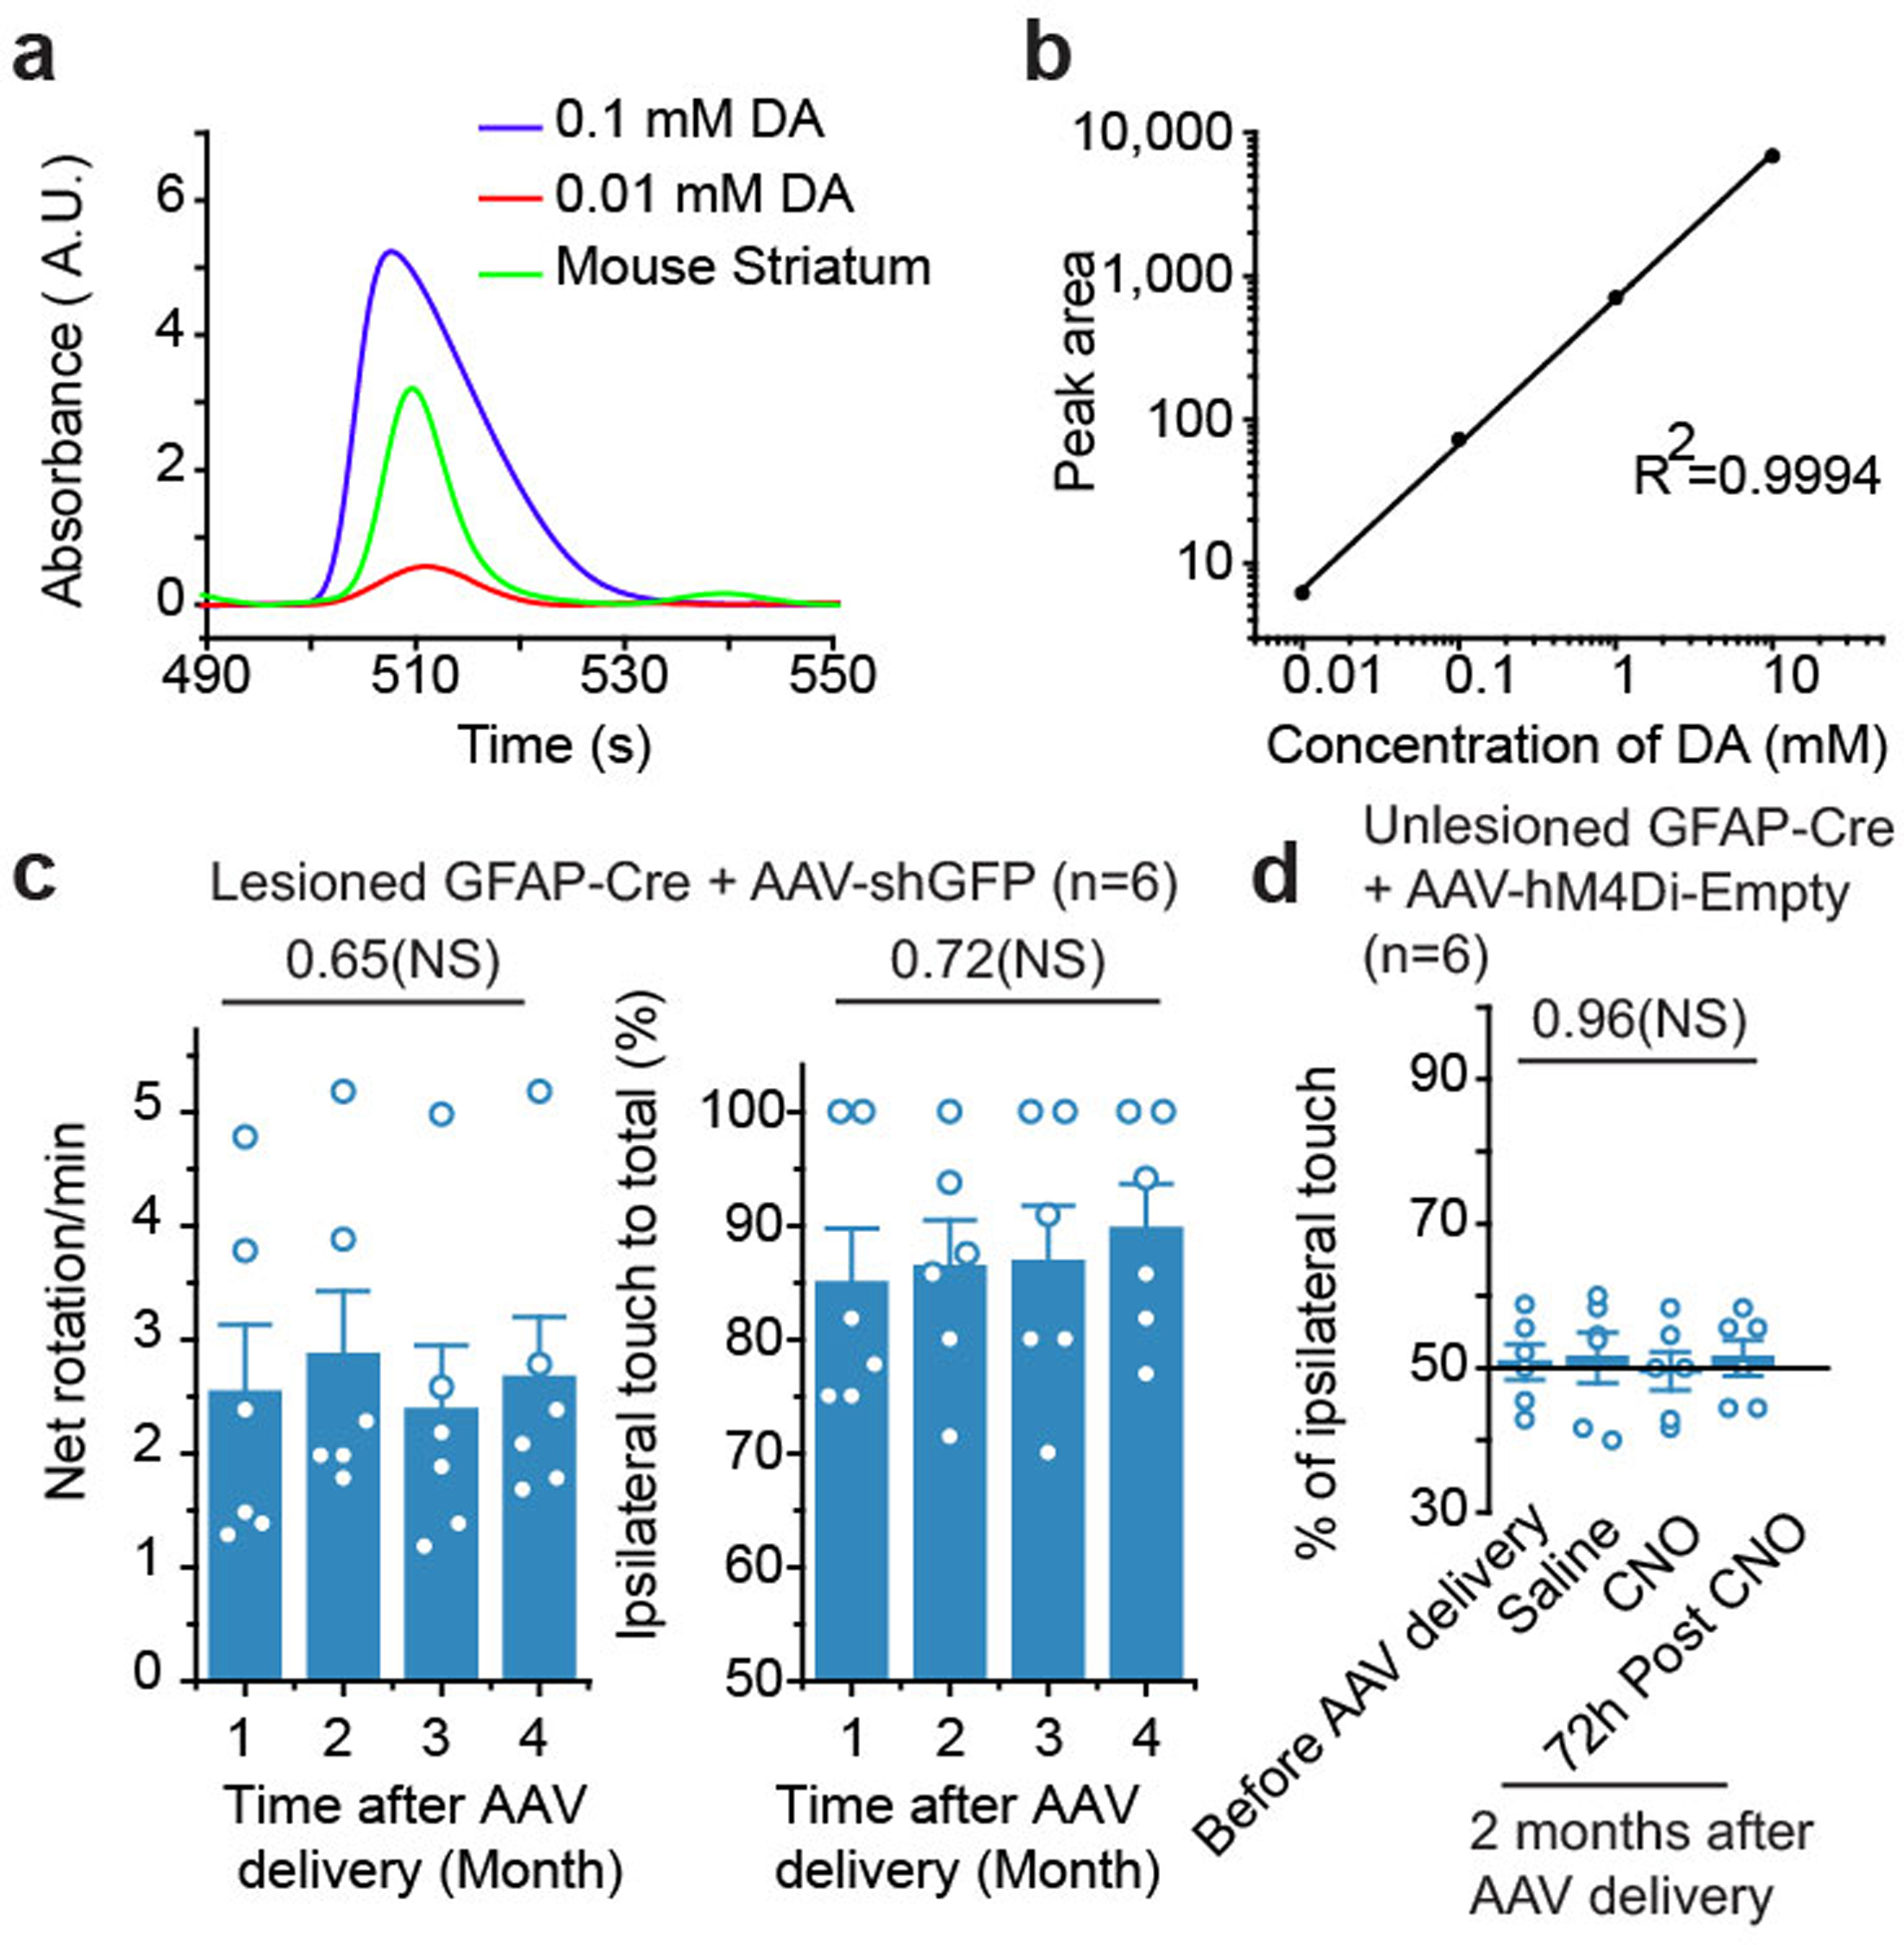
a,b, Dopamine levels in brain detected by HPLC after two different doses of “spike-in” dopamine” according to the range of dopamine levels in wild-type brain (a). A standard curve generated by “spike-in” dopamine amounts (b). This set of experiments was performed only once.
c, Controls for behavioral tests, showing that expressing an anti-GFP control shRNA alone did not rescue chemical-induced behavioral deficits based on apomorphine-induced rotation (left) and cylinder test (right).
d, Controls for behavioral tests, showing that the expression of hM4Di in non-reprogrammed astrocytes did not trigger detectable behavior change on unlesioned mice in the presence of CNO.
Statistical significance was determined by ANOVA with post-hoc Tukey test for (c,d) and represented as mean+/− SEM. 6 mice were analyzed in each group. Specific P-values are indicated. NS: not significant.
Extended Data Fig. 14 |. Electrophysiological analysis of ASO-PTB induced neurons in vitro and in brain.
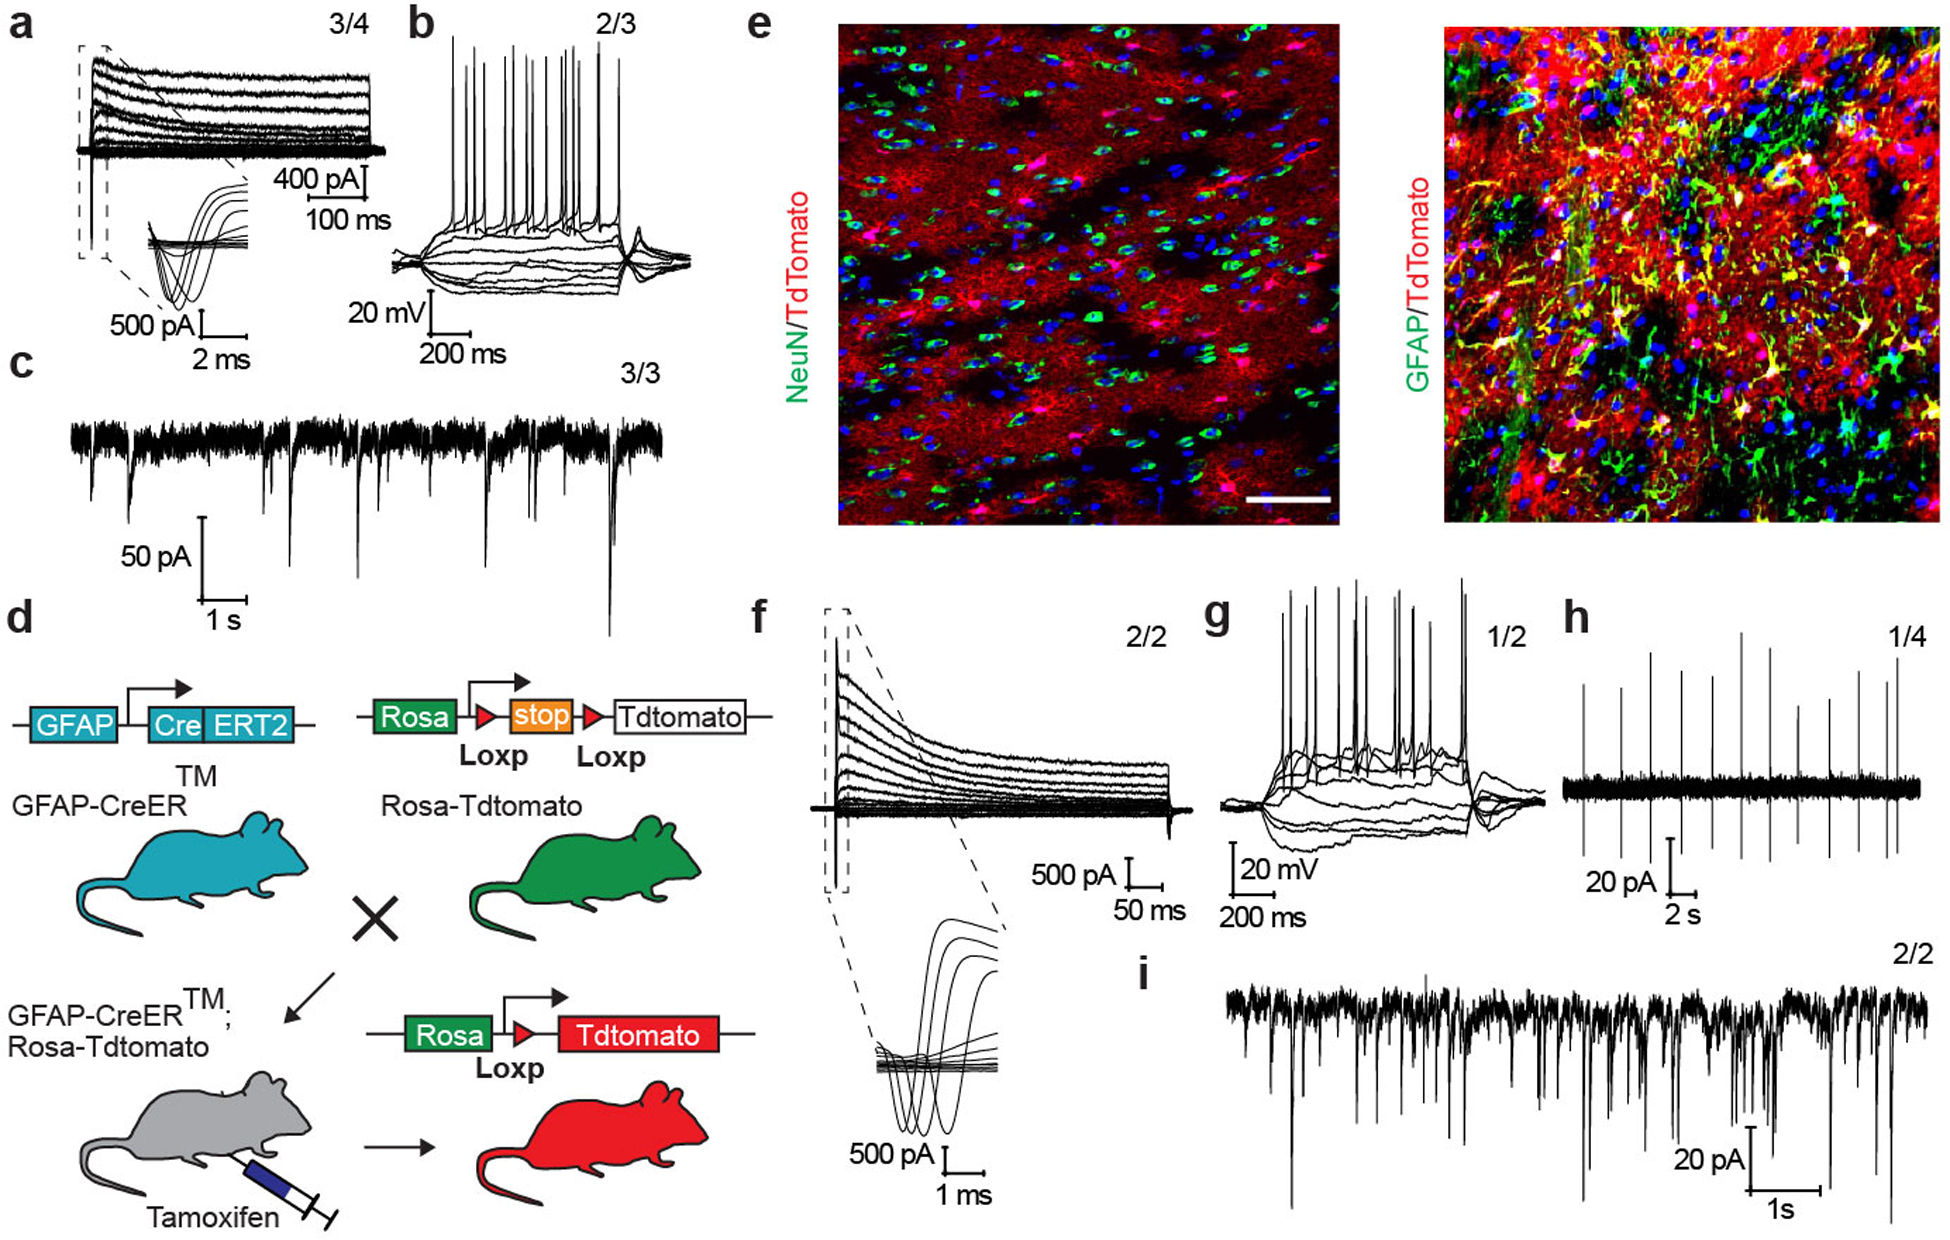
a,b,c, Converted neurons showed large currents of voltage-dependent sodium and potassium channels (a), repetitive action potentials (b), and spontaneous post-synaptic currents (c). The numbers of cells that showed the recorded activity versus the total number of cells examined are indicated on top in each panel.
d, Schematic of transgenic mice used to trace astrocytes in vivo.
e, 3 weeks after treatment of tamoxifen, none of TdTomato-labeled cells in midbrain of GFAP-CreER:Rosa-tdTomato mice were stained positive for NeuN (left), and all were GFAP+ (right). Scale bar: 50 μm.
f to i, Converted neurons in brain slices showed large currents of voltage-dependent sodium and potassium channels (f), repetitive action potentials (g), spontaneous action potentials (h), and spontaneous post-synaptic currents (i). The numbers of cells that showed the recorded activity versus the total number of cells examined are indicated on top in each panel. Results show functional neurons induced by PTB-ASO both in culture and in mouse brain.
All experiments show in this figure were independently repeated twice with similar results.
Supplementary Material
ACKNOWLEDGEMENTS
The authors are grateful to members of the Fu lab for cooperation, reagent sharing, and insightful discussion during the course of this investigation. We thank Dr. Alysson Muotri of UCSD for a gift of human ES cell-derived neural progenitors. D.W.C. receives salary and research support from the Ludwig Institute for Cancer Research and is a Nomis Foundation Distinguished Scientist. Z.Z. and X.K. were supported by NSFC grants (31930061, 31761133016, 21790394 and 81974203). W.C.M. and X-D.F. were supported by a grant from the Larry Hillblom Foundation (2019-A-006-NET). This work was supported by NIH grants (GM049369 and GM052872) to X-D.F.
Footnotes
DATA AND CODE AVAILABILITY
RNA seq data have been deposited in NCBI GEO under GSE142250. Independently generated data are available upon request. Methods have been converted into step-wise protocols deposited in Nature Protocol Exchange.
COMPETING INTERESTS
X-D. Fu is a founder of CurePharmacutics Inc.
PATENT
The University of California, San Diego has filed a patent under SD2020–152 on neuronal reprogramming induced by inactivating PTB by any means for treatment of neurological disorders.
REFERENCES
- 1.Poewe W et al. Parkinson disease. Nat Rev Dis Primers 3, 17013, doi: 10.1038/nrdp.2017.13 (2017). [DOI] [PubMed] [Google Scholar]
- 2.Barker RA, Gotz M & Parmar M New approaches for brain repair-from rescue to reprogramming. Nature 557, 329–334, doi: 10.1038/s41586-018-0087-1 (2018). [DOI] [PubMed] [Google Scholar]
- 3.Sonntag KC et al. Pluripotent stem cell-based therapy for Parkinson’s disease: Current status and future prospects. Prog Neurobiol 168, 1–20, doi: 10.1016/j.pneurobio.2018.04.005 (2018). [DOI] [PMC free article] [PubMed] [Google Scholar]
- 4.Cohen DE & Melton D Turning straw into gold: directing cell fate for regenerative medicine. Nature Reviews Genetics 12, 243–252 (2011). [DOI] [PubMed] [Google Scholar]
- 5.Yu X, Nagai J & Khakh BS Improved tools to study astrocytes. Nat Rev Neurosci 21, 121–138, doi: 10.1038/s41583-020-0264-8 (2020). [DOI] [PubMed] [Google Scholar]
- 6.Rivetti di Val Cervo P et al. Induction of functional dopamine neurons from human astrocytes in vitro and mouse astrocytes in a Parkinson’s disease model. Nat Biotechnol 35, 444–452, doi: 10.1038/nbt.3835 (2017). [DOI] [PubMed] [Google Scholar]
- 7.Wu Z et al. Gene therapy conversion of striatal astrocytes into GABAergic neurons in mouse models of Huntington’s disease. Nat Commun 11, 1105, doi: 10.1038/s41467-020-14855-3 (2020). [DOI] [PMC free article] [PubMed] [Google Scholar]
- 8.Gascon S, Masserdotti G, Russo GL & Gotz M Direct Neuronal Reprogramming: Achievements, Hurdles, and New Roads to Success. Cell Stem Cell 21, 18–34, doi: 10.1016/j.stem.2017.06.011 (2017). [DOI] [PubMed] [Google Scholar]
- 9.Xue Y et al. Direct conversion of fibroblasts to neurons by reprogramming PTB-regulated microRNA circuits. Cell 152, 82–96, doi: 10.1016/j.cell.2012.11.045 (2013). [DOI] [PMC free article] [PubMed] [Google Scholar]
- 10.Xue Y et al. Sequential regulatory loops as key gatekeepers for neuronal reprogramming in human cells. Nat Neurosci 19, 807–815, doi: 10.1038/nn.4297 (2016). [DOI] [PMC free article] [PubMed] [Google Scholar]
- 11.Hu J, Qian H, Xue Y & Fu XD PTB/nPTB: master regulators of neuronal fate in mammals. Biophys Rep 4, 204–214, doi: 10.1007/s41048-018-0066-y (2018). [DOI] [PMC free article] [PubMed] [Google Scholar]
- 12.Bennett CF, Krainer AR & Cleveland DW Antisense Oligonucleotide Therapies for Neurodegenerative Diseases. Annu Rev Neurosci 42, 385–406, doi: 10.1146/annurev-neuro-070918-050501 (2019). [DOI] [PMC free article] [PubMed] [Google Scholar]
- 13.Guo Z et al. In vivo direct reprogramming of reactive glial cells into functional neurons after brain injury and in an Alzheimer’s disease model. Cell stem cell 14, 188–202 (2014). [DOI] [PMC free article] [PubMed] [Google Scholar]
- 14.Lu T et al. REST and stress resistance in ageing and Alzheimer’s disease. Nature 507, 448–454, doi: 10.1038/nature13163 (2014). [DOI] [PMC free article] [PubMed] [Google Scholar]
- 15.Li Q et al. The splicing regulator PTBP2 controls a program of embryonic splicing required for neuronal maturation. Elife 3, e01201 (2014). [DOI] [PMC free article] [PubMed] [Google Scholar]
- 16.Laywell ED, Rakic P, Kukekov VG, Holland EC & Steindler DA Identification of a multipotent astrocytic stem cell in the immature and adult mouse brain. Proceedings of the National Academy of Sciences 97, 13883–13888 (2000). [DOI] [PMC free article] [PubMed] [Google Scholar]
- 17.Sofroniew MV Transgenic techniques for cell ablation or molecular deletion to investigate functions of astrocytes and other GFAP-expressing cell types. Astrocytes: Methods and Protocols, 531–544 (2012). [DOI] [PubMed] [Google Scholar]
- 18.Tateno T & Robinson HP The mechanism of ethanol action on midbrain dopaminergic neuron firing: a dynamic-clamp study of the role of I(h) and GABAergic synaptic integration. J Neurophysiol 106, 1901–1922, doi: 10.1152/jn.00162.2011 (2011). [DOI] [PubMed] [Google Scholar]
- 19.Kimm T, Khaliq ZM & Bean BP Differential Regulation of Action Potential Shape and Burst-Frequency Firing by BK and Kv2 Channels in Substantia Nigra Dopaminergic Neurons. J Neurosci 35, 16404–16417, doi: 10.1523/JNEUROSCI.5291-14.2015 (2015). [DOI] [PMC free article] [PubMed] [Google Scholar]
- 20.Boisvert MM, Erikson GA, Shokhirev MN & Allen NJ The aging astrocyte transcriptome from multiple regions of the mouse brain. Cell Reports 22, 269–285 (2018). [DOI] [PMC free article] [PubMed] [Google Scholar]
- 21.Nott A et al. Brain cell type-specific enhancer-promoter interactome maps and disease-risk association. Science 366, 1134–1139, doi: 10.1126/science.aay0793 (2019). [DOI] [PMC free article] [PubMed] [Google Scholar]
- 22.Grealish S et al. Human ESC-derived dopamine neurons show similar preclinical efficacy and potency to fetal neurons when grafted in a rat model of Parkinson’s disease. Cell Stem Cell 15, 653–665, doi: 10.1016/j.stem.2014.09.017 (2014). [DOI] [PMC free article] [PubMed] [Google Scholar]
- 23.Grealish S et al. Human ESC-derived dopamine neurons show similar preclinical efficacy and potency to fetal neurons when grafted in a rat model of Parkinson’s disease. Cell stem cell 15, 653–665 (2014). [DOI] [PMC free article] [PubMed] [Google Scholar]
- 24.Thiele SL, Warre R & Nash JE Development of a unilaterally-lesioned 6-OHDA mouse model of Parkinson’s disease. Journal of visualized experiments: JoVE 60, 3234 (2012). [DOI] [PMC free article] [PubMed] [Google Scholar]
- 25.Beal MF Parkinson’s disease: a model dilemma. Nature 466, S8–S10 (2010). [DOI] [PubMed] [Google Scholar]
- 26.Stott SR & Barker RA Time course of dopamine neuron loss and glial response in the 6‐OHDA striatal mouse model of P arkinson’s disease. European Journal of Neuroscience 39, 1042–1056 (2014). [DOI] [PubMed] [Google Scholar]
- 27.Boix J, Padel T & Paul G A partial lesion model of Parkinson’s disease in mice--characterization of a 6-OHDA-induced medial forebrain bundle lesion. Behav Brain Res 284, 196–206, doi: 10.1016/j.bbr.2015.01.053 (2015). [DOI] [PubMed] [Google Scholar]
- 28.Zhu H & Roth BL DREADD: a chemogenetic GPCR signaling platform. Int J Neuropsychopharmacol 18, doi: 10.1093/ijnp/pyu007 (2014). [DOI] [PMC free article] [PubMed] [Google Scholar]
- 29.Armbruster BN, Li X, Pausch MH, Herlitze S & Roth BL Evolving the lock to fit the key to create a family of G protein-coupled receptors potently activated by an inert ligand. Proceedings of the National Academy of Sciences 104, 5163–5168, doi: 10.1073/pnas.0700293104 (2007). [DOI] [PMC free article] [PubMed] [Google Scholar]
- 30.Chen Y et al. Chemical Control of Grafted Human PSC-Derived Neurons in a Mouse Model of Parkinson’s Disease. Cell Stem Cell 18, 817–826 (2016). [DOI] [PMC free article] [PubMed] [Google Scholar]
- 31.Ouyang H et al. WNT7A and PAX6 define corneal epithelium homeostasis and pathogenesis. Nature 511, 358 (2014). [DOI] [PMC free article] [PubMed] [Google Scholar]
- 32.Martin M Cutadapt removes adapter sequences from high-throughput sequencing reads. EMBnet. journal 17, 10–12 (2011). [Google Scholar]
- 33.Srivastava A, Malik L, Smith T, Sudbery I & Patro R Alevin efficiently estimates accurate gene abundances from dscRNA-seq data. Genome biology 20, 65 (2019). [DOI] [PMC free article] [PubMed] [Google Scholar]
- 34.Love MI, Huber W & Anders S Moderated estimation of fold change and dispersion for RNA-seq data with DESeq2. Genome biology 15, 550 (2014). [DOI] [PMC free article] [PubMed] [Google Scholar]
- 35.Abercrombie M Estimation of nuclear population from microtome sections. The anatomical record 94, 239–247 (1946). [DOI] [PubMed] [Google Scholar]
- 36.Falk T et al. Vascular endothelial growth factor-B is neuroprotective in an in vivo rat model of Parkinson’s disease. Neuroscience Letters 496, 43–47 (2011). [DOI] [PubMed] [Google Scholar]
- 37.Baker H, Joh TH & Reis DJ Genetic control of number of midbrain dopaminergic neurons in inbred strains of mice: relationship to size and neuronal density of the striatum. Proceedings of the National Academy of Sciences 77, 4369–4373 (1980). [DOI] [PMC free article] [PubMed] [Google Scholar]
- 38.Grealish S et al. Human ESC-derived dopamine neurons show similar preclinical efficacy and potency to fetal neurons when grafted in a rat model of Parkinson’s disease. Cell Stem Cell 15, 653–665 (2014). [DOI] [PMC free article] [PubMed] [Google Scholar]
- 39.Kordower JH et al. Neurodegeneration prevented by lentiviral vector delivery of GDNF in primate models of Parkinson’s disease. Science 290, 767–773 (2000). [DOI] [PubMed] [Google Scholar]
- 40.Bahat-Stroomza M et al. Induction of adult human bone marrow mesenchymal stromal cells into functional astrocyte-like cells: potential for restorative treatment in Parkinson’s disease. Journal of Molecular Neuroscience 39, 199–210 (2009). [DOI] [PubMed] [Google Scholar]
- 41.Liu G, Chen J & Ma Y Simultaneous determination of catecholamines and polyamines in PC-12 cell extracts by micellar electrokinetic capillary chromatography with ultraviolet absorbance detection. Journal of Chromatography B 805, 281–288 (2004). [DOI] [PubMed] [Google Scholar]
- 42.De Benedetto GE et al. A rapid and simple method for the determination of 3, 4-dihydroxyphenylacetic acid, norepinephrine, dopamine, and serotonin in mouse brain homogenate by HPLC with fluorimetric detection. Journal of pharmaceutical and biomedical analysis 98, 266–270 (2014). [DOI] [PubMed] [Google Scholar]
- 43.Tareke E, Bowyer JF & Doerge DR Quantification of rat brain neurotransmitters and metabolites using liquid chromatography/electrospray tandem mass spectrometry and comparison with liquid chromatography/electrochemical detection. Rapid Communications in Mass Spectrometry: An International Journal Devoted to the Rapid Dissemination of Up‐to‐the‐Minute Research in Mass Spectrometry 21, 3898–3904 (2007). [DOI] [PubMed] [Google Scholar]
- 44.Wang SR et al. Role of vesicle pools in action potential pattern-dependent dopamine overflow in rat striatum in vivo. J Neurochem 119, 342–353, doi: 10.1111/j.1471-4159.2011.07440.x (2011). [DOI] [PubMed] [Google Scholar]
- 45.Xu H et al. Striatal dopamine release in a schizophrenia mouse model measured by electrochemical amperometry in vivo. Analyst 140, 3840–3845, doi: 10.1039/c4an02074j (2015). [DOI] [PubMed] [Google Scholar]
- 46.Wang C et al. Synaptotagmin-11 is a critical mediator of parkin-linked neurotoxicity and Parkinson’s disease-like pathology. Nature communications 9, 81, doi: 10.1038/s41467-017-02593-y (2018). [DOI] [PMC free article] [PubMed] [Google Scholar]
- 47.Wang L et al. Modulation of dopamine release in the striatum by physiologically relevant levels of nicotine. Nature communications 5, 3925, doi: 10.1038/ncomms4925 (2014). [DOI] [PubMed] [Google Scholar]
- 48.Caiazzo M et al. Direct generation of functional dopaminergic neurons from mouse and human fibroblasts. Nature 476, 224–227 (2011). [DOI] [PubMed] [Google Scholar]
- 49.Grealish S, Mattsson B, Draxler P & Björklund A Characterisation of behavioural and neurodegenerative changes induced by intranigral 6‐hydroxydopamine lesions in a mouse model of Parkinson’s disease. European Journal of Neuroscience 31, 2266–2278 (2010). [DOI] [PubMed] [Google Scholar]
- 50.Piallat B, Benazzouz A & Benabid AL Subthalamic nucleus lesion in rats prevents dopaminergic nigral neuron degeneration after striatal 6‐OHDA injection: behavioural and immunohistochemical studies. European Journal of Neuroscience 8, 1408–1414 (1996). [DOI] [PubMed] [Google Scholar]
- 51.Dunnett SB, Bjo A, Stenevi U & Iversen SD Behavioural recovery following transplantation of substantia nigra in rats subjected to 6-OHDA lesions of the nigrostriatal pathway. I. Unilateral lesions. Brain research 215, 147–161 (1981). [DOI] [PubMed] [Google Scholar]
- 52.Iancu R, Mohapel P, Brundin P & Paul G Behavioral characterization of a unilateral 6-OHDA-lesion model of Parkinson’s disease in mice. Behavioural Brain Research 162, 1–10 (2005). [DOI] [PubMed] [Google Scholar]
- 53.Boix J, Padel T & Paul G A partial lesion model of Parkinson’s disease in mice–Characterization of a 6-OHDA-induced medial forebrain bundle lesion. Behavioural Brain Research 284, 196–206 (2015). [DOI] [PubMed] [Google Scholar]
- 54.Chen Y et al. Chemical Control of Grafted Human PSC-Derived Neurons in a Mouse Model of Parkinson’s Disease. Cell Stem Cell 18, 817–826 (2016). [DOI] [PMC free article] [PubMed] [Google Scholar]
- 55.Cohen J Statistical power analysis for the behavioral sciences Report No. 0805802835, 66–67 (New York, 1988). [Google Scholar]
- 56.Cohen J Eta-squared and partial eta-squared in fixed factor ANOVA designs. Educational and psychological measurement 33, 107–112 (1973). [Google Scholar]
Associated Data
This section collects any data citations, data availability statements, or supplementary materials included in this article.


