

Abstract
Introduction
The apolipoprotein E (APOE) ε4 allele is the main genetic risk factor for Alzheimer's disease (AD), accelerated cognitive aging, and hippocampal atrophy, but its influence on the association between hippocampus atrophy and episodic‐memory decline in non‐demented individuals remains unclear.
Methods
We analyzed longitudinal (two to six observations) magnetic resonance imaging (MRI)–derived hippocampal volumes and episodic memory from 748 individuals (55 to 90 years at baseline, 50% female) from the European Lifebrain consortium.
Results
The change‐change association for hippocampal volume and memory was significant only in ε4 carriers (N = 173, r = 0.21, P = .007; non‐carriers: N = 467, r = 0.073, P = .117). The linear relationship was significantly steeper for the carriers [t(629) = 2.4, P = .013]. A similar trend toward a stronger change‐change relation for carriers was seen in a subsample with more than two assessments.
Discussion
These findings provide evidence for a difference in hippocampus‐memory association between ε4 carriers and non‐carriers, thus highlighting how genetic factors modulate the translation of the AD‐related pathophysiological cascade into cognitive deficits.
Keywords: apolipoprotein (APOE) ε4, hippocampus, longitudinal, memory, MRI
1. INTRODUCTION
The ε4 allele of the apolipoprotein E (APOE) gene is the major genetic risk factor for late‐onset Alzheimer's disease (AD). 1 , 2 , 3 Studies show accelerated hippocampal 4 and episodic‐memory 5 decline in AD patients with the APOE ε4 allele. In a study of Alzheimer's disease (AD) and dementia with Lewy bodies, an association between memory recall scores and hippocampal volume was restricted to APOE ε4 carriers. 6 Such a change‐change relation provides evidence for correlated changes of hippocampus structure and memory in APOE ε4 carriers. The lack of an association in ε4 non‐carriers was suggested to be due to other factors being more relevant for the hippocampus‐memory relation in this group. This suggestion is in line with a model in which genetic variation influences how the AD pathological changes confer greater cognitive impairment in some individuals, that is, those with more risk alleles. 7 As such, this topic pertains to the fundamental clinical and preclinical question of how various pathophysiological brain changes translate into cognitive impairment in different individuals.
In non‐demented individuals, the support for a longitudinal hippocampus‐episodic memory change‐change relation is limited, 8 , 9 , 10 , 11 but APOE ε4 has been associated with accelerated cognitive aging 12 , 13 , 14 and hippocampal atrophy. 15 , 16 Thus a differential influence of APOE ε4 on brain‐cognition associations, reflecting greater phenotype‐relevant heterogeneity in non‐carriers, might characterize also cognitively normal older adults and preclinical dementia. However, no study to date has comprehensively assessed the longitudinal interrelationships among hippocampus atrophy, episodic‐memory decline, and APOE ε4 in healthy, non‐demented individuals.
Herein, we tested the hypothesis of a difference in longitudinal relations between hippocampal atrophy and linear episodic memory changes between non‐demented APOE ε4 carriers and non‐carriers.
2. METHODS
2.1. Lifebrain sample
The sample was derived from the European Lifebrain project ( 17 ; www.lifebrain.uio.no). In the present analyses, individuals from six studies within four sites 18 , 19 , 20 , 21 , 22 , 23 , 24 , 25 were included (Table 1, see also Supplementary material or 26 for the inclusion criteria for each study). Healthy non‐demented study participants at least 55 years old at first measurement occasion with both memory and hippocampus measurements available (“baseline” in what follows) and with at least two memory and hippocampus measurements at least 2 years apart were included. For individuals with several follow‐up measures available, the first measurement after a minimum of 2 years from baseline was considered as a follow‐up. In total, data on longitudinal annual changes in hippocampal volume and episodic memory were available for 748 individuals. Data on change over multiple (ie, more than two) assessments of memory and hippocampus volume involved 214 participants (841 observations) from the Barcelona and Oslo cohorts. For these individuals, the follow‐up time was up to 11 years (for descriptive data, see Supplementary Table 1; for number of subjects per number of available measurements, see Supplementary Table 2).
TABLE 1.
Sample characteristics
| Study | Unique participants | Mean baseline age (range) | Sex (%female /%male) | Mean baseline MMSE (range)/not available | Mean years of education (range)/not available | APOE 4 (carrier/non‐carrier/APOE status not available) | Mean follow‐up interval (range) |
|---|---|---|---|---|---|---|---|
| Barcelona/WAHA | 40 | 68.92 (64,76) | 68/32 | 29 (25,30)/0 | 10.8 (2,18)/0 | 7/33/0 | 3.28 (2,5) |
| Berlin/Base II | 166 | 69.95 (61,80) | 40/60 | 28.5 (22,30)/11 | 14.2 (7,18)/12 | 40/125/1 | 2.54 (2,3) |
| Oslo/CERAD | 87 | 73.53 (64,90) | 55/45 | 29.2 (25,30)/0 | 15 (7,23)/13 | 34/40/13 | 3.88 (2,6) |
| Oslo/CVLT | 203 | 67.67 (55,85) | 57/43 | 29 (26,30)/0 | 15.8 (8,22)/2 | 30/85/88 | 3.44 (2,9) |
| Umeå/Betula | 138 | 64.35 (55,80) | 46/54 | 28.1 (24,30)/0 | 13.3 (6,26) | 34/99/5 | 4.74 (4,5) |
| Umeå/ COBRA | 114 | 66.17 (64,68) | 46/54 | 29.3 (27, 30)/0 | 13.3 (7,25) | 28/85/1 | 5 (5,5) |
| Total | 748 | 68.08 (55,90) | 50/50 | 28.8 (22,30)/11 | 14.2 (2, 26)/27 | 173/467/108 | 3.76 (2,9) |
2.2. Assessments of episodic memory
Each of the participating studies contributed with one or several measures of episodic memory. Table 2 summarizes the tasks used in each study, and Supplementary Figure 1 illustrates the distribution of individual tests at baseline. To define an episodic‐memory score for each study, we scaled scores for each individual test by mean and standard deviation of the respective test at study baseline. Then we used the mean of scaled test scores as an episodic memory score at each measurement occasion. Note that scaling was performed by study because of the different scales of tests across data sets, but study was added as a covariate in the analyses.
TABLE 2.
Memory assessments
| Study | Episodic memory tasks | Source for test description/dataset |
|---|---|---|
| Barcelona/WAHA | Rey Auditory Verbal Learning total score, Rey Auditory Verbal Learning Test delayed recall, Rey Complex Figure Test |
Rajaram et al., 2017 18 Vaqué‐Alcázar et al., 2020 25 |
| Berlin/Base II | Verbal Learning and Memory Test (combined immediate and delayed recall), Scene Encoding task (2.5 h delayed recall), Face–Profession task (3 min delayed recall), Object Location task (immediate recall) |
Bertram et al., 2014 19 Gerstorf et al., 2016 50 |
| Oslo/CERAD | Consortium to Establish a Registry for Alzheimer's Disease (CERAD) 10‐min delayed recall task | Fjell et al., 2018 20 |
| Oslo/CVLT | California learning Verbal test, California learning Verbal test 5‐min free recall, California learning Verbal test 30 min free recall | Langnes et al., 2020 23 |
| Umeå/Betula | Immediate recall of sentences, Delayed cued recall of words, Immediate recall of words | Nilsson et al., 1997 21 |
| Umeå/COBRA | Word recall, Number recall, Object‐position recall (all immediate recall) | Nevalainen et al., 2015 22 |
2.3. Magnetic resonance imaging acquisition and analysis
Lifebrain MRI data originated from six different scanners (Table 3), processed with FreeSurfer 6.0 (https://surfer.nmr.mgh.harvard.edu/), generating hippocampal and intracranial volume estimates. Because FreeSurfer is almost fully automated, to avoid introducing possible study‐specific biases, gross quality control measures were imposed and no manual editing was done. To assess the influence of scanner on hippocampal volume estimates, seven participants were scanned on seven different Lifebrain scanners. 26 As reported in, 26 there was a significant main effect of scanner on hippocampal volume (F = 4.13 [2.1, 30], P = .046) in this sample. However, the between‐participant rank order was almost perfectly retained between scanners. In addition, a mean of pairwise Pearson correlations between bilateral hippocampal volumes measured by different scanners was r = 0.98 (range 0.94 to 1.00).
TABLE 3.
MRI acquisition parameters
| Study | Scanner | Tesla | Sequence parameters |
|---|---|---|---|
| Barcelona/WAHA | Tim Trio Siemens | 3.0 | TR: 2300 ms, TE: 2.98 ms, TI: 900 ms, flip angle: 9°, slice thickness 1 mm, FoV 256 × 256 mm, 240 slices |
| Berlin/Base II | Tim Trio Siemens | 3.0 | TR: 2500 ms, TE: 4.77 ms, TI: 1100 ms, flip angle: 7°, slice thickness: 1 mm, FoV 256 × 256 mm, 176 slices |
| Oslo/CERAD | Avanto Siemens | 1.5 | TR: 2400 ms, TE: 3.79 ms, TI: 1000 ms, flip angle: 8°, slice thickness: 1.2 mm, FoV: 240 × 240 mm, 160 slices |
| Oslo/CVLT | Avanto Siemens | 1.5 | TR: 2400 ms, TE: 3.61 ms, TI: 1000 ms, flip angle: 8°, slice thickness: 1.2 mm, FoV: 240 × 240 mm, 160 slices, iPat = 2 |
| Skyra Siemens | 3.0 | TR: 2300 ms, TE: 2.98 ms, TI: 850 ms, flip angle: 8°, slice thickness: 1 mm, FoV: 256 × 256 mm, 176 slices | |
| Umeå/Betula | Discovery GE | 3.0 | TR: 8.2 ms, TE: 3.2 ms, TI: 450 ms, flip angle: 12°, slice thickness: 1 mm, FoV 250 × 250 mm, 176 slices |
| Umeå/COBRA | Discovery GE | 3.0 | TR: 8.2 ms, TE: 3.2ms, TI: 450 ms, flip angle: 12°, slice thickness: 1mm, FoV 250 × 250 mm, 176 slices. |
FoV, field of view; iPat, in‐plane acceleration; TE, echo time; TI, inversion time; TR, repetition time.
RESEARCH IN CONTEXT
Systematic review: Previous studies have shown that the apolipoprotein E (APOE) ε4 allele confers elevated risk for Alzheimer's disease (AD), accelerated cognitive aging, and hippocampal atrophy. This work is properly cited. The influence of APOE ε4 on the association between hippocampal atrophy and episodic‐memory decline in non‐demented individuals remains unclear.
Interpretation: Our finding of a differential longitudinal change‐change association for hippocampus and memory in APOE ε4 carriers compared to non‐carriers supports a model in which genetic factors modulate the translation of the AD‐related pathophysiological cascade into memory deficits.
Future directions: We propose validation of our findings in forthcoming multi‐wave longitudinal studies of brain‐cognition relations, combined with appropriate statistical methods for analyzing longitudinal data. Future investigations can specify the exact mechanisms that foster differences in hippocampus‐memory relations between APOE ε4 carriers and non‐carriers.
2.4. Statistical analyses
Analyses were run in R 3.4.4, 27 and the code for the analyses is provided in the Supplementary material.
We considered a linear change of episodic memory and bilateral hippocampus volume. The linear change was estimated for each participant individually as the ordinary least squares slope estimate in the linear regression of memory score (or hippocampus volume) against the participant's age.
Measurements only at two occasions were available for 71% of the subjects in the sample. Therefore, we provide analyses of two estimates of linear change.
First, to be consistent in the number of measurements used in estimation, we estimated the linear change using two measurements for each participant. Note that in this case, the ordinary least squares slope is equal to the annual change, calculated as
where is the memory score or hippocampus volume at the baseline for subject and is the value of the respective measure at the follow‐up. We refer to such estimates of linear changes using two measurements as “annual changes” further in the text.
Second, a subsample of participants from the Oslo and Barcelona cohorts had more than two repeated measurements available (see Supplementary Table 2 for a number of participants by the amount of repeated measures). Therefore, in the second analysis, for these subjects, the second measure of the linear change was defined as the ordinary least squares slope estimated using all available repeated observations. In what follows, we refer to such estimators of linear changes as “slopes.”
For description of the relation between the longitudinal observations and age, we used the linear mixed‐effect model with a linear term for age and a random intercept for each subject and generalized additive mixed model (GAMM, 28 using gamm4 R package 29 ) with a semiparametric term for age and a random intercept for each subject. 26 Akaike information criterion, bayesian information criterion, and likelihood ratio tests were used to compare the GAMM and the linear mixed effect model fit to the observed data (see Supplementary materials for details on fitting and R code).
Next, we used partial correlations adjusted for age at baseline, sex, and study to test the significance of hippocampus‐memory change‐change associations. Study was included as a covariate in the analyses to adjust for the differences in cognitive assessments between the included studies. In addition, since for five of six included studies magnetic resonance imaging (MRI) data were obtained with the same scanner within a study, adjustment for study also captures possible differences in MRI‐derived measures due to scanner differences. Additional adjustment for the two scanners used in Oslo cohort did not change our main conclusion of differential memory‐hippocampus change‐change relation between carriers and non‐carriers.
Confidence intervals (CIs) for partial correlations were calculated using the Fisher z‐transformation and the 5% significance level.
To compare the relationship between hippocampus and episodic memory changes for APOE ε4 carriers and non‐carriers, we ran linear regression of memory changes on hippocampus changes, age, study, sex, an indicator of being an APOE ε4 carrier, and the interaction term between hippocampus change, and the indicator of being an APOE ε4 carrier. We used the significance of an interaction term in the linear regression to test if the relationship between hippocampus and episodic memory linear changes in APOE ε4 carriers is significantly different from the relationship in non‐carriers.
2.5. APOE ε4 status
APOE allele ε4 carriership was defined as APOE alleles ε2/ε4, ε3/ε4, or ε4/ε4. For details on genotyping methods, see the study‐specific details. 18 , 19 , 20 , 21 , 22 , 23 , 24 , 25
2.6. Data availability
The data supporting the results of the current study may be made available on reasonable request, given appropriate ethical and data protection approvals. Requests for data included in the analyses can be submitted to the relevant principal investigators of each study.
3. RESULTS
3.1. Overall results
Figure 1 shows that there was a general pattern of decline with increasing age for episodic‐memory performance as well as for hippocampus volume, with marked individual differences (see also Supplementary Table 3). Semiparametric GAMMs 28 fit to the data suggested a significant relation of age to both hippocampus and memory, and a non‐linear trend for hippocampus volume (see Supplementary material for details and additional Supplementary Figure 2 for the relation of baseline measures and annual changes to baseline age).
FIGURE 1.
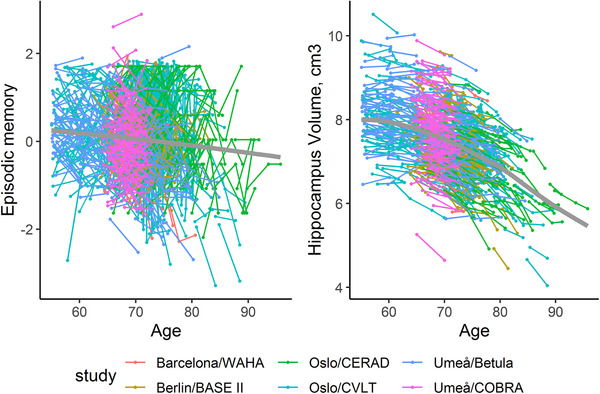
Individual trajectories for memory and hippocampal change (based on all longitudinal observations). The bold gray line indicates mean change, estimated using a generalized additive mixed model. 28 See Supplementary material for details
In the total sample (N = 748), we found a statistically significant association between linear changes in hippocampus and memory estimated using two observations for each subject (see Figure 2A); partial correlation between the annual changes, adjusted for baseline age, sex, and study is r = 0.093, P = .011, 95% CI (0.02, 0.16). For the subsample with multiple assessments (N = 214), the annual change‐change association was r = 0.144, P = .037, CI (0.01, 0.27). When linear changes were estimated by slopes using all available longitudinal observations, the association of linear changes was estimated at r = 0.219, P = .001, CI (0.09, 0.34).
FIGURE 2.
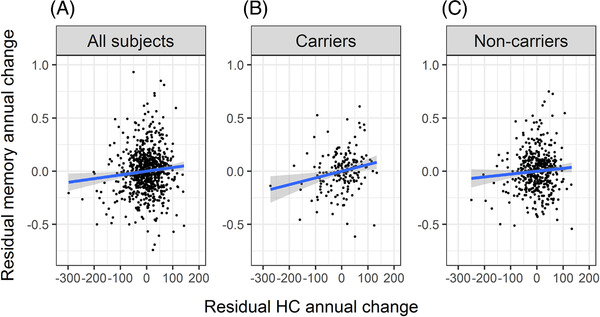
Scatterplots of the residuals from the linear regression of hippocampus annual change and episodic memory annual change on baseline age, sex, and study. Blue line—linear regression fit to the data on the scatterplots, gray area represents confidence interval. (A) Scatterplot for all subjects in the sample. (B) Scatterplot for APOE ε4 carriers. (C) Scatterplot for non‐carriers of APOE ε4. For B and C, the respective subsamples were used in calculation of the residuals
3.2. Influence of APOE ε4 on hippocampus‐memory annual‐change relations
Of 640 individuals with APOE genotyping available (Table 4), 27% were considered as carriers. This proportion varied between 17.5% and 46% across the included studies (Table 1). When stratifying the sample into APOE ε4 carriers (N = 173) and non‐carriers (N = 467), the baseline age, sex, and education distributions were similar between subgroups (Table 4). In addition, the mean follow‐up time, memory performances at baseline and follow‐up, and hippocampus volume at baseline were comparable. The only significant group difference was observed at follow‐up, with a significantly smaller hippocampus volume for APOE ε4 carriers compared to non‐carriers (Table 4).
TABLE 4.
Descriptive statistics for APOE ε4 carriers and non‐carriers
| APOE ε4 status | N | Mean baseline age (range) | % Female /male | Mean education (range) | Mean follow‐up interval (range) | Mean memory, baseline (range) | Mean memory, follow‐up (range) | Mean memory annual change(range) | Mean hippocampus volume, baseline | Mean hippocampus volume, follow‐up | Mean hippocampus annual change(range) |
|---|---|---|---|---|---|---|---|---|---|---|---|
| Carriers | 173 | 68.44 (55, 90) | 51/49 | 14.3 (2, 26) | 3.86 (2, 6) | −0.003 (−2, 2) | 0 (−3, 2) | 0.003 (−1, 1) | 7498 (5635, 9887) | 7270 (5291, 9548) | −65.11 (−379, 85) |
| Non‐carriers | 467 | 68.08 (55, 88) | 51/49 | 13.9 (4. 26) | 3.77 (2, 6) | 0.006 (−3, 3) | 0.05 (−3, 3) | 0.027 (0, 1) | 7600 (4922, 9943) | 7430 (4450, 10026) | −48.55 (−299,72) |
| Group difference | t = 0.7, df = 291, p‐v. = 0.49 | χ 2 = 0.0, df = 1, p‐val. = 1 | t = 1.3, df = 318, p‐v. = 0.19 | t = 0.9, df = 321, p‐v. = 0.37 | t = −0.14, df = 318, p‐v. = 0.9 | t = −0.71, df = 318, p‐v. = 0.48 | t = −1.34, df = 333, p‐v. = 0.18 | t = −1.42, df = 296, p‐v. = 0.16 | t = −2.1, df = 289, p‐v. = 0.04 | t = −2.74, df = 250, p‐v. = 0.007 |
Consistent with our main prediction, the association between annual changes in hippocampus volume and memory (both adjusted for baseline age, sex, and study) was significant for carriers (Figure 2B; r = 0.21, P = .007, CI (0.06, 0.35)) but not for non‐carriers (Figure 2C; r = 0.073, P = .117, CI (−0.02, 0.16)). Hippocampus atrophy explained about 4% of the heterogeneity in episodic memory decline for carriers not accounted for by age, sex, or study (partial R2 = 0.044), but <1% for non‐carriers (partial R2 = 0.005). The linear relationship between memory and hippocampal annual change was significantly steeper for APOE ε4 carriers compared to non‐carriers (the parameter for the interaction term was estimated as b = 0.0006, t = 2.4, df = 629, P = .013, two‐sided).
3.3. Influence of APOE ε4 on hippocampus‐memory slope relations
For the slope calculations, APOE data were available for 172 of the 214 participants with multiple (>2) assessments. The hippocampus‐memory slope relationship was r = 0.36 for 51 carriers (adjusted for baseline age, sex, study, P = .013, CI (0.09, 0.59)), and r = 0.22 for 121 non‐carriers (P = .018, CI (0.04, 0.38)). The hippocampus slope explained 13% of the heterogeneity in episodic memory decline not accounted for by age, sex, or study for carriers (R2 = 0.13), and 5% for non‐carriers (R2 = 0.05). The relationship between memory and hippocampal slopes was again steeper for carriers than non‐carriers, but the difference was not significant (the parameter for the interaction term was estimated as b = 0.0005, t = 0.893, df = 164, P = .37, two‐sided; z = 0.86, P = .2, one‐sided). The effect size difference was almost identical to the one found in the annual change relations, but the sample size was smaller in this analyses of individuals with multiple assessments.
4. DISCUSSION
The pooled results across the participating Lifebrain sites confirmed a relation of increasing age with hippocampus volume as well as episodic‐memory performance, along with marked individual differences. We found that age‐related longitudinal decline in episodic memory had a weak but significant positive relation to hippocampus atrophy in the total sample, comprising 748 non‐demented individuals. When the sample was stratified into APOE ε4 carriers and non‐carriers, the annual change‐change association was significant for carriers only, and the linear relation was significantly steeper for carriers compared to non‐carriers.
The finding of a robust hippocampus‐episodic memory change‐change relationship for non‐demented APOE ε4 carriers extends observations in previous studies of patients with dementia. 6 , 30 The results from a study of aged APOE ε4 knock‐in mice might offer a potential mechanism for the observed differential structure‐function relation. 31 Structurally, APOE ε4 will augment loss of γ‐aminobutyric acid (GABA)ergic interneurons in the hippocampal dentate gyrus, which functionally will disrupt slow gamma oscillations during hippocampal sharp‐wave ripples and thereby contribute to impaired learning and memory. By this view, with the caveat that our MRI data remain silent about neuron‐type and subfield‐specific changes, APOE ε4 could be a common mechanism for hippocampus structure and hippocampus‐dependent functions such as episodic memory, which translates into a hippocampus‐episodic memory change‐change relation for APOE ε4 carriers. We caution that the group difference in relationship was modest in size, so the underlying mechanisms might not be APOE‐genotype specific but rather amplified in ε4 carriers. Additional factors could also contribute to this selective effect, including breakdown of the blood‐brain barrier in the hippocampus, which in a recent paper predicted future cognitive decline in APOE ε4 carriers but not in non‐carriers. 32
The weaker structure‐function relationship in non‐carriers is likely driven by substantial phenotype‐relevant heterogeneity. That is, although hippocampus atrophy to some degree may contribute to memory decline in many older individuals, it is likely that other neurobiological changes can be more influential for certain individuals for whom hippocampus atrophy instead can be quite modest. This interpretation resonates with previous multi‐factor frameworks of cognitive aging, 33 , 34 and calls for multivariate analytic approaches that can handle sample heterogeneity in the brain‐behavior mapping. 35 , 36 For example, Lövdén et al. 35 applied latent‐profile analysis to dopamine D2 measures from cortex, hippocampus, and the striatum, and to cognitive data from measures of episodic memory, working memory, and perceptual speed. For the majority of the sample, greater receptor availability was associated with better cognition. However, for a subgroup of individuals, high striatal dopamine related to poor working‐memory performance. Such sample heterogeneity reduces the strength of overall structure‐function relations.
Relatedly, although hippocampus/brain maintenance is the strongest predictor of preserved episodic memory in aging, 37 , 38 factors like reserve and compensation might enable relatively intact performance possible despite marked brain changes. 39 , 40 By this view, some individuals with hippocampus atrophy can attain relatively good memory performance by means of effectively recruiting extrahippocampal brain networks. In non‐demented aging, elevated hippocampal resting‐state functional connectivity has been demonstrated, 41 , 42 and the older individuals with the highest hippocampal resting‐state connectivity had less extensive hippocampus‐cortical connectivity during memory encoding. 41 Elevated hippocampal resting‐state functional connectivity has also been observed in ε4 carriers, 43 which thus could reduce the effectiveness of hippocampus‐cortical network interactions during cognitive tasks and weaken compensatory processes. Conversely, based on more intact hippocampus‐cortical connectivity, APOE ε4 non‐carriers might be more apt at engaging in compensatory processes, which then would contribute toward blurring the hippocampus‐memory relation in non‐carriers.
The generally stronger change‐change associations from slope estimations based on multiple measures over longer period of time, compared with two‐time point change estimates, is predicted by past measurement theoretical work. 44 With the accumulation of multi‐wave longitudinal studies of brain‐cognition relations, combined with appropriate statistical methods for analyzing longitudinal data, 44 , 45 future analyses will likely reveal stronger change‐change relations than in the present two‐wave analyses (r = 0.093) and in past cross‐sectional meta‐analyses (r = 0.097; 46 ). Critically, future change‐change relations are still expected to be higher for ε4 carriers, as indicated by the coherent APOE patterns for annual change as well as slope in this study.
To obtain a reasonable sample size and by inference a sample representative of a wider population, we pooled data across multiple sites in the Lifebrain consortium. Similar approaches have been used elsewhere, 47 , 48 but we acknowledge that the use of different scanners and memory tasks is a limitation of the study that could have impacted the strength and consistency of the observed associations. However, we see no reason that this factor should have affected carriers and non‐carriers in different ways. Another limitation is that different procedures were used to assess the clinical status of the participants across sites. We therefore caution that our classification of participants as non‐demented should be regarded as tentative. Still, the average Mini‐Mental State Exam (MMSE) score at baseline across the entire sample of 748 individuals was close to 29, and in the five studies where MMSE data were available at follow‐up only two individuals had a score below 24, which taken together is indicative that the sample as a whole remained non‐demented at follow‐up. Moreover, we note that many of the participants have or will be followed‐up yet again within the specific sites. We note that the bigger change in hippocampus volume in ε4 carriers could have influenced the chance to observe correlations with memory change, but we view the larger negative change among carriers as part of the phenomenon under study. Finally, the Lifebrain database does not include measures of amyloid beta (Aβ) or tau, which prevented us from addressing possible mechanistic roles of Aβ and tau 6 for the difference in hippocampus‐memory relation between ε4 carriers and non‐carriers, and the sample was biased toward older age, which prevented us from evaluating whether the observed associations were age invariant.
5. CONCLUSION
In conclusion, a fundamental clinical and preclinical question concerns how various pathophysiological brain changes, such as hippocampal atrophy, translate into cognitive impairment in different individuals. The present findings provide support for the hypothesis that carriage of vital genetic risk alleles increases the risk for cognitive impairment. 7 With the emerging trend of large‐scale databases and advances in machine learning, 49 we foresee that future studies will allow better characterization of brain‐behavior relations at the individual level that will constitute an important step toward precision medicine.
CONFLICT OF INTEREST
None reported.
Supporting information
Supplementary material
ACKNOWLEDGMENTS
The Lifebrain project is funded by the EU Horizon 2020 Grant: “Healthy minds 0‐100 years: Optimising the use of European brain imaging cohorts (‘Lifebrain’).” Grant agreement number: 732592 (Lifebrain). Call: Societal challenges: Health, demographic change and well‐being. In addition, the different sub‐studies are supported by different sources: Center for Lifespan Changes in Brain and Cognition: The European Research Council's Starting/Consolidator Grant schemes under grant agreements 283634, 725025 (to A.M.F.) and 313440 (to K.B.W.), as well as the Norwegian Research Council (to A.M.F., K.B.W.), The National Association for Public Health's dementia research program, Norway (to A.M.F) and the Medical Student Research Program at the University of Oslo. Betula: a scholar grant from the Knut and Alice Wallenberg (KAW) foundation to L.N. Barcelona: Partially supported by a Spanish Ministry of Economy and Competitiveness (MINECO) grant to D‐BF [grant number PSI2015‐64227‐R (AEI/FEDER, UE)]; by the Walnuts and Healthy Aging study [http://www.clinicaltrials.gov; grant NCT01634841] funded by the California Walnut Commission, Sacramento, California. BASE‐II has been supported by the German Federal Ministry of Education and Research [grant numbers 16SV5537/16SV5837/16SV5538/16SV5536K/01UW0808/01UW0706/01GL1716A/01GL1716B] and is also part of the BMBF funded EnergI consortium [01GQ1421B].
Gorbach T, Pudas S, Bartrés‐Faz D, et al. Longitudinal association between hippocampus atrophy and episodic‐memory decline in non‐demented APOE ε4 carriers. Alzheimer's Dement. 2020;12:e12110 10.1002/dad2.12110
REFERENCES
- 1. Strittmatter WJ, Roses AD. Apolipoprotein E and Alzheimer disease. Proc Natl Acad Sci 1995;92:4725‐4727. [DOI] [PMC free article] [PubMed] [Google Scholar]
- 2. Corder EH, Saunders AM, Strittmatter WJ, et al. Gene dose of Apolipoprotein E type 4 allele and the risk of Alzheimer’ s disease in late onset families. Science 1993;261:921‐923. [DOI] [PubMed] [Google Scholar]
- 3. Lutz MW, Crenshaw DG, Saunders AM, Roses AD. Genetic variation at a single locus and age of onset for Alzheimer's disease. Alzheimers Dement 2010;6:125‐131. [DOI] [PMC free article] [PubMed] [Google Scholar]
- 4. Schuff N, Woerner N, Boreta L, et al. MRI of hippocampal volume loss in early Alzheimer's disease in relation to ApoE genotype and biomarkers. Brain 2009;132:1067‐1077. [DOI] [PMC free article] [PubMed] [Google Scholar]
- 5. Wolk DA, Dickerson BC. Apolipoprotein E (APOE) genotype has dissociable on memory and attentional‐executive network function in Alzheimer's disease. Proc Natl Acad Sci U S A 2010;107:10256‐10261. [DOI] [PMC free article] [PubMed] [Google Scholar]
- 6. Saeed U, Mirza SS, MacIntosh BJ, et al. APOE‐ε4 associates with hippocampal volume, learning, and memory across the spectrum of Alzheimer's disease and dementia with Lewy bodies. Alzheimer's Dement 2018;14:1137‐1147. [DOI] [PubMed] [Google Scholar]
- 7. Jack CR, Holtzman DM. Biomarker modeling of Alzheimer's disease. Neuron 2013;80:1347‐1358. [DOI] [PMC free article] [PubMed] [Google Scholar]
- 8. Salthouse TA. Neuroanatomical substrates of age‐related cognitive decline. Psychol Bull 2011;137:753‐784. [DOI] [PMC free article] [PubMed] [Google Scholar]
- 9. Gorbach T, Pudas S, Lundquist A, et al. Longitudinal association between hippocampus atrophy and episodic‐memory decline. Neurobiol Aging 2017;51:167‐176. [DOI] [PubMed] [Google Scholar]
- 10. Persson J, Pudas S, Lind J, Kauppi K, Nilsson L‐G, Nyberg L. Longitudinal structure‐function correlates in elderly reveal MTL dysfunction with cognitive decline. Cereb Cortex 2012;22:2297‐2304. [DOI] [PubMed] [Google Scholar]
- 11. Fjell AM, McEvoy L, Holland D, Dale AM, Walhovd KB. Brain changes in older adults at very low risk for Alzheimer's disease. J Neurosci 2013;33:8237‐82342. [DOI] [PMC free article] [PubMed] [Google Scholar]
- 12. Davies G, Harris SE, Reynolds CA, et al. A genome‐wide association study implicates the APOE locus in nonpathological cognitive ageing. Mol Psychiatry 2014;19:76‐87. [DOI] [PMC free article] [PubMed] [Google Scholar]
- 13. Small BJ, Rosnick CB, Fratiglioni L, Bäckman L. Apolipoprotein E and cognitive performance: a meta‐analysis. Psychol Aging 2004;19:592‐600. [DOI] [PubMed] [Google Scholar]
- 14. Wisdom NM, Callahan JL, Hawkins KA. The effects of apolipoprotein E on non‐impaired cognitive functioning: a meta‐analysis. Neurobiol Aging 2011;32:63‐74. [DOI] [PubMed] [Google Scholar]
- 15. Cacciaglia R, Gonzalo S, Minguill C, Fauria K, Gispert JD. Effects of APOE ‐ ε 4 allele load on brain morphology in a cohort of middle‐aged healthy individuals with enriched genetic risk for Alzheimer’ s disease. Alzheimers Dement. 2018;14:902‐912. [DOI] [PubMed] [Google Scholar]
- 16. Li B, Shi J, Gutman BA, Baxter LC, et al. Influence of APOE genotype on hippocampal atrophy over time—An N = 1925 surface‐based ADNI study. PLoS One 2016;11:1‐26. [DOI] [PMC free article] [PubMed] [Google Scholar]
- 17. Walhovd KB, Fjell AM, Westerhausen R, et al. Healthy minds 0‐100 years: optimising the use of European brain imaging cohorts (“Lifebrain”). Eur Psychiatry 2018;50:47‐56. [DOI] [PubMed] [Google Scholar]
- 18. Rajaram S, Valls‐Pedret C, Cofán M, et al. The Walnuts and Healthy Aging Study (WAHA): protocol for a nutritional intervention trial with walnuts on brain aging. Front Aging Neurosci 2017;8:1‐12. [DOI] [PMC free article] [PubMed] [Google Scholar]
- 19. Bertram L, Böckenhoff A, Demuth I, et al. Cohort profile: the Berlin Aging Study II (BASE‐II)†. Int J Epidemiol 2014;43:703‐712. [DOI] [PubMed] [Google Scholar]
- 20. Fjell AM, Idland AV, Sala‐Llonch R, et al. Neuroinflammation and tau interact with amyloid in predicting sleep problems in aging independently of atrophy. Cereb Cortex 2018;28:2775‐2785. [DOI] [PubMed] [Google Scholar]
- 21. Nilsson L‐G, Bäckman L, Erngrund K, et al. The Betula prospective cohort study: memory, health, and aging. Aging Neuropsychol Cogn 1997;4:1‐32. [Google Scholar]
- 22. Nevalainen N, Riklund K, Andersson M, et al. COBRA: a prospective multimodal imaging study of dopamine, brain structure and function, and cognition. Brain Res 2015;1612:83‐103. [DOI] [PubMed] [Google Scholar]
- 23. Langnes E, Sneve MH, Sederevicius D, Amlien IK, Walhovd KB, Fjell AM. Anterior and posterior hippocampus macro‐ and microstructure across the lifespan in relation to memory—A longitudinal study. Hippocampus 2020;30:678‐692. [DOI] [PubMed] [Google Scholar]
- 24. Chen J, Leong YC, Honey CJ, Yong CH, Norman KA, Hasson U. Shared memories reveal shared structure in neural activity across individuals. Nat Neurosci 2017;20:115‐125. [DOI] [PMC free article] [PubMed] [Google Scholar]
- 25. Vaqué‐Alcázar L, Sala‐Llonch R, Abellaneda‐Pérez K, et al. Functional and structural correlates of working memory performance and stability in healthy older adults. Brain Struct Funct 2020;225:375‐386. [DOI] [PubMed] [Google Scholar]
- 26. Fjell AM, Sørensen Ø, Amlien IK, et al. Self‐reported sleep relates to hippocampal atrophy across the adult lifespan – results from the Lifebrain consortium. Sleep 2020;43:zsz280. [DOI] [PMC free article] [PubMed] [Google Scholar]
- 27. R Core Team. R: A language and environment for statistical computing. Vienna, Austria: R Foundation for Statistical Computing; 2018.
- 28. Wood S. Generalized Additive Models: An Introduction With R. 1st ed. Boca Raton, FL: Taylor & Francis Group, LCC; 2006. [Google Scholar]
- 29. Wood S, Scheipl F. gamm4: Generalized Additive Mixed Models using “mgcv” and ’lme4 2020. Available at: https://cran.r-project.org/package=gamm4.
- 30. Hostage CA, Roy Choudhury K, Doraiswamy PM, Petrella JR. Dissecting the gene dose‐effects of the APOE ε4 and ε2 alleles on hippocampal volumes in aging and Alzheimer's disease. PLoS One 2013;8:e54483. [DOI] [PMC free article] [PubMed] [Google Scholar]
- 31. Gillespie AK, Jones EA, Lin Y‐H, et al. Apolipoprotein E4 causes age‐dependent disruption of slow gamma oscillations during hippocampal sharp‐wave ripples. Neuron 2016;90:740‐751. [DOI] [PMC free article] [PubMed] [Google Scholar]
- 32. Montagne A, Nation DA, Sagare AP, et al. APOE4 leads to blood–brain barrier dysfunction predicting cognitive decline. Nature 2020;581:71‐76. [DOI] [PMC free article] [PubMed] [Google Scholar]
- 33. Buckner RL. Memory and executive function in aging and AD: multiple factors that cause decline and reserve factors that compensate. Neuron 2004;44:195‐208. [DOI] [PubMed] [Google Scholar]
- 34. Hedden T, Gabrieli JDE. Insights into the ageing mind: a view from cognitive neuroscience. Nat Rev Neurosci 2004;5:87‐96. [DOI] [PubMed] [Google Scholar]
- 35. Lövdén M, Karalija N, Andersson M, et al. Latent‐profile analysis reveals behavioral and brain correlates of dopamine‐cognition associations. Cereb Cortex 2017;28:3894‐3907. [DOI] [PMC free article] [PubMed] [Google Scholar]
- 36. Brandmaier AM, von Oertzen T, McArdle JJ, Lindenberger U. Structural equation model trees. Psychol Methods 2013;18:71‐86. [DOI] [PMC free article] [PubMed] [Google Scholar]
- 37. Nyberg L, Lövdén M, Riklund K, Lindenberger U, Bäckman L. Memory, aging and brain maintenance. Trends Cogn Sci 2012;16:292‐305. [DOI] [PubMed] [Google Scholar]
- 38. Nyberg L, Lindenberger U. Brain maintenance and cognition in old age In: Poeppel D, Mangun G, Gazzaniga M, eds. Cogn. Neurosci. VI, Cambridge, MA: MIT Press; 2020. [Google Scholar]
- 39. Cabeza R, Albert M, Belleville S, et al. Maintenance, reserve and compensation: the cognitive neuroscience of healthy ageing. Nat Rev Neurosci 2018;19:701‐710 [DOI] [PMC free article] [PubMed] [Google Scholar]
- 40. Chan D, Shafto M, Kievit R, et al. Lifestyle activities in mid‐life contribute to cognitive reserve in late‐life, independent of education, occupation, and late‐life activities. Neurobiol Aging 2018;70:180‐183. [DOI] [PMC free article] [PubMed] [Google Scholar]
- 41. Salami A, Pudas S, Nyberg L. Elevated hippocampal resting‐state connectivity underlies deficient neurocognitive function in aging. Proc Natl Acad Sci 2014;111:17654‐17659. [DOI] [PMC free article] [PubMed] [Google Scholar]
- 42. Salami A, Wåhlin A, Kaboodvand N, Lundquist A, Nyberg L. Longitudinal evidence for dissociation of anterior and posterior MTL resting‐state connectivity in aging: links to perfusion and memory. Cereb Cortex 2016;26:3953‐3963. [DOI] [PMC free article] [PubMed] [Google Scholar]
- 43. Westlye ET, Lundervold A, Rootwelt H, Lundervold AJ, Westlye LT. Increased hippocampal default mode synchronization during rest in middle‐aged and elderly APOE 4 carriers: relationships with memory performance. J Neurosci 2011;31:7775‐7783. [DOI] [PMC free article] [PubMed] [Google Scholar]
- 44. Tucker‐Drob EM, Brandmaier AM, Lindenberger U. Coupled cognitive changes in adulthood: a meta‐analysis how many causes are there of aging‐related decrements in cognitive functioning? Psychol Bull 2019;145:273‐301. [DOI] [PMC free article] [PubMed] [Google Scholar]
- 45. Kievit RA, Brandmaier AM, Ziegler G, et al. Developmental cognitive neuroscience using latent change score models: a tutorial and applications. Dev Cogn Neurosci 2018;33:99‐117. [DOI] [PMC free article] [PubMed] [Google Scholar]
- 46. Van Petten C. Relationship between hippocampal volume and memory ability in healthy individuals across the lifespan: review and meta‐analysis. Neuropsychologia 2004;42:1394‐1413. [DOI] [PubMed] [Google Scholar]
- 47. Petersen RC, Aisen PS, Beckett LA, et al. Alzheimer's Disease Neuroimaging Initiative (ADNI): clinical characterization. Neurology 2010;74:201‐209. [DOI] [PMC free article] [PubMed] [Google Scholar]
- 48.The ENIGMA‐Brain Age working group n.d. Available at: http://enigma.ini.usc.edu/ongoing/enigma-brainage/. Accessed April 2, 2020.
- 49. Smith SM, Elliott LT, Alfaro‐Almagro F, et al. Brain aging comprises many modes of structural and functional change with distinct genetic and biophysical associations. Elife 2020;9:e52677. [DOI] [PMC free article] [PubMed] [Google Scholar]
- 50. Gerstorf D, Bertram L, Lindenberger U, et al. Editorial. Gerontology 2016;62:311‐315. [DOI] [PubMed] [Google Scholar]
Associated Data
This section collects any data citations, data availability statements, or supplementary materials included in this article.
Supplementary Materials
Supplementary material
Data Availability Statement
The data supporting the results of the current study may be made available on reasonable request, given appropriate ethical and data protection approvals. Requests for data included in the analyses can be submitted to the relevant principal investigators of each study.