Abstract
Exclusive liquid repellency (ELR) describes an extreme wettability phenomenon where a liquid phase droplet is completely repelled from a solid phase when exposed to a secondary immiscible liquid phase. Earlier, we developed a multi-liquid-phase open microfluidic (or underoil) system based on ELR to facilitate rare-cell culture and single-cell processing. The ELR system can allow for the handling of small volumes of liquid droplets with ultra-low sample loss and biofouling, which makes it an attractive platform for biological applications that require lossless manipulation of rare cellular samples (especially for a limited sample size in the range of a few hundred to a few thousand cells). Here we report an automated platform using ELR microdrops for single-particle (or single-cell) isolation, identification, and retrieval. This was accomplished via the combined use of a robotic liquid handler, an automated microscopic imaging system, and a real-time image processing software for single-particle identification. The automated ELR technique enables rapid, hands-free and robust isolation of microdrop-encapsulated rare cellular samples.
Keywords: exclusive liquid repellency, multi-liquid-phase, open microfluidics, underoil, single-particle processing
Introduction
Single cells have found various important applications such as the study of cancer heterogeneity,1–3 developmental biology,4,5 neurobiology,2,6 and immunology.7,8 There is growing interest for identifying and isolating specific single cells from a heterogeneous biological sample to discover the unique cellular traits underlying biological heterogeneity. However, the isolation of single cells from a small sample pool (e.g., a few hundred to a few thousand cells) remains a highly challenging endeavor. Although current single cell isolation techniques like limiting dilution, fluorescence activated cell sorting (FACS),9 or microfluidics10–12 can allow for the isolation of single cells at relatively high-throughput, they require a relatively large sample volume and cell number to work with and could struggle to isolate single cells from a very limited sample size, which makes them unsuitable for rare-cell applications like circulating tumor cell (CTC) research.13,14 Single-cell printing techniques (e.g., from cytena) were developed to operate with only a few microliters of sample volume to isolate hundreds of single cells into micro well plates (e.g., 96 or 384 well plates) with a high yield (> 95%). The successful handling of minute amounts of samples requires an efficient liquid handling technique that has very low loss during aspiration, transfer and sample retrieval from culture. This is generally difficult using traditional single-liquid-phase liquid handling and storage equipment such as multi-well plates. Aqueous liquids generally exhibit adherence to these surfaces and thus any liquid transfer would result in residual liquid being left behind. Sample loss can be further aggregated due to nonspecific cell adhesion on solid surfaces and/or detrimental evaporation or condensation when cell culture is involved.15 Although a variety of specialized multi-liquid-phase platforms have been developed for efficiently manipulating small amounts of cell samples without significant loss, such as droplet microfluidics,16 they are usually based on a closed system design,17 which makes external access for individual cell manipulation and retrieval difficult,18,19 and also require costly and complex devices and fluid control equipment.20
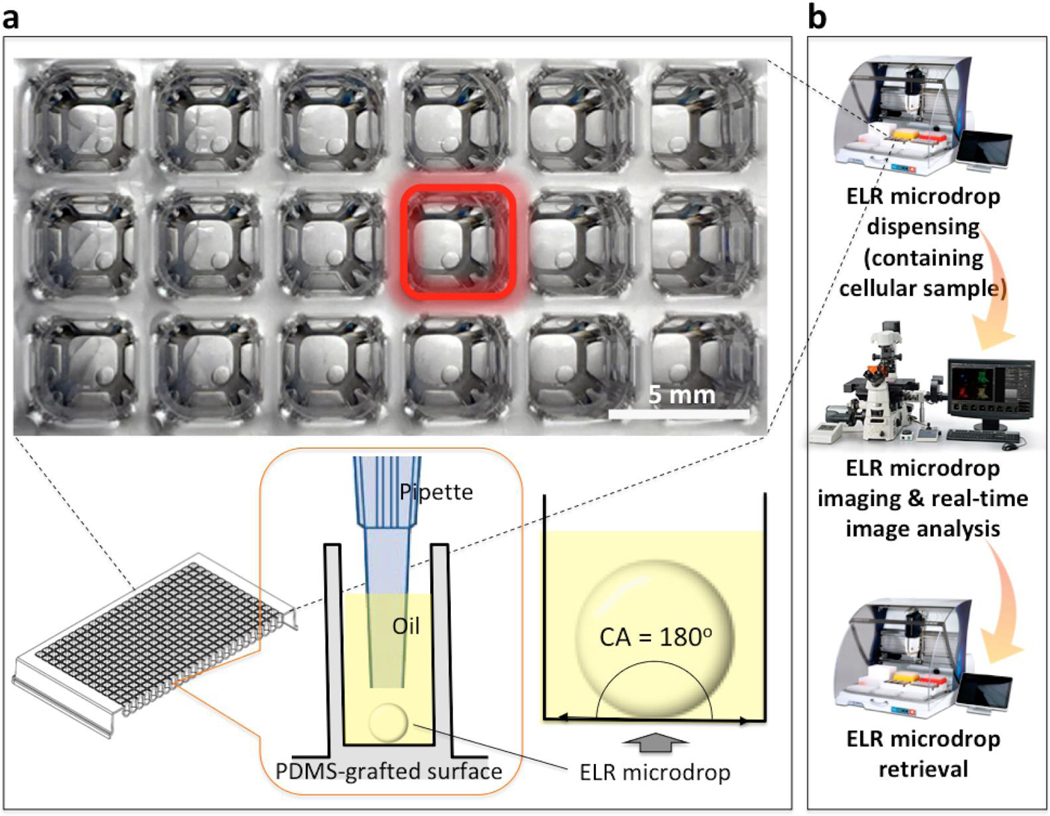
ELR describes the conditions of a solid-water-oil three-phase system that allows for complete repellency of an aqueous droplet from the solid phase, exhibiting a contact angle (CA) of 180° (Fig. 1a). The ELR system is suitable for isolation of single cells from rare samples followed by in situ cell culture in aqueous microdrops without significant sample loss.21 However, the technique previously relied on manual cell-by-cell aspiration and laborious microscope imaging for finding and identifying single cells-of-interest, which represents a barrier to broader adoptability of the technique. Here we present a method that performs rapid dispensing of ELR microdrop-encapsulated single particles into a standard 384 well plate by a programmable robotic liquid handler, single-particle imaging and identification using a custom-built real-time image processing software, and automated re-collection of microdrops containing single particles of interest (Fig. 1b).
Figure 1.
Schematic of ELR microdrop-based automated open microfluidic system. (a) Underoil (silicone oil, 5 cSt) ELR microdrops (1 μL each drop) in a PDMS-grafted 384 well plate. Microdrops dispensed under oil stayed completely repelled from adhering onto the surface (with CA = 180°). (b) Workflow for automated single-particle processing.
Materials and Methods
Conditions to achieve ELR
In previous work, the physics and design rules for ELR were discussed.21 In brief, in a solid-water-oil three-phase system ELR can be achieved only if the interfacial energies (i.e., γS/W for solid-water, γS/O for solid-oil and γW/O for water-oil) meet a boundary condition, that is γS/O + γW/O ≤ γS/W for water in oil and γS/W + γW/O ≤ γS/O for oil in water. Determined by this principle, aqueous microdrops get completely repelled with a CA of 180o from polydimethylsiloxane (PDMS) surfaces under silicone oil (Fig. 1a). The inherently non-adhesive nature between the microdrops and the substrate effectively mitigates biofouling, which allows for lossless sample retrieval after screening.
Fabrication of PDMS-grafted well plate
Standard 384 well plate (polystyrene, tissue culture treated by vacuum gas plasma, nonpyrogenic, Corning) was treated first with oxygen plasma (Diener Electronic Femto, Plasma Surface Technology, 60 W, 3 minutes) then transferred into a vacuum desiccator for vapor phase deposition of PDMS-silane (1,3-dichlorotetramethylsiloxane, Gelest, SID3372.0). 50 μL PDMS-silane was vaporized under reduced pressure in the desiccator by pumping down for 3 minutes, then condensed onto the surface of the well plate under vacuum at room temperature for 30 minutes. The PDMS-grafted well plate was thoroughly rinsed with ethanol (anhydrous, 99.5%) and DI water then dried with compressed air for use.
Preparation of stable fluorescence bead suspension
Fluorescence beads (melamine resin-based, carboxylate modified, FITC-marked, 12 μm in average diameter, Sigma-Aldrich, 90287–5ML-F) were used as model particles. The beads were dispersed in phosphate-buffered saline (PBS) containing 2 mg/mL collagen I (bovine, PureCol, Advanced BioMatrix) to give a stable suspension with a concentration of 1 bead/μL, showing no settling of the dispersed particles over time.
Results
Dispensing of bead-containing ELR microdrops
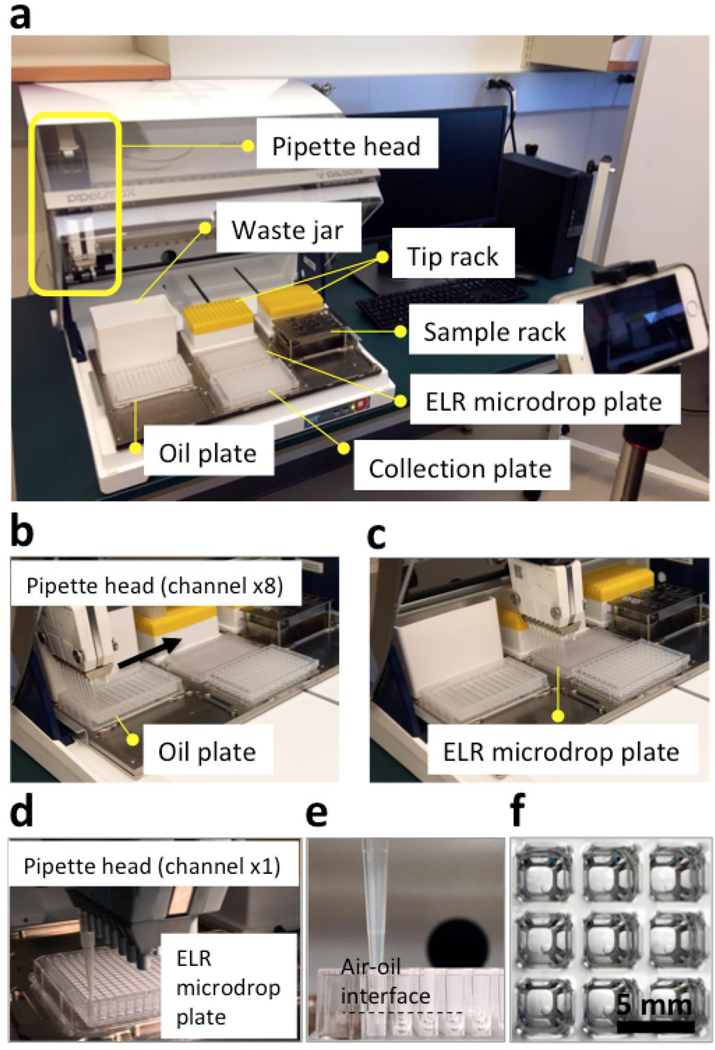
A robotic liquid handler (PIPETMAX, Gilson) was programmed for this task (Fig. 2a). (I) The ELR microdrop plate (i.e., a PDMS-grafted 384 well plate) was first prefilled with silicone oil (5 cSt) (Fig. 2b, 2c, movie S1, movie S2). Oil was stored in an oil plate (12-column, low profile reagent reservoir, Seahorse Bioscience) with 6 mL/column (x3 columns). All eight channels of the pipette head on the liquid handler were used for maximal efficiency. Each oil dispensing cycle can fill two rows of the ELR microdrop plate with 40 μL/well. The dead volume left in tips (around 20 μL x 8) was returned to the oil plate before the next dispensing cycle. Each column of the oil plate holds enough volume for four oil dispensing cycles, which fills eight rows of the ELR microdrop plate. In total, three columns of the oil plate can fill a 384 well plate in around 5 minutes. (II) Next, microdrops were dispensed to each well (Fig. 2d–2f, movie S3, movie S4). Fluorescent bead suspension (400 μL, 1 bead/μL) was stored in an Eppendorf tube (1.5 mL) on a sample rack. Only one channel of the pipette head of the liquid handler was used for microdrop dispensing to minimize dead volume and sample loss. Each dispensing cycle of the fluorescence bead suspension can fill one row of the ELR microdrop plate with 1 μL per drop. The dead volume left in the tip was returned to and collected in another Eppendorf tube on sample rack for reuse. The preparation time of the ELR microdrop plate took around 60 minutes.
Figure 2.
ELR microdrop dispensing with pipette robot. (a) Layout of the robotic liquid handler, including the pipette head and the sample bed with various components. (b) and (c) Oil prefilling of the ELR microdrop plate (i.e., a PDMS-grafted 384 well plate, 40 μL/well) using eight channels of the pipette head. (d), (e) and (f) Aqueous microdrop dispensing (fluorescence bead suspension, about 1 bead/μL, 1 μL each drop) using one channel of the pipette head. Fluorescence bead suspension was loaded from sample rack and the microdrops were dispensed under oil at the ELR microdrop plate. When the pipette left the air-oil interface, the microdrops got released from the tip.
Image-based microdrop and bead detection
The prepared ELR microdrop plate was imaged using a Nikon Ti-Eclipse widefield fluorescence microscope at 4x magnification. A single bright-field (BF) image (2 ms exposure) (Fig. 3b–3c) and a 7-slice z-stack in the 488 nm fluorescence channel (100 ms exposure, Δz = 150 μm) (Fig. 4a) were acquired for each well. Total imaging time of the plate took approximately 80 minutes (12.6 seconds per well), with overhead from microscope stage movement and channel switching that account for most of this time (94%). The slice number and spacing of the z-stack were chosen in order to minimize unnecessary overhead while sampling the full height of each ELR microdrop. Preliminary experiments with relatively fine z-resolution (Δz = 50 μm) indicated that 150 μm spacing was sufficient to meet these requirements, and beads were visible enough in at least one slice to be detected accurately (data not shown). Further reduction of the detection time is achievable if a higher-density well plate was used (e.g., 1536 well plate), due to the smaller ELR microdrops volumes and fewer z slices.
Figure 3.
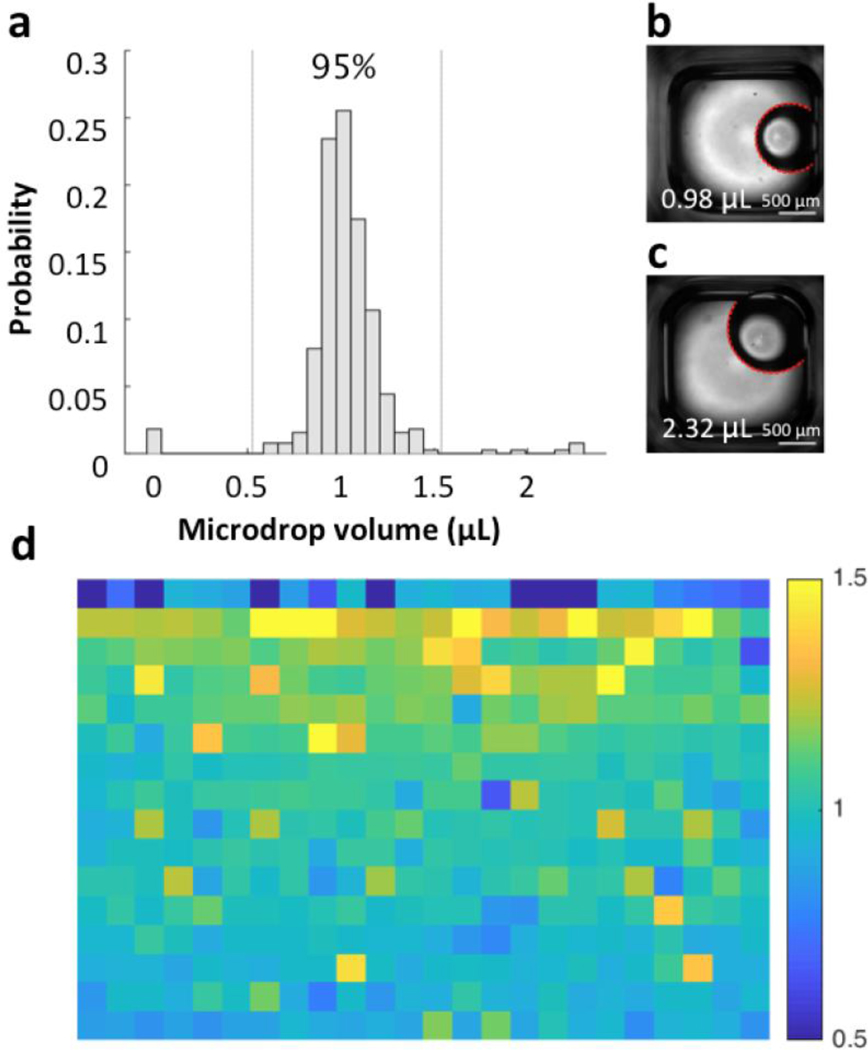
Microdrop volume. (a) Distribution of microdrop volume estimated from BF images (mean = 1.03 μL; S.D. = 0.25 μL; N = 384). Vertical lines represent the 95% confidence interval. (b) Example BF image of a typical microdrop with the fitted edge overlaid in red (volume = 0.98 μL). (c) Example image of a large microdrop (volume = 2.32 μL). The roughly doubled volume was a result of carryover of the unreleased microdrop and double release in the next well. (d) The spatial variation in microdrop volume (μL) across the ELR microdrop plate, with each pixel corresponding to a well. Wells were prepared top-to-bottom, then left-to-right.
Figure 4.
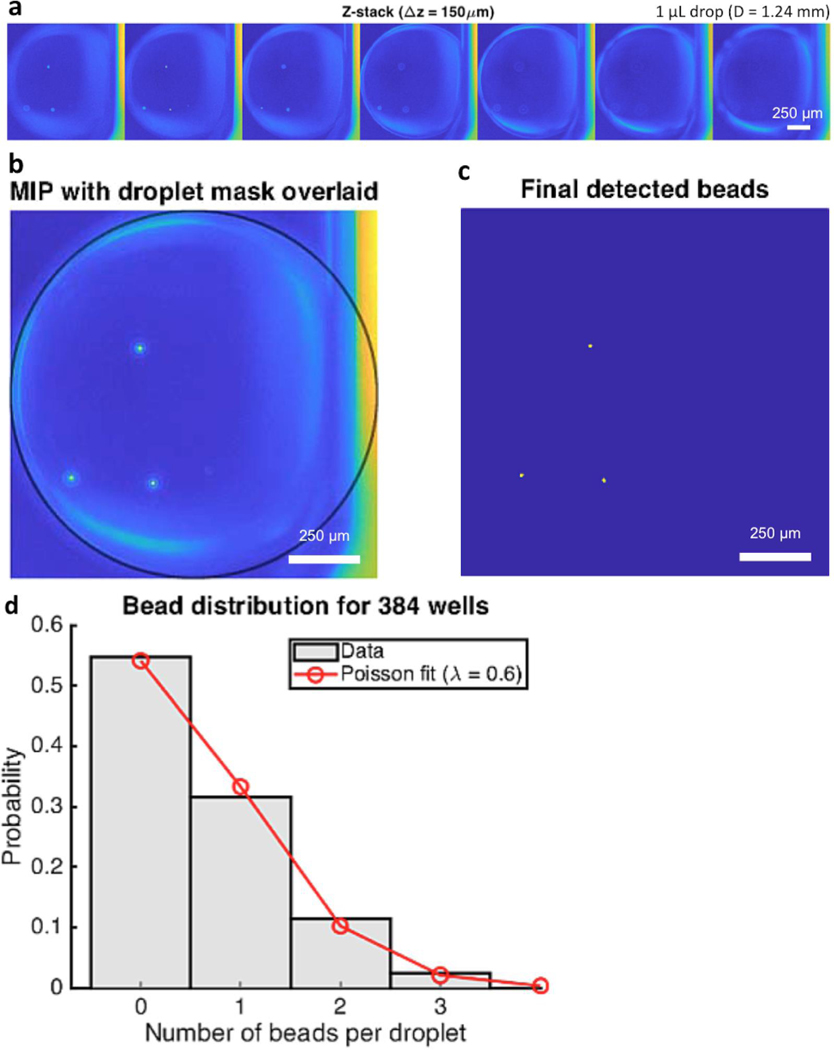
Bead detection. (a) z-stack of a detected microdrop containing fluorescence beads with a step (Δz) of 150 μm. (b) Maximum-intensity projection image generated from the z-stack. (c) Final detected beads based on a minimum CNR of 10 and a minimum area of 10 pixels. Any objects within the microdrop area meeting these criteria are considered beads. (d) The number of detected beads per well obeyed Poisson distribution with parameter λ = 0.6, with a 95% confidence interval of 0.54 – 0.69.
Fully automated bead detection was performed in real-time during image acquisition using a custom-built program written in MATLAB (MathWorks, Natick, MA). The detection algorithm consisted of a two-step process. The first step was to identify and segment the boundary of each microdrop in the BF images (Suppl. Fig. S1). Its purpose was to mitigate false positive detection by requiring that beads are located within the microdrop region. BF images were masked with an intensity threshold using the triangle method,22 and the central region corresponding to the illumination spot was isolated based on its large size. The convex deficiency of the spot (i.e., the difference between the region and its convex hull) largely consisted of pixels within the microdrop, although it also included many unwanted small regions. Most of these pixels were removed by morphological opening with a small structuring element (disk of radius 5) followed by intersection with the original spot edge. The final microdrop mask was generated by fitting a circle to the remaining edge pixels using a random sample consensus (RANSAC) fitting routine. Because remaining unwanted pixels were relatively few compared to those of the oil-water interface (i.e., the edge of each microdrop facing the well center), they were given zero weight using the RANSAC approach. The microdrop volume was calculated using the equation for a sphere with the fitted radius. The second step was to detect beads in the 488 nm fluorescence channel (Fig. 4). For each well, a maximum-intensity projection (MIP) of the z-stack was calculated. This was done so that beads occurring in different z-planes would be detected. The MIP was subsequently thresholded at a minimum contrast-to-noise ratio (CNR) of 10, and a minimum area threshold of 10 pixels was applied to remove spurious noise regions. The final mask of detected beads was generated by intersection of this result with the previously calculated microdrop mask. Computation time for real-time detection was around 2 seconds per well (~1.5 and ~0.5 seconds for the respective steps), thus negligibly affecting overall throughput.
Bead detection was validated against a manual count of beads per microdrop by an image scientist blinded to the automated results. One type of validation was to consider bead detection as a binary process (i.e., negative for zero beads and positive for at least one bead) and analyze the receiver operating characteristics (ROC; Suppl. Fig. S2). ROC curves could be calculated by varying either the CNR threshold or area threshold. However, because the detection results were relatively insensitive to a reasonable range of minimum CNR, the area threshold was considered while keeping the CNR threshold constant at 10. The area under the curve (AUC) of the ROC curve was used to assess the overall quality of the automated approach. A second type of validation was to assess the exact number of beads detected per microdrop using the intraclass correlation coefficient (ICC) (Suppl. Table S1).
Microdrop retrieval
After identification with microscopy, the microdrops were registered with their location information on the ELR microdrop plate (Fig. 5a–5c). Microdrops of interest (e.g., containing single particle or single cell in a specific phenotype) could be selectively retrieved with oil by the robotic liquid handler (Fig. 2a, movie S5, movie S6). To demonstrate the operation, an ELR microdrop plate was prepared with 1 μL microdrop of dyed water in each well. 96 microdrops were successfully harvested from the ELR microdrop plate and then transferred to a collection plate, with the emptied wells forming a “UW” pattern (Fig. 5d). To protect the microdrops (and cellular samples encapsulated) from severe deformation or bursting during aspiration, a large orifice tip with an end opening comparable or larger than the microdrops was used in this step.
Figure 5.
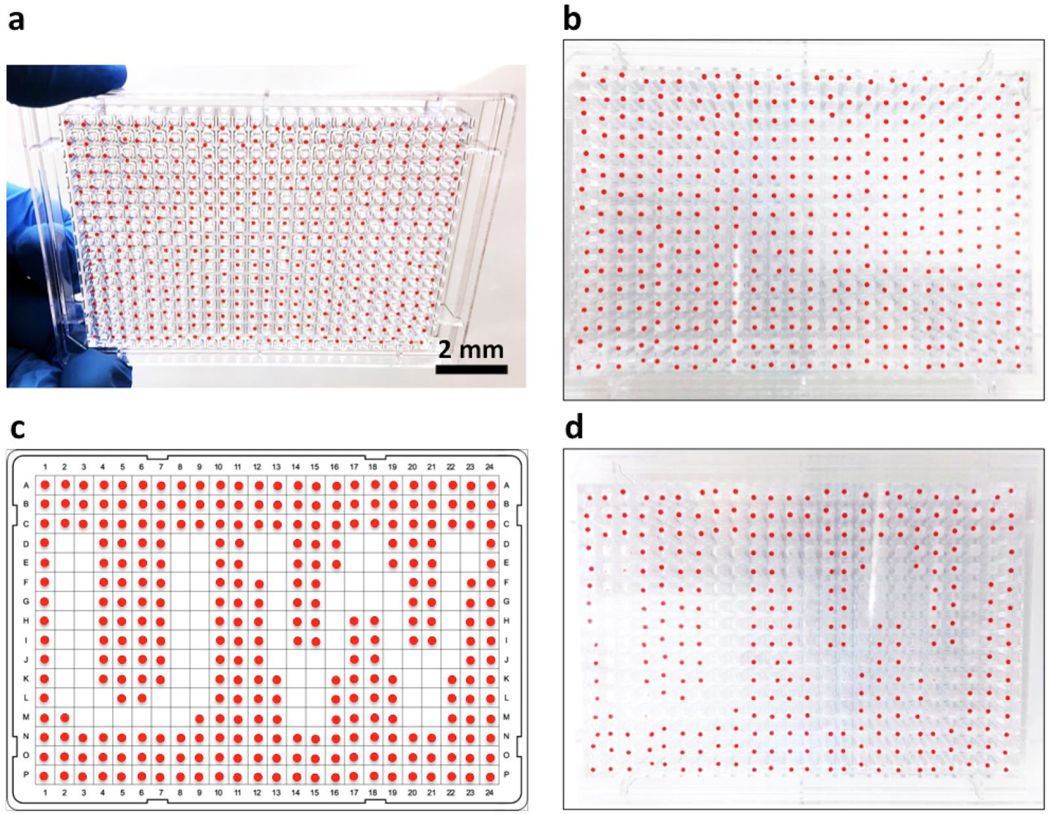
Microdrop retrieval. (a) and (b) An ELR microdrop plate (384-well) with 1 μL microdrop of dyed water (red) per well. (c) A program chart showing the locations of the microdrop to be retrieved. (d) The plate with 96 target microdrops removed. Microdrops were harvested and transferred with oil to give the minimized sample loss.
Discussion
The ELR microdrop-based open microfluidic system offers a set of characteristics enabling its use as a cell culture and screening platform,21,23 which includes (I) minimized media loss and inter-well contamination via evaporation/condensation; (II) minimized sample loss and device fouling from sample loading, culture, transfer and retrieval; (III) adjustable permeation of vital gases (e.g., oxygen, carbon dioxide); (IV) full physical access and sample manipulation on device with external tools (e.g., pipette); (V) compatibility with standard bioassay labware (e.g., well plate, culture dish); and (VI) low adoption barrier (i.e., easy-to-make and easy-to-use). Benefiting from automation enabled by a combined use of a robotic liquid handler and imaging/real-time image analysis system, human labor and operator error can be significantly reduced (Suppl. Table S2).
When preparing an ELR microdrop plate on the robotic liquid handler, liquid dispensing can be done with adjustable throughput by using different numbers of pipette channels (1 to 8 in this model study) (Fig. 2). The maximum number of pipette channels used (or throughput) was mainly determined by the available starting sample volume. With large or unlimited sample volume, e.g., oil pre-filling, maximum throughput can be achieved using all eight channels. For small or limited sample volumes (e.g., rare cell stock), less or one channel was used to minimize sample loss related to non-specific sample adhesion during aspiration and liquid storage. The time efficiency of liquid dispensing demonstrated here is not the upper limit of the technique described in this work and could be further improved with higher-speed liquid handling instruments.
The distribution of microdrop volume was measured by fitting the detected oil-water interface (or edge of a microdrop) to a circle (Fig. 3a). The 95% confidence interval (CI) ranged from 0.5 μL to 1.5 μL with an average volume of 1.03 ± 0.25 μL (Fig. 3b). The variation in volume was mainly influenced by the accuracy of the pipette head on the robotic liquid handler. Outside of the 95% CI, two chaperone regimes were observed which correspond to either empty wells or microdrops with roughly twice the target dispensing volume (i.e., around 2.0 μL) (Fig. 3c). These outlying microdrops were located mainly on the first and second rows of the plate, suggesting that they related to initial conditions when dispensing each column (Fig. 3d). More specifically, unreleased microdrops corresponding to the empty wells were likely caused by the “dry tip” effect under oil. When the pipette tip first meets oil, some time is needed for oil to replace any aqueous media and completely wet its surface. If the residence time is not long enough, the tip stays mostly “dry” relative to oil and the release of the microdrop is more difficult. The double-volume microdrops along the second row resulted from the resolution of this effect, and further subsequent dispensing volume was accurate and stable. The dry tip effect can be mitigated by increasing the residence time of the tip for the first well of each column (data not shown).
In preliminary experiments we found that a minimum CNR of 10 and a minimum area of 10 pixels produced very accurate bead detection, so we use these values here. Any objects within the microdrop area that meet these thresholds are considered beads. Importantly, we also determined how the spacing of z-slices affects the accuracy, and we found that slices may be spaced up to 150 μm without significantly degrading the accuracy. This is helpful for acquiring the minimum number of z-slices in the interest of acquisition time (Fig. 4a–c). The post-detection ROC analysis verified the accuracy of the automated approach in detecting microdrops with at least one bead (i.e., binary detection). We found a true positive rate (or sensitivity) of 97.7% and a true negative rate (or specificity) of 94.29% for our chosen parameters (Suppl. Table S2), and the AUC of the ROC curve 0.99 (Suppl. Fig. S2). These results indicate a high probability for our real-time analysis to correctly classify the microdrops. Furthermore, the ICC between the manual bead count and the automated results was 0.94 for all 384 wells, and 0.83 if wells containing zero beads were disregarded. This indicates high accuracy with respect to exactly how many beads are present. We note, however, that the binary detection has more practical importance than the exact quantitation of beads.
As previously demonstrated, the number of beads per dispensed microdrop was expected to obey Poisson distribution.21 Poisson distribution is described by the following equation: P (k events in interval) = e-λ(λk/k!), where P is the probability of occurrence with k events in interval (i.e., the number of beads per droplet), λ is the average events in interval (i.e., the concentration of bead suspension), and e is the base of natural logarithms. The automated results showed a fit of Poisson distribution with parameter λ = 0.6 bead/μL (Fig. 4d). In the tested condition, the frequency of single-bead-containing microdrops is about 30%.
Owing to the advantages of underoil ELR, microdrops of interest after screening can be harvested and transferred without loss with the protection of oil (Fig. 5, Suppl. Movie S6). The collected microdrops can be further manipulated under oil for various downstream assays. For example, microdrops containing different cell “phenotypes” can be selectively merged if added together into a target well to produce a co-culture system.21 Another example, cells in a microdrop can be lysed in situ under oil. RNA contents can be further extracted from under oil using Dynabeads for quantitative reverse transcription polymerase chain reaction (RT-qPCR).23
The combination of automated liquid handling, imaging and real-time image analysis with the ELR-based microdrop system greatly improves the practicality and broad applicability of the technique in biomedical laboratories and clinics where highest impact is expected. Automation can release lab workers from laborious and repetitive experiments, which greatly increases the efficiency of assays and reduces inconsistency in data collection caused by operator errors.
Supplementary Material
Acknowledgements
We thank Dr. Scott Berry, Dr. John Guckenberger and Dr. Jennifer Schehr for the early training on the robotic liquid handler and Ms. Crysta Frank for assistance on the test run of liquid-handling protocols.
Funding
This work is funded by NSF EFRI-1136903-EFRI-MKS, NIH R01 EB010039 BRG, NIH R01 CA185251, NIH R01 CA186134, NIH R01 CA181648, EPA H-MAP 83573701, Prostate Cancer Foundation Challenge Award, University of Wisconsin Carbone Cancer Center Cancer Center Support Grant P30 CA014520, and the Wisconsin Partnership Program Collaborative Health Sciences Grant.
Footnotes
Declaration of Conflicting Interests
The authors have potential conflicts of interest related to technologies presented here: D. J. Beebe holds equity in BellBrook Labs LLC, Tasso Inc., Stacks to the Future LLC, Lynx Biosciences LLC, Onexio Biosystems LLC, and Salus Discovery LLC. J. Lang hold equity in Salus Discovery LLC.
References
- 1.Levitin HM; Yuan J; Sims PA Single-Cell Transcriptomic Analysis of Tumor Heterogeneity. Trends Cancer Res. 2018, 4, 264–268. [DOI] [PMC free article] [PubMed] [Google Scholar]
- 2.Poulin J-F; Tasic B; Hjerling-Leffler J; et al. Disentangling Neural Cell Diversity Using Single-Cell Transcriptomics. Nat. Neurosci. 2016, 19, 1131–1141. [DOI] [PubMed] [Google Scholar]
- 3.McGranahan N; Swanton C Clonal Heterogeneity and Tumor Evolution: Past, Present, and the Future. Cell 2017, 168, 613–628. [DOI] [PubMed] [Google Scholar]
- 4.Marioni JC; Arendt D How Single-Cell Genomics is Changing Evolutionary and Developmental Biology. Annu. Rev. Cell Dev. Biol. 2017, 33, 537–553. [DOI] [PubMed] [Google Scholar]
- 5.Boiani M; Schöler HR Regulatory Networks in Embryo-Derived Pluripotent Stem Cells. Nat. Rev. Mol. Cell Biol. 2005, 6, 872–881. [DOI] [PubMed] [Google Scholar]
- 6.Ofengeim D; Giagtzoglou N; Huh D; et al. Single-Cell RNA Sequencing: Unraveling the Brain One Cell at a Time. Trends Mol. Med. 2017, 23, 563–576. [DOI] [PMC free article] [PubMed] [Google Scholar]
- 7.Papalexi E; Satija R Single-Cell RNA Sequencing to Explore Immune Cell Heterogeneity. Nat. Rev. Immunol. 2018, 18, 35–45. [DOI] [PubMed] [Google Scholar]
- 8.Sakaguchi S; Ono M; Setoguchi R; et al. Foxp3+ CD25+ CD4+ Natural Regulatory T Cells in Dominant Self-Tolerance and Autoimmune Disease. Immunol. Rev. 2006, 212, 8–27. [DOI] [PubMed] [Google Scholar]
- 9.Schulz KR; Danna EA; Krutzik PO; et al. Single-Cell Phospho-Protein Analysis by Flow Cytometry. Curr. Protoc. Immunol. 2007, Chapter 8, Unit 8.17. [DOI] [PubMed] [Google Scholar]
- 10.Lecault V; White AK; Singhal A; et al. Microfluidic Single Cell Analysis: from Promise to Practice. Curr. Opin. Chem. Biol. 2012, 16, 381–390. [DOI] [PubMed] [Google Scholar]
- 11.Lin C-H; Hsiao Y-H; Chang H-C; et al. A Microfluidic Dual-Well Device for High-Throughput Single-Cell Capture and Culture. Lab Chip 2015, 15, 2928–2938. [DOI] [PubMed] [Google Scholar]
- 12.Sims CE; Allbritton NL Analysis of Single Mammalian Cells On-Chip. Lab Chip 2007, 7, 423–440. [DOI] [PubMed] [Google Scholar]
- 13.Sperger JM; Strotman LN; Welsh A; et al. Integrated Analysis of Multiple Biomarkers from Circulating Tumor Cells Enabled by Exclusion-Based Analyte Isolation. Clin. Cancer Res. 2017, 23, 746–756. [DOI] [PMC free article] [PubMed] [Google Scholar]
- 14.Schehr JL; Schultz ZD; Warrick JW; et al. High Specificity in Circulating Tumor Cell Identification is Required for Accurate Evaluation of Programmed Death-Ligand 1. PLoS One 2016, 11, e0159397. [DOI] [PMC free article] [PubMed] [Google Scholar]
- 15.Prakadan SM; Shalek AK; Weitz DA Scaling by Shrinking: Empowering Single-Cell ‘Omics’ with Microfluidic Devices. Nat. Rev. Genet. 2017, 18, 345–361. [DOI] [PMC free article] [PubMed] [Google Scholar]
- 16.Guo MT; Rotem A; Heyman JA; et al. Droplet Microfluidics for High-Throughput Biological Assays. Lab Chip 2012, 12, 2146–2155. [DOI] [PubMed] [Google Scholar]
- 17.Mark D; Haeberle S; Roth G; et al. Microfluidic Lab-on-a-Chip Platforms: Requirements, Characteristics and Applications. Chem. Soc. Rev. 2010, 39, 1153–1182. [DOI] [PubMed] [Google Scholar]
- 18.Kaigala GV; Lovchik RD; Delamarche E Microfluidics in the ‘Open Space’ for Performing Localized Chemistry on Biological Interfaces. Angew. Chem. Int. Ed. 2012, 51, 11224–11240. [DOI] [PubMed] [Google Scholar]
- 19.Walsh EJ; Feuerborn A; Wheeler JHR; et al. Microfluidics with Fluid Walls. Nat. Commun. 2017, 8, 816–825. [DOI] [PMC free article] [PubMed] [Google Scholar]
- 20.Walsh DI III; Kong DS; Murthy SK; et al. Enabling Microfluidics: from Clean Rooms to Makerspaces. Trends Biotechnol. 2017, 35, 383–392. [DOI] [PMC free article] [PubMed] [Google Scholar]
- 21.Li C; Yu J; Schehr J et al. Exclusive Liquid Repellency: An Open Multi-Liquid-Phase Technology for Rare Cell Culture and Single-Cell Processing. ACS Appl. Mater. Interfaces 2018, 10, 17065–17070 (2018). [DOI] [PMC free article] [PubMed] [Google Scholar]
- 22.Zack GW; Rogers WE; Latt SA Automatic Measurement of Sister Chromatid Exchange Frequency. J. Histochem. Cytochem. 1977, 25, 741–753. [DOI] [PubMed] [Google Scholar]
- 23.Li C; Yu J; Paine P; et al. Double-Exclusive Liquid Repellency (Double-ELR): An Enabling Technology for Rare Phenotype Analysis. Lab Chip 2018, 18, 2710–2719. [DOI] [PMC free article] [PubMed] [Google Scholar]
Associated Data
This section collects any data citations, data availability statements, or supplementary materials included in this article.


