

Abstract
How cells position their organelles is a fundamental biological question. During Drosophila embryonic muscle development, multiple nuclei transition from being clustered together to splitting into two smaller clusters to spreading along the myotube’s length. Perturbations of microtubules and motor proteins disrupt this sequence of events. These perturbations do not allow intuiting which molecular forces govern the nuclear positioning; we therefore used computational screening to reverse-engineer and identify these forces. The screen reveals three models. Two suggest that the initial clustering is due to nuclear repulsion from the cell poles, while the third, most robust, model poses that this clustering is due to a short-ranged internuclear attraction. All three models suggest that the nuclear spreading is due to long-ranged internuclear repulsion. We test the robust model quantitatively by comparing it with data from perturbed muscle cells. We also test the model using agent-based simulations with elastic dynamic microtubules and molecular motors. The model predicts that, in longer mammalian myotubes with a large number of nuclei, the spreading stage would be preceded by segregation of the nuclei into a large number of clusters, proportional to the myotube length, with a small average number of nuclei per cluster.
INTRODUCTION
How cells position their organelles is a fundamental biological question with significant implications for health and disease (Rafelski and Marshall, 2008). The nucleus is a major cellular organelle, with its position dependent upon the cell’s migratory state, cell cycle stage, and differentiation status (Baye and Link, 2008; Gundersen and Worman, 2013). Proper nuclear position is crucial in many cellular phenomena, including accurate cell division and directional cell migration (Gundersen and Worman, 2013). A review of nuclear positioning mechanisms can be found in Dupin and Etienne-Manneville (2011).
Here, we focus the on positioning of the multiple nuclei in one of the body’s largest cell types: skeletal muscle cells. Individual muscle cells develop and grow by fusion of mononucleated myoblasts and, in vertebrates, contain hundreds of nuclei distributed along the cell surface (Deng et al., 2017). Nuclear positioning in muscle cells involves successive nuclear movement events (Cadot et al., 2015), the first of which is centration (clustering), in which each newly incorporated nucleus is moved to the center of the immature muscle cell, the myotube (Cadot et al., 2012). As the myotube continues to grow, the second event, spreading, in which the nuclei become evenly spaced throughout the long cell, takes place (Metzger et al., 2012). One indication of the importance of these phenomena is that in muscle diseases known as centronuclear myopathies, nuclei are mispositioned (Dubowitz et al., 2013). It has been argued (Folker and Baylies, 2013), that incorrect positioning of nuclei is not only an indicator, but also a cause of muscle diseases (Falcone et al., 2014).
In this study, we focus on positioning of nuclei in Drosophila myotubes. D. melanogaster is a powerful in vivo model system in which to investigate this aspect of muscle development in mechanistic detail (Weitkunat and Schnorrer, 2014; Manhart et al., 2018; Windner et al., 2019) due to the simplicity of its muscle pattern and the ease of genetic manipulation (Schulman et al., 2015). The larval body wall muscles are relatively simple, yet have structures similar to that of vertebrate muscles (Abmayr and Pavlath, 2012). Following myoblast fusion, each myotube contains multiple nuclei, ranging between 3 and 25 in number, depending on myofiber identity (Bate, 1990). There are between four and eight nuclei in well-described Drosophila lateral transverse (LT) myotubes. Nuclei in newly fused LT myotubes undergo an orchestrated series of movements (Metzger et al., 2012; Folker et al., 2012, 2014; Figure 1A): 1) At the completion of fusion, the myonuclei are in close proximity to each other, forming a group close to the ventral cell pole. We call this stage “clustering,” using the notion of “cluster” loosely, simply meaning that distances between neighboring nuclei are significantly smaller than nuclear radii. 2) Toward the end of fusion events, the initial nuclear cluster splits into two subclusters, one ventral and one dorsal, containing roughly equal numbers of nuclei that then migrate toward the opposing cell poles. We call this the “splitting step.” 3) Finally, both clusters break apart, and the nuclei spread out evenly along the cell long axis (Folker et al., 2014; Cadot et al., 2015). We call this the “spreading step.” Note that step 2 is documented in Drosophila in vivo and not in vertebrate myotubes studied in culture; thus steps 1 and 3 in Drosophila muscle cells correspond to the centration and spreading steps, respectively, in the vertebrate muscle cells. As the nuclei spread in the muscle cell, sarcomeres, the fundamental contractile units in muscle, assemble into myofibrils within each cell. Eventually the nuclei become positioned along the long axis of the cell at its periphery (Bruusgaard et al., 2003).
FIGURE 1:

Embryonic muscle development and potential forces. (A) A Drosophila embryonic muscle cell at different stages of development. (B–E) Potential forces and their origin. B, schematics of involved motors and their interaction with MTs and the cell membrane. C, molecular mechanisms (left) and resulting forces (right) for internuclear repulsion (top row) and internuclear attraction (bottom row). Depicted are attractive (blue) and repulsive (red) forces. Arrows indicate where forces act, a colored ring around nuclei indicates forces felt by the nucleus. Forces can be shielded or not. D, as C, but for background repulsion/attraction caused by a myotube MT network, forces are represented by arrows starting and ending within the cell. E, ss C and D, but for nucleus–pole interactions. Pole forces are represented by arrows starting or ending at the pole.
The multi-step nuclear distribution process is critical for myogenesis, is required for muscle function, and is not passive. Rather, myonuclear positioning involves the microtubule (MT) cytoskeleton and associated motors (Cadot et al., 2012; Metzger et al., 2012). Note that the actomyosin networks are involved in later stages of nuclear positioning in more mature cells (Elhanany-Tamir et al., 2012; Roman and Gomes, 2018), but in the embryonic myotubes MTs, MAPs (MT-associated proteins), kinesins and dynein motors play the dominant role (Metzger et al., 2012; Wilson and Holzbaur, 2012; Cadot et al., 2012; Folker et al., 2014). Perturbations of MT-associated molecular motors and MAPs that affect force and movement generation, as well as anchoring, orientation, and other MT behavior, disrupt the sequence of nuclear positioning events and indicate that impermanent force balances generated by MTs and associated molecular motors are responsible for the dynamic nuclear positioning (Gache et al., 2017; Manhart et al., 2018; Windner et al., 2019). Many of these respective perturbations are also linked to a number of physiological disorders (Collins et al., 2017).
We note that the consecutive steps of nuclear positioning appear to be mechanistically distinct, as some perturbations affect one, but not other, steps of the nuclear movements (Gache et al., 2017; Rosen et al., 2019). Related to this observation, there is a major restructuring of the MT organization (Tassin et al., 1985; Kano et al., 1991) in the course of the consecutive stages of nuclear positioning. Precise details of this restructuring, exact timing of activation and down-regulation of motors and MAPs, and the large number of involved molecules (at least 19 different molecular motors are involved in governing the nuclear movements; Gache et al., 2017) make it impossible to simply intuit mechanisms responsible for myonuclear positioning.
In this work, we apply computational modeling to elucidate these mechanisms. Modeling has proven to be a useful complement to experiment in the organelle positioning problems (Rafelski and Marshall, 2008; Wu et al., 2017; Manhart et al., 2018; Windner et al., 2019). Simple models of myonuclear mutual repulsion successfully reproduced regular distribution of nuclei in muscle cells and in the Drosophila blastoderm syncytium (Bruusgaard et al., 2003; Koke et al., 2014; Dutta et al., 2019), while detailed simulations led to understanding nuclear movements in multinucleate fungus (Gibeaux et al., 2017). Here, we followed the modeling philosophy of our previous study (Manhart et al., 2018): since there are too many types of motors and a complex MT organization, we are prevented from beginning with molecularly explicit models. Therefore, we first assumed that multiple MT-motor actions generate a mean internuclear force that is a function of the internuclear distance. We then solved equations of motion for the multiple nuclei interacting via distance-dependent forces. These equations can be solved rapidly, so that we were able to screen many different internuclear force types by comparing the predicted spatial nuclear patterns with the data. After the mathematical form of the forces was clear, we corroborated the screen by simulating a molecularly explicit, detailed agent-based model.
In Manhart et al. (2018), we used such reverse engineering to identify the forces maintaining stationary, fully spread nuclear positions in fully developed ventral longitudinal muscles of Drosophila third instar larvae with functional sarcomeres. Here, we turn to the step positioning in Drosophila embryonic myotubes. Our computational screen identifies three possible models, the first of which suggests that the first step, clustering, is due to short-range internuclear attraction, while the last stage, spreading, is generated by long-range internuclear repulsion. The agent-based simulation demonstrates that the former could be due to the action of dynein on the nuclear envelopes, whereas the latter could be due to the action of kinesins on the antiparallel internuclear MT bundles. Interestingly, the intermediate, or splitting, step is due simply to an overlap of these two types of forces in time. This model is further confirmed by its ability to predict correctly the nuclear dynamic patterns in cells with perturbed MT-kinesin interactions and in cells with varying nuclear numbers. The model also makes a prediction about the existence at the splitting stage of many small-nuclear-number clusters in long multinucleated vertebrate muscle cells. Last, the computational screen also generates two different, less robust, models, where a long-range repulsion between the nuclei and the poles acts instead of the short-range internuclear attraction in the clustering and splitting steps.
RESULTS
Model screening
The distinct myonuclear patterns in each stage of embryonic development suggest a well-regulated nuclear positioning mechanism. In this section we develop a force-based model of myonuclear positioning. This model allows the inclusion of a wide range of possible interactions, as well as a systematic numerical exploration of how each observed step can be explained and how the transitions between the individual steps can be regulated in time.
Force contributions.
Experimental findings to date do not present a consistent picture of myonuclear dynamics. We hypothesize that the position and movement of the nuclei are caused by forces acting on them. These forces can be either pairwise interaction forces between nuclei or forces between nuclei and their environment. We assume myonuclear movement to be caused by up to three contributors (Figure 1, B–E):
Interactions between nuclei: we assume that asters of microtubules emanating from the nuclear envelope create forces between pairs of nuclei. This could involve molecular motors located either at the nuclear envelope or in the cytoplasm. Since myotubes are narrow and nuclei appear to be very close to each other, it is possible that a nucleus that is placed between two other nuclei shields the interaction between them (Figure 1C).
Interactions between nuclei and the myotube background: a network of microtubules, not anchored at the nuclear envelope, span the myotube, and through interactions with motors, myonuclei are moved along the network. These are global forces felt by all nuclei depending on their position (Figure 1D).
Interactions between nuclei and the myotube poles: through microtubules associated with the myotube poles or the nuclei, forces act on the two nuclei closest to the two poles. Note that if those forces were to act on all the nuclei, they would have the same effect as the background forces above (Figure 1E).
Since myotubes are very narrow—their diameter is roughly equal to the diameter of two nuclei—we assume no additional forces acting on the nuclei from the sides of the myotube. In fact, for the force screen described below, we modeled the myotube as 1-dimensional. We will address the 2-dimensional setting in further sections.
Force shapes.
We allowed the involved forces to be attractive or repulsive and to grow or fall with distance or to be distance-independent. For internuclear and pole forces, distance refers to the distance between pairs of nuclei and the nucleus–pole distance, respectively. For the background forces, we measured distance as distance from the myotube center. Note that to ensure that the background forces are continuous along the cell length and symmetric with respect to the cell center, they need to be zero at the cell center. This means the background forces can only be increasing with distance. For a given distance d, we allowed the following force shapes: 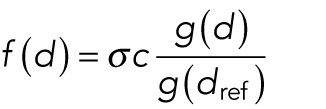 , where σ = +1 for repulsive forces and σ = −1 for attractive forces. The parameter
  is a fixed reference distance and c > 0 gives the force magnitude at
  . The distance dependence of the force is contained in the function
  , for which we use the following shapes:
For forces falling with distance we use
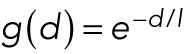 .
.For forces increasing with distance we use
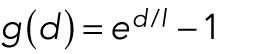 .
.For forces independent of distance we use
 .
.
The parameter  characterizes how fast the force grows or falls with distance, giving the typical length scale for the corresponding force. We assume an overdamped regime in which speeds of objects, rather than accelerations, are proportional to the forces. This is justified because the cytoplasm is very viscous (Mogilner and Manhart, 2018). In 1D, the position of the ith nucleus,
  (there are a total of N nuclei), at time t in a myotube of length L is then given by the equation
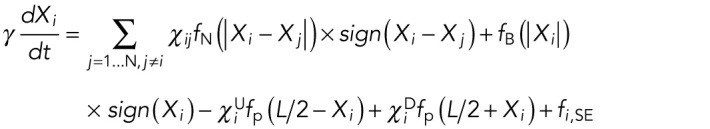 |
Here  ,
,  , and
, and  refer to internuclear, background, and pole forces, respectively, and take any of the force shapes
  described above, or sums of them. If the internuclear forces are not shielded,
  . If they shielded, so that nuclei can only interact with their immediate neighbors, then
  , whenever nuclei i and j are not immediate neighbors; for the nearest neighbors,
  . Since we assume that the pole forces can only act on the nucleus closest to the pole,
  and
and  for all nuclei separated from any pole by another nucleus. For the nuclei closest to a pole,
 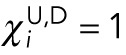 . The superscript indicates the upper (U) or lower (D) pole. In all simulations, we also included a size-exclusion force, denoted by
  , between pairs of nuclei and between each nucleus and the myotube boundary. This force ensures that nuclei cannot get too close to each other or the poles. The parameter
  determines the time scale of the movement and depends on the effective viscous drag on the nucleus. A 2-dimensional formulation of the model and further mathematical details can be found in the Supplemental Material.
Which forces cause one cluster, two clusters, and spreading?
The three observed steps—one cluster, two clusters, and the spreading step—all seem to be stable for a certain amount of time. We therefore searched for corresponding steady state solutions of the system of N ordinary differential equations above. For simpler systems, this could be done by direct computation; however, due to the size of the system, the nonlinearity of the interaction forces, and the possibility that several steady state solution exist, we aimed to answer this question by performing numerical force screens.
Which forces create one cluster?
We started our investigation by asking which forces lead to the initial configuration: at stage 14, the myonuclei appear as a loose cluster positioned slightly below the middle of the cell. Performing a computational screen, we searched for forces that lead to one cluster. We tested all of the described forces above using as length scales l = 5, 10, and 20 μm. In each simulation, we began with six randomly positioned nuclei and ran the simulation until the positions had reached equilibrium. We defined a valid cluster as a configuration in which the maximal distance between the centroids of neighboring nuclei is below one nuclear diameter. Additionally, we required the cluster to be separated from both myotube poles.
We found that to create one cluster, one type of force was sufficient. We call each such force a 1-cluster force, F1. We found nine different options that can be grouped into three classes, shown in Figure 2A. F1-a: any type of internuclear attraction leads to one cluster. F1-b: pushing from the poles on the outermost nuclei creates a cluster. F1-c: last, if there is a background force attracting the nuclei to the myotube center, this also creates one cluster; see Figure 2, A, D, and G.
FIGURE 2:

Force screen results. (A–C) Schematics of the forces in an embryonic muscle cell identified in the numerical screen that produce one cluster (A), two clusters (B), or a spread-out state (C) at equilibrium. Colors and arrows as in Figure 1B. (D–F) One example of force set per class (a–-c and a–d) on the left. The parameters used are indicated by black dots in Supplemental Figure S1A. Depicted are internuclear, pole, and background forces for particular force shapes. More details in Supplemental Figure S1A. (G–I) Admissible final nuclear positions for the examples shown in D–F. (J, K) Examples of temporal regulation of forces: tuning (J) and switching (K). (L) Results of the overlap screen for switching-type temporal regulation. Left: Depicted is which overlap of 1-cluster and spreading forces can explain all three stages. Numbers and shading represent the total number of parameter combinations that produced correct patterns (out of 5184 tested) and groupings into mechanism I (green dot) and mechanism II (blue triangle). Middle: Zoom into one model from the left (dashed red line) and projection on the internuclear repulsion and attraction length scales. Shading and numbers as on the left. Right: Zoom into one example length-scale combination in the middle (dashed red) and projection on the background attraction and internuclear repulsion strength. Shading and numbers as in the middle.
Which forces create two clusters?
Between stages 15 and 16, two clusters containing equal numbers of nuclei are observed. These are created by splitting of the initial cluster and movement of the two resulting clusters toward the myotube poles. In Stage 16 the two clusters reside near, but distinctly away from the myotube poles. Beginning with an initial cluster of nuclei placed at the center of the myotube, we screened through the above-described forces to test which lead to equilibrium positions that correspond to the two-cluster stage.
We found that no single force alone can lead to two clusters. We therefore performed a second screen, in which we looked for combinations of two forces that lead to two clusters of nuclei. For each force, we tested l = 5, 10, and 20 μm. Additionally, since the magnitude of the two forces can influence the patterns, we also varied the parameter c for one of the forces, so that their relative magnitude was between 0.1 and 10. We call any combination a 2-cluster force F2 if it creates two clusters for at least one parameter combination.
We identified five different combinations of forces (listed in Supplemental Figure A.1B), which can be grouped together in four groups shown in Figure 2B. F2-a: poles are repulsive, decreasing with distance, and the nuclei themselves are also repulsive. F2-b: nuclei are repulsive, increasing with distance; the background is attractive, increasing with distance. F2-c: nuclei are attractive, but the background is repulsive. F2-d: there is no direct communication between nuclei, but both poles and the background are repulsive. See Figure 2, E and H for examples.
Which forces create spreading?
At the end of the embryonic development, at Stage 17, nuclei are spread out along the length of the cell, well separated from each other and from the poles. Similarly to the two-cluster screen, we found that no force alone leads to an equal spread along the long axis while still placing nuclei away from the poles. We therefore performed a second screen with a setup similar to that for the two-cluster screen.
We called every combination of two forces spreading force, FS, if, for any parameter combination of length scales l and force magnitudes c, the nuclei in the final configuration are separated from each other and the poles. In total, we found 11 two-force combinations that lead to spreading. They are listed in detail in Supplemental Figure A.1C and fall into four classes (a–d), shown in Figure 2C. For all classes, we found that there has to be an internuclear force, that is, communication between the nuclei to create the spread pattern. In the first two classes, FS-a and b, this internuclear force was repulsive, and in most instances decreasing with distance. This makes sense intuitively as nuclei that push each other away will lead to equidistant patterning. However, an additional force is necessary to keep the outermost nuclei from touching the poles. This can be accomplished by having either a repulsive pole force (class FS-a) or an attractive background force (class FS-b). For the next two classes, FS-c and d, we identified spreading forces that consist of shielded internuclear forces that are attractive and increase with distance: this can be imagined as a chain of nuclei connected by springs. If such a chain is pulled apart at the ends, for example, through attractive pole forces (class FS-c) or a repulsive background (class FS-d), this again leads to the spread-out myonuclear configuration. See Figure 2, F and I for examples.
Temporal regulation for forces
After having identified which forces lead to the three different positioning patterns, we investigated the different options of regulating forces temporally. This regulation consisted of changing the parameters of the forces: their relative strengths and/or their typical length scales. In the following model, we call this tuning; see Figure 2J. Since the myotube grows during the different stages, this length change could also drive the change in patterns. Note that changes in myotube length are equivalent to changing the length scale of the forces. When analyzing the results of the previous force screen, we found that the only forces that can explain all three different steps by tuning are repulsive forces from the poles together with repulsive nuclei, where all involved forces fall with distance. We will analyze the properties of this model further below.
Alternatively, the tuning could consist of changing the type of force, that is, activating or deactivating an entirely different force. In principle, the cell could switch between any kind of one-cluster, two-cluster, and spreading forces; however, it is reasonable to assume that simpler mechanisms of regulation are more likely than complicated ones. We suggest a type of switching where at Stage 14 one-cluster forces are active, at Stage 17 spreading forces are active, and the transitional pattern of two clusters is created through the overlap of the two force sets (Figure 2K). In the following section, we call this switching.
Which switching type regulation leads to cluster splitting?
In this section we investigated which switching-type models are possible. This type of regulation is depicted in Figure 2K and suggested that the two-cluster stage is created when a one-cluster force and a spreading force are active together.
Screening protocol.
We performed a screen using the nine identified one-cluster forces F1 and the 11 identified spreading forces FS listed in Supplemental Figure A.1. Note that this involved up to three different forces being active at the same time (one from the one-cluster force and two from the spreading force). Hence, we tested four different length scales for each force, l = 5, 10, 20, 40 μm. We always used a scaling in which the one1-cluster force had strength c = 1, and for the remaining two forces, we tested nine different relative force strengths between 0.1 and 10. For each simulation, we used the following protocol:
Start with randomly placed nuclei and have only the one-cluster force be active. Let the simulation run until equilibrium is reached. If one cluster is created, move to Step 2.
Use the final positions of the previous step as new initial conditions. Activate the spread force and let the simulation run until equilibrium is reached. If two clusters are created that reside near, but away from the poles, move to Step 3.
Use the final positions of the previous step as new initial conditions. Deactivate the one-cluster force and let the simulation run until equilibrium is reached. If nuclei are separated and positioned away from the pole, the simulation is counted as producing correct patterns.
Since the initial positions were taken randomly, we repeated the protocol 10 times for each force set and parameter combination.
Switching type regulations identified.
The results of this overlap screen are presented in Figure 2L. The identified models can be assigned to two mechanisms. The first is based mostly on the interactions between nuclei, which are attractive (for clustering) and repulsive (for spreading), together with a repulsion force from the poles or an attractive background force. For the second group, nuclei still need to repel each other to spread; however, the clustering is caused solely by pushing from the poles. Of course, the successful recapitulation of the three different stages depended on the chosen parameters. In Figure 2L, we zoomed into the parameter space of one particular switching model and found that the internuclear repulsion had a longer range than the internuclear attraction (middle) and also the relative force strengths had to be within a certain range (right). We will explore this further below.
The robustness of the three mechanisms
At this point we have identified two switching-based mechanisms, where two sets of forces are used that are active at different times, and one tuning-based mechanism, where regulation is achieved by varying parameters. All three correctly predicted the observed patterns at all three steps (see Figure 3, A–C). However, the screens were performed with a fixed cell length and a fixed number of nuclei. In Drosophila embryonic muscle cells, the number of nuclei varies and the cell length changes both from cell to cell as well as throughout development. We note that in Folker et al. (2012), it was found that muscle length and myonuclear positioning are regulated independently, suggesting that it is not the growth of the myotube that drives positioning. We therefore tested how robust the three identified mechanisms are with respect to varying the nuclear number and the cell length. For each mechanism, we simulated the myonuclear positioning for different cell lengths and numbers of nuclei using the previously identified parameters. Then we assessed for which step the produced patterns remained correct. Figure 3, D–F depicts the outcome as a percentage of correct patterns across all parameters and all models for each mechanism.
FIGURE 3:

Candidate models and robustness. (A–C) Model representatives of the three different mechanisms capable of recapitulating the observed myonuclear stages. A, Mechanism I: Switching Type 1. Internuclear attraction is active between Stages 14 and 16; internuclear repulsion and polar repulsion are active during Stages 16 and 17. Shown are example patterns (left) and the corresponding forces (right). (B) As A, but Mechanism II: Switching Type 2. Pole repulsion is active between Stages 14 and 16, internuclear repulsion and an attractive background are active during Stages 16 and 17. (C) As A and B, but for Mechanism III: Tuning. Internuclear repulsion and repulsive poles are active throughout all stages, however the extend of internuclear repulsion increases with time. (D–F) Robustness of the three models with respect to the cell length and the number of nuclei. Shown is what percentage of originally good model parameters still lead to correct patterns at the three different stages for different cell lengths, D, and numbers of nuclei, E. F shows example patterns at Stage 16; checks indicate whether the patterns are correct.
Cell length robustness.
Inspecting the results for cell length variations (Figure 3D), we found that for all mechanisms, cluster formation at Stage 14 was robust. Stage 17 spreading required cells to be long enough across all mechanisms. The crucial differences arose in Stage 16, the two-cluster stage: here the two switching-based mechanisms, I and II, were more robust than the tuning mechanism, and the most robust mechanism was Switching Type 1. Example patterns for Stage 16 are shown in Figure 3F. This result can be understood intuitively, since in Switching Type 1 regulation the two-cluster pattern was caused mostly by internuclear interactions (attractive–repulsive); the repulsive pole or background force solely prevented the clusters from moving into the poles. Taken together, changes to the cell length only have a minor effect.
Nuclear number robustness.
By performing the same test for varying numbers of nuclei, we found that again, Stage 14 clustering was robust with respect to variations in numbers of nuclei across all mechanisms. Correct Stage 17 spreading became less likely as the nuclear number increased, since the separation of nuclei becomes more difficult to achieve. Again, it is the two-cluster formation at Stage 16 where the biggest differences lie: For all mechanisms, correct separation of the nuclei into two clusters was not very robust against perturbations of nuclear number; however, Switching Type 1 was the most robust mechanism with respect to higher nuclear numbers. In the example patterns in Figure 3F, we see that the other mechanisms typically fail to keep the nuclei together. The explanation was that these mechanisms (Switching Type 2 and Tuning) have no internuclear attraction that maintains the individual clusters.
Further considerations and selection of best mechanism.
For mechanisms II and III, there was no direct communication between nuclei at Stage 14. Instead the clustering was caused by cellwide forces, which caused the cluster always to be positioned in the cell center. For mechanism I, the Switching Type 1 models, on the other hand, Stage 14 clustering is caused by internuclear attraction, and hence the position of the cluster depended on the initial nuclear positions. Experimentally, the Stage 14 cluster was typically found off center toward the lower pole (compare with Figure 1A), which contradicted the predictions of mechanisms II and III. Also, mechanism I was the only one positing attractive forces between nuclei. This was supported by observations in Folker et al. (2014), where elongated leading edges of nuclei were observed, suggesting attractive forces. Additionally, mechanism I was also the most robust with respect to perturbations of cell length and nuclear number. Hence we will focus our attention on mechanism I, a switching regulation of Type 1. In the following, we refer to it as the Switching Model.
Comparing predictions of the Switching Model with experiments
In the previous section we used force screens and robustness arguments to identify the most probable Switching Model. This model proposed that there is internuclear attraction from Stage 14 to Stage 16 and internuclear repulsion together with polar repulsion or background attraction from Stage 16 to Stage 17. In this section, we compare model predictions with two types of mutation experiments: varying the amount of Ensconsin (Ens), a MAP, and varying the number of nuclei in a muscle cell. In the simulations shown in Figure 4, we used one model representative with one set of baseline parameters of the Switching Model, the one shown in more detail in Figure 2L. While other representatives and parameters agreed in their qualitative predictions, this model and parameter set gave the best quantitative fit in Figure 4C.
FIGURE 4:

Testing model predictions. (A) Fluorescent microscopy pictures and schematics of the experimental results of knockdown (Left), wild-type (Middle), and overexpression (Right) experiments of Ens at Stages 16. Cells are shown in green, the nuclei in pink. (B) Switching Model predictions of nuclear positions at Stage 16 for various dosages of Ens, modeled by varying the amount of internuclear repulsion. Gray cells mark examples for qualitative agreement with the experimental observations in A. (C) The measured and predicted influence of the number of nuclei on their positioning at Stage 16. The y-axis is the distance between the uppermost and lowermost nucleus as % cell length. Different colors and symbols represent (average) measurements of several experiments. Experimental details can be found in Materials and Methods, simulation details in the Supplemental Material.
Experiment 1: varying the amount of Ensconsin
In this section we compare the model predictions of the Switching Model with genetic manipulation experiments performed in the Drosophila embryo. Both genetic manipulations targeted the microtubule-associated protein Ens, which is important for myonuclear positioning. First, we examined knockdown (KD) experiments of Ens (see also Metzger et al., 2012), which reduced the amount of Ens in the muscle cells. In a second experiment, Ens was overexpressed (OE), increasing its amount (see Rosen et al., 2019). We focused on Stage 16, where changes are most pronounced and easily measured. In wild-type cells, myonuclei usually reside in two clusters at this stage, while in KD cells, the nuclei form one cluster. In OE cells, nuclei spread along the entire myotube, partly in smaller clusters, see Figure 4A.
We next tested the predictions of the Switching Model for the KD and OE experiments. Ens has been shown to interact with kinesin (Metzger et al., 2012). The observation that KD prohibits cluster splitting and the OE leads to more splitting suggested that Ens is involved in nuclear repulsion. We therefore varied the amount of internuclear repulsion in the model between 0% and 200% of its original value. In Figure 4B, we show the resulting myonuclear positions at Stage 16. We found that, below a certain level of nuclear repulsion, nuclei fail to split, in agreement with the KD experiments. In contrast, above a certain amount of nuclear repulsion, the two clusters split into smaller ones, and the overall spread along the myotube is larger. These simulations were, again, in agreement with the experiments.
Experiment 2: Varying the number of nuclei
Next, we looked at experimental perturbations of numbers of nuclei in a muscle cell achieved through reduction and overexpression of Roundabout (Robo), a transmembrane receptor. In this experiment, we measured nuclear number at Stage 17, because at this stage nuclei are clearly separated and their number can be assessed with confidence. We measured nuclear position at stage 16, when the two clusters reach their maximum spread. We measured the distance from the uppermost to the lowermost nucleus as maximal spread in % myotube length to account for variations in cell length. Experimentally, we observe a correlation between the number of nuclei and the spread along the myotube (Figure 4C). When we simulate Stage 16 nuclear positions with different representatives of the Switching Model, we find the same positive correlation. By choosing a particular representative and fitting the model parameters, we quantitatively recapitulated the experimental data; see Figure 4C.
Understanding clustering
In the previous sections, we have seen that the Switching Model described wild-type myonuclear patterns and correctly predicted nuclear positions under various experimental conditions. The model behavior at Stage 14—the one-cluster step—was obvious: attractive nuclei formed one cluster. Also, the pattern at Stage 17—the spreading step—was intuitively clear: nuclei repelled each other and an additional force stopped them from moving into the poles. In this section, we used the Switching Model to gain a better understanding of the positioning of the two clusters present at Stage 16. When examining the parameters that lead to the correct dynamics, we found that for the internuclear attraction and repulsion that we generally needed to have la < lr (compare also Figure 2L, middle); that is, the internuclear attractive forces needed to be more short-ranged than the internuclear repulsive forces, leading to a nonmonotonics overlap internuclear force (Figure 5A). We saw that cluster splitting was relatively robust to cell length variations, while we also found that changing the dosage of internuclear repulsion changed the splitting dynamics. This indicated that it was the balance between internuclear attraction and repulsion that was crucial. In the following section, we examine this further to gain mechanistic insight. For the following calculations and simulations, we chose one particular representative of the Switching Model and baseline parameters (all internuclear forces falling and unshielded and falling with distance pole repulsion).
FIGURE 5:

Mechanics of cluster splitting. (A) A schematic of the internuclear force at the two-cluster stage. (B) The total energy for cluster splitting. The x-axis represents the separation distance s between the two clusters. If it is zero, they form one cluster. The dashed red line is the energy for having one cluster; the dotted blue line is the energy for having two fully separated clusters. Different curves correspond to different numbers of nuclei N. To allow easy comparison, we scaled the energies, so that the one-cluster and two-fully-separated-cluster energies are the same for different numbers of nuclei. (C) Stage 16 behavior for different numbers of nuclei. Simulating the splitting model for different numbers of nuclei, we compare their position at Stage 16. Blue lines show the analytical result. (D) The distribution of number of nuclei per cluster for two-dimensional simulations of nuclear positioning at Stage 16 of cells of varying length and number of nuclei (20 realizations per parameter set), but constant nuclear density. The dashed black line shows a normal distribution of equal mean and variance. (E) As D, but with higher internuclear repulsion. (F) Example simulation snapshots of the simulations in D. Simulation details can be found in the Supplemental Material.
When do clusters split?
We used the Switching Model to understand the mechanism of cluster splitting at Stage 16. At this stage, three forces are active: long-ranged internuclear repulsion, short-ranged internuclear attraction, and polar repulsion/background attraction. We focus on the two internuclear forces, which are the driving forces behind cluster splitting. This simplifies our model equation to
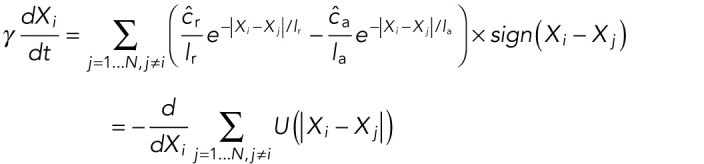 |
where we have defined the constants 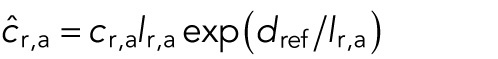 and the potential energy by
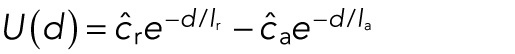 |
Using this formulation, we calculated, for any set of positions  , the total energy by
 |
In the process of cluster splitting, we moved from a one-cluster situation to a two-cluster situation. We calculated the total energy for both situations and the transition between them. To do this without having to solve the ODE system, we fixed a separation distance δ for two neighboring nuclei that would still feel attractive forces from each other. Then we assumed that, for the one-cluster situation, nuclei are positioned at Xi = iδ, i = 1, . . ., N. For the two-cluster situation, we assumed that Xi = iδ for  and Xi = iδ + s for
  , where
  denotes rounding up. The parameter s denotes the distance between the two clusters. We also compared this with the situation where the two clusters are fully separated, corresponding to
  . The result is shown in Figure 5B. The energy for two clusters was always lower. When analyzing how the energy changes as we slowly separate the two clusters from each other (i.e., we increase s), we find, however, an energy barrier for low numbers of nuclei. This predicted that the cluster will not split into two for a small number of nuclei. We confirmed this numerically for the full simulation in Figure 5C.
Where do the two clusters position themselves?
Next we wanted to understand how the positions of the two clusters at Stage 16 depend on the parameters. If we assume that 1) the two clusters are separated enough so that the short-ranged attraction between nuclei of one cluster does not affect the other cluster, 2) the two cluster positions are symmetric with respect to the center of the myotube, and 3) the position of the nuclei in each cluster is roughly equal to the center of mass of that cluster, we derived the following simple equation for the movement of the center of mass of the upper cluster, Y(t), containing n = N/2 nuclei:
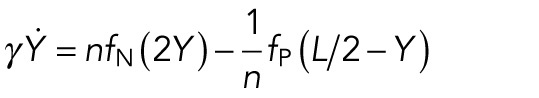 |
Since the other cluster is then positioned at −Y, the distance between the two clusters is 2Y, explaining the argument of the internuclear repulsion force fN. The factor 1/n in front of the polar force fP is a result of the assumption that only the closest nucleus interacts with the pole. Note that no internuclear attraction appears in the equation. This is due to the assumption that the internuclear attraction acts only locally, and hence it does not contribute to the movement of the centers of mass of the clusters. We have assumed the following force shapes:
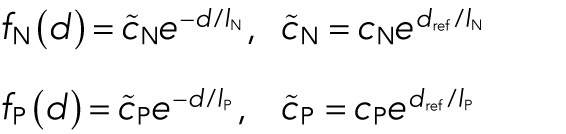 |
The differential equation for the center of mass of the upper cluster has the stable steady state
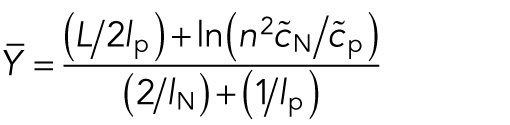 |
This was the formula used in Figure 5C, blue line. In particular, it suggested that the clusters at Stage 16 will move closer to the poles as the number of nuclei increases, or also as the internuclear repulsion, quantified by  , increases. In Figure 5C, we saw agreement between analysis and the simulation. Note that the stable steady state depends only on internuclear repulsion and polar forces; hence the cluster position is independent of the internuclear attraction. This was very different from cluster splitting, which depends only on internuclear forces and not on background or pole forces.
What determines the number of nuclei per cluster?
The above considerations revealed that cluster splitting was a consequence of the balance between internuclear attraction and internuclear repulsion. In particular, they also suggested that there was nothing special about the fact that there are two clusters in Stage 16. In other organisms’ muscle cells, which are larger, but also contain more nuclei (Falcone et al., 2014; Gimpel et al., 2017), nuclei have been observed to form many small clusters. We therefore simulated nuclear positioning when all forces are active in cells of varying size and nuclear number, but kept the nuclear density (the number of nuclei per cell area) constant. To ensure that none of the observed effects are due to the simplicity of the 1D setting, we simulated in 2D, assuming the side forces from the right and left to be of the same nature as the pole forces.
Figure 5, D–F shows the outcome of the simulations. When keeping nuclear density constant, we found that the number of nuclei per cluster was mostly independent of the total number of nuclei in the cell. Instead the typical cluster size was determined by the balance of internuclear repulsion and attraction: an increase of internuclear repulsion leads to a shift in the distribution of cluster sizes to smaller mean cluster size, Figure 5, D and E. The examples shown in Figure 5F demonstrate this.
A microscopic switching model
Until this point in our investigation, we used a rough model that included several simplifications: we worked primarily in a one-dimensional setting and made assumptions about the force shapes, but not their origin. The advantage of this approach was that we could test a large number of different mechanisms and parameter choices. Now that we have identified a most probable model, the Switching Model, we next demonstrate that the model predictions still hold in a more detailed, stochastic setting.
We used the stochastic simulation platform Cytosim (Nedelec and Foethke, 2007) to implement a microscopic realization of the Switching Model. To do this, we decided on specific molecular players that could create the postulated forces. While we do not know the exact molecular mechanism, we implemented what is the most likely constellation based on the experimental data available. We suggested the following mechanisms (Figure 6B, right):
Each nucleus is surrounded by an aster of MTs. The minus ends of the MTs are anchored at the nuclear membrane
During stages 14–16, the molecular motor dynein, anchored at the nuclear envelope, is active
During stages 16 and 17, the molecular motor kinesin-5, diffusing in the cytoplasm, is active
FIGURE 6:

Stochastic modelling of nuclear positioning. (A) The paths as a function of the time step of the nuclear centroids’ y-positions of one simulation. Different colors indicate different nuclei. The yellow and red bars underneath indicate which molecules are active at what times. Dashed horizontal lines refer to the simulation snapshots in B. (B) Simulation snapshots of the stochastic microscopic simulation in A (gray background, right) and the deterministic macroscopic simulation (white background, left) at different developmental stages of the embryo indicated by dashed lines in A. Nuclei are shown in red. MTs are shown in blue, kinesin-5s in green, and dyneins at the nuclear envelope in orange. Right: Schematics of the individual interactions between nuclei, MTs, and motors. Further details can be found in the Supplemental Material. (C) Splitting statistics at Stage 16 of 20 stochastic realizations, 3:3, 2:4, etc., indicate how the six nuclei were distributed into the two clusters; failure to form two clusters is counted as incorrect. (D) Histogram of nuclear y-positions of all 20 realizations for Stages 14/16/17 at times indicated in A. (E) At Stage 16, we show the clusters’ y-position as a function of the number of nuclei in the cluster. Shown is the mean and SD for those simulations, where two clusters were present. (F) Neighbor distance histogram in Stage 17 of all 20 simulations. We defined the neighbor distance for each nucleus as the average y-distance to the above and below neighbors (or the pole for the uppermost and lowermost nuclei).
In this model, dynein activity will lead to attractive forces between nuclei, since it will attach to MTs from neighboring nuclei and move toward their minus ends, thereby creating a pulling force. Kinesin-5 molecules have two motor domains attached to each other. When they attach to antiparallel MTs of different nuclei, they will move toward the plus end, hence pushing them apart. Details of the used parameters can be found in the Supplemental Material.
Figure 6, A and B, shows the outcome of one microscopic simulation. In particular, we found qualitative agreement with the one-dimensional ODE model (Figure 6B) and the biological observations; that is, we reproduced the three different nuclear patterns—clustering, cluster splitting, and spreading. To investigate the effect of stochasticity, we ran the simulation 20 times with the same parameters. Stochastic effects enter the simulation through Brownian motion of all structures (nuclei, fibers, and motors), stochastic binding and unbinding events of the motors, and stochastic growth and shrinkage of the MTs, as well as their distribution along the nuclear membrane. Figure 6, C–F shows that the qualitative behavior of nuclei at the three stages remained consistent across simulations. At Stage 16, we found that while nuclei are split into two clusters in 90% of the simulations, their exact distribution varies between perfectly balanced splitting (3:3) and very unbalanced splitting (1:5), as shown in Figure 6C. We further observed in the simulations that the more nuclei a cluster contained, the closer to the cell center it was (Figure 6E), a prediction that can be tested in experiments. Finally, at Stage 17, we observed mostly well-spread nuclei with a typical internuclear distance of about 6 μm (Figure 6F).
DISCUSSION
The question addressed here is: what are the mechanical forces responsible for the dynamic positioning of multiple nuclei in the myotube, from clustering, to splitting into two clusters, to spreading? Our computational screen resulted in a favorite model, according to which short-range internuclear attraction clustered the nuclei together at the first stage, while long-range internuclear repulsion at the last stage spread the nuclei evenly across the cell length. The internuclear repulsion was complemented by forces of repulsion from the poles, which played a minor role in the model, simply ensuring that the most ventral and dorsal nuclei do not go to the very poles. The model posited that all these forces overlapped in time: the repulsion was switched on before the attraction was switched off. In this middle stage, the large nuclear cluster split in two because, for a given nucleus, only its neighbors attracted it, but all other nuclei repelled it, as the repulsion forces are long-ranged. One might doubt that MTs can propagate the repulsion force in the crowded cluster; however, an explicit mechanical model with steric repulsions gave the same prediction.
Our model is, in fact, similar to the qualitative model in (Cadot et al., 2012), in which the authors proposed that dynein in the initial step generates the nuclear centration, and kinesin-1 at the next step is responsible for the spreading. Our model is also, remarkably, qualitatively similar to the atomic nucleus model (Bohr and Wheeler, 1939) explaining the process of nuclear fission in heavy nuclei as follows: protons and neutrons attract each other by very short-range and strong nuclear forces mediated by exchanging elementary particles called mesons. When the nucleus is large, however, the long-range electrostatic repulsion between protons, which increases effectively with the nuclear size, overcomes the repulsion between the nearest neighbors in the nucleus, splitting the nucleus into halves.
We supported the computational screen of the simple one-dimensional models, in which the nuclei interact as particles by isotropic and deterministic forces, with simulations of a detailed two-dimensional agent-based mechanical model, in which we simulate hundreds of motors and MTs undergoing dynamic instability, bending and pushing on the nuclei and boundary. In these simulations, the qualitative character of forces from the simple model is reproduced by the molecularly explicit actions of MTs and kinesin-like motors. These simulations reproduced the observed sequence of the positioning events and confirmed that stochastic, elastic and geometric effects do not invalidate the simple models’ assumptions. Note that the exact combination of motors responsible for the predicted forces would be very hard to decipher from modeling alone. For example, kinesin-1 and dynein on the nuclear envelopes (Wilson and Holzbaur, 2012; Folker et al., 2014), or dynein on the nuclear envelopes and kinesin-1 at the MT-MT overlaps (Cadot et al., 2012), or more complex motor combinations would be sufficient.
We tested the model by using observations from cells with reduced and overexpressed MT-associated protein Ens/MAP7, in which interactions of MTs with kinesin motors are affected. In agreement with these data, the model predicted that in the KD/OE cells, where the repulsive internuclear force is likely diminished/increased, respectively, the nuclei are less/more spread, respectively. We further tested the model in Robo mutants, where the cell fusion machinery is perturbed, causing a variable number of nuclei per myotube. In quantitative agreement with the measurements, the degree of spreading increases with the nuclear number.
In addition to these tests, other observations reported in the literature agree with our model. For example, it was reported that in Ens-inhibited cells the nuclear cluster falls apart slightly in stage 17 (Rosen et al., 2019), which is exactly the effect predicted by our model (in Figure 4, we only reported the model simulations for stage 16). It appears that when the nuclear clusters are not split evenly in the wild-type cells, a nucleus from the bigger cluster splits from this cluster (Folker et al., 2014), which can be explained by the effective repulsion force in the greater clusters overcoming the short-range attraction. Finally, recent modeling and experiments proved that MT anchoring in the nuclear envelopes is necessary for the spreading of the nuclei in muscle cells (Gimpel et al., 2017), indicating the requirement for the internuclear forces. In the future, experiments using laser ablation of nuclear connection to the poles, examining natural variations in cell populations, careful fluorescent imaging of MTs and motors, using nuclear shapes as proxies for force measurements, and micromanipulation and optogenetics experiments will help to distinguish between molecular mechanistic origins of the forces. Note that examining the transient dynamics of the force-balance equations is probably not productive, because the dynamics of the nuclear positioning depends on slow developmental changes on the scale of hours, not on mechanical relaxation.
A nontrivial prediction of our model for longer myotubes with a greater number of nuclei (either in Drosophila or in vertebrates) is that there could be a split stage between the clustering and spread stages, albeit with many clusters of 2–4 nuclei per cluster, rather than with two great clusters, moving apart. A few images and movies from two recent studies (Falcone et al., 2014; Gimpel et al., 2017), in fact, are suggestive of this phenomenon; it could be that more known examples were simply overlooked.
Our computational screen resulted in two other models that successfully reproduced the observed sequence of nuclear positioning in the LT Drosophila myotubes. In both models, the initial clustering is due to nuclear repulsion from the poles. Then, in one of them, the internuclear repulsion, together with the attraction of all nuclei to the cell center, acted abruptly, after which the initial pole repulsion switched off. In another model, the internuclear repulsion is gradually increasing without the initial pole repulsion being switched off. These models were less robust than our favorite model. For example, in the latter, if strengths of internuclear repulsions fluctuated, the nuclei still spread. In the other two models, if the background attraction or repulsion from the poles became too strong or too weak, the spreading stage could be severely perturbed. Also, these two models, without additional assumptions, predicted that initially the nuclei cluster to the cell center, while the favorite model suggested that the initial cluster could be biased to one of the cell poles, as observed. Perhaps the strongest argument against these two models is that the initial repulsion from the poles must be very long-ranged, and mechanical implementation of such a force is very nontrivial in the long cells, where buckling of the MTs would dissipate the long-range forces. However, it is beneficial to have more than one mechanistic model to guide future experimental efforts.
It is thought-provoking to speculate on why the nuclear positioning in the myotube proceeds through the clustering–split–spread sequence of events. In Drosophila embryos, muscle size has often been correlated with the number of fusion events (Bate, 1990), and it is possible that having the nuclei initially all in one cluster could be part of the fusion machinery and/or of “counting” the number of fusions (Schejter and Baylies, 2010; Deng et al., 2017). The last, spread, stage is very likely linked to the myonuclear domain hypothesis, which postulates that each nucleus in a muscle syncytium only supplies its immediately surrounding cytoplasm with gene products (Pavlath et al., 1989). As such, the muscle nuclei are spread out to minimize transport distances throughout the cytoplasm (Bruusgaard et al., 2003, Windner et al., 2019). The intermediate, split, stage could, in fact, be a functionless consequence of temporary overlap of the two sets of forces—one ensuring the single cluster at the earlier stage, another pushing the nuclei apart at the later stage. However, another possibility is that the physical spreading process is more robust when instead of single nuclei traveling long distances through the long cell filled with cytoskeletal obstacles, the small nuclear clusters deliver groups of nuclei close to their destination, and only then the individual nuclei from these clusters travel short distances.
Last, but not least, we should not forget that force balances other than the three models resulting from the computational screen are still possible. For example, the spread stage may be due to the forces driving the nuclei toward the muscle poles, opposed by the internuclear attractive forces; such a hypothesis was suggested in Rosen et al. (2019). Our screen ruled this hypothesis out because, to produce the split stage, a third type of force would be required. We implicitly used the Occam’s razor principle, looking for the simplest combination of no more than two types of forces. Future research will show whether respective complex scenarios are enacted in developing muscle cells.
Our modeling approach can be tested in the future in cases of other nuclear movements, both experimentally and theoretically investigated earlier, including dynein actions preventing nuclear clustering in filamentous fungus development (Grava et al., 2011, Gibeaux et al., 2017), MT-dependent repulsion of uniformly spaced nuclei in filamentous fungus (Anderson et al., 2013), regular MT-based spacing of nuclei on the surface of the early Drosophila syncytium (Dutta et al., 2019), and nuclear spreading by hydrodynamic forces in the Drosophila embryo (Deneke et al., 2019). Similarly, the computational force screening can be applied to mitotic spindle positioning (Wu et al., 2017), and it has already been applied to the positioning of centrosomes in the spindle (Wollman et al., 2008). One of the future challenges is to understand the quantitative mechanisms of actin–myosin-related spreading of nuclei to the cylindrical surface of the muscle cell (Roman and Gomes, 2018), which will require three-dimensional modeling.
MATERIALS AND METHODS
Here we provide details on the experimental results shown in Figures 1A and 4, A and C.
Fly stocks
All D. melanogaster stocks were grown on standard cornmeal medium at 25°C. The following stocks were used: apterousME-NLS::dsRed (apRed/control) (Richardson et al., 2007), ensswo (Metzger et al., 2012), Mef2-Gal4 (Ranganayakulu et al., 1998), UAS-Ens-HA (Metzger et al., 2012), UAS-robo.myc (gift from the Bashaw lab; Bashaw et al., 1998), sns-GAL4 (gift from the Abmayr lab; Kocherlakota et al., 2008) and duf-GAL4 (Deng et al., 2015). From the Bloomington Drosophila Stock Center: robo11/1 (8755; Kidd et al., 1998). To visualize nuclei in the Lateral Transverse muscles, stocks were crossed with apRed (Richardson et al., 2007) which fluorescently labels nuclei. The GAL4-UAS system (Brand and Perrimon, 1993) was used to express the UAS constructs. Embryos were staged according to (Campos-Ortega and Hartenstein, 2013).
Fluorescent antibody staining
Embryos were prepared for staining as previously described (Richardson et al., 2007). Embryos were incubated in primary antibody for 1 h at room temperature or overnight at 4°C and used at the following dilutions: rat anti-Tropomyosin (50567, Abcam, Cambridge, UK), 1:500; rabbit anti-DsRed (632496, Clontech, Mountain View, CA), 1:400; chicken anti-GFP (13970, Abcam), 1:500. Alexa fluor-conjugated secondary antibodies (Invitrogen, Carlsbad, CA) were applied 1:400 for 1 h at room temperature. Fluor-conjugated phalloidin (Life Technologies, Carlsbad, CA) were added with the secondary antibody at 1:100. Samples were mounted in ProLong Gold antifade reagent (Invitrogen).
Imaging
Z-stacks of fixed samples were acquired using a Zeiss LSM700 laser-scanning confocal microscope using a Plan-Apochromatic 20×/0.8-NA M27 objective and PlanNeo 40×/1.3-NA oil-immersion objective and processed in FIJI/ImageJ (NIH).
Quantification of the maximum spread
For analysis of nuclear spread at stage 16, embryos of all genotypes carrying apRed were used to visualize the nuclei in the lateral transverse muscles. Maximum spread was calculated using the segmented line function in FIJI to measure the distances from the dorsalmost nucleus to the dorsal myotube pole, the ventralmost nucleus to the ventral myotube pole, and the total myotube length. Maximum spread was calculated by subtracting the first two values from the third and expressing the difference as a percentage of total myotube length. A minimum of 17 and a maximum of 40 muscles were analyzed.
Quantification of the number of nuclei
To count nuclear number in the LTs, embryos carrying apRed were collected and dechorionated using 50% bleach for 4 min at room temperature. After being rinsed, embryos were quickly heat-fixed in water at 65°C and mounted in halocarbon oil on a glass slide. The number of nuclei was counted per muscle in stage 17 embryos, when it is possible to identify individual myonuclei. A minimum of 26 and a maximum of 49 muscles were analyzed.
Modeling and simulations
Details are described in the Supplemental Material.
Supplementary Material
Acknowledgments
This work was supported by the National Institutes of Health (GM121971, AR068128) to M.K.B. and a National Cancer Institute core grant (P30 CA008748) to Memorial Sloan Kettering Cancer Center.
Abbreviations used:
- KD
knockdown
- LT
lateral transverse
- MAPs
microtubule-associated proteins
- MT
microtubule
- ODE
ordinary differential equation
- OE
overexpressed
- WT
wild-type
Footnotes
This article was published online ahead of print in MBoC in Press (http://www.molbiolcell.org/cgi/doi/10.1091/mbc.E19-12-0711) on March 4, 2020.
REFERENCES
- Abmayr SM, Pavlath GK. (2012). Myoblast fusion: lessons from flies and mice. Development , 641–656. [DOI] [PMC free article] [PubMed] [Google Scholar]
- Anderson CA, Eser U, Korndorf T, Borsuk ME, Skotheim JM, Gladfelter AS. (2013). Nuclear repulsion enables division autonomy in a single cytoplasm. Curr Biol , 1999–2010. [DOI] [PMC free article] [PubMed] [Google Scholar]
- Bashaw GJ, Kidd T, Murray D, Pawson T, Goodman CS. (1998). Repulsive axon guidance: Abelson and enabled play opposing roles downstream of the roundabout receptor. Cell , 703–715. [DOI] [PubMed] [Google Scholar]
- Bate M. (1990). The embryonic development of larval muscles in Drosophila. Development , 791–804. [DOI] [PubMed] [Google Scholar]
- Baye LM, Link BA. (2008). Nuclear migration during retinal development. Brain Res , 29–36. [DOI] [PMC free article] [PubMed] [Google Scholar]
- Bohr N, Wheeler J. (1939). The mechanism of nuclear fission. Phys Rev , 426–450. [Google Scholar]
- Brand AH, Perrimon N. (1993). Targeted gene expression as a means of altering cell fates and generating dominant phenotypes. Development , 401–415. [DOI] [PubMed] [Google Scholar]
- Bruusgaard J, Liestøl K, Ekmark M, Kollstad K, Gundersen K. (2003). Number and spatial distribution of nuclei in the muscle fibres of normal mice studied in vivo. J Physiol , 467–478. [DOI] [PMC free article] [PubMed] [Google Scholar]
- Cadot B, Gache V, Gomes ER. (2015). Moving and positioning the nucleus in skeletal muscle—one step at a time. Nucleus , 373–381. [DOI] [PMC free article] [PubMed] [Google Scholar]
- Cadot B, Gache V, Vasyutina E, Falcone S, Birchmeier C, Gomes ER. (2012). Nuclear movement during myotube formation is microtubule and dynein dependent and is regulated by Cdc42, Par6 and Par3. EMBO reports , 741–749. [DOI] [PMC free article] [PubMed] [Google Scholar]
- Campos-Ortega JA, Hartenstein V. (2013). The Embryonic Development of Drosophila melanogaster, New York: Springer. [Google Scholar]
- Collins MA, Mandigo TR, Camuglia JM, Vazquez GA, Anderson AJ, Hudson CH, Hanron JL, Folker ES. (2017). Emery-Dreifuss muscular dystrophy–linked genes and centronuclear myopathy–linked genes regulate myonuclear movement by distinct mechanisms. Mol Biol Cell , 2303–2317. [DOI] [PMC free article] [PubMed] [Google Scholar]
- Deneke VE, Puliafito A, Krueger D, Narla AV, De Simone A, Primo L, Vergassola M, De Renzis S, Di Talia S. (2019). Self-organized nuclear positioning synchronizes the cell cycle in Drosophila embryos. Cell , 925–941. [DOI] [PMC free article] [PubMed] [Google Scholar]
- Deng S, Azevedo M, Baylies MK. (2017). Acting on identity: myoblast fusion and the formation of the syncytial muscle fiber. Semin Cell Dev Biol , 45–55. [DOI] [PMC free article] [PubMed] [Google Scholar]
- Deng S, Bothe I, Baylies MK. (2015). The formin diaphanous regulates myoblast fusion through actin polymerization and arp2/3 regulation. PLoS Genet , e1005381. [DOI] [PMC free article] [PubMed] [Google Scholar]
- Dubowitz V, Oldfors A, Sewry CA. (2013). Muscle Biopsy E-Book: A Practical Approach, Amsterdam: Elsevier. [Google Scholar]
- Dupin I, Etienne-Manneville S. (2011). Nuclear positioning: mechanisms and functions. Int J Biochem Cell Biol , 1698–707. [DOI] [PubMed] [Google Scholar]
- Dutta S, Djabrayan NJ, Torquato S, Shvartsman SY, Krajnc M. (2019). Self-similar dynamics of nuclear packing in the early Drosophila embryo. Biophys J , 743–750. [DOI] [PMC free article] [PubMed] [Google Scholar]
- Elhanany-Tamir H, Yanxun VY, Shnayder M, Jain A, Welte M, Volk T. (2012). Organelle positioning in muscles requires cooperation between two KASH proteins and microtubules. J Cell Biol , 833–846. [DOI] [PMC free article] [PubMed] [Google Scholar]
- Falcone S, Roman W, Hnia K, Gache V, Didier N, Laine J, Aurade F, Marty I, Nishino I, Charlet-Berguerand N, et al (2014). N-wasp is required for amphiphysin-2/bin1-dependent nuclear positioning and triad organization in skeletal muscle and is involved in the pathophysiology of centronuclear myopathy. EMBO Mol Med , 1455–1475. [DOI] [PMC free article] [PubMed] [Google Scholar]
- Folker ES, Baylies MK. (2013). Nuclear positioning in muscle development and disease. Front Physiol , 363. [DOI] [PMC free article] [PubMed] [Google Scholar]
- Folker ES, Schulman VK, Baylies MK. (2012). Muscle length and myonuclear position are independently regulated by distinct dynein pathways. Development , 3827–3837. [DOI] [PMC free article] [PubMed] [Google Scholar]
- Folker ES, Schulman VK, Baylies MK. (2014). Translocating myonuclei have distinct leading and lagging edges that require kinesin and dynein. Development , 355–366. [DOI] [PMC free article] [PubMed] [Google Scholar]
- Gache V, Gomes E, Cadot B. (2017). Microtubule motors involved in nuclear movement during skeletal muscle differentiation. Mol Biol Cell , 865–874. [DOI] [PMC free article] [PubMed] [Google Scholar]
- Gibeaux R, Politi AZ, Philippsen P, Nédélec F. (2017). Mechanism of nuclear movements in a multinucleated cell. Mol Biol Cell , 645–660. [DOI] [PMC free article] [PubMed] [Google Scholar]
- Gimpel P, Lee YL, Sobota RM, Calvi A, Koullourou V, Patel R, Mamchaoui K, Nédélec F, Shackleton S, Schmoranzer J, et al (2017). Nesprin-1α-dependent microtubule nucleation from the nuclear envelope via Akap450 is necessary for nuclear positioning in muscle cells. Curr Biol , 2999–3009. [DOI] [PMC free article] [PubMed] [Google Scholar]
- Grava S, Keller M, Voegeli S, Seger S, Lang C, Philippsen P. (2011). Clustering of nuclei in multinucleated hyphae is prevented by dynein-driven bidirectional nuclear movements and microtubule growth control in Ashbyagossypii. Eukaryot Cell , 902–915. [DOI] [PMC free article] [PubMed] [Google Scholar]
- Gundersen GG, Worman HJ. (2013). Nuclear positioning. Cell , 1376–1389. [DOI] [PMC free article] [PubMed] [Google Scholar]
- Kano Y, Fujimaki N, Ishikawa H. (1991). The distribution and arrangement of microtubules in mammalian skeletal muscle fibers. Cell Struct Funct , 251–261. [DOI] [PubMed] [Google Scholar]
- Kidd T, Brose K, Mitchell KJ, Fetter RD, Tessier-Lavigne M, Goodman CS, Tear G. (1998). Roundabout controls axon crossing of the cns midline and defines a novel subfamily of evolutionarily conserved guidance receptors. Cell , 205–215. [DOI] [PubMed] [Google Scholar]
- Kocherlakota KS, Wu JM, McDermott J, Abmayr SM. (2008). Analysis of the cell adhesion molecule sticks-and-stones reveals multiple redundant functional domains, protein-interaction motifs and phosphorylated tyrosines that direct myoblast fusion in drosophila melanogaster. Genetics , 1371–1383. [DOI] [PMC free article] [PubMed] [Google Scholar]
- Koke C, Kanesaki T, Grosshans J, Schwarz US, Dunlop CM. (2014). A computational model of nuclear self-organisation in syncytial embryos. J Theor Biol , 92–100. [DOI] [PubMed] [Google Scholar]
- Manhart A, Windner S, Baylies M, Mogilner A. (2018). Mechanical positioning of multiple nuclei in muscle cells. PLoS Comput Biol , e1006208. [DOI] [PMC free article] [PubMed] [Google Scholar]
- Metzger T, Gache V, Xu M, Cadot B, Folker ES, Richardson BE, Gomes ER, Baylies MK. (2012). Map and kinesin-dependent nuclear positioning is required for skeletal muscle function. Nature , 120–124. [DOI] [PMC free article] [PubMed] [Google Scholar]
- Mogilner A, Manhart A. (2018). Intracellular fluid mechanics: coupling cytoplasmic flow with active cytoskeletal gel. Annu Rev Fluid Mech , 347–370. [Google Scholar]
- Nedelec F, Foethke D. (2007). Collective Langevin dynamics of flexible cytoskeletal fibers. New J Phys , 427. [Google Scholar]
- Pavlath GK, Rich K, Webster SG, Blau HM. (1989). Localization of muscle gene products in nuclear domains. Nature , 570–573. [DOI] [PubMed] [Google Scholar]
- Rafelski SM, Marshall WF. (2008). Building the cell: design principles of cellular architecture. Nat Rev Mol Cell Biol , 593–602. [DOI] [PubMed] [Google Scholar]
- Ranganayakulu G, Elliott DA, Harvey RP, Olson EN. (1998). Divergent roles for NK-2 class homeobox genes in cardiogenesis in flies and mice. Development , 3037–3048. [DOI] [PubMed] [Google Scholar]
- Richardson BE, Beckett K, Nowak SJ, Baylies MK. (2007). Scar/wave and arp2/3 are crucial for cytoskeletal remodeling at the site of myoblast fusion. Development , 4357–4367. [DOI] [PMC free article] [PubMed] [Google Scholar]
- Roman W, Gomes ER. (2018). Nuclear positioning in skeletal muscle. Seminars Cell Dev Biol , 51–56. [DOI] [PubMed] [Google Scholar]
- Rosen JN, Azevedo M, Soffar DB, Boyko VP, Brendel MB, Schulman VK, Baylies MK. (2019). The Drosophila ninein homologue bsg25d cooperates with ensconsin in myonuclear positioning. J Cell Biol , 524–540. [DOI] [PMC free article] [PubMed] [Google Scholar]
- Schejter ED, Baylies MK. (2010). Born to run: creating the muscle fiber. Curr Opin Cell Biol , 566–574. [DOI] [PMC free article] [PubMed] [Google Scholar]
- Schulman VK, Dobi KC, Baylies MK. (2015) Morphogenesis of the somatic musculature in Drosophilamelanogaster. WIRES Dev Biol , 313–334. [DOI] [PMC free article] [PubMed] [Google Scholar]
- Tassin AM, Maro B, Bornens M. (1985). Fate of microtubule-organizing centers during myogenesis in vitro. J Cell Biol , 35–46. [DOI] [PMC free article] [PubMed] [Google Scholar]
- Weitkunat M, Schnorrer F. (2014). A guide to study Drosophila muscle biology. Methods , 2–14. [DOI] [PubMed] [Google Scholar]
- Wilson MH, Holzbaur EL. (2012). Opposing microtubule motors drive robust nuclear dynamics in developing muscle cells. J Cell Sci , 4158–4169. [DOI] [PMC free article] [PubMed] [Google Scholar]
- Windner SE, Manhart A, Brown A, Mogilner A, Baylies MK. (2019). Nuclear scaling is coordinated among individual nuclei in multinucleated muscle fibers. Dev Cell , 48–62. [DOI] [PMC free article] [PubMed] [Google Scholar]
- Wollman R, Civelekoglu-Scholey G, Scholey JM, Mogilner A. (2008). Reverse engineering of force integration during mitosis in the Drosophila embryo. Mol Sys Biol , 195. [DOI] [PMC free article] [PubMed] [Google Scholar]
- Wu HY, Nazockdast E, Shelley MJ, Needleman DJ. (2017). Forces positioning the mitotic spindle: theories, and now experiments. Bioessays , 1600212. [DOI] [PubMed] [Google Scholar]
Associated Data
This section collects any data citations, data availability statements, or supplementary materials included in this article.