

Abstract
The historic wildfires of August and September 2020, up and down the west coast have made Western cities in the U.S. rank among the highest in the world for dirtiest air. Washington State was impacted by active wildfire smoke in the state as well as transported aged wood smoke from Oregon and California. Particulate matter smaller than 2.5 μm in aerodynamic diameter (PM2.5) is the primary pollutant from wildfire smoke of health concern for the public. This study aims to assess the potential population health impact of increased PM2.5 concentrations attributable to the wildfire smoke. Daily PM2.5 concentrations for each county before and during the 2020 Washington state wildfire smoke episode was obtained from the WA Department of Ecology. Utilizing previously established associations of short-term mortality and PM2.5 concentrations we estimated increases in all-cause, respiratory, and cardiovascular mortality for Washington state attributable to the increased PM2.5 levels during the wildfire episode. During the episode, PM2.5 concentrations increased 99.4 μg/m3 on average in Washington. Each week of wildfire smoke exposures are estimated to cause 91.0 (95% CI: 73.8, 107.1) cases of increased all-cause mortality, 19.9 (95% CI: 10.4, 29.3) increased cardiovascular disease deaths, and 9.7 (95% CI: 5.4, 14.0) increased respiratory disease deaths. This is without considering the coincidence with the COVID-19 pandemic, since wildfire smoke exposure may exacerbate the effects of SARS-CoV-2 infection based on some early evidence. Because wildfire smoke episodes are likely to continue impacting the Pacific Northwest in years to come, continued preparedness and mitigations to reduce exposures to wildfire smoke are necessary to avoid this excess health burden.
Keywords: wildfires, wildland fires, health impact assessment, fine particulate matter, mortality
1. Introduction
A series of major wildfires has impacted air quality in western regions of the US in 2020, starting notably in Northern California on August 19, sparked by intense thunderstorms combined with a dry winter and sweltering summer. The northern California fires were followed by large fire complexes in Southern California, Oregon, and Washington. As of September 16, 22 large fires have been reported in California (2.3 million acres), 12 in Oregon (0.9 million acres), and 11 in Washington (0.7 million acres) [1]. The intense smoke from these fires has resulted in major regional increases in concentrations of airborne particulates with a diameter of 2.5 μm or less (PM2.5). As winds shifted from fire-prone dry easterly flow to a northwesterly flow, smoke from the west coast fires that had traveled over the Pacific Ocean was transported to the Pacific Northwest. This has resulted in some of the highest air pollution levels ever observed in Washington state.
Wildfire smoke consists of a mixture of air pollutants, including particulate matter, carbon monoxide, nitrogen oxides, acrolein, formaldehyde, benzene, benzo[a]pyrene, and dibenz[a,h]anthracene. The composition can vary from fire to fire, depending on the fuel (the type of vegetation, whether it burned through a town or structures), temperature and aging in the atmosphere [2]. The particle size of the smoke tends to be very small, approximately 0.4 to 0.7 μm in diameter. These particle sizes are harmful to human health because they are sufficiently small to be inhaled deep into the lungs [2].
The goal of this paper is to assess the potential human health impact of increased PM2.5 concentrations attributable to the wildfire smoke. As of the time of this analysis (September 16), the PM2.5 level is still elevated across the region. Therefore, the impact estimates are meant to help prepare for, and inform proactive measures to reduce smoke-induced health effects of this current smoke episode. The analysis utilizes evidence from previously published studies on short-term mortality associated with PM2.5 concentrations, and concentration-response relationships. We estimate increases in all-cause, respiratory, and cardiovascular mortality for Washington state.
2. Methods
2.1. PM2.5 Exposures
We obtained the daily PM2.5 concentration in each county from Washington’s Air Monitoring Network (https://enviwa.ecology.wa.gov/Report/Hr24PM25SummaryNew). Counties with regulatory air monitors were assigned the average of PM2.5 concentrations from available monitors in each county. Counties without regulatory monitors (six counties: Douglas County, Lincoln County, Pend Oreille County, San Juan County, Skamania County and Wahkiakum County, see Figure A1) were assigned the average of PM2.5 concentrations from all monitors in Washington. The PM2.5 levels before the wildfire were defined as the mean of daily PM2.5 concentrations from January 1 to September 6, 2020; PM2.5 levels during the wildfire period were defined as the mean of daily PM2.5 concentrations from September 7 to September 15, 2020.
2.2. Health impact assessment
We performed a health impact assessment for Washington to estimate the excess mortality attributable to increased PM2.5 during the wildfire. The attributable fraction (AF) method was used to estimate the increased daily mortality following the equations below:
| (eq 1) |
| (eq 2) |
where AF is the attributable fraction of health events attributable to PM2.5 exposure, β is the cause-specific coefficient of the concentration-response functions (CRF) for PM2.5, Δc is the change in PM2.5 due to the wildfire, ΔY is the estimated health impact of PM2.5 attributable to PM2.5 , Y0 is the baseline cause-specific mortality, and Pop is the exposed population.
The coefficient of CRF for short-term PM2.5 exposures and mortality (including all-cause mortality, cardiovascular diseases mortality and respiratory diseases mortality) was adopted from a previous meta-analysis [3]. The changes in PM2.5 before and during the wildfire was calculated by county as described above. The age-adjusted cause-specific mortality rate for the general population in Washington state was obtained from the Washington State Department of Health [4]. The resident population data for each county in Washington was the population estimates in 2019 from the U.S. Census Bureau [5].
After the above calculation by county, we summed the daily increased mortality for each county to calculate the increased daily deaths in Washington during the wildfire. Finally, we assessed the total increased deaths in Washington attributable to wildfire by multiplying the increase daily deaths by the total number of days of elevated exposure due to the wildfire episode.
2.3. Sensitivity analysis
Nephelometers are used at different monitoring sites in the regulatory air quality monitoring network in Washington. Although they are normally calibrated to U.S. EPA federal reference method measurements, there is the potential that these calibrations may not be appropriate for the unusually high PM2.5 concentrations observed during the wildfire smoke episode. Therefore, we conducted a sensitivity analysis, excluding the PM2.5 concentrations reported from nephelometers. Following the same health impact assessment procedures, increased mortality attributable to wildfire in Washington was estimated for the different number of days during the wildfire episode.
Additionally, we conducted a sensitivity analysis to assign the six counties without monitoring site the average of PM2.5 concentrations of nearby counties. Following the same health impact assessment procedures, we estimated the increased mortality attributable to wildfire in Washington for the different number of days during the wildfire episode.
3. Results
The PM2.5 concentrations of each county in Washington are summarized in Table 1. Large variations in PM2.5 concentrations existed during the occurrence of the wildfire (standard deviation, SD = 53.8 μg/m3). The Klickitat county located on the southern border of Washington State was heavily impacted by smoke transport from Oregon fire, and was the most affected one during the wildfire episode, where PM2.5 concentrations showed an 80-fold of increased over pre-wildfire levels (Table A1 and Table A2). After excluding PM2.5 concentrations measured by nephelometers, the increase in PM2.5 levels during the wildfire reached 112.6 μg/m3 (SD: 38.8 μg/m3) (Table A2). When assigning the average of PM2.5 concentrations from nearby counties to those without monitoring sites, the increase in PM2.5 levels during the wildfire was 100.3 μg/m3 (SD: 51.3 μg/m3) (Table A3).
Table 1.
Summary of PM2.5 concentrations in Washington before and during the wildfire, 2020.
| PM2.5 concentrations (μg/m3) | Mean | SD | Median | Range | Minimum | Maximum |
|---|---|---|---|---|---|---|
| Before wildfire | 4.3 | 1.5 | 4.0 | 6.8 | 1.9 | 8.6 |
| During wildfire | 103.8 | 53.8 | 90.8 | 297.3 | 32.4 | 329.7 |
| Increases | 99.4 | 53.6 | 86.9 | 295.3 | 30.2 | 325.5 |
According to the health impact assessment, each week’s wildfire would lead to 91.0 (95% CI: 73.8, 107.1) increased cases of all-cause mortality, 19.9 (95% CI: 10.4, 29.3) increased cardiovascular disease deaths, and 9.7 (95% CI: 5.4, 14.0) increased respiratory disease deaths (Figure 1). If the wildfire lasts for a month (31 days), more than 400 all-cause deaths would be attributable to the wildfire. Increased mortality attributable to increased PM2.5 concentrations during each week of the wildfire episode in each county in Washington State have been summarized in Table A1 and Table A2.
Figure 1.
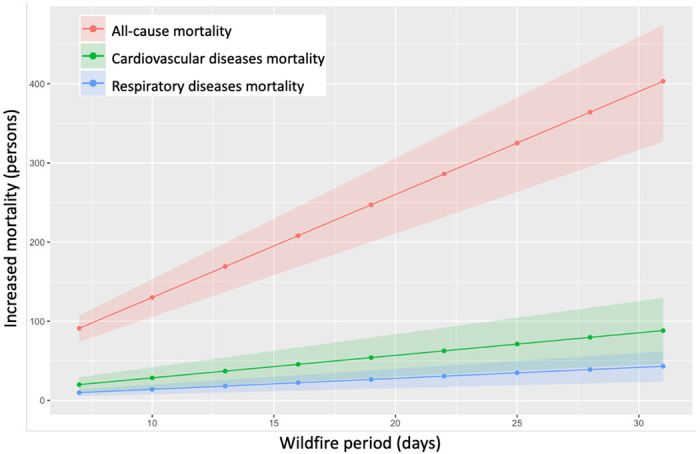
Increased mortality attributable to the wildfire in Washington.
The sensitivity analysis, excluding PM2.5 concentrations measured by nephelometers, resulted in slightly higher estimates, with each week of wildfire causing 104.6 (95% CI: 84.9, 123.0) more all-cause deaths, 22.9 (95% CI: 12.0, 33.6) increased cardiovascular disease deaths, and 11.2 (95% CI: 6.2, 16.0) excess respiratory disease deaths (Figure A2). The sensitivity analysis, assigning the average of PM2.5 concentrations from nearby counties to those without monitoring sites, resulted in similar estimates, with each week of wildfire causing 90.8 (95% CI: 73.5, 106.8 more all-cause deaths, 19.8 (95% CI: 10.4, 29.2) increased cardiovascular disease deaths, and 9.7 (95% CI: 5.3, 13.9) excess respiratory disease deaths (Figure A3).
Discussion
Our findings indicate considerable excess mortality due to elevated PM2.5 concentrations that will increase with longer durations of the wildfire smoke episode in Washington state. We estimate increases of 91.0 (95% CI: 73.8, 107.1) all-cause, 19.9 (95% CI: 10.4, 29.3) cardiovascular, and 9.7 (95% CI: 5.4, 14.0) respiratory deaths for each additional week of elevated wildfire smoke based on the average PM2.5 concentrations observed thus far. Although our analysis focused on quantifying increased mortality, the findings are consistent with recent reports of increased hospital emergency room visits (increases of 3 people/day with respiratory issues at Harborview Medical Center, one of the larger hospitals in the Seattle area) and excess numbers of emergency medical service (EMS) calls in Snohomish County [6]. While the news reporting has focused on respiratory issues, our findings indicate that with respect to mortality, the cardiovascular health effects may be greater than the respiratory effects.
Our findings are also consistent with previous studies of the health effects associated with wildfire smoke exposure. Systematic reviews provide consistent evidence for the positive associations between wildfire smoke exposures and all-cause mortality and respiratory health [7–9]. A recent case-crossover study in Washington found the previous day’s exposure to wildfire smoke increased non-traumatic mortality by 2% (95% CI: 0.0, 5.0%), and the same-day exposure to wildfire smoke increased respiratory mortality by 9% (95% CI: 0.0, 18.0%) compared to non-wildfire smoke days [10]. Although results are mixed for the cardiovascular health effects of wildfire smoke exposures, an increasing number of recent publications provide cumulative evidence for the association between wildfire smoke exposures and adverse cardiovascular outcomes. During the 2015 California wildfire, increased all-cause cardiovascular and cerebrovascular emergency department visits were reported on smoke days compared to days without smoke, especially on dense smoke days and among older adults (residents aged >65 years) [11]. Similarly, another study found increased out-of-hospital cardiac arrest risk was associated with heavy smoke days (lag day 2 odds ratio: 1.7, 95% CI: 1.18, 2.13) in California from 2015 to 2017 [12]. Additionally, a national study for more than 600 counties in the U.S. found cardiovascular hospitalizations increased 0.61% (95% CI: 0.09, 1.14) for each 10 μg/m3 increase in PM2.5 during smoke days [13].
The short-term excess mortality associated with this wildfire episode is large due to the relatively large increase in PM2.5 concentrations, not commonly observed in this part of the world. Although these are only estimates of the health impact, steps should be taken to reduce exposures to wildfire smoke to avoid this excess health burden. Already, the state governor’s office has released a series of proclamations [14] aimed at addressing the impacts of this particular wildfire episode, including (1) declaring a state of emergency (20-86) that acknowledge the “threat to life and property… impacting the life and health of citizens… a public disaster demanding immediate action”, which activated the state’s Emergency Management Plan and directed resources to address the wildfire; (2) Providing financial assistance to individuals affected by the wildfires (20-72); (3) and maintaining critical firefighting supply lines and restoration of critical utilities (20-73 and 20-73.1). Additionally, several agencies (Department of Ecology, Department of Health, US Forest Service, regional Air Quality Agencies, County Health Departments, and Tribes) had collaborated in previous years to provide information to the public via a website [15], which includes material for this wildfire event, such as information on the health effects of wildfire smoke, a real-time map of regional air quality, guidance on both the US EPA air quality index (AQI) and the Washington state air quality advisory (WAQA) [16], and recommendations with respect to recognizing relevant health symptoms, acknowledgment of particularly susceptible subpopulations, reducing outdoor physical activity, staying indoors and implementing filtration strategies, mask use, and specific guides for schools, workers, parents of children, and information in Spanish. These activities serve as a good model for preparedness and response to address the health effects of large wildfire smoke episodes.
While wildfire smoke episodes have impacted the Pacific Northwest region historically, this particular episode may be especially problematic due to the coincidence with the COVID-19 pandemic. Although there is still insufficient evidence to support this, exposure to elevated wildfire smoke may exacerbate the effects of SARS-CoV-2 infection. There is however clear evidence of increased acute lower respiratory infections with PM2.5 exposure, especially for children [17–19]. Evidence is also available for the delayed effect of higher PM2.5 levels during the wildfire season on increased influenza in the following winter flu season [20]. Given the current stay-at-home order to prevent the spread of SARS-CoV-2, fewer people may be outdoors and exposed to ambient PM2.5 than if there was not a pandemic. For instance, many children are not currently attending school in-person, which may result in less exposure to outdoor PM. However, essential workers, including many outdoor worker groups (e.g., firefighters, emergency personnel, agriculture and construction workers, delivery persons, etc.) may be groups that are more exposed to air pollution during this period, and thus might be at higher risk for health effects.
Some potential limitations of this analysis is the reliance on general PM2.5 mortality concentration-response functions rather than wildfire smoke-specific health effects. However we have deemed this appropriate as they are based on evidence from a larger group of air pollution studies, and are within the range of effects reported for wildfire studies. Additionally, we did not employ highly spatially refined exposure modeling in this analysis, but we have considered county-specific variations, which may be an appropriate scale given the size of the smoke plume from long-range transport. Also, we have not yet assessed changes in state vital records, which we would anticipate to confirm the impact assessment estimates. However, this may be a useful future activity after the smoke episode has resolved. Finally, we have only assessed mortality impacts. This is probably just the “tip of the flame”, as there may be many more affected by PM2.5 related morbidity.
Acknowledgement
We wish to acknowledge the Washington Department of Ecology for its readily available PM2.5 concentration data from throughout its extensive statewide monitoring network.
Funding sources
This research is supported in part by NIH grant 5P30 ES007033-23 and the China Scholarship Council for YL’s Fellowship funding.
Appendix
Table A1.
The average PM2.5 concentration changes in the wildfire episode and estimated mortality during each week of the wildfire episode for each county.
| County | PM2.5_before wildfire (μg/m3) | PM2.5_during wildfire (μg/m3) | PM2.5_increases (μg/m3) | Population (persons) | All-cause mortality (persons) | Cardiovascular diseases mortality (persons) | Respiratory diseases mortality (persons) |
|---|---|---|---|---|---|---|---|
| Adams | 3.2 | 77.4 | 74.2 | 19983 | 0.19 (0.15, 0.23) | 0.04 (0.02, 0.06) | 0.02 (0.01, 0.03) |
| Asotin | 6.4 | 79.5 | 73.1 | 22582 | 0.21 (0.17, 0.25) | 0.05 (0.02, 0.07) | 0.02 (0.01, 0.03) |
| Benton | 4.5 | 97.8 | 93.3 | 204390 | 2.44 (1.97, 2.87) | 0.53 (0.28, 0.78) | 0.26 (0.14, 0.38) |
| Chelan | 4.9 | 144.2 | 139.3 | 77200 | 1.34 (1.09, 1.58) | 0.29 (0.16, 0.43) | 0.14 (0.08, 0.20) |
| Clallam | 3.2 | 95.9 | 92.7 | 77331 | 0.92 (0.74, 1.08) | 0.20 (0.10, 0.29) | 0.10 (0.05, 0.14) |
| Clark | 4.6 | 172.5 | 168.0 | 488241 | 10.11 (8.24, 11.82) | 2.22 (1.18, 3.23) | 1.08 (0.60, 1.52) |
| Columbia | 4.0 | 71.4 | 67.4 | 3985 | 0.03 (0.03, 0.04) | 0.01 (0.00, 0.01) | 0.00 (0.00, 0.01) |
| Cowlitz | 3.8 | 95.2 | 91.4 | 110593 | 1.29 (1.05, 1.52) | 0.28 (0.15, 0.42) | 0.14 (0.08, 0.20) |
| Ferry | 6.9 | 113.6 | 106.7 | 7627 | 0.10 (0.08, 0.12) | 0.02 (0.01, 0.03) | 0.01 (0.01, 0.02) |
| Franklin | 3.4 | 88.5 | 85.1 | 95222 | 1.04 (0.84, 1.23) | 0.23 (0.12, 0.33) | 0.11 (0.07, 0.16) |
| Garfield | 3.7 | 66.7 | 63.0 | 2225 | 0.02 (0.01, 0.02) | 0.00 (0.00, 0.01) | 0.00 (0.00, 0.00) |
| Grant | 2.6 | 101.3 | 98.7 | 97733 | 1.23 (1.00, 1.45) | 0.27 (0.14, 0.40) | 0.13 (0.07, 0.19) |
| Grays Harbor | 3.9 | 90.8 | 86.9 | 75061 | 0.84 (0.68, 0.99) | 0.18 (0.10, 0.27) | 0.09 (0.05, 0.13) |
| Island | 2.2 | 32.4 | 30.2 | 85141 | 0.34 (0.27, 0.40) | 0.07 (0.04, 0.11) | 0.04 (0.02, 0.05) |
| Jefferson | 4.3 | 76.7 | 72.4 | 32221 | 0.30 (0.24, 0.36) | 0.07 (0.03, 0.10) | 0.03 (0.02, 0.05) |
| King | 4.9 | 94.2 | 89.3 | 2252782 | 25.77 (20.85, 30.37) | 5.63 (2.93, 8.29) | 2.76 (1.51, 3.97) |
| Kitsap | 4.2 | 83.8 | 79.6 | 271473 | 2.78 (2.25, 3.28) | 0.61 (0.32 0.90) | 0.30 (0.16, 0.43) |
| Kittitas | 1.9 | 164.9 | 163.1 | 47935 | 0.97 (0.79, 1.13) | 0.21 (0.11, 0.31) | 0.10 (0.06, 0.15) |
| Klickitat | 4.2 | 329.7 | 325.5 | 47935 | 1.78 (1.47, 2.06) | 0.40 (0.22, 0.56) | 0.19 (0.11, 0.26) |
| Lewis | 4.3 | 78.1 | 73.8 | 80707 | 0.77 (0.62, 0.91) | 0.17 (0.09, 0.25) | 0.08 (0.04, 0.12) |
| Mason | 4.0 | 132.0 | 128.0 | 66768 | 1.07 (0.87, 1.26) | 0.24 (0.12, 0.34) | 0.11 (0.06, 0.16) |
| Okanogan | 7.5 | 194.4 | 186.9 | 42243 | 0.96 (0.79, 1.13) | 0.21 (0.11, 0.31) | 0.10 (0.06, 0.14) |
| Pacific | 4.3 | 92.7 | 88.4 | 22471 | 0.25 (0.21, 0.30) | 0.06 (0.03, 0.08) | 0.03 (0.01, 0.04) |
| Pierce | 4.9 | 88.9 | 84.1 | 904980 | 9.77 (7.90, 11.52) | 2.13 (1.11, 3.15) | 1.05 (0.57, 1.51) |
| Skagit | 3.0 | 52.3 | 49.3 | 129205 | 0.83 (0.67, 0.98) | 0.18 (0.09, 0.27) | 0.09 (0.05, 0.13) |
| Snohomish | 3.4 | 72.1 | 68.8 | 822083 | 7.32 (5.91, 8.64) | 1.59 (0.83, 2.36) | 0.78 (0.43, 1.13) |
| Spokane | 5.2 | 122.7 | 117.6 | 522798 | 7.76 (6.30, 9.12) | 1.70 (0.89, 2.49) | 0.83 (0.46, 1.19) |
| Stevens | 2.8 | 88.4 | 85.6 | 45723 | 0.50 (0.41, 0.59) | 0.11 (0.06, 0.16) | 0.05 (0.03, 0.08) |
| Thurston | 3.9 | 84.0 | 80.1 | 290536 | 3.00 (2.42, 3.53) | 0.65 (0.34, 0.96) | 0.32 (0.18, 0.46) |
| Walla Walla | 4.0 | 127.7 | 123.7 | 60760 | 0.95 (0.77, 1.11) | 0.21 (0.11, 0.30) | 0.10 (0.06, 0.14) |
| Whatcom | 6.4 | 46.9 | 40.5 | 229247 | 1.22 (0.98, 1.44) | 0.26 (0.14, 0.39) | 0.13 (0.07, 0.19) |
| Whitman | 3.1 | 55.4 | 52.3 | 50104 | 0.34 (0.28, 0.40) | 0.07 (0.04, 0.11) | 0.04 (0.02, 0.05) |
| Yakima | 8.6 | 111.8 | 103.1 | 250873 | 3.29 (2.67, 3.87) | 0.72 (0.38, 1.06) | 0.35 (0.19, 0.50) |
| Other counties | 4.3 | 103.8 | 99.4 | 102245 | 1.30 (1.05, 1.53) | 0.28 (0.15, 0.42) | 0.14 (0.08, 0.20) |
Table A2.
The average PM2.5 concentrations changes in the wildfire episode and estimated mortality per 100,000 persons during each week of the wildfire episode for each county.
| County | PM2.5_before wildfire (μg/m3) | PM2.5_during wildfire (μg/m3) | PM2.5_increases (μg/m3) | Population (persons) | All-cause mortality (per 100,000 persons) | Cardiovascular diseases mortality (per 100,000 persons) | Respiratory diseases mortality (per 100,000 persons) |
|---|---|---|---|---|---|---|---|
| Adams | 3.2 | 77.4 | 74.2 | 19983 | 0.96 (0.77, 1.13) | 0.21 (0.11, 0.31) | 0.10 (0.06, 0.15) |
| Asotin | 6.4 | 79.5 | 73.1 | 22582 | 0.94 (0.76, 1.11) | 0.21 (0.11, 0.30) | 0.10 (0.06, 0.15) |
| Benton | 4.5 | 97.8 | 93.3 | 204390 | 1.19 (0.97, 1.41) | 0.26 (0.14, 0.38) | 0.13 (0.07, 0.18) |
| Chelan | 4.9 | 144.2 | 139.3 | 77200 | 1.74 (1.42, 2.04) | 0.38 (0.20, 0.56) | 0.19 (0.10, 0.26) |
| Clallam | 3.2 | 95.9 | 92.7 | 77331 | 1.19 (0.96, 1.40) | 0.26 (0.14 0.38) | 0.13 (0.07, 0.18) |
| Clark | 4.6 | 172.5 | 168.0 | 488241 | 2.07 (1.69, 2.42) | 0.46 (0.24, 0.66) | 0.22 (0.12, 0.31) |
| Columbia | 4.0 | 71.4 | 67.4 | 3985 | 0.87 (0.70, 1.03) | 0.19 (0.10, 0.28) | 0.09 (0.05, 0.14) |
| Cowlitz | 3.8 | 95.2 | 91.4 | 110593 | 1.17 (0.95, 1.38) | 0.26 (0.13, 0.38) | 0.13 (0.07, 0.18) |
| Ferry | 6.9 | 113.6 | 106.7 | 7627 | 1.36 (1.10, 1.59) | 0.30 (0.15, 0.44) | 0.14 (0.08, 0.21) |
| Franklin | 3.4 | 88.5 | 85.1 | 95222 | 1.09 (0.88, 1.29) | 0.24 (0.12, 0.35) | 0.12 (0.06, 0.17) |
| Garfield | 3.7 | 66.7 | 63.0 | 2225 | 0.82 (0.66, 0.97) | 0.18 (0.09, 0.26) | 0.09 (0.05, 0.13) |
| Grant | 2.6 | 101.3 | 98.7 | 97733 | 1.26 (1.02, 1.48) | 0.28 (0.14, 0.40) | 0.13 (0.07, 0.19) |
| Grays Harbor | 3.9 | 90.8 | 86.9 | 75061 | 1.11 (0.90, 1.31) | 0.24 (0.13, 0.36) | 0.12 (0.07, 0.17) |
| Island | 2.2 | 32.4 | 30.2 | 85141 | 0.40 (0.32, 0.47) | 0.09 (0.04, 0.13) | 0.04 (0.02, 0.06) |
| Jefferson | 4.3 | 76.7 | 72.4 | 32221 | 0.94 (0.76, 1.10) | 0.20 (0.11, 0.30) | 0.10 (0.05, 0.14) |
| King | 4.9 | 94.2 | 89.3 | 2252782 | 1.14 (0.93, 1.35) | 0.25 (0.13, 0.37) | 0.12 (0.07, 0.18) |
| Kitsap | 4.2 | 83.8 | 79.6 | 271473 | 1.02 (0.83 1.21) | 0.22 (0.12, 0.33) | 0.11 (0.06, 0.16) |
| Kittitas | 1.9 | 164.9 | 163.1 | 47935 | 2.01 (1.64, 2.36) | 0.44 (0.23, 0.64) | 0.21 (0.12, 0.30) |
| Klickitat | 4.2 | 329.7 | 325.5 | 47935 | 3.72 (3.07, 4.29) | 0.83 (0.45, 1.17) | 0.39 (0.23, 0.54) |
| Lewis | 4.3 | 78.1 | 73.8 | 80707 | 0.95 (0.77, 1.12) | 0.21 (0.11, 0.31) | 0.10 (0.06, 0.15) |
| Mason | 4.0 | 132.0 | 128.0 | 66768 | 1.61 (1.31, 1.89) | 0.35 (0.19, 0.52) | 0.17 (0.10, 0.24) |
| Okanogan | 7.5 | 194.4 | 186.9 | 42243 | 2.28 (1.86, 2.67) | 0.50 (0.27, 0.73) | 0.24 (0.14, 0.34) |
| Pacific | 4.3 | 92.7 | 88.4 | 22471 | 1.13 (0.92, 1.34) | 0.25 (0.13, 0.36) | 0.12 (0.07, 0.17) |
| Pierce | 4.9 | 88.9 | 84.1 | 904980 | 1.08 (0.87, 1.27) | 0.24 (0.12, 0.35) | 0.12 (0.06, 0.17) |
| Skagit | 3.0 | 52.3 | 49.3 | 129205 | 0.64 (0.52, 0.76) | 0.14 (0.07, 0.21) | 0.07 (0.04, 0.10) |
| Snohomish | 3.4 | 72.1 | 68.8 | 822083 | 0.89 (0.72, 1.05) | 0.19 (0.10, 0.29) | 0.10 (0.05, 0.14) |
| Spokane | 5.2 | 122.7 | 117.6 | 522798 | 1.49 (1.20, 1.75) | 0.33 (0.17, 0.48) | 0.16 (0.09, 0.23) |
| Stevens | 2.8 | 88.4 | 85.6 | 45723 | 1.10 (0.89, 1.29) | 0.24 (0.12, 0.35) | 0.12 (0.06, 0.17) |
| Thurston | 3.9 | 84.0 | 80.1 | 290536 | 1.03 (0.83, 1.22) | 0.22 (0.12, 0.33) | 0.11 (0.06, 0.16) |
| Walla Walla | 4.0 | 127.7 | 123.7 | 60760 | 1.56 (1.26, 1.83) | 0.34 (0.18, 0.50) | 0.17 (0.09 0.24) |
| Whatcom | 6.4 | 46.9 | 40.5 | 229247 | 0.53 (0.43, 0.63) | 0.12 (0.06, 0.17) | 0.06 (0.03, 0.08) |
| Whitman | 3.1 | 55.4 | 52.3 | 50104 | 0.68 (0.55, 0.81) | 0.15 (0.08, 0.22) | 0.07 (0.04, 0.11) |
| Yakima | 8.6 | 111.8 | 103.1 | 250873 | 1.31 (1.06, 1.54) | 0.29 (0.15, 0.42) | 0.14 (0.08, 0.20) |
| Other | 4.3 | 103.8 | 99.4 | 102245 | 1.27 (1.03, 1.49) | 0.28 (0.14, 0.41) | 0.14 (0.07, 0.19) |
Table A3.
Summary of PM2.5 concentrations in Washington (excluding monitoring data from Nephelometers) before and during the wildfire episode, 2020.
| PM2.5 concentrations (μg/m3) | Mean | Standard deviation | Median | Range | Minimum | Maximum |
|---|---|---|---|---|---|---|
| before wildfire | 5.5 | 2.7 | 5.4 | 10.1 | 0.4 | 10.5 |
| during wildfire | 118.1 | 38.7 | 114.7 | 124.2 | 70.2 | 194.4 |
| increases | 112.6 | 38.8 | 108.6 | 122.9 | 64 | 186.9 |
Table A4.
Summary of PM2.5 concentrations in Washington (assigning the average PM2.5 concentrations from nearby counties to those without monitoring sites) before and during the wildfire episode, 2020.
| PM2.5 concentrations (μg/m3) | Mean | SD | Median | Range | Minimum | Maximum |
|---|---|---|---|---|---|---|
| Before wildfire | 4.3 | 1.4 | 4.1 | 6.8 | 1.9 | 8.6 |
| During wildfire | 104.6 | 51.6 | 92.7 | 297.3 | 32.4 | 329.7 |
| Increases | 100.3 | 51.3 | 88.4 | 295.3 | 30.2 | 325.5 |
Figure A1.
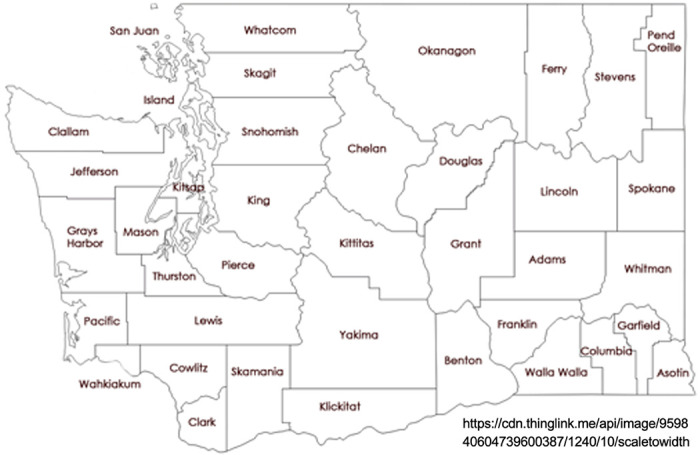
Locations of the 39 counties in Washington State.
Figure A2.
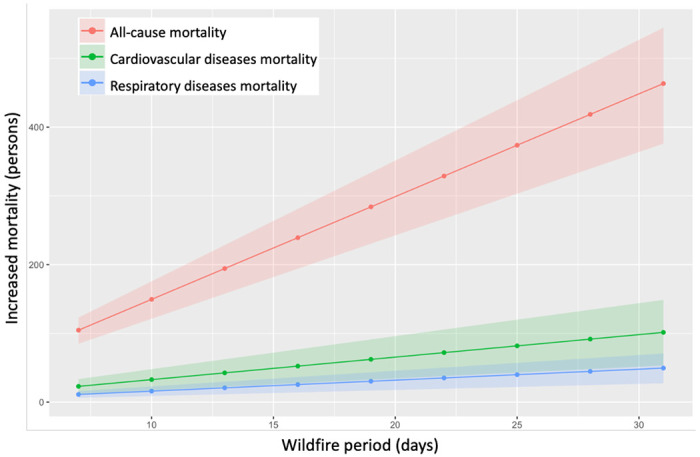
Increased mortality attributable to the wildfire in Washington (excluding monitoring data from Nephelometers).
Figure A3.
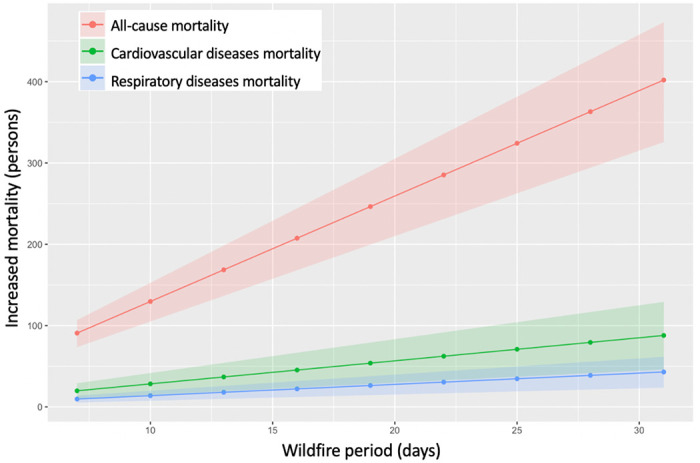
Increased mortality attributable to the wildfire in Washington (assigning the average of PM2.5 concentrations from nearby counties to those without monitoring sites).
Footnotes
Conflict of interests
The authors declare they have no actual or potential competing financial interests.
Reference
- 1.Center N.I.F. Incident Management Situation Report; September 17, 2020, 2020. [Google Scholar]
- 2.Balmes J.R. Where there’s wildfire, there’s smoke. New England Journal of Medicine 2018, 378, 881–883. [DOI] [PubMed] [Google Scholar]
- 3.Achilleos S.; Kioumourtzoglou M.-A.; Wu C.-D.; Schwartz J.D.; Koutrakis P.; Papatheodorou S.I. Acute effects of fine particulate matter constituents on mortality: A systematic review and meta-regression analysis. Environment international 2017, 109, 89–100. [DOI] [PMC free article] [PubMed] [Google Scholar]
- 4.Health, W.S.D.o. Death Data.
- 5.Bureau, U.S.C. County Population Totals: 2010-2019.
- 6.Moorer B. Respiratory cases increase at Washington hospitals due to heavy wildfire smoke. KING5 September 14, 2020, 2020. [Google Scholar]
- 7.Youssouf H.; Liousse C.; Roblou L.; Assamoi E.-M.; Salonen R.O.; Maesano C.; Banerjee S.; Annesi-Maesano I. Non-accidental health impacts of wildfire smoke. International journal of environmental research and public health 2014, 11, 11772–11804. [DOI] [PMC free article] [PubMed] [Google Scholar]
- 8.Liu J.C.; Pereira G.; Uhl S.A.; Bravo M.A.; Bell M.L. A systematic review of the physical health impacts from non-occupational exposure to wildfire smoke. Environmental research 2015, 136, 120–132. [DOI] [PMC free article] [PubMed] [Google Scholar]
- 9.Reid C.E.; Brauer M.; Johnston F.H.; Jerrett M.; Balmes J.R.; Elliott C.T. Critical review of health impacts of wildfire smoke exposure. Environmental health perspectives 2016, 124, 1334–1343. [DOI] [PMC free article] [PubMed] [Google Scholar]
- 10.Doubleday A.; Schulte J.; Sheppard L.; Kadlec M.; Dhammapala R.; Fox J.; Isaksen T.B. Mortality associated with wildfire smoke exposure in Washington state, 2006–2017: a case-crossover study. Environmental health 2020, 19, 1–10. [DOI] [PMC free article] [PubMed] [Google Scholar]
- 11.Wettstein Z.S.; Hoshiko S.; Fahimi J.; Harrison R.J.; Cascio W.E.; Rappold A.G. Cardiovascular and cerebrovascular emergency department visits associated with wildfire smoke exposure in California in 2015. Journal of the American Heart Association 2018, 7, e007492. [DOI] [PMC free article] [PubMed] [Google Scholar]
- 12.Jones C.G.; Rappold A.G.; Vargo J.; Cascio W.E.; Kharrazi M.; McNally B.; Hoshiko S.; Group, w.t.C.S. Out - of - Hospital Cardiac Arrests and Wildfire - Related Particulate Matter During 2015–2017 California Wildfires. Journal of the American Heart Association 2020, 9, e014125. [DOI] [PMC free article] [PubMed] [Google Scholar]
- 13.DeFlorio-Barker S.; Crooks J.; Reyes J.; Rappold A.G. Cardiopulmonary effects of fine particulate matter exposure among older adults, during wildfire and non-wildfire periods, in the United States 2008–2010. Environmental health perspectives 2019, 127, 037006. [DOI] [PMC free article] [PubMed] [Google Scholar]
- 14.Governor W. Proclamations. 2020.
- 15.Washington Smoke Information. In Washington Smoke Information, 2020; Vol. 2020. [Google Scholar]
- 16.Hadley O. Understanding your air quality numbers In Understanding your air quality numbers, Information, W.S., Ed. Washington Smoke blog, 2020; Vol. 2020. [Google Scholar]
- 17.Croft D.P.; Zhang W.; Lin S.; Thurston S.W.; Hopke P.K.; Masiol M.; Squizzato S.; van Wijngaarden E.; Utell M.J.; Rich D.Q. The association between respiratory infection and air pollution in the setting of air quality policy and economic change. Annals of the American Thoracic Society 2019, 16, 321–330. [DOI] [PMC free article] [PubMed] [Google Scholar]
- 18.Dominici F.; Peng R.D.; Bell M.L.; Pham L.; McDermott A.; Zeger S.L.; Samet J.M. Fine particulate air pollution and hospital admission for cardiovascular and respiratory diseases. Jama 2006, 295, 1127–1134. [DOI] [PMC free article] [PubMed] [Google Scholar]
- 19.Horne B.D.; Joy E.A.; Hofmann M.G.; Gesteland P.H.; Cannon J.B.; Lefler J.S.; Blagev D.P.; Korgenski E.K.; Torosyan N.; Hansen G.I. Short-term elevation of fine particulate matter air pollution and acute lower respiratory infection. American journal of respiratory and critical care medicine 2018, 198, 759–766. [DOI] [PubMed] [Google Scholar]
- 20.Landguth E.L.; Holden Z.A.; Graham J.; Stark B.; Mokhtari E.B.; Kaleczyc E.; Anderson S.; Urbanski S.; Jolly M.; Semmens E.O. The delayed effect of wildfire season particulate matter on subsequent influenza season in a mountain west region of the USA. Environment international 2020, 139, 105668. [DOI] [PMC free article] [PubMed] [Google Scholar]