Abstract
Oxidative stress is a central part of innate-immune induced neurodegeneration. However, the transcriptomic landscape of the central nervous system (CNS) innate immune cells contributing to oxidative stress is unknown, and therapies to target their neurotoxic functions are not widely available. Here, we provide the oxidative stress innate immune cell atlas in neuroinflammatory disease, and report the discovery of new druggable pathways. Transcriptional profiling of oxidative stress-producing CNS innate immune cells (Tox-seq) identified a core oxidative stress gene signature coupled to coagulation and glutathione pathway genes shared between a microglia cluster and infiltrating macrophages. Tox-seq followed by a microglia high-throughput screen (HTS) and oxidative stress gene network analysis, identified the glutathione regulating compound acivicin with potent therapeutic effects decreasing oxidative stress and axonal damage in chronic and relapsing multiple sclerosis (MS) models. Thus, oxidative stress transcriptomics identified neurotoxic CNS innate immune populations and may enable the discovery of selective neuroprotective strategies.
Oxidative injury is a pathologic feature linked to neurodegeneration, myelin damage and disease progression in MS and other neurodegenerative diseases1–7. Oxidative stress mediated by reactive oxygen species (ROS) release from CNS innate immune cells promotes neurodegeneration and demyelination1,3,8–10. Innate immune-mediated oxidative injury has been proposed as a critical process underlying the progression of MS from the relapsing phenotype to relentless neurodegeneration11,12. In progressive MS, neurodegeneration is associated with robust microglia activation and oxidative stress12,13. However, the mechanisms in innate immune cells that trigger oxidative injury in neuroinflammation remain poorly understood. Single-cell technology has led to an appreciation of the heterogeneity of CNS innate immune responses with distinct gene profiles between microglia and CNS infiltrating macrophages in MS, Alzheimer’s disease (AD), and related animal models14–21. However, the functional transcriptomic landscape of oxidative stress-inducing innate immune cells is unknown. Furthermore, the discovery of drugs capable of selectively suppressing innate immune-driven neurodegeneration has been hindered by the lack of molecular understanding of the neurotoxic functions of CNS innate immune cells.
Here, we report the innate immune cell atlas of oxidative stress in neuroinflammatory disease and the discovery of new therapeutic targets. To functionally dissect the oxidative stress signature of CNS innate immunity at the single-cell level, we developed Toxic-RNA-seq (Tox-seq) to transcriptionally profile ROS+ innate immune cells. We identified a core oxidative stress signature shared among a microglia cluster and subsets of infiltrating myeloid cells in mice, as well as microglia from MS lesions. Tox-seq followed by microglia HTS of a library of 1,907 clinical drugs and bioactive compounds and oxidative stress gene network analysis identified glutathione transferase activity and the compound acivicin, which inhibits the degradation of the antioxidant glutathione by targeting γ-glutamyl transferase (GGT). Therapeutic administration of acivicin reversed clinical signs, decreased oxidative stress, and protected from neurodegeneration in chronic experimental autoimmune encephalomyelitis (EAE), even when administered eighty days after disease onset. Thus, these studies determine the transcriptomic landscape of oxidative stress in CNS innate immunity and propose druggable pathways for therapeutic targeting of neurotoxic innate immune populations.
Results
Single-cell oxidative stress transcriptome of CNS innate immunity.
To functionally profile the oxidative stress transcriptome of CNS innate immunity and identify neuroprotective drugs, we developed a strategy for single-cell RNA-seq (scRNA-seq) transcriptional profiling of ROS+ CNS innate immune cells termed Tox-seq and performed microglia HTS of a small molecule library, followed by network analysis (Extended Data Fig. 1). To obtain ROS+ innate immune cells, all live cells isolated from spinal cord were stained for intracellular ROS ex vivo using 2′,7′–dichlorofluorescein diacetate (DCFDA) and the innate immune cell fraction was collected by CD11b+ fluorescence-activated cell sorting (FACS). DCFDA is a membrane permeable fluorescent redox indicator probe that detects cellular oxidant stress including ROS, reactive nitrogen species and elevated iron22. For Tox-seq, we analyzed the transcriptomes of 8,701 CD11b+ cells labelled for ROS production via scRNA-seq from the spinal cords of healthy mice or at the onset of disease (clinical score 1) of chronic EAE induced in C57Bl/6 mice by the epitope of amino acids 35-55 of myelin oligodendrocyte glycoprotein (MOG) (‘MOG35-55 EAE’), an autoimmune animal model for MS with paralysis and inflammatory demyelination (Extended Data Fig. 2a–e and Supplementary Table 1). Using unsupervised clustering analysis23 overlaid with the functional ROS characterization, we identified transcriptionally distinct CD11b+ROS+ and CD11b+ROS− populations as visualized by uniform manifold approximation and projection (UMAP) (Fig. 1a and Extended Data Fig. 2e). The majority of clusters with at least 50% ROS+ cells were infiltrating monocyte/macrophage (Mp; clusters Mp6 to Mp11), while microglia (Mg) clusters 3 and 5 were at least 15% ROS+ cells (Fig. 1a–c). ROS+ cells were not identified in the healthy spinal cord clusters (Fig. 1b,c). Functional enrichment gene ontology (GO) analysis of differentially expressed genes (DEGs) from monocyte/macrophage clusters with ROS-producing cells identified “reactive oxygen species metabolic process” as a top biological process term in EAE (Supplementary Table 2). This core oxidative stress signature (e.g., Cybb, Ncf2, Ncf4, and Gpx1) was represented in infiltrating monocyte/macrophage clusters and only in the Mg5 microglia cluster (Fig. 1d). Cluster analysis and differential gene expression further showed that ROS+ cells were transcriptionally heterogeneous (Fig. 1e and Extended Data Fig. 2f,g). Homeostatic microglia markers (e.g., P2ry12, Tmem119, Cx3cr1, Hexb, Olfml3) were expressed in all EAE microglia clusters (Mg3, Mg4, and Mg5) at lower levels than in the healthy microglia clusters (Mg1 and Mg2) (Fig. 1e,f and Supplementary Table 2). Similar to prior studies indicating that tissue dissociation procedures affect immediate early response gene expression21,24, we identified in cluster Mg2 differentially expressed immediate early response genes (Supplementary Table 2), which were not excluded from the analysis. In addition to microglia and monocyte/macrophages, we identified two subsets of dendritic cells as described20. These results suggest functional heterogeneity of CNS innate immune populations in relation to oxidative stress.
Fig. 1. Single cell oxidative stress transcriptome of CNS innate immunity.
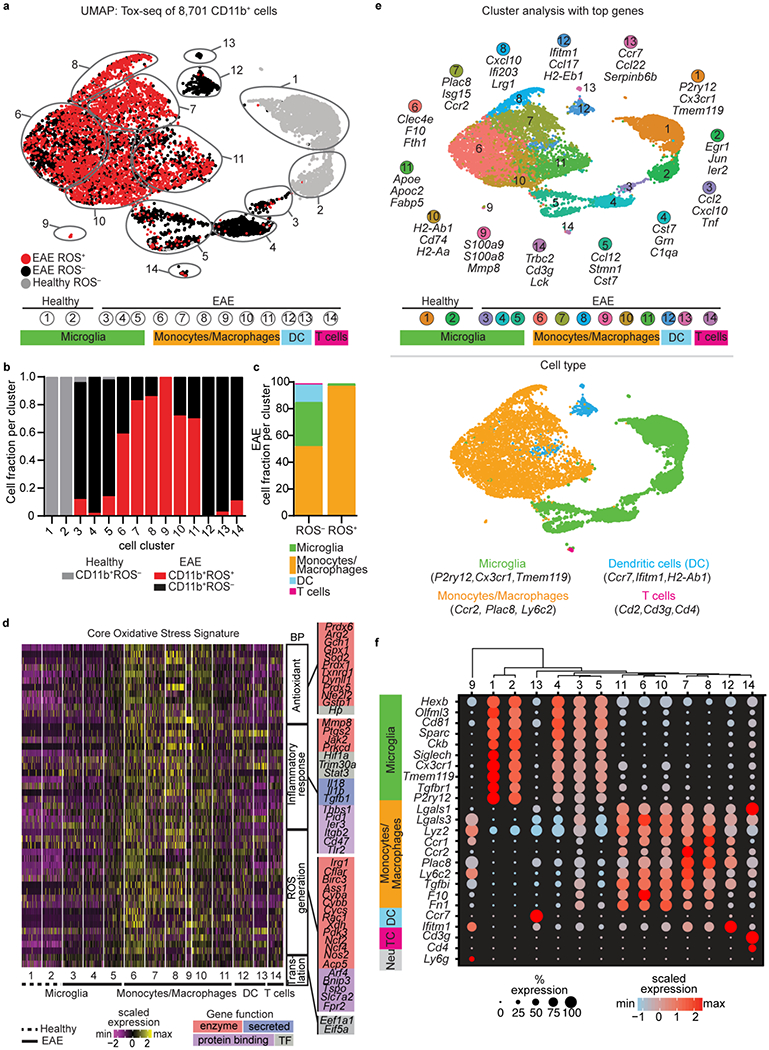
a, UMAP plot of single CD11b+ROS− and CD11b+ROS+ cells identified by unsupervised clustering analysis (n = 8,701 cells from spinal cord of 2 healthy and 2 EAE mice). The gray outlines demarcate individual clusters and color scheme is based on Tox-seq label, which is sample type (healthy or EAE) and ROS expression (CD11b+ROS− and CD11b+ROS+). Clusters are further grouped by cell type identified by gene signatures shown in (e). Cells from EAE mice were collected at onset of disease (clinical score 1.0). b, Fraction of cells in each cluster colored based on Tox-seq label (key). c, Percent of CD11b+ROS− and CD11b+ROS+ cells from EAE mice. d, Single cell expression heat map of genes from GO term “Reactive oxygen species metabolic process” (P = 1.38 x 10⁻¹⁹, accumulative hypergeometric test with Benjamini-Hochberg correction). Genes are grouped by gene function and related biological process (BP) terms. 50 cells were randomly selected from each cluster for visualization (n = 8,701 cells from spinal cord of 2 healthy and 2 EAE mice). e, UMAP plot of 8,701 CD11b+ cells with clusters numerically labeled (top) or pseudocolored based on cell type (bottom). Selected top three DEGs per cluster (top) and representative cell type gene signatures (bottom) are shown. f, Dot plot of gene makers across all CD11b+ clusters. The dendrogram above dot plot depicts unsupervised hierarchical clustering.
CNS innate immune clusters with oxidative stress and antigen presenting signatures.
Single cells were overlaid with gene markers from the core oxidative stress signature and combined with unbiased GO analysis of DEGs from microglia and monocyte/macrophage subclusters (Fig. 2a–d). Subcluster analysis identified five microglia and seven monocyte/macrophage clusters (Fig. 2a). Microglia gene markers, such as Cx3cr1, were highly expressed in all microglia clusters, but not in monocyte/macrophage clusters (Fig. 2b and Supplementary Tables 3,4). Cell types of CNS resident and infiltrating immune cells were further validated according to published gene signatures or single cell mass cytometry (CyTOF)18–20,25–27, including the highly conserved microglia core genes (Extended Data Fig. 3a,b). Clusters MgV and MpI shared “Reactive oxygen species metabolic process” as top GO term, while clusters MgIII and MpIII were enriched for “Antigen Processing and Presentation” (Fig. 2c and Extended Data Fig. 3c and Supplementary Tables 3, 4). To identify differentially expressed ROS and antigen presenting genes in single-cell clusters, we compared the expression of the prooxidant gene Cybb, which encodes the nicotinamide adenine dinucleotide phosphate (NADPH) oxidase subunit 2 (gp91-phox) with antigen presenting gene H2-Ab1, which encodes major histocompatibility complex II (MHC II). We selected NADPH oxidase (Cybb), because it is a key producer of ROS upregulated in microglia in the cortex of progressive MS, and its genetic depletion is protective in EAE and AD mouse models3,6,28. Clusters MgV, MpI and MpII had increased Cybb and H2-Ab1 expression (Fig. 2d; Cybb/H2-Ab1, yellow), while clusters MgIII, MgIV, MpIII and MpIV had only high expression of H2-Ab1 (Fig. 2d; Cybb/H2-Ab1, red). Healthy microglia clusters MgI and MgII did not express Cybb and H2-Ab1 (Fig. 2d; Cybb/H2-Ab1, black). These results were further validated with subcluster overlay of Cd74, which encodes the MHC II invariant chain, and Cyba, which encodes the NADPH oxidase subunit p22-phox. MgV, MpIII, and MpI clusters had high co-expression of NADPH oxidase and antigen presenting genes (Fig. 2d; Cyba/Cybb and Cd74/H2-Ab1, yellow). Cells co-expressing Cyba/Cybb were overlaid with Tox-seq clusters to validate ROS+ innate immune cells (Extended Data Fig. 3d). MgV highly expressed the Cyba/Cybb genes, although less than infiltrating monocytes/macrophages. Microglia activation and homeostatic signatures have been identified in active/chronic MS lesions by single nuclei RNA-seq16. By comparing the EAE Tox-seq dataset in our study with the human MS microglia signatures16, we found that among the microglia populations MgV exclusively expressed the genes detected in microglia from MS lesions that regulate antigen presentation, glutathione, oxidative stress and iron uptake, such as Cd74, Gpx1, and Fth1 (Fig. 2e and Supplementary Table 4). These results suggest differential contribution of CNS innate immune clusters to oxidative stress and antigen presentation.
Fig. 2. Overlay of CNS innate immune cell clusters with oxidative stress core signature genes.
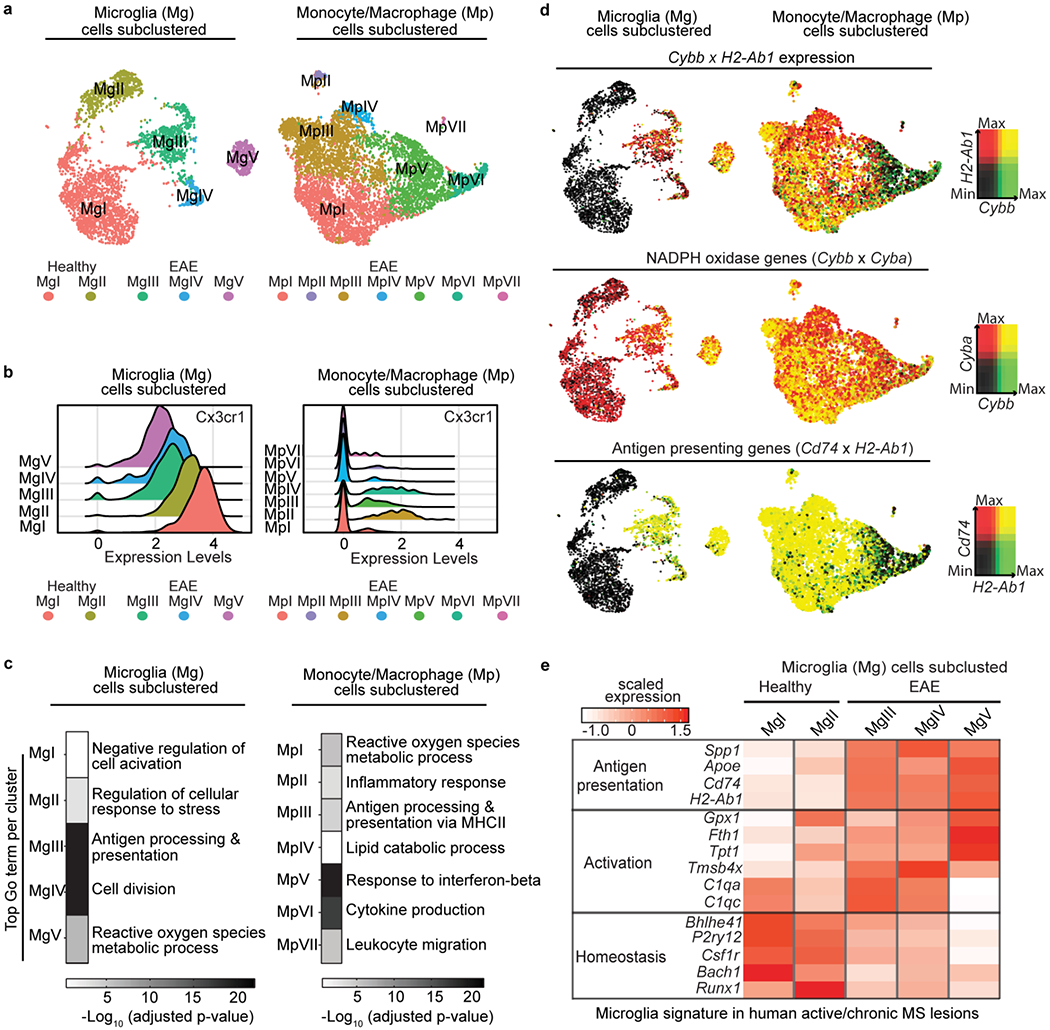
a, UMAP plots of unsupervised subclustering analysis of microglia (n = 3,033 cells from 2 healthy and 2 EAE mice) or monocyte/macrophages (n = 5,240 cells from 2 EAE mice) showing clusters numerically labeled. b, Ridge plot of Cx3cr1 gene expression levels across all microglia and monocyte/macrophage clusters. c, Heat maps of top significant GO terms for each single cell cluster (P < 0.05, accumulative hypergeometric test with Benjamini-Hochberg correction). 5 microglia clusters; n = 3,033 cells from 2 healthy and 2 EAE mice or 7 monocyte/macrophages clusters; n = 5,240 cells from 2 EAE mice. d, UMAP plots of microglia or monocyte/macrophages clusters showing single-cell gene expression overlays for Cybb and H2-Ab1(top), Cybb and Cyba (middle) or Cd74 and H2-Ab1 (bottom). Cells highly co-expressing both gene marker pairs are depicted as double+ cells in yellow (right key). Clusters from healthy and EAE mice are shown (bottom key). e, Heat map depicting comparison of Tox-seq microglia subclusters in EAE with signatures of microglia from human active/chronic MS lesions16. Average gene expression is depicted as scaled z-score expression (key).
Co-expression of oxidative stress, coagulation, and glutathione pathway genes.
Tox-seq identified the MgV microglia cluster as a ROS+ CNS innate immune population enriched with oxidative stress genes. The transcriptomic signature of MgV showed the highest expression for oxidative stress, coagulation, inflammatory, antigen presenting, and pattern recognition receptor markers and the lowest expression of homeostatic markers (Fig. 3). MgV exclusively expressed pattern recognition receptor C-type lectin domain family 4 member E (Clec4e) and F10, which encodes coagulation factor X (Fig. 3a,b). In addition to higher expression of prooxidant and antigen presenting genes Cybb and H2-Ab1, MgV was enriched in pro-inflammatory gene expression, including Il1b (Fig. 3c–e). The homeostatic microglia markers P2ry12, Sparc, Cx3cr1, and Tmem119 were expressed in the MgV cluster, but at lower levels than in healthy microglia clusters MI and MgII (Fig. 3f and Extended Data Fig. 3a,e and Supplementary Table 4). Genes specific to the MgV cluster were validated in situ by immunostaining for their encoded proteins NADPH oxidase subunit 2 (gp91-phox), MHC II, Coagulation Factor X, and CLEC4E in EAE spinal cords (Fig. 3g–i and Extended Data Fig. 3f). We independently validated the transcriptomes of ROS-producing and antigen presenting cells (APCs) with bulk RNA-seq of FACS-purified ROS+ and MHC II+ microglia and monocyte/macrophages from EAE spinal cord (Extended Data Fig. 4a–e and Supplementary Table 5). Gene clustering of DEGs identified distinct upregulated genes in subsets of microglia and monocyte/macrophages that were primarily ROS-producing (Extended Data Fig 4f,g). Hierarchical clustering of GO analysis revealed “Scavenger Receptor Activity” and “Glutathione Transferase Activity” upregulated in both ROS+ microglia and monocyte/macrophages (Fig. 4a and Supplementary Table 6). The ROS+ microglia profile included three co-expression networks for high significance GO terms, namely “blood coagulation” (e.g. F9, Itgb3, Serpinc1, Gp9, Gp1ba; P = 0.011), “phosphorylation” (e.g. Eif2ak3, Stk30, Pfkfb1, Map3k12, Brsk2) (P = 0.015), and “lipid biosynthesis” (e.g. Ggt5, Fads2, Hsd17b1, Srd5a1; P = 0.028) (Fig. 4b). These data show that coagulation genes are co-expressed with oxidative stress genes and are in accordance with the role of perivascular microglia as primary sites for increased coagulation activity, fibrin deposition, and ROS release in EAE lesions29,30.
Fig. 3. The oxidative stress core signature in EAE.
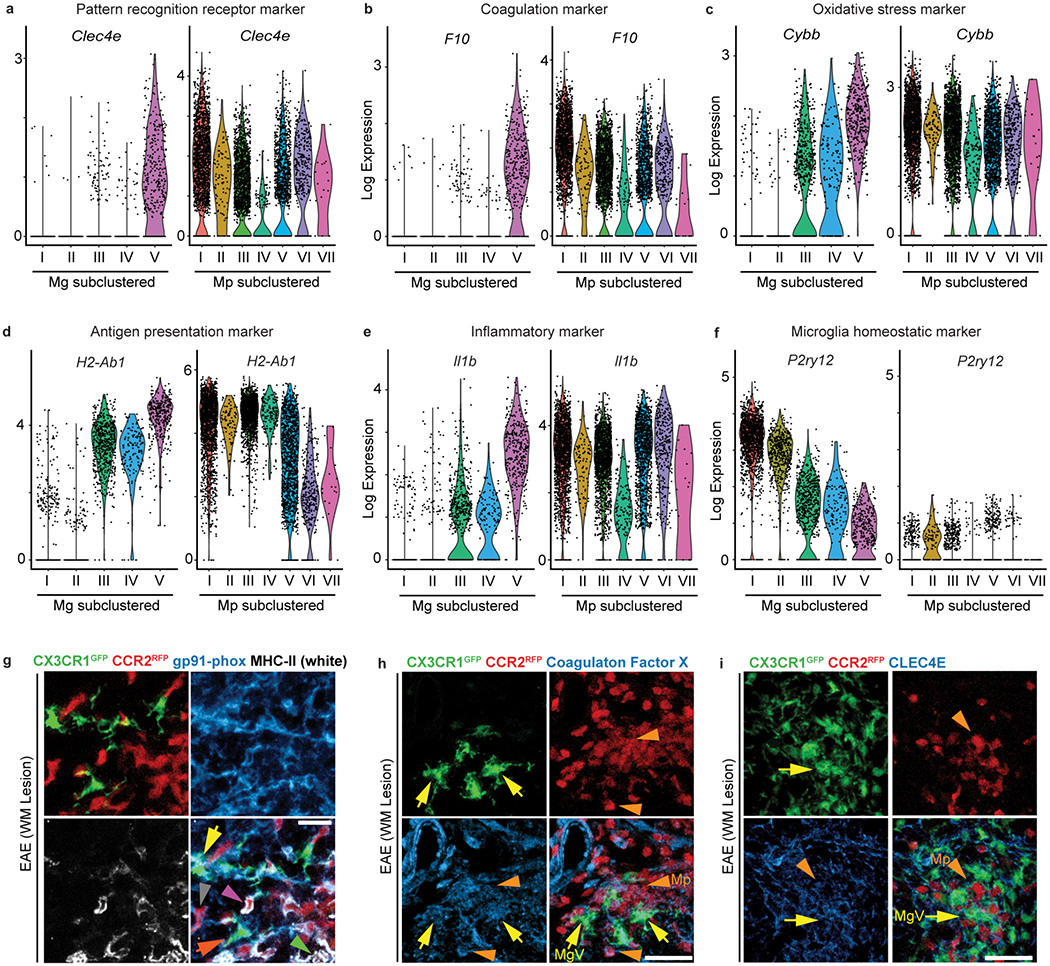
a-f, Violin plots of log expression levels of Clec4e (a), F10 (encodes coagulation factor X) (b), Cybb (encodes the NADPH oxidase subunit gp91-phox) (c), H2-Ab1 (encodes MHC II) (d), Il1b (e) and P2ry12 (f) across microglia and monocyte/macrophages subclustered single-cell populations. (a-f) Violin plots depict minima and maxima expression with points showing single cell expression levels. 5 microglia clusters; n = 3,033 cells from 2 healthy and 2 EAE mice or monocyte/macrophages clusters; n = 5,240 cells from 2 EAE mice. g, Confocal microscopy of a white matter (WM) lesion from Cx3cr1GFP/+Ccr2RFP/+ mice with MOG35-55-induced EAE, showing CX3CR1+ cells (green), CCR2+ cells (red), and immunoreactivity for the oxidative stress marker NADPH oxidase subunit gp91-phox (blue) and the antigen presentation marker MHC II (white). Data are representative of n = 4 mice; tissues were collected at onset of EAE (clinical score 1.0). Yellow arrows, gp91-phox+MHC II+ microglia; orange arrows, gp91-phox+MHC II− microglia; pink arrowhead, gp91-phox+MHC II+ monocyte/macrophages; green arrowhead, gp91-phox−MHC II+ monocyte/macrophages; grey arrowhead, gp91-phox+MHC II− monocyte/macrophages. h, i, Confocal microscopy from spinal cords of mice as in g, showing CX3CR1+ cells (green), CCR2+ cells (red), and immunoreactivity for coagulation factor X (blue) (h), or CLEC4E (blue) (i). Data are representative of n = 4 mice; tissues were collected at onset of EAE (clinical score 1.0). Arrows and arrowheads denote microglia and monocyte/macrophages, respectively. Scale bar, 50 μm (g-h).
Fig. 4. Bulk Tox-seq and co-expression gene network analysis of ROS+ microglia in EAE.
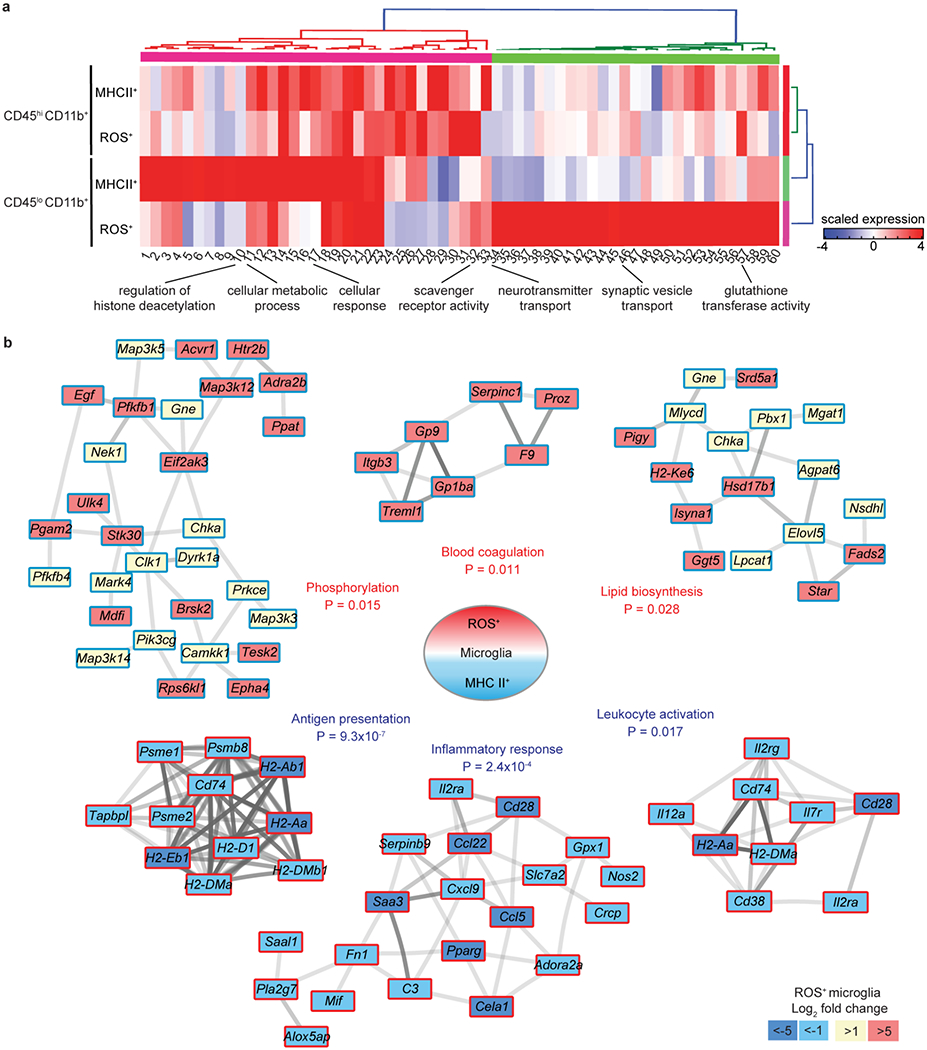
a, Heat map of GO analysis from bulk RNA-seq of ROS+ and MHC II+ microglia and infiltrating monocyte/macrophages compared to respective baseline (ROS−,MHC II−) cells from EAE mice. Key indicates scaled z-score expression. Data are from n = 3 biologically independent samples per group. b, Co-expression gene networks from bulk RNA-seq of ROS+ microglia. Darker interaction lines represent greater evidence for co-expression. Key indicates log2 fold change expression and is relative to MHC II+ microglia; red border indicates significance cutoff of P <0.05 (accumulative hypergeometric test with Benjamini-Hochberg correction). Data are from n = 3 biologically independent samples.
Selection of acivicin by microglia HTS and oxidative stress gene network analysis.
Tox-seq identified the coagulation pathway as mechanistically coupled to oxidative stress. Fibrin, the end product of the coagulation cascade, is deposited in brains from MS and AD and has prooxidant functions in related animal models9,10,31. We developed a fibrin-induced HTS workflow in innate immune cells to discover new small molecule inhibitors to suppress oxidative stress. The HTS workflow consisted of a primary automated microglia HTS of 1,907 compounds that was followed by secondary assays for compound characterization. We first developed a high-content HTS of primary microglia stimulated by fibrin or the bacterial innate immune activator lipopolysaccharide (LPS) (Fig. 5a). We screened 1,907 clinical drugs and bioactive compounds using increased cell size (≥ 800 μm2) as a marker of activation and decreased size (< 150 μm2) as a marker of toxicity. We identified 128 compounds that inhibited microglial activation by ≥50% without toxicity (≤3% cell death) (Fig. 5b and Supplementary Table 7). Using the Kyoto Encyclopedia of Genes and Genomes (KEGG) database, we annotated the molecular targets of 31 compounds with potential clinical relevance for neurological diseases (Supplementary Table 8). KEGG analysis identified the glutathione degrading enzyme GGT as the primary target of the HTS hit compound acivicin (Fig. 5b and Supplementary Tables 7, 8). GGT degrades the antioxidant glutathione and its dysregulation interferes with redox homeostasis and oxidative stress responses32. Intriguingly, Tox-seq had identified genes regulating glutathione metabolism in ROS+ CNS innate immune cells. To examine if acivicin-targeted glutathione and redox pathways were differentially regulated in oxidative stress-producing CNS innate immune cells, we generated a comprehensive oxidative stress gene network and overlaid it with the Tox-seq dataset. Using PathVisio and Cytoscape33,34, we constructed an oxidative stress gene network including the GGT pathway; glutathione metabolism, biosynthesis, uptake and breakdown; the NADPH oxidase complex; the redox cycle and glutathionylation. We computationally overlaid the oxidative stress gene network with genes differentially expressed in ROS+ versus MHC II+ subpopulations of microglia and infiltrating monocytes identified by bulk Tox-seq (Fig. 5c). To represent both microglia and infiltrating monocyte gene changes on the same gene network, we created a split-box view with expression levels in microglia and infiltrating monocytes on the left and right sides, respectively (Fig. 5c). This overlay revealed 25 genes that were specifically upregulated in ROS+ microglia or monocyte/macrophages throughout the oxidative stress network, including the acivicin target genes Ggt1 and Ggt5, glutathione transferases Gsto2 and Gstt2, and gamma-glutathione peroxidase Gpx7 (Fig. 5c). All 25 genes (Ggt1, Ggt5, Ggt7, Abcc2, Slco2a1, Foxp3, Alox5, Gsr, Gsto1, Gsto2, Gstt2, Gstt3, Mgst2, Gstm1, Gstp2, Gstk1, Gpx7, Slc6a9, Oplah, Cbs, Prdx2, S100a8, S100Aa9, Sod3, Txnrd3) meet the criteria of having log2 > 1 for either microglia and/or monocytes/macrophages and no downregulation for either subpopulation. Expression of Cyba and Cybb as identified by bulk RNA-seq was lower than Tox-seq single cell analysis potentially due to the low representation of the Cybb/Cyba enriched cluster. Based on these findings, we tested the effects of acivicin on innate immune cells and animal models of neuroinflammation.
Fig. 5. Microglia HTS and oxidative stress gene network with Tox-seq data overlay.
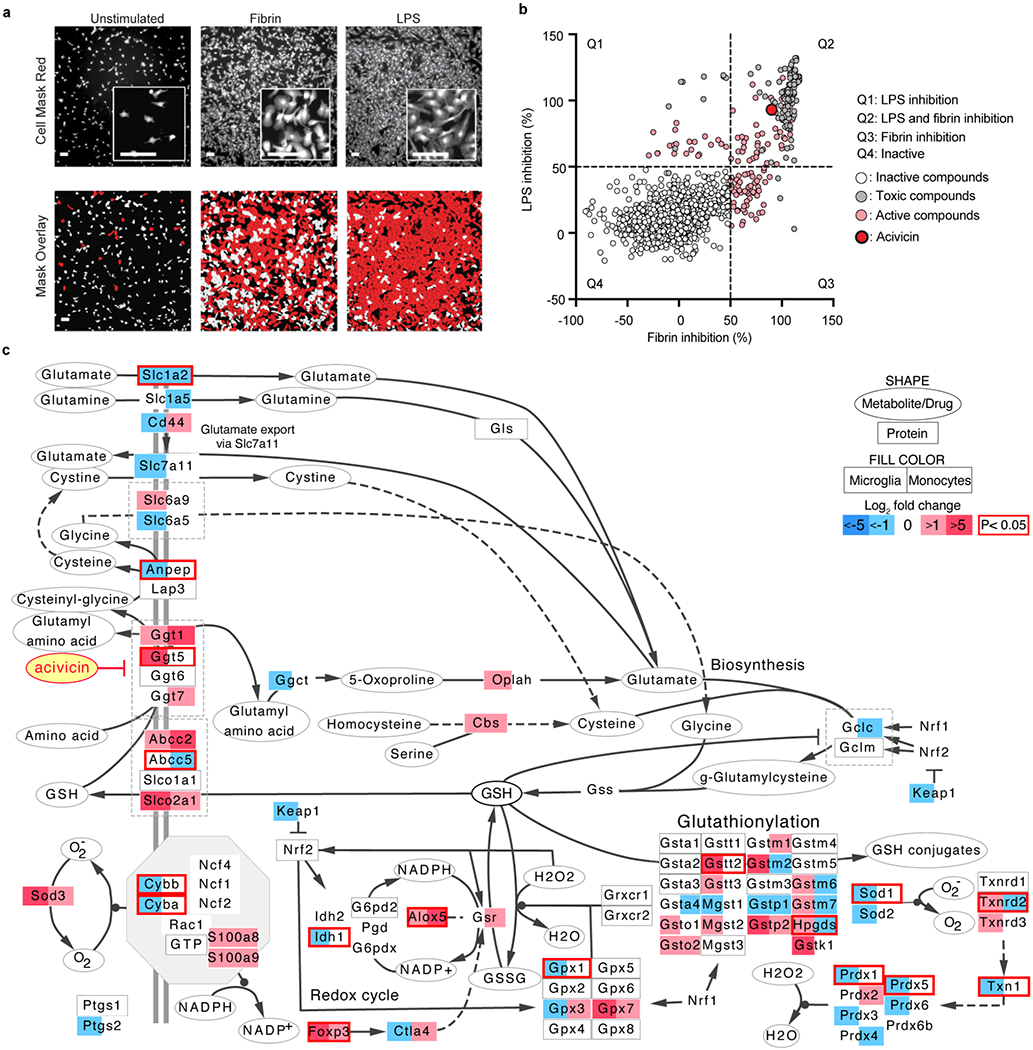
a, Microscopy of image-based assay to detect activated primary microglia. Insets, higher magnification. Data are representative of 50 independent experiments. Scale bars, 100 μm. b, A scatter plot of HTS screening. Normalized percent inhibition of coated fibrin and LPS stimuli by 1907 clinical drugs and bioactive molecules. Molecules that caused cell death or less than 50% inhibition were classified as toxic (gray circles) or inactive (white circles), respectively. Hits were defined as molecules that exhibited greater than 50% inhibition of either fibrin or LPS activation (light red circles). Acivicin [(2S)-2-amino-2-[(5S)-3-chloro-4,5-dihydro-1,2-oxazol-5-yl] acetic acid] is indicated in (bright red circle highlighted). Scatter-plot quadrants (key) (Q1; position of molecules with LPS inhibition, Q2; position of molecules with LPS and fibrin inhibition, Q3; position of molecules with fibrin inhibition, Q4; position of inactive molecules). c, Oxidative stress gene network visualizes the cellular transport, biosynthesis, redox cycle, glutathionylation and extracellular recycling of glutathione (GSH). Drugs are represented as ovals, gene and protein targets as rectangles, cell plasma membrane as grey double line (key); split-box view represents cell specific gene expression changes in microglia (left) or monocytes (right); blue shading, genes downregulated in MHC II+ cells (fold changes log2 < −1); Red shading, genes upregulated in ROS+ cells (fold changes log2 > 1); the red border indicates significance of P < 0.05 (two-tailed moderated t-test). Data are from n = 3 biologically independent samples.
Acivicin suppresses oxidative stress in innate immune cells.
Although acivicin has been studied primarily in cancer cells35, its functions in inflammation and neurological diseases are poorly understood. We tested the effects of acivicin in innate immune cell activation using a series of secondary assays, such as ROS generation, glutathione regulation, gene expression of prooxidant and inflammatory genes, GGT activity, and antigen presentation. Acivicin inhibited fibrin- and LPS-induced microglial activation in a dose-dependent manner (Fig. 6a). Acivicin did not affect microglia or macrophage cell viability in vitro as assessed by cell number quantification and FACS analysis (Extended Data Fig. 5a–c). Total cell blood count of white blood cells, red blood cells, and platelets were similar after 10 days of treatment with acivicin compared to saline control (Extended Data Fig. 5d). Microglia numbers in the spinal cord were similar in mice treated with acivicin for 14 days compared to saline (Extended Data Fig. 5e). These results are in accordance with prior studies showing that acivicin at a similar concentration range does not affect neuronal viability36.
Fig. 6. GGT inhibition in innate immune cells.
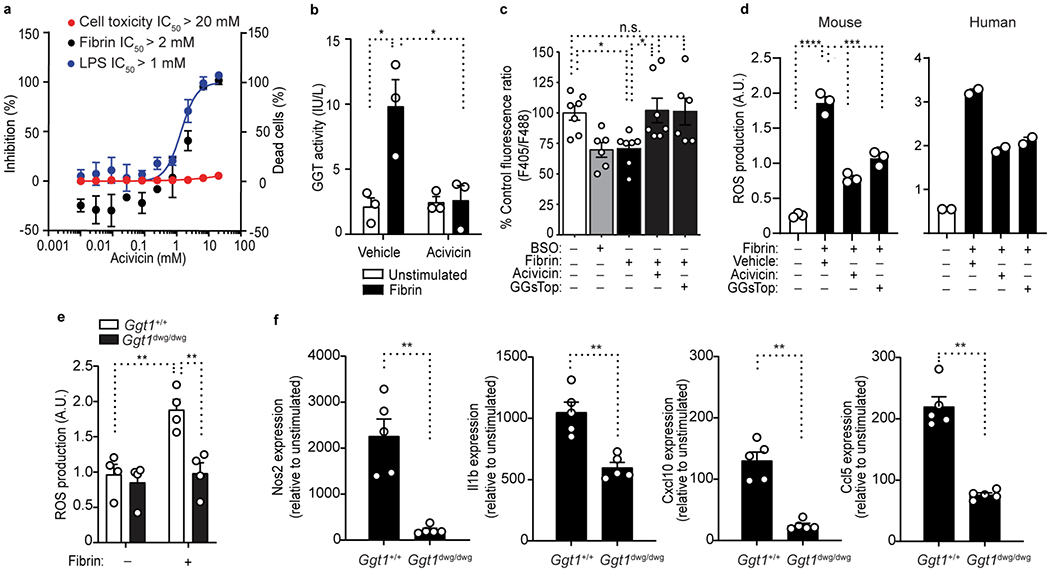
a, Normalized dose response of acivicin on fibrin-induced (black circles) or LPS-induced (blue circles) microglia activation without cell toxicity < 20 μM (red circles) (key). Data are from one experiment performed in triplicates. b, GGT activity in BMDMs left unstimulated or stimulated with fibrin after acivicin or vehicle control treatment (key). Data are from n = 3 independent experiments performed in duplicate. c, Quantification of glutathione (GSH) RealThiol probe (F405/F488 ratio) by real time confocal imaging of live BMDMs. The fluorescence ratio F405/F488 of RealThiol probe reflects the ratio of RealThiol probe bound to intracellular GSH over unbound intracellular probe and is proportional to the GSH concentration. F405/F488 was expressed as percentage of that of the untreated cells (control). Data are from n = 7 independent experiments. d, Quantification of ROS production (assessed via DHE) in mouse BMDMs (left) and human macrophages (right) unstimulated or stimulated for 24 h with fibrin in the presence of acivicin or GGsTop (grid plot). Data are from n = 3 independent experiments performed in quadruplicate (mouse) and sextuplicate (human). A.U., arbitrary units. e, Quantification of ROS production (assessed via DHE) in BMDMs isolated from Ggt1+/+ or Ggt1dwg/dwg mice (key) left unstimulated or stimulated for 24h with fibrin. Data are from n = 4 mice per group performed in quintuplicate A.U., arbitrary units. f, qRT-PCR analysis of Nos2, Cxcl10, Ccl5 and Il1b expression in BMDMs isolated from Ggt1+/+ and Ggt1dwg/dwg mice (key) stimulated with fibrin. Data are from n = 5 mice per group. Each circle symbol represents an individual experiment (a-d) or mouse (e, f). Data are shown as mean ± s.d. (a) or means ± s.e.m. (b-f). * P < 0.05, **P < 0.01, *** P < 0.001, **** P < 0.0001 ; n.s., not significant, as determined by two-way analysis of variance (ANOVA) with Sidak’s multiple comparisons test (b, e), two-tailed paired t-test (c), one-way ANOVA with Tukey’s multiple comparisons test (d), or two-tailed Mann-Whitney test (f).
GGT degrades the antioxidant glutathione, resulting in increased oxidative stress32. Since GGT activation is a key mechanism regulating redox homeostasis, we tested the effects of fibrin in GGT activation and glutathione metabolism. By GGT activity assay and quantitative real-time cell imaging of intracellular glutathione37, we showed that fibrin increased GGT activity and induced degradation of glutathione (Fig. 6b, c and Extended Data Fig. 6a,b). Acivicin and GGsTop restored glutathione levels in fibrin-treated macrophages and decreased ROS production (Fig. 6b,d). Ggt1dwg/dwg mice with a nucleotide deletion in Ggt1 gene have reduced GGT activity and altered glutathione levels38. ROS generation and expression of oxidative injury and pro-inflammatory genes were reduced in fibrin- or LPS-stimulated macrophages isolated from Ggt1dwg/dwg mice compared to Ggt1+/+ controls (Fig. 6e,f and Extended Data Fig. 6c). Collectively, these findings suggest that fibrin disrupts redox homeostasis and inhibition of GGT suppresses oxidative and inflammatory functions in innate immune cells.
Therapeutic effects of acivicin in neuroinflammation.
In patients with MS and neuromyelitis optica, serum GGT concentrations correlate with clinical disability, blood-brain barrier (BBB) disruption, and inflammatory markers39. GGTLC1, which encodes the GGT light chain 1, is detected in the cortex of MS patients and is associated with oxidative damage and neuronal injury40. Serum GGT activity positively correlates with dementia risk and glutathione S-transferase alpha in the plasma of AD patients correlates with late-onset AD progression41,42. We tested the effects of acivicin treatment in mouse models of autoimmune acute and chronic progressive neuroinflammation, as well as in models of microglia-mediated neurodegeneration. We selected four models of EAE simulating key aspects of MS, namely relapsing-remitting EAE induced by epitope of amino acids of proteolipid protein (PLP) in SJL/J mice (‘PLP139-151 EAE’); adoptive transfer of CD4+ T cells differentiated under conditions that polarize cells into TH1 subset of helper T cell cells; MOG35-55 EAE; and progressive EAE induced in non-obese diabetic (NOD) mice by the epitope of amino acids 35-55 of MOG (‘NOD-MOG35-55 EAE’).
Using immunohistochemistry and FACS, we first tested the expression of GGT in EAE spinal cord. GGT was not detected in healthy spinal cord, but increased in microglia and infiltrating monocyte/macrophages in EAE lesions (Fig. 7a,b). Administration of acivicin suppressed the clinical severity during relapses in PLP139-151 EAE (Fig. 7c). Given prophylactically, acivicin delayed disease onset and severity in adoptive transfer EAE induced by PLP139-151-specific T cells and in active MOG35-55 EAE and decreased GGT activity in the EAE spinal cord (Fig. 7d,e and Extended Data Fig. 7a). Similarly, prophylactic administration of GGsTop reduced neurologic signs in MOG35-55 EAE (Extended Data Fig. 7b). In MOG35-55 EAE mice, acivicin selectively decreased interferon-γ (IFN-γ)- and interleukin 17 (IL-17)- producing T cells and suppressed encephalitogenic T cell proliferation only in the presence of APCs (Extended Data Fig. 7c–h), suggesting that in autoimmune models acivicin may indirectly affect T cell responses by suppressing APC function. Acivicin markedly reduced oxidative stress markers 4-hydroxynonenal (4-HNE) and serum protein carbonyl content, proinflammatory gene expression, demyelination, neuronal damage, microglia activation and monocyte/macrophage infiltration in spinal cord lesions in MOG35-55 EAE mice (Fig. 7f–i and Extended Data Fig. 7i).
Fig. 7. Effects of acivicin in EAE.
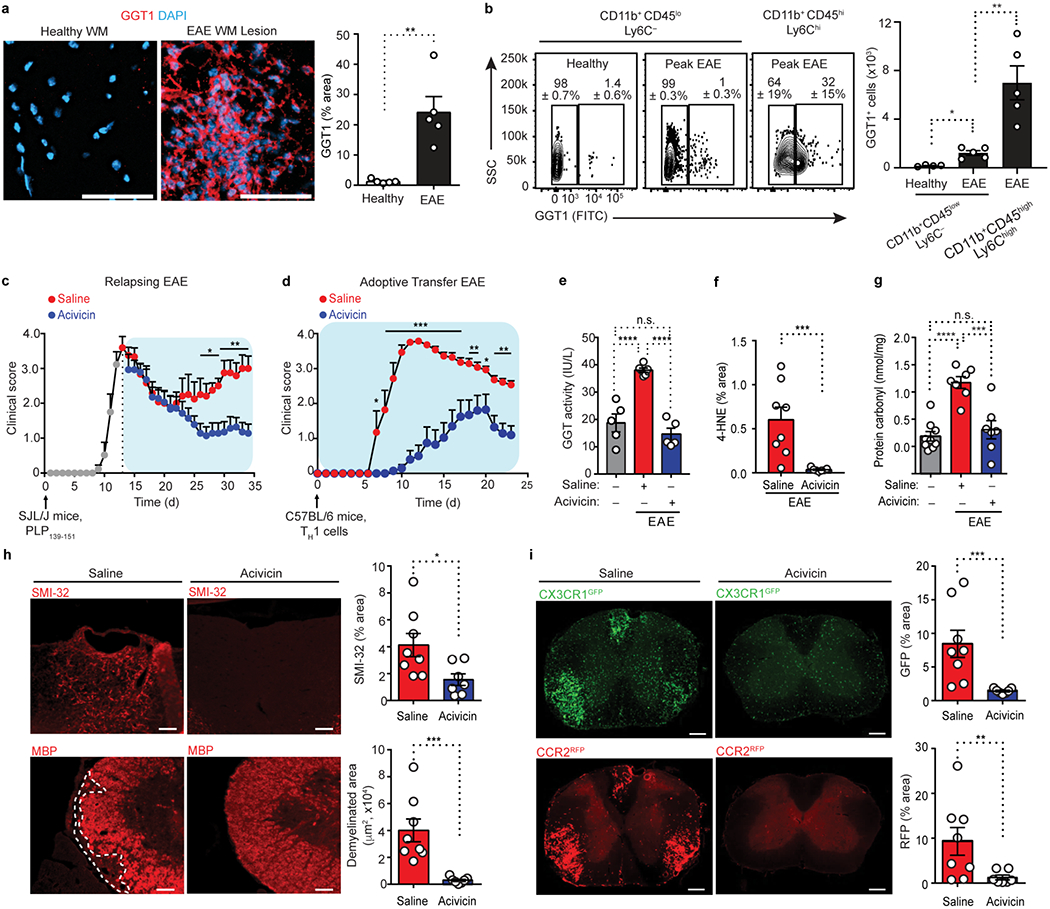
a, Confocal microscopy of spinal cord sections from unimmunized healthy mice and MOG35-55-induced EAE mice at peak disease, immunostained for GGT1 (red). Nuclei are stained with 4′,6-diamidino-2- phenylindole (DAPI, blue). WM, white matter; Scale bars, 100 μm. Image quantification of GGT1 immunoreactivity is shown. Data are representative of n = 5 mice per group. b, Representative flow cytometry contour plots (left) showing GGT1 expression in CD11b+CD45loLy6C− (microglia) and CD11b+CD45hiLy6Chi (infiltrating monocyte/macrophages) cells from spinal cord of mice with MOG35-55-induced EAE or unimmunized healthy controls. GGT1 expression is depicted as percent of gated population ± s.d. Quantification (bottom) of GGT1+ microglia and monocyte/macrophages is shown. Cells were analyzed at peak of EAE (clinical score 3.0). Data are from n = 4 mice (healthy) and n = 5 mice (EAE). c, Clinical scores for relapsing EAE of SJL/J mice immunized (upward arrow) with PLP139-151, followed by therapeutic injection of acivicin or saline (key) every day starting at the peak of the initial paralytic episode (dotted vertical line). Data are from n = 7 mice (EAE + acivicin) and n = 6 mice (EAE + saline). d, Clinical scores of adoptive transfer EAE induced by TH1 cells (upward arrow) after daily prophylactic administration of acivicin or saline (key) starting day 0. Data are from n = 10 mice (EAE + acivicin) and n = 7 mice (EAE + saline) e, GGT activity in spinal cords from healthy or MOG35-55- EAE mice treated with acivicin or saline (grid plot). Data are from n = 5 mice (control), n = 6 mice (EAE + saline), and n = 5 mice (EAE + acivicin), each performed in technical duplicates. f, Quantification of 4-HNE immunostaining in spinal cords from mice with peak MOG35-55- EAE disease after prophylactic injection with acivicin or saline. Data are from n = 8 mice (saline) and n = 7 mice (acivicin). g, Quantification of serum protein carbonyl levels in MOG35-55 EAE mice after prophylactic injection with acivicin or saline. Data are from n = 9 mice (Healthy, control), n = 7 mice (EAE + saline), and n = 7 mice (EAE + acivicin). h, Microscopy (left) of spinal cord sections from mice with MOG35-55-induced EAE treated with acivicin or saline, showing SMI-32 immunoreactivity (top; indicative of axonal damage) and myelin basic protein (MBP) immunoreactivity (bottom; indicative of myelin); dashed lines demarcate demyelinated white matter of the spinal cord column. Scale bars, 25 μm (top), 80 μm (bottom). Image quantification of SMI-32 and MBP immunoreactivity is shown (right). Data are from n = 8 mice (EAE + saline) and n = 7 mice (EAE + acivicin). i, Microscopy (left) of spinal cord sections from Cx3cr1GFP/+Ccr2RFP/+ mice with peak MOG35-55- EAE treated with acivicin or saline, showing CX3CR1+ (GFP, green) and CCR2+ (RFP, red) cells. Image quantification (right) of CX3CR1+ (top) and CCR2+ cells (bottom) is shown. Scale bars, 100 μm. Data are from n = 8 mice (EAE + saline) and n = 7 mice (EAE + acivicin). Each circle symbol (a, b, e-i) represents an individual mouse. Data are shown as means ± s.e.m. (a-i). * P < 0.05, **P < 0.01, *** P < 0.001, **** P < 0.0001 ; n.s., not significant, as determined by two-tailed Mann-Whitney test (a), one-way ANOVA with Tukey’s multiple comparisons test (b, e, g), two-tailed permutation test (c, d), two-tailed Mann-Whitney test (f, h, i), or one-way ANOVA with Bonferroni multiple comparisons test (b, e, g).
Immunization of NOD mice with MOG35–55 results in an acute neurological impairment followed by a chronic phase of progressive accumulation of disability43. In chronic NOD MOG35-55 EAE, therapeutic administration of acivicin during the chronic phase even eighty days after EAE induction suppressed progression as indicated by decreased clinical signs (Fig. 8a,b). Acivicin reduced demyelination, axonal damage, expression of GGT1, as well as the oxidative stress markers inducible nitric oxide synthase (iNOS) and NADPH oxidase subunit gp91-phox during the chronic phase of disease (Fig. 8c,d and Extended Data Fig. 7j). In addition to autoimmune models, we also tested acivicin in a microglial-driven model of neurodegeneration induced by LPS injection in the substantia nigra (SN)44. Acivicin blocked GGT activity in SN after LPS injection and decreased microglial activation and improved dopaminergic neuronal survival (Extended Data Fig. 8). These results suggest that acivicin exerts potent anti-inflammatory and neuroprotective effects in neuroinflammatory disease.
Fig. 8. Acivicin suppresses demyelination, axonal damage and oxidative stress in chronic EAE.
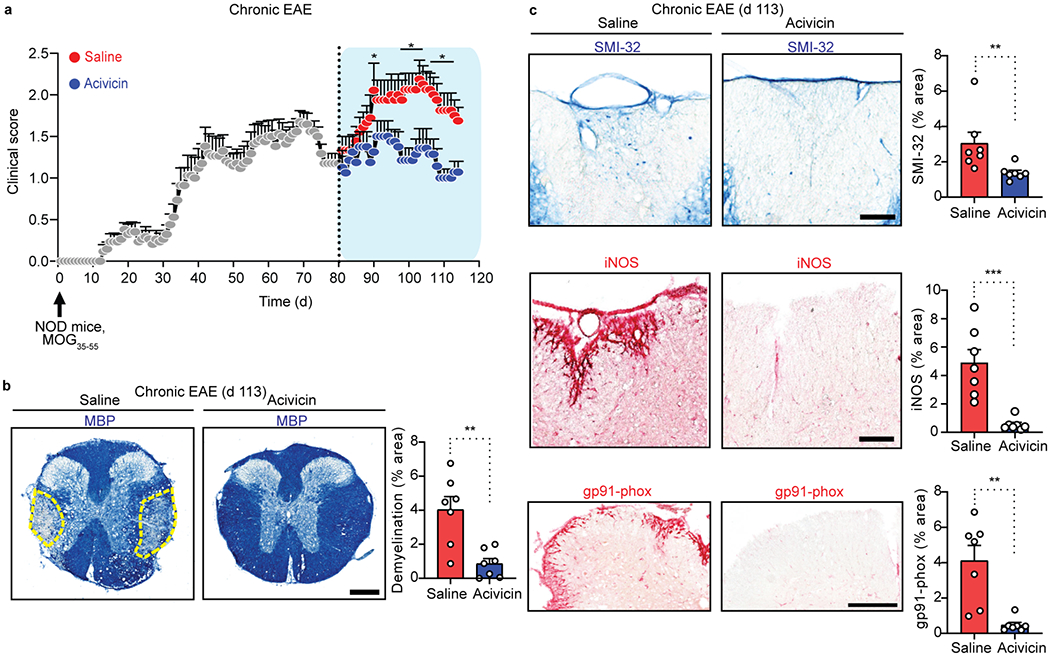
a, Clinical scores for chronic EAE of NOD mice immunized (upward arrow) with MOG35-55, followed by therapeutic injection of acivicin or saline (key) every day starting at day 80 of the chronic phase (dotted vertical line). Data are from n = 8 mice (EAE + acivicin) and n = 9 mice (EAE + saline). b, Microscopy (left) of spinal cord sections from mice with chronic MOG35-55 EAE treated with acivicin or saline every day starting at day 80 until day 113 labeled for MBP; right, quantification of area devoid of MBP immunoreactivity. Dashed lines (left) demarcate demyelinated white matter of the spinal cord column. Scale bar, 300 μm. Data are from n = 7 mice per group. c, Microscopy (left) of spinal cord sections from mice with chronic MOG35-55 EAE treated with acivicin or saline every day starting at day 80 until day 113 labeled for SMI-32 immunoreactivity (top), iNOS (middle), or NADPH oxidase subunit gp91-phox (bottom); right, quantification of area with SMI-32 immunoreactivity, area with iNOS immunoreactivity, or area with gp91-phox immunoreactivity in white matter. Scale bar, 100 μm. Data are from n = 7 mice per group. Each circle symbol represents an individual mouse (b, c). Data are shown as means ± s.e.m. (a-c). * P < 0.05, **P < 0.01, *** P < 0.001, as determined by two-tailed permutation test (a) or two-tailed Mann-Whitney test (b, c).
Discussion
Our study revealed the oxidative stress transcriptome of CNS innate immune cells in neuroinflammation and identified druggable pathways to suppress neurotoxic innate immunity. By developing a functional transcriptomic and drug discovery pipeline consisting of deep-sequencing, small molecule screening, and pathway analysis, we identified novel innate immune cell populations involved in oxidative stress and discovered upstream targeting of glutathione metabolism and redox homeostasis as a therapeutic strategy in neuroinflammation. Using Tox-seq, we discovered that innate immune cells share a core oxidative stress gene signature mechanistically coupled to coagulation, antigen presentation, and glutathione pathways. Our findings introduce the concept of distinct molecular circuits governing oxidative stress and immune-mediated neurodegeneration and reveal their molecular signatures. Given that oxidative-stress producing resident and infiltrating innate immune cells are key players in MS progression3,12,45, the oxidative stress signature could enable the identification of specific cell subpopulations contributing to neurotoxicity that could be further characterized with cell-fate mapping studies. Molecular convergence of innate immune cells to an oxidative stress core signature could be the springboard for the development of therapies to selectively target CNS innate immune populations that promote oxidative cell injury. Given the broad range of diseases with oxidative stress, our findings could have implications for a wide range of diseases including MS, AD, and traumatic brain injury.
Our study revealed previously unknown molecular links between coagulation and oxidative stress. In neuroinflammatory lesions, we identified in situ expression of coagulation genes promoting fibrin formation, such as genes encoding coagulation factors IX and X, vitamin K dependent plasma glycoprotein, and the von Willebrand factor receptors glycoproteins IX and Ib. Intriguingly, coagulation gene expression was differentially increased in ROS+ CNS innate immune cells that co-expressed genes regulating oxidative stress, such as the NADPH oxidase subunit gp91-phox and GGT, and iron metabolism. Dysregulation of the coagulation pathway and fibrin deposition correlates with cortical damage, microglia activation, and neuronal loss in MS and EAE29,30,46–48. Administration of anti-coagulants or inhibition of the interaction of fibrin with the CD11b-CD18 integrin receptor (also known as Mac-1, complement receptor 3, αMβ2) reduces clinical signs, oxidative stress, and neurodegeneration in MS animal models9,10,31. Fibrin signaling via the CD11b-CD18 receptor may potentiate the cross-talk of NADPH oxidase with the GGT pathway49 leading to redox regulation. Indeed, fibrin activates NADPH oxidase9 and GGT (this study) to promote degradation of glutathione and oxidative stress in innate immune cells. Furthermore, inhibition of fibrin interaction with CD11b-CD18 or inhibition of NADPH oxidase9,10, or GGT (this study) suppresses fibrin-induced ROS generation. NADPH oxidase activation and degradation of glutathione by fibrin could be key prooxidant mechanisms in diseases with BBB disruption and vascular pathology. Thus, it is possible that there is a positive-feedback loop between coagulation, oxidative stress, and the pro-inflammatory response, whereby subpopulations of innate immune cells promote the local synthesis of coagulation factors to increase fibrin deposition and promote oxidative injury. Local increases in coagulation activity by innate immune cell subpopulations as an oxidative stress mechanism could be relevant for other diseases in the brain and periphery with vascular damage associated with fibrin deposition and oxidative injury5, 6, 10,31,50–52.
We selected acivicin as an upstream regulator of glutathione and redox homeostasis. GGT-mediated cleavage of glutathione causes iron redox cycling, which stimulates the release of hydroxyl radicals35. Thus, redox restoration by acivicin may protect against EAE progression by homeostatic regulation of glutathione in oxidative stress-producing innate immune cells. In accordance, pharmacologic inhibition of GGT by GGsTop reduced oxidative stress markers and protected from renal reperfusion injury53. In EAE, acivicin suppressed inflammatory and prooxidant pathways and decreased axonal damage, demyelination, and peripheral cell recruitment into the CNS. Suppression of oxidative stress and reduction of chemokines that facilitate cell recruitment by acivicin might reduce myeloid cell numbers and decrease lesion size. Acivicin also regulates glutamate metabolism and leukotriene responses with potential effects on immune cell recruitment, neuronal and T cell functions35,54,55. Cell sorting and scRNA-seq studies will be required to determine the drug selectivity of acivicin at the single-cell level and its effects on oxidative stress resistance and additional prooxidant and inflammatory markers. These studies could decipher mechanisms linking oxidative stress and peripheral cell recruitment into the CNS in EAE and other models of neurologic disease. Glutamine analogues like acivicin exhibit dose-limiting toxicity in anti-cancer trials potentially due to interference with recycling of glutamine35. Given the toxicity of high doses of acivicin in the clinic or the consequences of global depletion of GGT1 in mice35, identification of safe drugs modulating glutathione metabolism might facilitate the restoration of redox hemostasis in neuroinflammatory disease.
In summary, by generating the first oxidative stress cell atlas of innate immunity, we identified cell populations and molecular mechanisms involved in oxidative injury and neurotoxicity in neuroinflammatory disease. We defined transcriptional signatures of oxidative stress genes that can be used as a resource and follow-up studies to validate additional gene targets, cell populations, and drugs from the HTS screen. Furthermore, we advance a method, Tox-seq, which can be used to determine the functional role of oxidative stress producing cells in a wide range of disease states. Tox-seq can be further combined with molecular probes that selectively detect different ROS to provide information on selective regulation of oxidative stress. Given the multiple roles of ROS in oxidative damage and redox regulation56, Tox-seq could reveal molecular pathways governing ROS-mediated functions in physiology and pathology. Integration of functional transcriptomics and HTS may prioritize druggable pathways that could enhance cherry-picking or in silico screens to identify compounds of interest for preclinical testing. Thus, oxidative stress transcriptomics and drug discovery approaches could identify and target neurotoxic CNS innate immune populations and lead to the development of selective neuroprotective strategies.
Methods
Animals.
SJL/J, NOD, C57BL/6, and Ggt1dwg/dwg38 mice were purchased from The Jackson Laboratory, and Sprague-Dawley rat P0 litters were purchased from Charles River Laboratories. Ccr2RFP/RFP mice57 on C57BL/6 background (provided by I. F. Charo, Gladstone Institutes) were crossed with Cx3cr1GFP/GFP mice58 to generate Cx3cr1GFP/+Ccr2RFP/+ mice. Mice were housed under IACUC guidelines in a temperature and humidity-controlled facility with 12 h light–12 h dark cycle and ad libitum feeding. All animal protocols were approved by the Committee of Animal Research at the University of California, San Francisco (UCSF), and were in accordance with the National Institutes of Health guidelines.
EAE.
EAE was induced in 8- to 12-week-old female SJL/J, C57BL/6, NOD, and Cx3cr1GFP/+Ccr2RFP/+ mice as described9,43. Mice were administered with 5 mg/kg acivicin (Santa Cruz Biotechnology, dissolved at 1 mg/ml in saline), 5 mg/kg GGsTop (Tocris) or saline. Mice were randomly assigned to treatment groups, scored and drug-treated in a blinded manner. Mice that did not develop symptoms of EAE were not excluded from the analysis. Experimental groups were unblinded to treatment assignment at the end of the experiments. Mice were observed daily, and clinical scores were assigned as follows by observers blinded to treatment: 0, no symptoms; 1, loss of tail tone; 2, ataxia; 3, hindlimb paralysis; 4 hindlimb and forelimb paralysis; 5, moribund. EAE onset was defined by weight loss (>1 gram) and first day of symptoms (score > 0).
Tox-seq.
Mice were perfused with ice-cold phosphate-buffered saline (PBS) and spinal cords were flushed out from the spinal column with PBS. Tissues were incubated in HBSS with 0.2% collagenase, type 3 (Worthington) gently shaking for 30 min at 37 °C, and then mechanically dissociated and passed through a 40-μm strainer (Falcon). Cells were collected in complete RPMI-1640 medium (without phenol red supplemented with 25 mM HEPES pH 7.4, 1% Penicillin/Streptavidin and 10% heat-inactivated fetal bovine serum (FBS; Thermo Fisher Scientific)) and myelin was depleted following the myelin removal beads II manufactures guidelines (Miltenyi Biotec). For the scRNA-seq experiment, myelin-depleted cell suspensions were treated for 5 min at 4 °C with Fc-block in BSA staining buffer (BD Biosciences) and then incubated for 30 min at 4 °C with CD11b APC-Cy7 (M1/70) antibodies. Live cells isolated from spinal cord were stained for intracellular ROS in vitro using membrane permeable, fluorescent reagent 2′,7′–dichlorofluorescein diacetate (DCFDA; Abcam) as described22. For bulk RNA-seq, cells were incubated with 10 μM DCFDA in PBS supplemented with 2% FBS, 2 mM EDTA (Gibco) for 30 min at 37 °C, and directly analyzed by flow cytometry. For scRNA-seq, to minimize cell activation and cell death cells were incubated with 10 μM DCFDA in PBS supplemented with 2% FBS without EDTA at 4 °C for 30 min prior to cell sorting. Cells were incubated for 5 min at 4°C with 1 μM sytox blue live/dead stain and then sorted using FACSAria II. Sorted cells were kept on ice until all samples were collected and then resuspended in cold PBS supplemented with 2% FBS at 233 cells/μl and immediately processed for droplet-based scRNA-seq or bulk RNA-seq.
For scRNA-seq, 30 μl of each live Sytox blue−CD11b+ROS− and live Sytox blue−CD11b+ROS+ sorted cell population from healthy and EAE spinal cords (clinical score 1.0) were run on the 10x Genomics Chromium platform, and libraries were prepared following manufactures instructions for the Chromium Single Cell 3′ v2 Reagent Kit. Balanced library pools were run across four lanes of an Illumnia Hiseq4000 with a targeted sequencing depth of 100,000 reads per cell. Reads from each sample were aligned to the mm10 reference assembly using the 10x Genomics Cell Ranger Count version 2.0.1, and then each sample was combined into one dataset using the 10x Genomics Cell Ranger Aggr package. The complete Cellranger sequencing depth and data summary analysis per sample is provided in Supplementary Table 1.
For bulk RNA-seq, CompBeads Compensation Particles (BD Biosciences) were used for color compensation controls. In each experiment, the maximal cell number of sorted microglia and macrophages was assessed based on CD11b (M1/70) and CD45 (30-F11) signal intensities (Supplementary Table 5). ROS+ (DCFDA) cells were gated based on FITC signals (cut-off 2 × 10³), and MHC II+ cells gated based on PE-Cy7 signal (cut-off 3 × 10³) compared to the unstained cells. Microglia and macrophage subpopulations were classified into MHC II+ ROS+, MHC II− ROS− (baseline), MHC II− ROS+ and MHC II+ROS−. In each sorting experiment, eight distinct cell populations were collected separately on ice. After centrifugation at 300g and 4°C for 6 min, cell pellets were stored at −80°C in 150 μl RLT buffer (Qiagen) with 1% 2-mercaptoethanol (Gibco) prior to RNA isolation. Total RNA was isolated using the RNeasy Plus Micro Kit (Qiagen) according to the manufacturer’s instructions. cDNA was generated from full-length RNA and uniformly sheared with the NuGEN Ovation RNA-seq V2 kit and Covaris S2 Sonicator, respectively. Libraries were purified using Agencourt XP magnetic beads and quantified by KAPA qPCR (Illumina). Four libraries per lane were pooled for a single-end 50bp run on the Illumnia HiSeq 4000. FASTQ files were trimmed of known adapters and low-quality regions of reads using Fastq-mcf59.
Analysis of RNA-seq data.
For scRNA-seq, the R toolkit Seurat23 was used for quality control (QC) processing, graph-based clustering, visualizations, and differential gene expression analyses of scRNA-seq data and performed in R version 3.4.2. Cellranger Aggr aggregated dataset of 9,079 cells were filtered with QC parameters 200 – 5,000 nFeature_RNA per cell, > 5% and > 25% mitochondrial and ribosomal genes, respectively. The percent of mitochondrial (percent.mito) and ribosomal (percent.ribo) genes were regressed out. All remaining variable genes were used for downstream analyses, including immediate early response genes induced by cell isolation procedure24. Following QC, 17,814 genes across 8,701 single cells were analyzed with Seurat version 3 default parameters unless otherwise stated (Extended Data 2c,d). To determine statistically significant principal components (PC), JackStraw was performed with num.replicate = 100. For clustering analysis, FindNeighbors and FindClusters were used with the first 20 significant PC and a resolution = 0.8, respectively. For subclustering analysis, monocyte/macrophage or microglia clusters in Fig 1h, were separately re-clustered by running through the Seurat pipeline as described above. FindClusters was implemented at a resolution = 0.4 for monocyte/macrophages or resolution = 0.3 for microglia subcluster analysis. Differentially expressed genes (DEGs) for each cluster was determined by FindAllMarkers with parameters min.pct, 0.25; log2fc.threshold, 0.25 using Wilcox statistical test. Genes that met the above criteria with adjusted P-value < 0.05 (Benjamini-Hochberg correction) were used for functional enrichment analysis. GO enrichment analysis of DEGs was performed in DAVID60 and Metascape bioinformatic resources.
For bulk RNA-seq, sequence QC was assessed using FastQC and RSeQC. Reads were aligned to the mm9 mouse genome assembly using Tophat 2.0.13, mapped reads were counted using featureCounts from Subread suite and then differential gene analysis was performed using edgeR61. The data set was filtered by including all genes with minimum of two replicates with CPM (counts per million) between 0.5 and 5000. The remaining genes were normalized using calcNormFactors weighted trimmed mean of M-values and the differential expression between samples was used to calculate P-values in edgeR62. The R function “p.adjust” was used to calculate the FDR (false discovery rate) for each P-value using the Benjamini-Hochberg method. GO Elite was used to identify DEGs that were overrepresented in existing annotated genes (Supplementary Table 6)63. Clustering was performed by k-means clustering with 100 clusters on log transform expression levels then by Hierarchical Ordered Partitioning and Collapsing Hybrid (HOPACH)64 on the k-means clusters to prune highly similar clusters.
Co-expression clusters from enriched GO terms for bulk RNA-seq dataset.
Functional enrichment analysis of a data set with 2,145 DEGs in ROS+ versus MHC II+ microglia was performed in Cytoscape33 using BiNGO plugin and GO annotations downloaded on 8-Dec-2016. Filtering for GO term results with <2000 genes, 592 Biological Process terms with a corrected P-value <0.05 were found. GO term enrichment was also performed on the exclusive subsets of ROS-expressed genes (1,613) and MHC II-expressed genes (924), resulting in 58 and 783 filtered Biological Process terms, respectively. From these GO term results, 6 were selected that represented processes of interest, maximum specificity (i.e., low total gene membership) and exclusive significance (i.e., non-overlapping terms). Interaction networks were constructed for each set of DEGs associated with these 6 terms using GeneMANIA65. Default co-expression and physical interaction sources were selected from the network construction; the option to add a number of related genes was set to zero; all other settings were default values. The interaction data from GeneMANIA was imported into Cytoscape for visualization and data overlay. Co-expression clusters were defined as the largest connected set of either up- or down-regulated genes and extracted as subnetworks.
Oxidative stress pathway modeling.
A novel oxidative stress pathway was constructed based on compiling information from the literature and existing pathway diagrams, that included glutathione metabolism, redox, biosynthesis, uptake, breakdown, glutathionylation and acivicin inhibition. The gamma-glutamyl cycle was simplified for clarity. PathVisio34 was used to construct the pathway model, which was deposited at WikiPathways (WP4466)66 and then imported into Cytoscape for RNA-seq data overlay.
Preparation of fibrin plates for HTS.
Fibrin-coated 384-well plates were prepared with a EL406 liquid handler (BioTek), columns 1-22 received 30 μL of 2 U/mL Thrombin (Sigma-Aldrich) in a buffer of 20 mM HEPES, pH 7.4, and 14 mM CaCl2, followed by 30 μL of 12 μg/mL human plasminogen-free fibrinogen (EMD Milipore) in 20 mM HEPES, pH 7.4 for a final concentration of 6 μg/mL of fibrinogen. After incubation for 90 min in 37°C to allow fibrin formation, plates were dried overnight in a 37 °C incubator equipped with fans to circulate the air.
Image-based HTS of small molecule inhibitors of microglia activation.
Primary rat microglia were isolated and cultured in the presence of heat-inactivated Performance Plus FBS (Thermo Fisher Scientific) as described18,67. FBS was used to obtain a sufficiently high yield of microglia that was required for the HTS of 2,000 compounds. Since microglia activation can be influenced by the culture conditions18,67, FBS was batch-tested with three QC criteria: high cell yield, no effect on morphologic activation at baseline, and response to LPS-induced morphologic activation by at least 50%. Microglia HTS was performed in 384-well PDL-coated plates (Greiner). To screen for compounds that inhibited fibrin-activated microglia, 50 μL of DMEM containing 10% FBS was added to the fibrin-coated plate using an EL406 liquid dispenser-aspirator (Biotek). To screen for inhibitors of LPS-activated microglia, 50 μL of a 1 ng/mL LPS (Sigma-Aldrich) was added to the well. A library of 1,907 clinical drugs and bioactive compounds, compiled by the Small Molecule Discovery Center at the UCSF, was screened at 10 μM. 100 nL of each compound (10 mM stock solution in DMSO) was added using a Biomek FXP automated laboratory workstation (Beckman Coulter) outfitted with a 50 nL pintool (V&P Scientific). Columns 1-2 contained DMSO-treated control cells (defining maximal activation/0% inhibition); columns 3-22 contained test compounds, and columns 23-24 contained unstimulated control cells (defining minimal activation/100% inhibition). 3,000 microglia cells were added to each well in 50 μL of DMEM containing 10% FBS, giving a final compound concentration of 10 μM in 0.1% DMSO. Assay plates were incubated at 37°C, 5% CO2 for 48 h. Using the EL406 liquid dispenser-aspirator, cells were then fixed with 4% paraformaldehyde solution, permeabilized with 0.1% Triton-X100, and stained with 0.5 μg/mL CellMask Red (Thermo Fisher Scientific) and 2 μg/mL Hoechst nuclear dye (Thermo Fisher Scientific) with PBS washes between steps. The plates were stored in PBS for readout by imaging.
To measure microglial activation, assay plates were imaged using an INCell Analyzer 2000 automated fluorescent microscope (GE Healthcare) equipped with a 10x objective and excitation/emission filter pairs of 350 nm/ 455nm (Hoechst dye) and 579 nm / 624 nm (CellMask Red). Images were analyzed with the INCell Developer Toolbox feature extraction software (GE Healthcare). Cell nuclei stained with Hoechst dye were segmented using a “nuclear” segmentation method, with a minimum target area of 30 μm2 and sensitivity of 75%. Exclusion criteria for cell segmentation was set to intensity <120 units, or area >1000 μm2. CellMask Red staining and criteria for the identification of activated microglia were as described9. The number of activated microglia was divided by the total number of cells in the well to yield a fraction of activation and then normalized to the stimulated/untreated wells (columns 1-2) and unstimulated wells (columns 23-24) to determine the percentage of inhibition of microglial activation. Similarly, the percentage of dead cells was calculated by comparing the fraction of dead cells in a well to the stimulated and unstimulated controls. For each assay plate, Z′ values were calculated as described9. The average Z′ value was 0.5 for the six fibrin screening plates and 0.63 for the six LPS screening plates.
Active compounds were defined as having cell toxicity to fewer than 3% and inhibiting activation by > 50% in either LPS or fibrin-treated plates. The 50% inhibition cutoff value was set as 3 standard deviation from the mean of untreated control. Active compounds were reconfirmed in dose-response assays conducted in triplicates of 10 concentrations, with 3-fold serial dilutions ranging from 0.001 μM - 20 μM. IC50 values were estimated from normalized % inhibition values, using the four-parameter non-linear regression analysis (Graphpad Prism).
ROS detection.
BMDMs and PBMCs culture and ROS detection using dihydroethidium (DHE) were performed as described9,68. For GGT inhibition, cells were pre-incubated with 5 μM acivicin or GGsTop for 1 h, and then plated on fibrin-coated plates for 24–48 h and then fixed with 4% PFA for 10 min. PBS was used as vehicle control.
GGT activity assay.
GGT activity was measured using the MaxDiscovery GGT Enzymatic Assay Kit (Bioo Scientific) according to the manufacturer’s protocol. BMDMs were pre-incubated for 1 h with 10 μM acivicin before plating cells on 25 μg/ml fibrin-coated 6-well culture plates. For in vivo GGT activity assay, spinal cord tissues from peak disease of MOG35-55 EAE or LPS-injected substantia nigra area at 12 h were prepared. Tissues were homogenized in 0.1 M Tris-HCl and centrifuged at 13,000g for 30 min at 4 °C. The supernatant was collected and assessed for GGT activity by measuring the absorbance at 405 nm with a microplate reader as described above. The GGT activity in IU/l was calculated following the manufacturer’s protocol by multiplying the average increase in absorbance at 405 nm over 10 min. GGT activity was also measured with fluorescent probe, ProteoGREEN-gGlu (Goryo Chemical), according to the manufacturer’s protocol. BMDMs were plated on 96-well, black μ-clear-bottom microtiter plates (Greiner Bio-One) pre-coated with 25 μg/ml fibrin. BMDMs were incubated with ProteoGREEN-gGlu with acivicin or GGsTop (diluted at threefold concentrations from 0.01 μM to 8.3 μM). The fluorescence intensity (excitation/emission filter pairs of 488 nm/520 nm) was measured using a microplate reader as described above.
Real-time imaging of glutathione.
The real-time GSH dynamics in living BMDMs were determined with the fluorescent GSH probe, RealThiol RT-AM as described37. Briefly, cells were plated on 2-well chamber Nunc slide pre-coated with 25 μg/ml fibrin with or without 5 μM acivicin or GGsTop. Buthionine sulfoximine (BSO, Sigma-Aldrich) was used as positive control for reducing intracellular GSH levels at 100 μM. Cells were kept at 37 °C during the entire experiment. After 24 h incubation, cells were loaded with 1 μM RT-AM probe for 5 min then fluorescence emissions after sequential excitation at 405 nm and 488 nm was acquired using sequential confocal laser scanning microscopy (Olympus FV1000; Olympus) with a 10× objective and 2× optical magnification. For each independent experiment, laser power and detector settings were set using the control/untreated cells incubated with RT-AM alone and then all settings were kept constant throughout the experiment. The ratio bound intracellular RT-AM:unbound intracellular RT-AM for each treatment condition was calculated by subtracting the 488-nm fluorescence signal from the 405 nm fluorescence signal from 30–50 cells/treatment for each independent experiment. The ratio calculated for each treatment was expressed as percentage from that of the untreated cells (control).
Real time qPCR.
Total RNA was isolated from BMDMs or spinal cord tissues using the RNAeasy Mini kit (Qiagen) according to the manufacturer’s instructions. cDNA was prepared with High Capacity cDNA Reverse Transcription Kit (Applied Biosystems). SYBR green-based qPCR was performed using murine primers to Cxcl10, Nos2, Cxcl3, Ccl5, Il1b, or Il12b. Results were analyzed with the Opticon 2 Software and the comparative CT method. Gene expression was normalized to Gapdh and presented as fold change relative to control.
Immunohistochemistry.
Spinal cords were processed as described9,29,30,68,69. The following antibodies were used: mouse anti-gp91 (CYBB, 1:200; 53, BD Biosciences), mouse anti-iNOS (1:500, 610329, BD Biosciences), rabbit anti-Iba-1 (1:1000; 019-19741, Wako), rat anti-MHC II (1:300; M5/114.15.2, Thermo Fisher Scientific), rabbit-coagulation factor X (F10; NBP1-33320, NOVUS), mouse anti-CLEC4E (1:700; AT16E3, abcam), mouse anti-neurofilament H non-phosphorylated (1:100; SMI-32, BioLegend), mouse anti-myelin basic protein (1:100; SMI-99, BioLegend), rabbit polyclonal anti-GGT1 (1:100; SAB2701966, Sigma), or goat polyclonal anti-4HNE (1:200; ab46544, Abcam) and Alexa 647, 488, 405 (1:500; Jackson ImmunoResearch) the Vector-Red and Vector-Blue alkaline phosphatase substrate kit (Vector Labs) for detection. Sections were stained with DAPI (1:1000, Thermo Fisher Scientific) for 3 min at 23 °C room temperature. For mouse primary antibodies, the Mouse on Mouse (M.O.M.) kit (Vector Labs) was used according to the manufacturer’s protocol. Analysis was based on an established method of neuropathology for sampling multiple spinal cord sections and comparing similar anatomical regions as described69–71. Images were acquired with an Axioplan II epifluorescence microscope (Zeiss) equipped with Plan-Neofluar objectives (10 × 0.3 NA, 20 × 0.5 NA, or 40 × 0.75 NA) or all-in-one BZ-X700 fluorescence microscope (Keyence), Fluoview FV 1000 (Olympus) confocal microscope and Fluoview software v3.1b with Olympus 40X and 0.8 NA water-immersion lens as described9, or Aperio Versa scanner (Leica) with Aperio Imagescope 12.4 and 1.25X, 10X, and 20X lenses. Images of similar anatomical locations were quantified using NIH ImageJ (version 1.50) by observers blinded to experimental conditions.
Flow cytometry.
Single-cell suspensions were incubated with Fc receptor-blocking anti- CD16/CD32 antibodies (2.4G2) for 15 min at 4 °C. Cell suspensions were next stained with surface fluorescent-conjugated antibodies for 30 min at 4 °C. The following antibodies were used: CD3 (17A2), CD4 (GK1.5), CD8 (53-6.7), CD62L (MEL-14), CD44 (1M7), CD25 (3C7), CD11b (M1/70), CD45 (30-F11), and MHC II (M5/114.15.2). For surface labeling of GGT1, unconjugated mouse monoclonal anti-GGT1 (1:100; ab55138, Abcam) was incubated with surface markers for 1 h at 4 °C. Then FITC-conjugated species-specific secondary antibody (1:100) was added for 1 h at 4 °C. For intracellular staining of IFN-γ and IL-17A, T cells were stimulated for 4 h with Cell Activation Cocktail (BioLegend). Cells were then fixed with Cytofix/Cytoperm solution (BD Bioscience) and stained with antibodies to IL-17A (TC11-18H10.1), or IFN-γ (XMG1.2). Foxp3 (FJK-16S) staining was performed according to the manufacturer’s protocol (eBioscience). Cells were analyzed by flow cytometry on an LSRII (BD Biosciences) with FlowJo software (Tree Star Inc.). Antibodies were purchased from BioLegend, BD Biosciences, or eBioscience and were used at 1:300 dilution unless stated otherwise.
Blood sampling and hematological analysis.
Hematological analysis was carried out for mice treated with saline or acivicin for 10 days. Blood samples were collected from the heart of each anesthetized mouse via cardiac puncture. The complete blood cell counts were measured with an automated blood count analyzer (Hemavet, Drew Scientific Inc).
Protein carbonyl content assay.
Blood was isolated from EAE mice via terminal cardiac puncture, and serum levels of protein carbonylation were measured with OxiSelect™ Protein Carbonyl ELISA (Cell Biolabs) according to the manufacturer’s protocol. The absorbance at 450 nm was measured using a SpectraMax M5 microplate reader as described above.
T cell proliferation assay.
Naïve CD4+ T cells were magnetically sorted from TCR-transgenic 2D2 mice using naïve CD4+ T cell isolation kit (Miltenyi Biotec). BMDMs were incubated with 5 μM acivicin, primed with MOG35-55 peptide (10 μg/ml) and then stimulated with LPS (10 ng/ml) for 24 h. CD4 T cells were cultured with MOG35-55 peptide primed BMDMs for 3 days and BrdU incorporation was assessed as described previously68. For non-antigen-specific T cell proliferation, naïve CD4+ T cells were treated with acivicin and stimulated with mouse T-activator CD3/CD28 Dynabeads (Thermo Fisher Scientific) for 3 d. Cells were then fixed, permeabilized, and stained with FITC-conjugated anti-BrdU (BrdU Flow Kits, BD Biosciences). Cells were analyzed with LSRII as described above.
Stereotactic LPS injection and drug treatment.
Mice were anaesthetized with isoflurane and placed in a stereotactic apparatus (David Kopf Instruments). LPS (Sigma-Aldrich) stock was dissolved in endotoxin-free distilled water (HyClone) and further diluted to 1 μg/ml with PBS. LPS (2 μl of 1 μg/ml) or PBS was injected at 0.3 μl/min using a 10-μl Hamilton syringe attached to a 33-G needle into the substantia nigra at coordinates anteroposterior, 3.0 mm; mediolateral, 1.3 mm; dorsoventral, 4.7 mm from the bregma, according to Paxinos and Watson. Animals received acivicin (5 mg/kg) or saline intraperitoneally beginning 5 days before LPS injection and then sacrificed 12 h or 7 days after LPS injection for GGT activity assay or immunohistochemistry, respectively. For GGT activity, samples were collected on ice and stored at −80°C until analysis. For immunohistochemistry, animals were processed as described above and 30-μm coronal brain sections were stained with antibodies to tyrosine hydroxylase (TH, 1:2000; P40101, Pel Freez) and Iba-1 (1:1000; 019-19741, Wako). Images were acquired with all-in-one BZ-X700 fluorescence microscope as described above.
Statistical analyses.
Statistical analyses were performed with GraphPad Prism (Version 7). Data are presented as mean ± s.e.m. No statistical methods were used to predetermine sample size, but sample sizes are similar to those reported previously. Statistical significance was determined with two-tailed unpaired student’s t-test, accumulative hypergeometric test with Bemjamini-Hochberg correction, Wilcox two-tailed test, or non-parametric two-tailed Mann-Whitney test, or a one-way or two-way ANOVA analysis of variance followed by Bonferroni, Sidak’s, or Tukey’s post-test (multiple comparisons). Mice were age and sex-matched and were randomly assigned to experimental groups. The assignment of EAE clinical scores, histopathological analysis and quantification were done in a blinded manner. The statistical significance of the changes in the mean clinical score for each day of the EAE experiment was estimated using permutation tests9.
Reporting Summary.
Further information on research design is available in the Nature Research Reporting Summary linked to this paper.
Data availability:
The scRNA-seq and bulk RNA-seq data files are available in the Gene Expression Omnibus database under SuperSeries accession code GSE146295. Oxidative stress pathway model is available at WikiPathways: https://www.wikipathways.org/instance/WP4466. All data generated and analyzed in this study are available within the paper. Any additional data can be made available from the corresponding author upon reasonable request.
Extended Data
Extended Data Fig. 1. Tox-seq and HTS schematic.
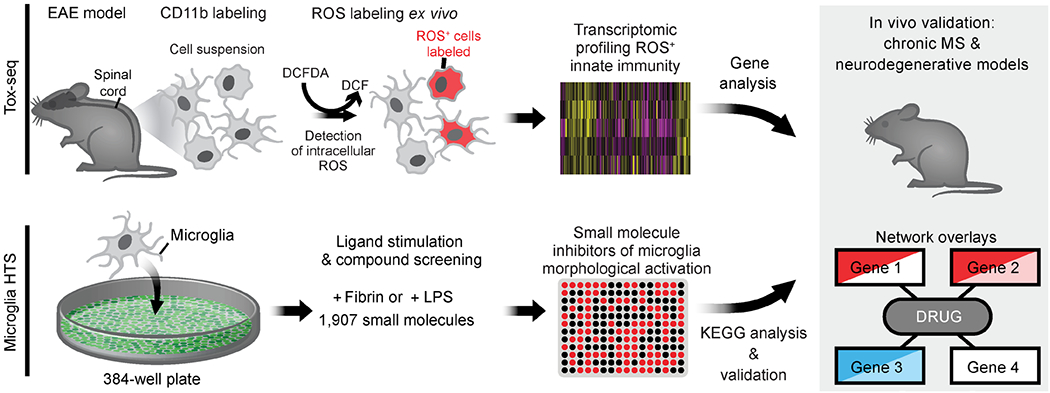
Tox-seq workflow and microglia HTS followed by in vivo validation and drug gene target network analysis.
Extended Data Fig. 2. Validation of single cell oxidative stress transcriptome of CNS innate immunity.
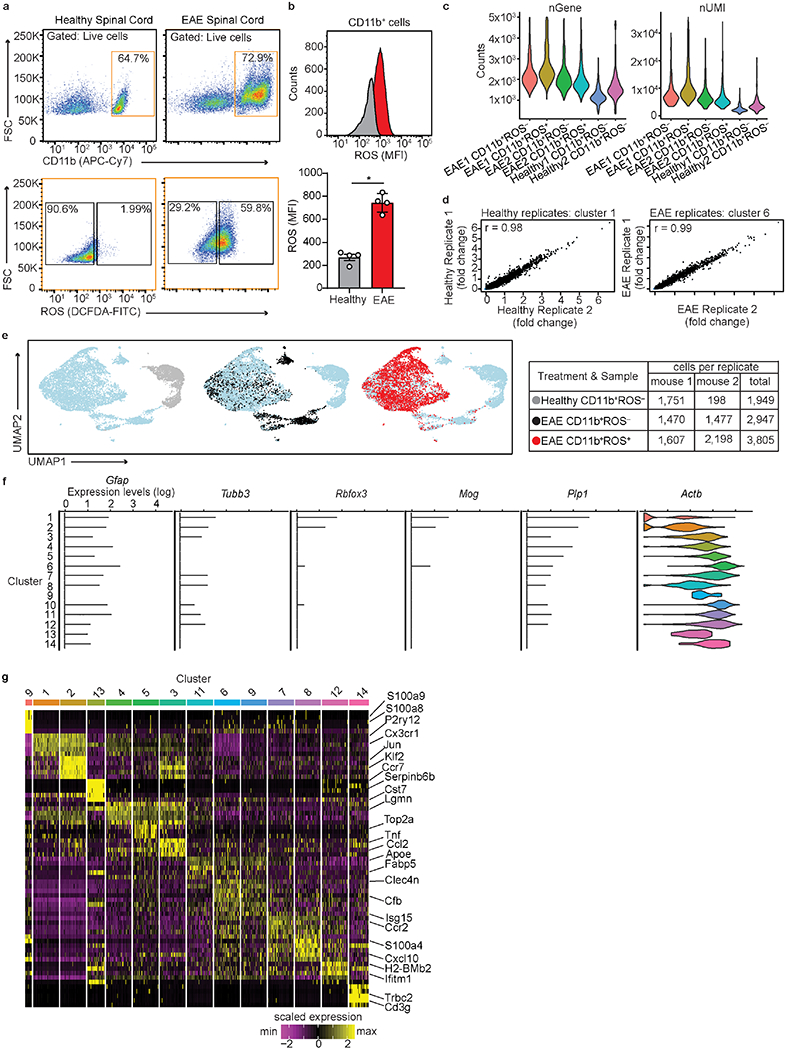
a, Flow cytometry plots of live CD11b+ROS− and live CD11b+ROS+ cells from spinal cord of individual healthy and EAE mice. Cell population (%) is shown inside gate. Data are representative of two independent experiments with similar results. b, Representative histogram plots (top) and quantification of mean fluorescence intensity (MFI, bottom) of ROS production (assessed via DCFDA) in CD11b+ cells from healthy and EAE mice. Data are from n = 4 mice per group (a, b) (mean ± s.d.). *P < 0.05 (two-tailed Mann-Whitney test). c, Violin plots of number (n) Gene (nGene) and unique molecular identifiers (nUMI) post-normalization and shown for each biological replicate for scRNA-seq. Data are from n = 2 mice per group. d, Correlation gene expression scatter plot between healthy (left) or EAE (right) biological replicates from scRNA-seq. Data are from n = 2 healthy and 2 EAE mice depicted as the average gene expression for cluster 1 (n = 14,927 and 12,861 genes for healthy replicate 1 and 2 respectively) and cluster 6 (n = 11,856 and 14,319 genes for EAE replicate 1 and 2 respectively) with Pearson correlation coefficients r = 0.98 and 0.99, respectively. e, UMAP plots (left) of each cells sample type and summarized in table (right). f, Violin plots of log expression levels of potential astrocytic (Gfap), neuronal (Tubb3 and Rbfox3), oligodendrocyte (Mog and Plp1) contaminates in each cluster. Violin plots depict minima and maxima expression levels (14 clusters; n = 8,701 cells from spinal cord of 2 healthy and 2 EAE mice). Genes shown were not differentially expressed. Actb is shown as a reference gene. g, Heat map of top 5 DEGs per single cell cluster. The clusters are ordered by unsupervised hierarchical clustering. Key indicates scaled z-score expression.
Extended Data Fig. 3. CNS innate immune populations and comparison with canonical myeloid gene signatures.
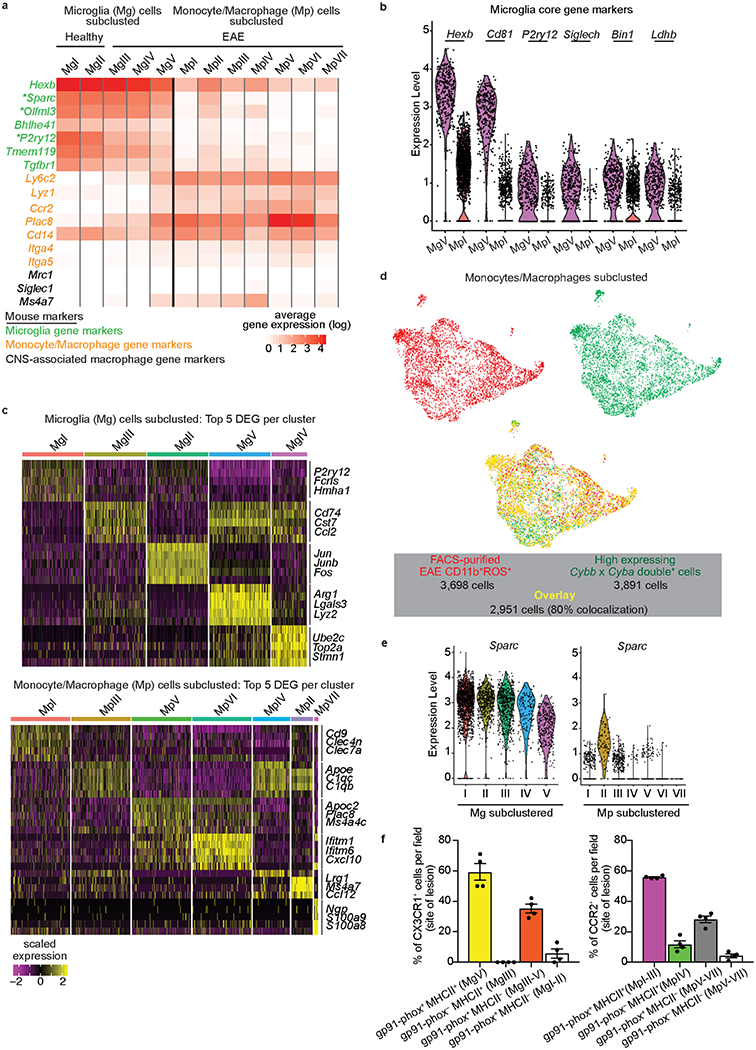
a, Heat map of oxidative stress subclusted populations from Tox-seq analyzed for select microglia (green text)19,20, monocyte/macrophage (orange text)20,25,26, and CNS-associated macrophage (black text)20 gene markers. Key indicates average gene expression (log scale). Asterisk indicates genes previously validated by cell-fate mapping20. b, Violin plots from Tox-seq clusters MgV and MpI showing single-cell gene expression levels of highly-conserved microglia core genes27. Violin plots depict minima and maxima with points showing single cell expression levels. Data are from n = 2 mice per group. c, Heat maps of top 5 DEGs across microglia (top) or monocytes/macrophages (bottom) single cell subclusters. Key indicates scaled z-score gene expression. d, UMAP plots of monocytes/macrophages subclusted and colored based on FACS-purified EAE CD11b+ROS+ cells (red dots), high expressing NAPDH oxidase (Cybb+ x Cyba+) cells (green dots), and overlay between the two populations (yellow dots). The percent colocalization between the number of FACS-purified EAE CD11b+ROS+ and high expressing NAPDH oxidase cells is shown in key. e, Violin plots of log expression levels of Sparc across all microglia (Mg) and monocyte/macrophage (Mp) clusters. Violin plots depict minima and maxima with points showing single cell expression levels. Data are from n = 2 healthy and 2 EAE mice. f, Confocal microscopy quantification related to Fig. 3g, and presented as percent CX3CR1+ and CCR2+ cells colocalized with gp91-phox and MHC II in spinal cord sections from Cx3cr1GFP/+:Ccr2RFP/+ mice with MOG35-55-induced EAE. n = 4 mice per group (means ± s.e.m.). Each symbol (f) represents an individual mouse.
Extended Data Fig. 4. Bulk RNA-seq of ROS+ and MHC+ CNS innate immune cells.
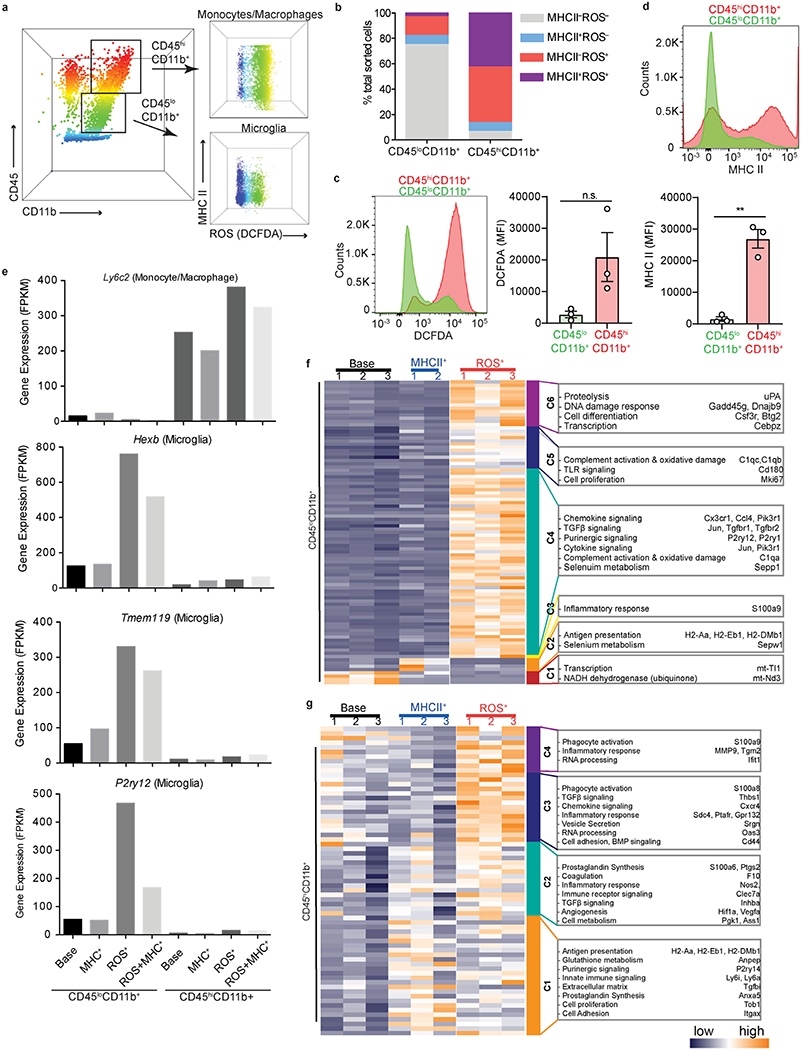
a, Representative flow cytometry plots of CD45loCD11b+ (microglia) and CD45hiCD11b+ (monocytes) cells sorted based on MHC II and ROS production (assessed via DCFDA) from EAE spinal cord. Data are representative of n = 3 independent experiments with similar results. b, Cell percentages of sorted microglia and monocytes populations. Data are from n = 3 independent experiments with 5 spinal cord EAE tissues pooled per experiment. c, d, Quantification of MFI of ROS production (assessed via DCFDA) (c) and MHC II (d) expression in CD45loCD11b+ and CD45hiCD11b+ cells. Data are from n = 3 experiments (mean ± s.e.m.) ** P = 0.0011, n.s., not significant P = 0.080 (two-tailed unpaired t-test). Each symbol represents an individual mouse. e, Gene expression (FPKM) profiles of select microglia and monocyte/macrophage markers across each sorted population. Base, MHCII−ROS− cells. f, Heat map of bulk RNA-seq cluster analysis from CD45loCD11b+ cells. Six gene clusters (C1-6) were annotated with functions for selected genes based on expression levels. g, Heat map of bulk RNA-seq cluster analysis from CD45hiCD11b+ cells. Four gene clusters (C1-4) were annotated with functions for selected genes based on expression levels. Key indicates normalized z-score expression.
Extended Data Fig. 5. Effects of acivicin on microglia, macrophage and whole blood cell numbers.
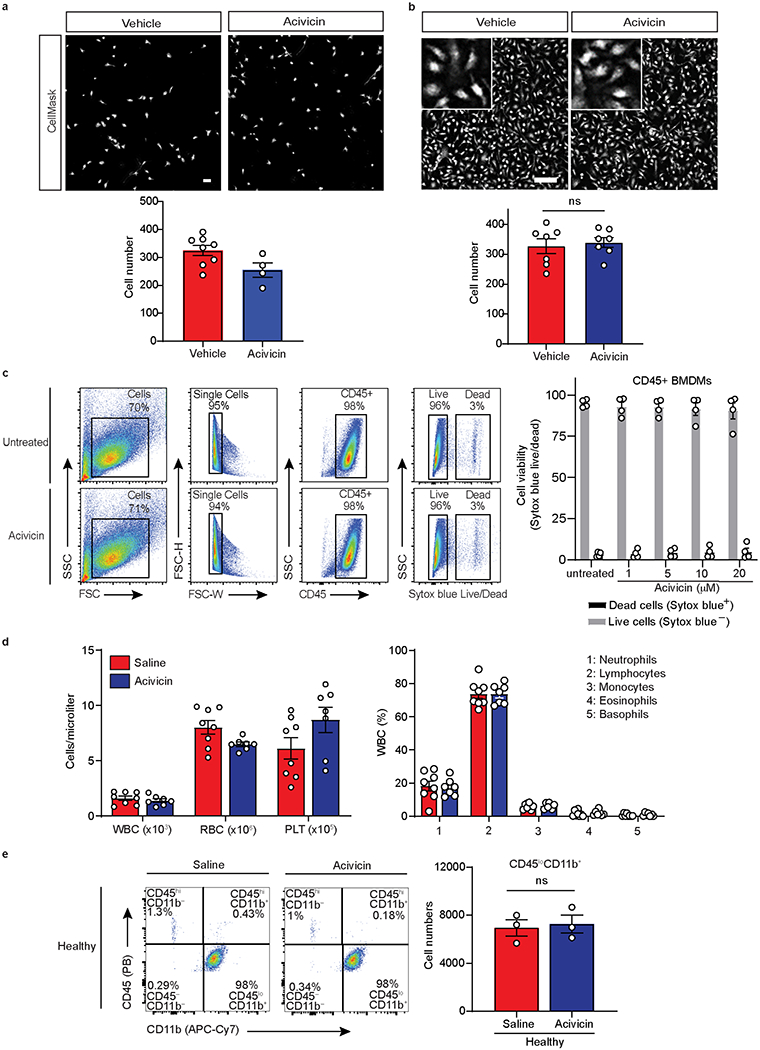
a, Representative images showing morphology and density of primary microglia treated with vehicle or acivicin for 48 h stained with nuclei marker Hoechst or CellMask Red Whole Cell Stain. Quantification of the total number of microglia. Data are representative of one experiment with technical replicates (open symbols). Scale bar, 100 μm. b, Representative confocal images showing morphology and density of vehicle- and acivicin-treated BMDMs treated for 24 h. Scale bar, 100 μm. Insets depict digitally zoomed in regions of interest. Quantification of the total number of BMDMs in the field of view. Data are from n = 7 independent experiment. c, Representative flow cytometric plots of gating strategy for BMDMs treated with acivicin for 24 h or left untreated. Cell viability of single CD45+ cells was assessed by Sytox blue live/dead nuclei stain. Quantification of percent cell viability of BMDMs treated with acivicin or left untreated. Data are from n = 2 independent experiments with n = 4 mice per group. d, Quantification of complete blood count analysis of white blood cells (WBCs), red blood cells (RBC), platelets (PLT) (left) and composition of WBCs (right) of blood samples from healthy mice treated with saline or acivicin for 10 days. Data are from n = 8 mice (saline) or n = 7 mice (acivicin). e, Representative flow cytometric plots of CD45 and CD11b expressing cells from the spinal cord of healthy mice treated with acivicin or saline every day for 14 days. Quantification of total CD45loCD11b+ microglia cell numbers in healthy mice treated with acivicin or saline. Data are from n = 3 mice per group. Each symbol represents an individual experiment (b) or mouse (c-e). Data are shown as means ± s.e.m. (b, d, e) or means ± s.d. (c). P = 0.68 or P > 0.99; n.s., not significant, as determined by two-tailed unpaired Student’s t-test (b) or two-tailed Mann-Whitney test (e).
Extended Data Fig. 6. Inhibition of GGT in macrophages.
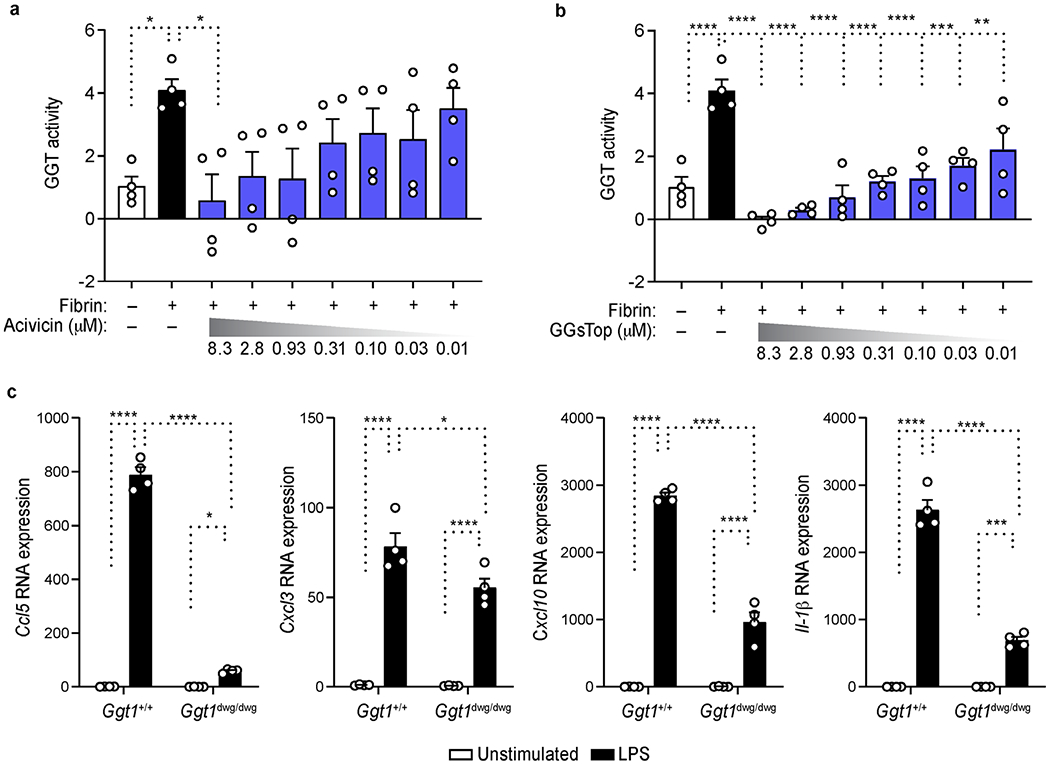
a, b, Dose response of acivicin (a) or GGsTop (b) on GGT activity measured by fluorescent probe gGlu in fibrin-stimulated BMDMs. Data are from n = 4 independent experiments performed in technical duplicates. c, qRT-PCR analysis of Ccl5, Cxcl3, Cxcl10 and Il1b expression in BMDMs isolated from Ggt1+/+ and Ggt1dwg/dwg mice left unstimulated or stimulated with LPS for 6 hr (key). Data are from n = 4 mice per group. Each symbol represents an individual experiment (a, b) or mouse (c). Data are shown as means ± s.e.m. (a-c). * P < 0.05, **P < 0.01, *** P < 0.001, **** P < 0.0001, as determined by one-way ANOVA with Dunnett’s multiple comparison test (a, b) or two-way ANOVA with Tukey’s multiple comparisons test (c).
Extended Data Fig. 7. Effects of acivicin in EAE, antigen-presenting cell function and GGT1 expression.
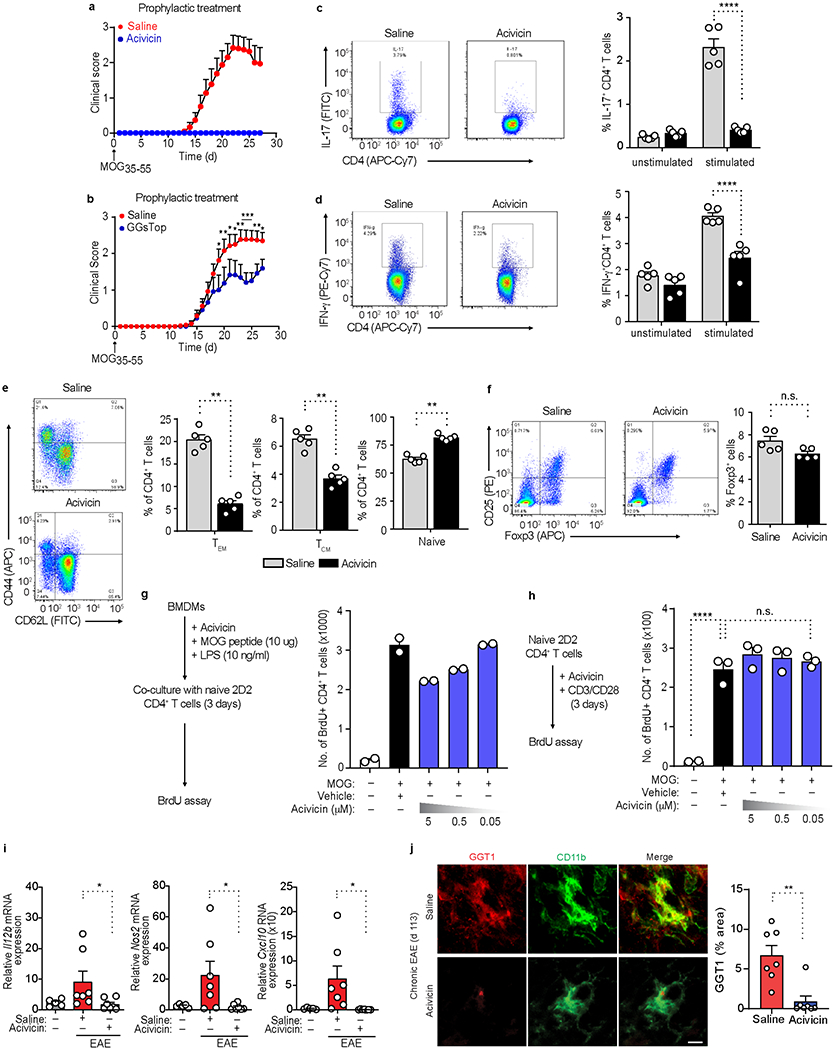
a, Clinical scores of MOG35-55 EAE mice (upward arrow) after daily prophylactic administration of acivicin (5 mg/kg, i.p.) or saline (key) starting day 0. Data are from n = 14 mice (acivicin), n = 15 mice (saline). b, Clinical scores for MOG35-55-induced EAE (upward arrow), followed by prophylactic injection of GGsTop (5 mg/kg, i.p.) or saline (key) every day beginning day 0. Data are from n = 13 mice (MOG35-55 + saline) or n = 12 mice (MOG35-55 + GGsTop). c-f, Flow cytometry analysis of splenocytes from MOG35-55-EAE mice treated with saline or acivicin for 10 days and assessed for IL-17+ or IFN-γ+ CD4+ T cells (c, d), effector memory (TEM), central memory (TCM), and naive CD4+ T cells (e), or CD25+FoxP3+ Treg cells (f). Data are from n = 5 mice per group. g, h, Flow cytometry analysis of BrdU+ 2D2 T cells activated with LPS primed BMDMs (pulsed with MOG35-55 peptide) or anti-CD3 and anti-CD28 in the presence or absence of acivicin. Data are from n = 3 independent experiments performed in technical duplicates. i. qRT-PCR analysis of gene expression from spinal cord extracts of unimmunized healthy controls and MOG35-55-EAE mice at peak disease, treated with saline or acivicin. Data are from n = 5 mice (unimmunized healthy control), n = 7 mice (EAE + saline), or n = 7 mice (EAE + acivicin). j, Confocal microscopy of spinal cord sections from NOD mice with chronic MOG35-55 EAE, treated with acivicin or saline every day starting at day 80 until day 113, showing GGT1 and CD11b immunoreactivity. Scale bar, 25 μm. Quantification of GGT1 immunoreactivity in white matter of spinal cord. Data are from n = 7 (EAE + acivicin) and n = 7 (EAE + saline) mice. Each symbol represents an individual mouse (c-f, i, j) or an individual experiment (g, h). Data are shown as means ± s.e.m. (a-j). * P < 0.05, **P < 0.01, *** P < 0.001, **** P < 0.0001; n.s., not significant, as determined by two-tailed permutation test (b), two-way ANOVA with Tukey’s multiple comparisons test (c, d), two-tailed Mann-Whitney test (e, f, i, j), or one-way ANOVA with Tukey’s multiple comparisons test (h).
Extended Data Fig. 8. Effects of acivicin in LPS-induced neurodegeneration.
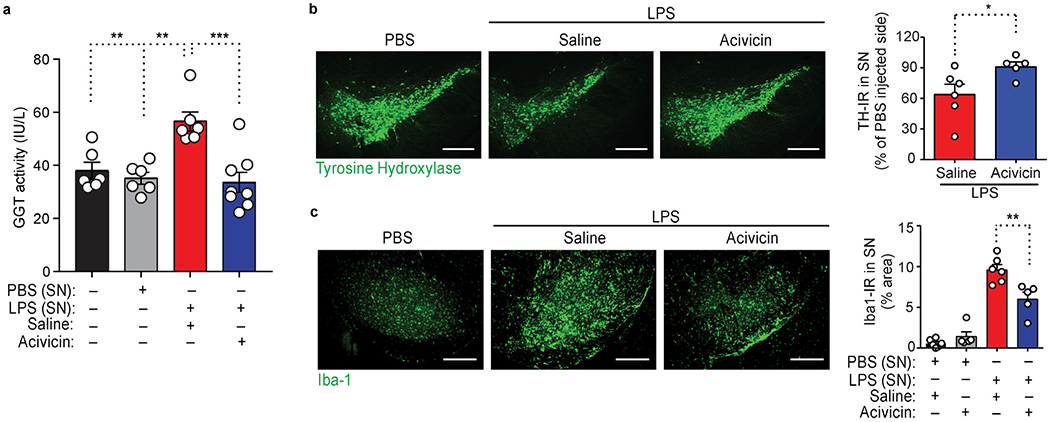
a, GGT activity in substantia nigra (SN) extracts 12 h following PBS or LPS injection in mice pretreated with acivicin or saline for 5 d. Data are from n = 6 mice (control, PBS, or LPS + saline) or n = 8 mice (LPS + acivicin). b, c, Microscopy images of brain sections spanning SN 7 d following PBS or LPS injection in mice pretreated with acivicin or saline, tissues were stained for tyrosine-hydroxylase (TH) (b) or Iba-1 (c). Scale bars, 300 μm (b, c). Quantification of TH (b) and Iba-1 (c) immunoreactivity in SN is shown (right). Data are from n = 6 mice (saline) and n = 5 mice (acivicin) (b); n = 6 mice (saline + PBS or saline + LPS) and n = 5 mice (acivicin + PBS or acivicin + LPS) (c).Each symbol represents an individual mouse (a-c). Data are shown as means ± s.e.m. (a-c). * P < 0.05, **P < 0.01, *** P < 0.001, as determined by two-way ANOVA with Tukey’s multiple comparisons test (a), two-tailed Mann-Whitney test (b), or two-way ANOVA with Sidak’s multiple comparisons test (c).
Supplementary Material
Acknowledgements:
We thank F. Quintana for sharing NOD EAE protocol, I. Kathiriya for advice on scRNAseq, the Gladstone Flow Cytometry (M. Cavrois, M. Maiti, and N. Raman) and Genomics (R. Chadwick, J. McGuire, Y. Hao, and N. Carli) Cores for expert technical assistance with flow cytometry, library preparations and sequencing. We thank S. Zeitlin and S. Chen for helpful advice and testing of cell-imaging algorithms; S.J. Won and R. Swanson for advice, B. Cabriga for technical assistance; G. Maki for graphics; K. Claiborn for editorial assistance. B.G.B. acknowledges support from Younger Family Fund, Jr. S.S.Z. is supported by research grants from the NIH (R01 AI131624, R01 NS092835, R21 NS108159), the National Multiple Sclerosis Society (NMSS) (RG1701-26628; RG-1801-29861), Race to Erase MS, the Weill Institute and the Maisin Foundation. J.W. is supported by NIH/NIGMS R01 GM115622. This research was supported by NMSS Postdoctoral Fellowships FG 1944-A-1, FG-1507-05496, and FG-1708-28925 to S.B., J.K.R, and A.S.M., respectively, the German Research Foundation (DFG) postdoc fellowship to S.B; UCSF Immunology NIH/NIAID T32 AI007334 to A.S.M; NIH/NINDS F32 NS096920 to V.A.R., Race to Erase MS Young Investigator Award and American Heart Association Scientist Development Grant 16SDG30170014 to J.K.R.; the FastForward / NMSS grant to K.A. and M.R.A., the Ray and the Dagmar Dolby Family Fund, the Simon Family Trust, Conrad N. Hilton Foundation (17348) and NIH/NIA RF1 AG064926 and NIH/NINDS R35 NS097976 to K.A.
Footnotes
Competing interests: K.A. is a co-founder and scientific advisor of Therini Bio, Inc. K.A., A.M.-F., J.K.R are co-inventors on The J. David Gladstone Institutes’ patent US10,451,611 and pending patent applications U.S. 16/572,365 and EP 15735284.05 covering in vitro fibrin assays. K.A. and J.K.R. are co-inventors on The J. David Gladstone Institutes’ application PCT/2018/052694 covering methods to inhibit neurodegeneration, K.A., M.R.A., K.K.A., A.M.-F., and C.W. are co-inventors on The J. David Gladstone Institutes’ and The Reagents of the University of California’s pending patent applications U.S. 15/943,474 and EP 15735033.1 covering assays for inhibition of microglia activation. Their interests are managed in accordance with their respective institutions’ conflict-of-interest policy.
References
- 1.Nikic I et al. A reversible form of axon damage in experimental autoimmune encephalomyelitis and multiple sclerosis. Nat. Med 17, 495–499 (2011). [DOI] [PubMed] [Google Scholar]
- 2.Locatelli G et al. Mononuclear phagocytes locally specify and adapt their phenotype in a multiple sclerosis model. Nat. Neurosci 21, 1196–1208 (2018). [DOI] [PubMed] [Google Scholar]
- 3.Fischer MT et al. NADPH oxidase expression in active multiple sclerosis lesions in relation to oxidative tissue damage and mitochondrial injury. Brain 135, 886–899 (2012). [DOI] [PMC free article] [PubMed] [Google Scholar]
- 4.Heppner FL, Ransohoff RM & Becher B Immune attack: the role of inflammation in Alzheimer disease. Nat. Rev. Neurosci 16, 358–372 (2015). [DOI] [PubMed] [Google Scholar]
- 5.Nortley R et al. Amyloid beta oligomers constrict human capillaries in Alzheimer’s disease via signaling to pericytes. Science 365, eaav9518 (2019). [DOI] [PMC free article] [PubMed] [Google Scholar]
- 6.Park L et al. NADPH-oxidase-derived reactive oxygen species mediate the cerebrovascular dysfunction induced by the amyloid beta peptide. J. Neurosci 25, 1769–1777 (2005). [DOI] [PMC free article] [PubMed] [Google Scholar]
- 7.Junker A et al. Extensive subpial cortical demyelination is specific to multiple sclerosis. Brain Pathol. (2020). 10.1111/bpa.12813 [DOI] [PMC free article] [PubMed] [Google Scholar]
- 8.Back SA, Gan X, Li Y, Rosenberg PA & Volpe JJ Maturation-dependent vulnerability of oligodendrocytes to oxidative stress-induced death caused by glutathione depletion. J. Neurosci 18, 6241–6253 (1998). [DOI] [PMC free article] [PubMed] [Google Scholar]
- 9.Ryu JK et al. Fibrin-targeting immunotherapy protects against neuroinflammation and neurodegeneration. Nat. Immunol 19, 1212–1223 (2018). [DOI] [PMC free article] [PubMed] [Google Scholar]
- 10.Merlini M et al. Fibrinogen induces microglia-mediated spine elimination and cognitive impairment in Alzheimer’s Disease. Neuron 101, 1099–1108 (2019). [DOI] [PMC free article] [PubMed] [Google Scholar]
- 11.Weiner HL A shift from adaptive to innate immunity: a potential mechanism of disease progression in multiple sclerosis. J Neurol. 255 Suppl 1, 3–11 (2008). [DOI] [PubMed] [Google Scholar]
- 12.Lassmann H, van Horssen J & Mahad D Progressive multiple sclerosis: pathology and pathogenesis. Nat. Rev. Neurol 8, 647–656 (2012). [DOI] [PubMed] [Google Scholar]
- 13.Mahad DH, Trapp BD & Lassmann H Pathological mechanisms in progressive multiple sclerosis. Lancet Neurol. 14, 183–193 (2015). [DOI] [PubMed] [Google Scholar]
- 14.Keren-Shaul H et al. A Unique Microglia Type Associated with Restricting Development of Alzheimer’s Disease. Cell 169, 1276–1290 e1217 (2017). [DOI] [PubMed] [Google Scholar]
- 15.Hammond TR et al. Single-Cell RNA Sequencing of Microglia throughout the Mouse Lifespan and in the Injured Brain Reveals Complex Cell-State Changes. Immunity 50, 253–271 e256 (2019). [DOI] [PMC free article] [PubMed] [Google Scholar]
- 16.Schirmer L et al. Neuronal vulnerability and multilineage diversity in multiple sclerosis. Nature 573, 75–82 (2019). [DOI] [PMC free article] [PubMed] [Google Scholar]
- 17.Mathys H et al. Single-cell transcriptomic analysis of Alzheimer’s disease. Nature 570, 332–337 (2019). [DOI] [PMC free article] [PubMed] [Google Scholar]
- 18.Gosselin D et al. An environment-dependent transcriptional network specifies human microglia identity. Science 356, eaal3222 (2017). [DOI] [PMC free article] [PubMed] [Google Scholar]
- 19.Krasemann S et al. The TREM2-APOE Pathway Drives the Transcriptional Phenotype of Dysfunctional Microglia in Neurodegenerative Diseases. Immunity 47, 566–581.e569 (2017). [DOI] [PMC free article] [PubMed] [Google Scholar]
- 20.Jordão MJC et al. Single-cell profiling identifies myeloid cell subsets with distinct fates during neuroinflammation. Science 363, eaat7554 (2019). [DOI] [PubMed] [Google Scholar]
- 21.Van Hove H et al. A single-cell atlas of mouse brain macrophages reveals unique transcriptional identities shaped by ontogeny and tissue environment. Nat. Neurosci 22, 1021–1035 (2019). [DOI] [PubMed] [Google Scholar]
- 22.Diehn M et al. Association of reactive oxygen species levels and radioresistance in cancer stem cells. Nature 458, 780–783 (2009). [DOI] [PMC free article] [PubMed] [Google Scholar]
- 23.Butler A, Hoffman P, Smibert P, Papalexi E & Satija R Integrating single-cell transcriptomic data across different conditions, technologies, and species. Nat. Biotechnol 36, 411–420 (2018). [DOI] [PMC free article] [PubMed] [Google Scholar]
- 24.Li Q et al. Developmental Heterogeneity of Microglia and Brain Myeloid Cells Revealed by Deep Single-Cell RNA Sequencing. Neuron 101, 207–223 e210 (2019). [DOI] [PMC free article] [PubMed] [Google Scholar]
- 25.Ajami B et al. Single-cell mass cytometry reveals distinct populations of brain myeloid cells in mouse neuroinflammation and neurodegeneration models. Nat. Neurosci 21, 541–551 (2018). [DOI] [PMC free article] [PubMed] [Google Scholar]
- 26.Mrdjen D et al. High-Dimensional Single-Cell Mapping of Central Nervous System Immune Cells Reveals Distinct Myeloid Subsets in Health, Aging, and Disease. Immunity 48, 380–395.e386 (2018). [DOI] [PubMed] [Google Scholar]
- 27.Geirsdottir L et al. Cross-Species Single-Cell Analysis Reveals Divergence of the Primate Microglia Program. Cell 179, 1609–1622 e1616 (2019). [DOI] [PubMed] [Google Scholar]
- 28.Choi BY et al. Inhibition of NADPH oxidase activation reduces EAE-induced white matter damage in mice. J. Neuroinflammation 12, 104 (2015). [DOI] [PMC free article] [PubMed] [Google Scholar]
- 29.Davalos D et al. Early detection of thrombin activity in neuroinflammatory disease. Ann. Neurol 75, 303–308 (2014). [DOI] [PMC free article] [PubMed] [Google Scholar]
- 30.Davalos D et al. Fibrinogen-induced perivascular microglial clustering is required for the development of axonal damage in neuroinflammation. Nat. Commun 3, 1227 (2012). [DOI] [PMC free article] [PubMed] [Google Scholar]
- 31.Petersen MA, Ryu JK & Akassoglou K Fibrinogen in neurological diseases: mechanisms, imaging and therapeutics. Nat. Rev. Neurosci 19, 283–301 (2018). [DOI] [PMC free article] [PubMed] [Google Scholar]
- 32.Drozdz R et al. gamma-Glutamyltransferase dependent generation of reactive oxygen species from a glutathione/transferrin system. Free Radic. Biol. Med 25, 786–792 (1998). [DOI] [PubMed] [Google Scholar]
- 33.Shannon P et al. Cytoscape: a software environment for integrated models of biomolecular interaction networks. Genome Res. 13, 2498–2504 (2003). [DOI] [PMC free article] [PubMed] [Google Scholar]
- 34.Kutmon M et al. PathVisio 3: an extendable pathway analysis toolbox. PLoS Comput. Biol 11, e1004085 (2015). [DOI] [PMC free article] [PubMed] [Google Scholar]
- 35.Corti A, Franzini M, Paolicchi A & Pompella A Gamma-glutamyltransferase of cancer cells at the crossroads of tumor progression, drug resistance and drug targeting. Anticancer Res. 30, 1169–1181 (2010). [PubMed] [Google Scholar]
- 36.Koga M et al. Glutathione is a physiologic reservoir of neuronal glutamate. Biochem. Biophys. Res. Commun 409, 596–602 (2011). [DOI] [PMC free article] [PubMed] [Google Scholar]
- 37.Jiang X et al. Quantitative real-time imaging of glutathione. Nat. Commun 8, 16087 (2017). [DOI] [PMC free article] [PubMed] [Google Scholar]
- 38.Tsuji T, Yamada K & Kunieda T Characterization of the dwg mutations: dwg and dwg(Bayer) are new mutant alleles of the Ggt1 gene. Mamm. Genome 20, 711–719 (2009). [DOI] [PubMed] [Google Scholar]
- 39.Shu Y et al. Association of serum gamma-glutamyltransferase and C-reactive proteins with neuromyelitis optica and multiple sclerosis. Mult. Scler. Relat. Disord 18, 65–70 (2017). [DOI] [PubMed] [Google Scholar]
- 40.Fischer MT et al. Disease-specific molecular events in cortical multiple sclerosis lesions. Brain 136, 1799–1815 (2013). [DOI] [PMC free article] [PubMed] [Google Scholar]
- 41.Iturria-Medina Y et al. Early role of vascular dysregulation on late-onset Alzheimer’s disease based on multifactorial data-driven analysis. Nat. Commun 7, 11934 (2016). [DOI] [PMC free article] [PubMed] [Google Scholar]
- 42.Kunutsor SK & Laukkanen JA Gamma glutamyltransferase and risk of future dementia in middle-aged to older Finnish men: A new prospective cohort study. Alzheimers Dement. 12, 931–941 (2016). [DOI] [PubMed] [Google Scholar]
- 43.Mayo L et al. Regulation of astrocyte activation by glycolipids drives chronic CNS inflammation. Nat. Med 20, 1147–1156 (2014). [DOI] [PMC free article] [PubMed] [Google Scholar]
- 44.Herrera AJ, Castano A, Venero JL, Cano J & Machado A The single intranigral injection of LPS as a new model for studying the selective effects of inflammatory reactions on dopaminergic system. Neurobiol. Dis 7, 429–447 (2000). [DOI] [PubMed] [Google Scholar]
- 45.International Multiple Sclerosis Consortium. Multiple sclerosis genomic map implicates peripheral immune cells and microglia in susceptibility. Science 365, eaav7188 (2019). [DOI] [PMC free article] [PubMed] [Google Scholar]
- 46.Magliozzi R et al. Iron homeostasis, complement, and coagulation cascade as CSF signature of cortical lesions in early multiple sclerosis. Ann. Clin. Transl. Neurol 6, 2150–2163 (2019). [DOI] [PMC free article] [PubMed] [Google Scholar]
- 47.Yates RL et al. Fibrin(ogen) and neurodegeneration in the progressive multiple sclerosis cortex. Ann. Neurol 82, 259–270 (2017). [DOI] [PubMed] [Google Scholar]
- 48.Han MH et al. Proteomic analysis of active multiple sclerosis lesions reveals therapeutic targets. Nature 451, 1076–1081 (2008). [DOI] [PubMed] [Google Scholar]
- 49.Ravuri C, Svineng G, Pankiv S & Huseby NE Endogenous production of reactive oxygen species by the NADPH oxidase complexes is a determinant of gamma-glutamyltransferase expression. Free Radic. Res 45, 600–610 (2011). [DOI] [PubMed] [Google Scholar]
- 50.Iadecola C The pathobiology of vascular dementia. Neuron 80, 844–866 (2013). [DOI] [PMC free article] [PubMed] [Google Scholar]
- 51.Rodriguez-Rodriguez A, Egea-Guerrero JJ, Murillo-Cabezas F & Carrillo-Vico A Oxidative stress in traumatic brain injury. Curr. Med. Chem 21, 1201–1211 (2014). [DOI] [PubMed] [Google Scholar]
- 52.Davalos D & Akassoglou K Fibrinogen as a key regulator of inflammation in disease. Semin. Immunopathol 34, 43–62 (2012). [DOI] [PubMed] [Google Scholar]
- 53.Yamamoto S et al. Preventive effect of GGsTop, a novel and selective gamma-glutamyl transpeptidase inhibitor, on ischemia/reperfusion-induced renal injury in rats. J. Pharmacol. Exp. Ther 339, 945–951 (2011). [DOI] [PubMed] [Google Scholar]
- 54.Birkner K et al. beta1-Integrin- and KV1.3 channel-dependent signaling stimulates glutamate release from Th17 cells. J. Clin. Invest 103: 715–732 (2020). [DOI] [PMC free article] [PubMed] [Google Scholar]
- 55.Sedlak TW et al. The glutathione cycle shapes synaptic glutamate activity. Proc. Natl. Acad. Sci. U S A 116, 2701–2706 (2019). [DOI] [PMC free article] [PubMed] [Google Scholar]
- 56.Schieber M & Chandel NS ROS function in redox signaling and oxidative stress. Curr. Biol 24, R453–462 (2014). [DOI] [PMC free article] [PubMed] [Google Scholar]
- 57.Saederup N et al. Selective chemokine receptor usage by central nervous system myeloid cells in CCR2-red fluorescent protein knock-in mice. PLoS One 5, e13693 (2010). [DOI] [PMC free article] [PubMed] [Google Scholar]
- 58.Jung S et al. Analysis of fractalkine receptor CX(3)CR1 function by targeted deletion and green fluorescent protein reporter gene insertion. Mol. Cell Biol 20, 4106–4114 (2000). [DOI] [PMC free article] [PubMed] [Google Scholar]
- 59.Aronesty E ea-utils : “Command-line tools for processing biological sequencing data”. (2011). [Google Scholar]
- 60.Huang da W, Sherman BT & Lempicki RA Systematic and integrative analysis of large gene lists using DAVID bioinformatics resources. Nat. Protoc 4, 44–57 (2009). [DOI] [PubMed] [Google Scholar]
- 61.Robinson MD, McCarthy DJ & Smyth GK edgeR: a Bioconductor package for differential expression analysis of digital gene expression data. Bioinformatics 26, 139–140 (2010). [DOI] [PMC free article] [PubMed] [Google Scholar]
- 62.Robinson MD & Oshlack A A scaling normalization method for differential expression analysis of RNA-seq data. Genome Biol. 11, R25 (2010). [DOI] [PMC free article] [PubMed] [Google Scholar]
- 63.Zambon AC et al. GO-Elite: a flexible solution for pathway and ontology over-representation. Bioinformatics 28, 2209–2210 (2012). [DOI] [PMC free article] [PubMed] [Google Scholar]
- 64.Van der Laan MJ & Pollard KS A new algorithm for hybrid clustering of gene expression data with visualization and the bootstrap. J. Stat. Plan. Interference 117, 275–303 (2003). [Google Scholar]
- 65.Zuberi K et al. GeneMANIA prediction server 2013 update. Nucleic Acids Res. 41, W115–122 (2013). [DOI] [PMC free article] [PubMed] [Google Scholar]
- 66.Kutmon M et al. WikiPathways: capturing the full diversity of pathway knowledge. Nucleic Acids Res. 44, D488–494 (2016). [DOI] [PMC free article] [PubMed] [Google Scholar]
- 67.Butovsky O et al. Identification of a unique TGF-beta-dependent molecular and functional signature in microglia. Nat. Neurosci 17, 131–143 (2014). [DOI] [PMC free article] [PubMed] [Google Scholar]
- 68.Ryu JK et al. Blood coagulation protein fibrinogen promotes autoimmunity and demyelination via chemokine release and antigen presentation. Nat. Commun 6, 8164 (2015). [DOI] [PMC free article] [PubMed] [Google Scholar]
- 69.Adams RA et al. The fibrin-derived gamma377–395 peptide inhibits microglia activation and suppresses relapsing paralysis in central nervous system autoimmune disease. J. Exp. Med 204, 571–582 (2007). [DOI] [PMC free article] [PubMed] [Google Scholar]
- 70.Akassoglou K et al. Oligodendrocyte apoptosis and primary demyelination induced by local TNF/p55TNF receptor signaling in the central nervous system of transgenic mice: models for multiple sclerosis with primary oligodendrogliopathy. Am. J. Pathol 153, 801–813 (1998). [DOI] [PMC free article] [PubMed] [Google Scholar]
- 71.Akassoglou K et al. Fibrin depletion decreases inflammation and delays the onset of demyelination in a tumor necrosis factor transgenic mouse model for multiple sclerosis. Proc. Natl. Acad. Sci. U S A 101, 6698–6703 (2004). [DOI] [PMC free article] [PubMed] [Google Scholar]
Associated Data
This section collects any data citations, data availability statements, or supplementary materials included in this article.
Supplementary Materials
Data Availability Statement
The scRNA-seq and bulk RNA-seq data files are available in the Gene Expression Omnibus database under SuperSeries accession code GSE146295. Oxidative stress pathway model is available at WikiPathways: https://www.wikipathways.org/instance/WP4466. All data generated and analyzed in this study are available within the paper. Any additional data can be made available from the corresponding author upon reasonable request.


