Abstract
Significance.
To achieve maximum visual benefit, wavefront-guided scleral lens corrections (WGCs) are aligned with the underlying wavefront error of each individual eye. This requirement adds complexity to the fitting process. With a view towards simplification in lens fitting, this study quantified the consequences of placing WGCs at two pre-defined locations.
Purpose.
To quantify performance reduction accompanying placement of the WGC at two locations 1: the average decentered location (ADL - average decentration observed across individuals wearing scleral lenses) and 2: the geometric center (GC) of the lens.
Methods.
De-identified residual aberration and lens translation data from 36 conventional scleral lens wearing eyes with corneal ectasia were used to simulate WGC correction in silico. The WGCs were decentered from the eye-specific pupil position to both the ADL and GC locations. The impact of these misalignments was assessed in terms of change (from the aligned, eye-specific pupil position) in higher order root mean square (HORMS) wavefront error, change in log of the visual strehl ratio (logVSX) and predicted change in logMAR visual acuity (VA).
Results.
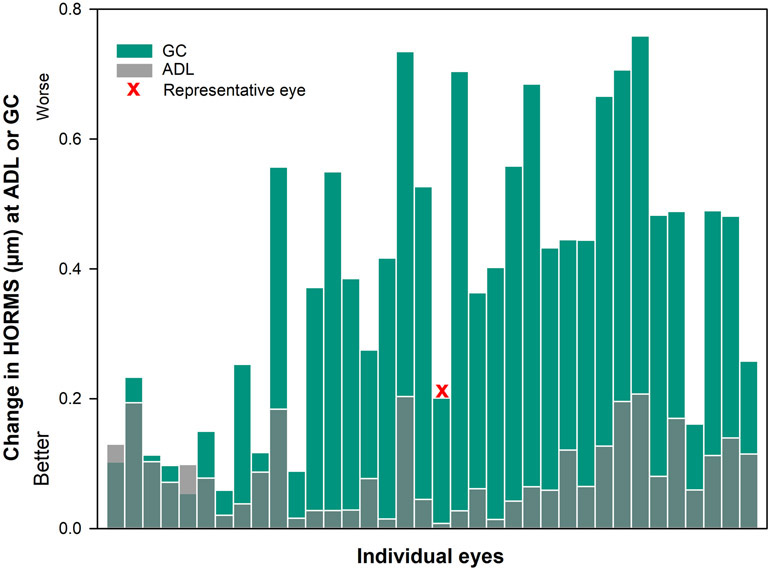
As expected, HORMS increased, logVSX decreased and predicted VA was poorer at both ADL and GC compared to the aligned condition (P < .001). Thirty four of 36 eyes had greater residual HORMS and 33 of 36 eyes had worse logVSX values at the GC than at the ADL. In clinical terms, 19 of 36 eyes at the ADL and 35 of 36 eyes at the GC had a predicted loss in VA of 3 letters or greater.
Conclusions.
The placement of the WGC at either ADL or GC is predicted to lead to a noticeable reduction in VA for over half of the eyes studied, suggesting the simplification of the fitting process is not worth the cost in performance.
Wavefront-guided scleral lenses are designed to reduce the elevated residual aberrations that continue to exist during conventional scleral lens wear in patients with corneal ectasia,1-6 and have been shown to provide superior visual acuity, contrast sensitivity1,2 and visual image quality3 when compared to conventional scleral lenses. Unlike the design of spherical or sphero-cylindrical scleral lenses, the design of wavefront-guided scleral lenses requires information regarding the residual lower and higher-order aberrations measured through a well-fitted conventional scleral lens, as well as information concerning the on-eye decentration of the lens with respect to the eye’s pupil.1-3 These latter data are necessary due to the fact that for the wavefront-guided correction to perform ideally, the wavefront-guided correction must be registered with the underlying wavefront error. Since scleral lenses typically settle inferior and temporal with respect to the pupil center,3,7-12 the wavefront-guided correction is typically displaced superiorly and nasally from the geometric center of the lens to align with the pupil. However, this requirement to individually position the wavefront-guided optics in an eye -specific manner adds another level of personalization and complexity to the wavefront-guided fitting process. And since quantification of these misalignment data are not a part of common clinical practice, their measurement forms yet another technical and intellectual barrier to the delivery of wavefront-guided corrections.
There is a history of conceding that the absolute highest theoretical level of optical and visual performance is not achievable with a wavefront-guided scleral lens, given the real-world clinical constraints associated with alignment uncertainties. Previous studies13-14 have attempted to partially correct higher-order Zernike aberration terms to optimize wavefront-guided corrections in the presence of registration uncertainty. A portion of this prior work was built on the observation that scleral lenses naturally move (to some degree) on the eye, and ideal performance at all times is simply not possible.14 Therefore, the goal was to optimize performance in the presence of observed translations and rotations, knowing that some decrease in performance from the ideally aligned condition would be observed at all misaligned locations.
In the current study, another compromise is examined: that is, if placement of the wavefront-guided correction was not considered on an individual basis, but was applied in a consistent manner to all individuals in a population. The question being asked here was not whether this misalignment would lead to a reduction in performance (it will),15-17 but instead whether the loss would be acceptable in terms of high contrast visual acuity, given the simplification that the potential use of these locations would afford the clinician attempting to fit the wavefront-guided correction. The two locations studied here were:
The average decentered location defined as the mean horizontal and vertical translation of the conventional scleral lenses.
The geometric center of each scleral lens.
These two locations were studied relative to the eye-specific pupil center.
This study highlights the challenges associated with wavefront-guided corrections. It clearly demonstrates that these corrections are highly individual in nature and emphasizes that the success of wavefront-guided corrections finds its foundation in the myriad details being correct (in this case, alignment of the correction with respect to the measured wavefront error).
METHODS
Aberration Data
De-identified data representing 21 individuals (mean age: 40.3 ± 10.2 years) diagnosed with corneal ectasia were obtained from a prior study3 on the performance of wavefront-guided scleral lenses. These data include the residual, uncorrected 2nd-10th order Zernike aberrations measured during conventional scleral lens wear, as well as decentration data. Zernike coefficients with odd symmetry along the vertical axis in left eyes were multiplied by −1.00, such that all eyes studied represented “right eyes”.18
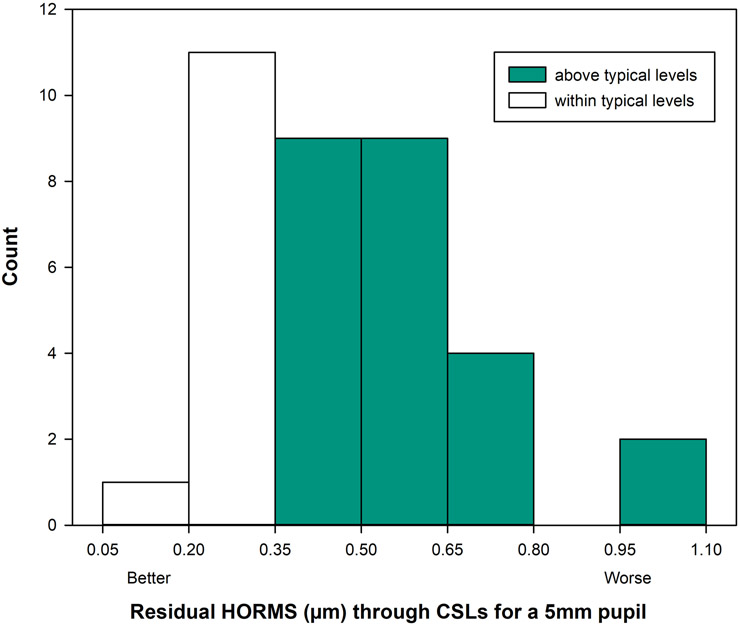
The dilated residual aberrations through conventional scleral lenses were rescaled to a 5mm pupil diameter19 and the higher-order root mean square wavefront error through the 6th radial order was calculated20 for 36 eyes (18 individuals) with corneal ectasia as shown in Figure 1. Three of the original 21 eyes were excluded, and this exclusion is described in detail below. . Conventional scleral lenses provide a new smooth refractive surface over the irregular cornea and allows approximate matching of the refractive index of the cornea with that of the tears, which reduces the aberrations of the ectatic eyes. This masking of aberrations moves some eyes into the normal range of total higher-order aberrations.3,21 Twelve of the 36 eyes (white bars in Figure 1) studied here were within mean ± 2 standard deviation of higher-order root mean square wavefront error for typical eyes for a 5mm pupil diameter (less than 0.342μm)22. That said, aberrations are known to interact visually, and these interactions alter visual image quality.23,24,25 Visual image quality measured in terms of log of the visual Strehl ratio was reduced in 31 out of 36 eyes compared to the normative population (mean ± 2SD, −0.493 ± 0.304)26 for a 5mm pupil diameter.
Figure 1.
Residual higher-order root mean square wavefront error (HORMS) (μm) over a 5mm pupil through the 6th radial order observed in 36 eyes with corneal ectasia, measured through best conventional scleral lenses (CSLs). The white bars represent eyes within the mean ± 2 SD of typical for 5mm pupil diameter and green bars represents eyes above the mean ± 2 SD levels for HORMS. Residual aberrations were elevated in 67% of the eyes compared to normative levels; mean ± 2 SD of typical individuals being less than 0.342μm).22
Scleral Lens and Pupil Decentration Data
The amount of decentration for each conventional scleral lens was defined as the Cartesian (x, y) distances of the pupil center relative to the geometric center of the lens (Figure 2). These decentration data were obtained by first recording a series of images of the conventional scleral lens on the eye. As with aberration data, values for the x component of the decentration in left eyes were multiplied by −1.00 to represent right eyes. The average decentered location (mm) across all eyes in the horizontal and vertical meridians was calculated as x: 0.53 (temporal) and y: 0.56 (inferior), which are traditionally compensated by a nasal and superior shift of the wavefront guided correction relative to the geometric lens center when designing the wavefront-guided lens. For modeling purposes, it is assumed that the optical axis of all measurement instruments were aligned to the line of sight (the line connecting the fixation point and the center of the eye’s entrance pupil) with the patient fixation target being co-axial with the instrument axis and located slightly beyond optical infinity, and that the eyes optical aberrations and optical correction existed in the same plane. The vector length was defined as the square root of the sum of the squares of the horizontal and vertical lens decentration from the eye-specific pupil center.
Figure 2.
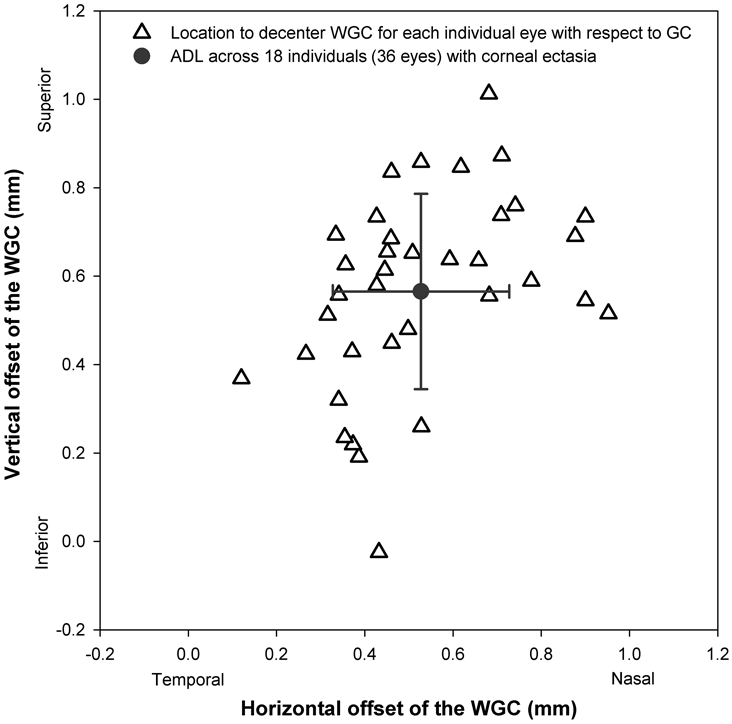
The magnitude of translation required to offset the wavefront-guided correction (WGC) from the geometric center (GC) (0, 0) to the pupil center (from the origin to each open triangle) and to the average decentered location (ADL) (from each triangle to the gray solid circle) across 36 eyes of individuals with corneal ectasia. These data illustrate the clinical observation that a typical WGC is shifted superior-nasal from the geometric center to compensate for inferio-temporal displacement of the conventional scleral lens.
Simulation of Wavefront-guided Correction and Quantification of Change in Optical and Visual Performance at the Two Common Locations
All measured residual aberration data included in this study were defined over a pupil diameter greater than 6.5 mm. Consequently the data of 3 individuals were excluded from the current study due to the fact that their dilated pupil diameter was less than 6.5 mm and thus, would not satisfy the condition that the translated wavefront-guided correction needed to overlap the final pupil diameter of interest (5mm) entirely. Wavefront-guided lenses incorporating the wavefront-guided corrections at the average decentered location and geometric center were not physically constructed. Rather, the corrections were computationally simulated, starting with the multiplication of all residual aberration coefficients measured during conventional scleral lens wear by −1.00, resulting in an ideal wavefront-guided correction for each individual eye through the 10th radial order. The correction that was applied during simulation to the residual aberration measured on the eye only included 2nd to 5th radial order terms (setting 6th to 10th radial order terms of the correction to zero). The decision on which orders to include in the correction was based on a desire to mirror the implementation of actual corrections in prior work.2,3 The portion of the wavefront-guided correction following translation from the eye-specific pupil position (pupil center) to the position of interest (either the average decentered location or the geometric center of the lens) was calculated. The previously published MATLAB (Math works, Inc. USA), methods described by Dr. George Dai19 were reproduced by the investigators and employed for all misalignments and resizing of aberrations. Prior to use in this study, the MATLAB implementation was validated through replication of results presented by Dai.19 Aberrations through the 10th Zernike radial orders at the pupil center, average decentered location, and geometric center were resized to the pupil diameter of 5mm. The wavefront error defining the correction over the eye-specific pupil position (pupil center), average decentered location, or the geometric center were added to the residual aberrations measured through the best conventional scleral lens to simulate optical performance of the wavefront-guided scleral lens at each of the three locations.
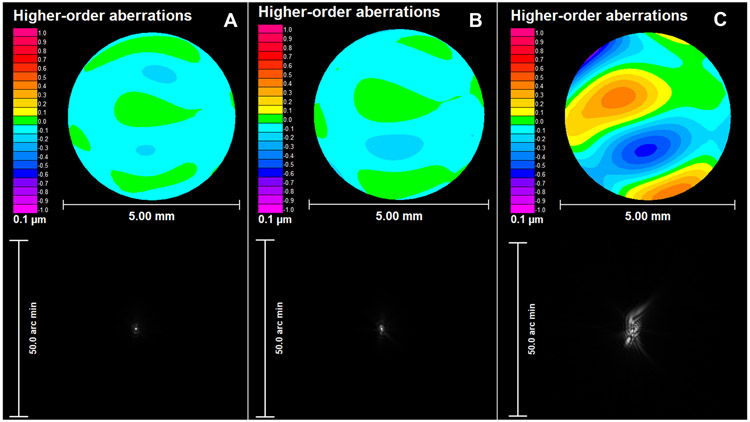
The change in vertical and horizontal coma was calculated at the average decentered locations and geometric center from pupil center from the simulated residual aberrations through wavefront-guided scleral lens. The change in higher-order root mean square wavefront error was also calculated for average decentered location and geometric center from the pupil center. The eye with vector length closest to the median measured from the eye-specific pupil center to the geometric center is shown in Figure 3.While the increase in higher-order root mean square wavefront-error was anticipated, it cannot unambiguously be used to assess the potential visual impact associated with placing the wavefront-guided correction at the average decentered location or geometric center because it does not consider the interactions of aberrations24-26 and their impact on visual performance.27 In order to better quantify the visual consequence of placing the wavefront-guided correction at the eye-specific pupil location, average decentered location or the geometric center, logVSX20 was calculated from residual 2nd −10th order aberrations. For reference, a logVSX value of 0 represents the best possible visual image quality. As the value decreases (becomes more negative), logVSX represents a worsening level of visual image quality.
Figure 3.
An example representing residual higher-order root mean square (HORMS) wavefront error and point spread function from the A) eye-specific pupil center (HORMS: 0.04 μm), B) average decentered location (ADL: vector length: 0.14 mm and HORMS: 0.05 μm) and C) geometric center (GC: vector length: 0.82 mm and HORMS: 0.24 μm) for one individual eye.
Predicting Change in logMAR Visual Acuity from the Change in log of the Visual Strehl Ratio (logVSX)
The change in logVSX at the average decentered location and the geometric center of each lens with respect to the eye-specific pupil center were calculated. The changes in logVSX were, in turn, used to predict change in logMAR visual acuity using the following equation:
| (1) |
This equation is an evolved version of a previous published equation28 defining change in logMAR visual acuity as a function of change in logVSX, which is defined such that even when there was no change in logVSX, there is a predicted change in logMAR visual acuity of 1.5 letters.28 To address this, the data from the previous study were refit, and the modified equation (Eq. 1) was used here.
Statistical Analyses
Mann-Whitney rank sum test was used to compare the vector length between average decentered location and geometric center. Repeated measures analysis of variance on ranks with post-hoc Tukey test was used for comparison between average decentered and geometric center locations, as compared to the pupil center. Correlation analysis was used to determine the relationship between vector length and predicted change in acuity at both average decentered location and geometric center.
RESULTS
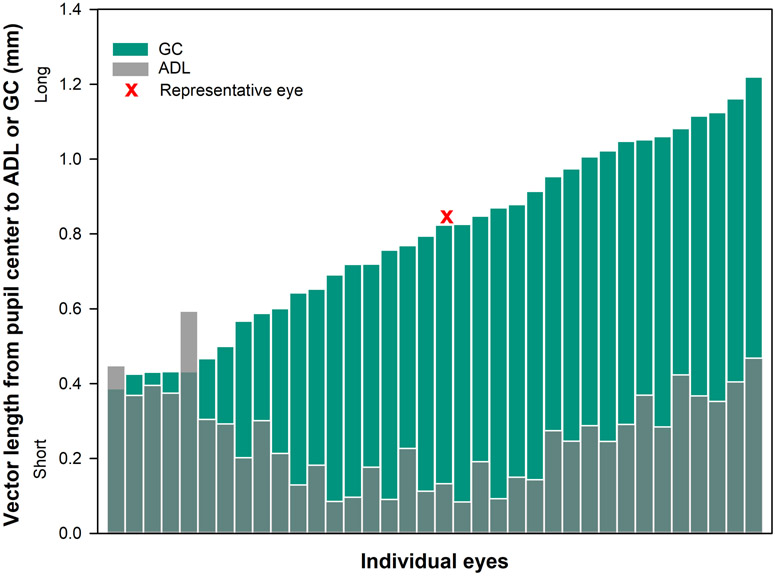
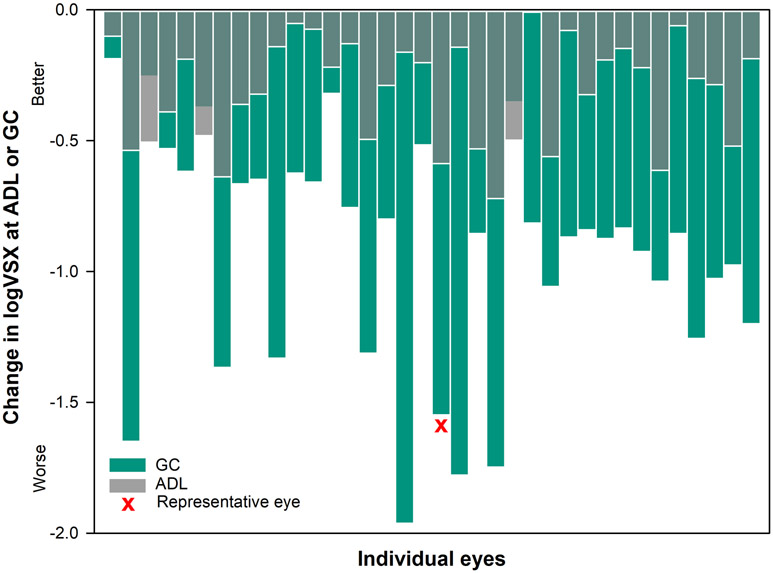
Figure 3 reports an example of 3rd-10th order higher-order aberrations over a 5mm pupil for a representative eye (vector length is closest to the median) when the correction is a) well-centered at eye-specific pupil center, b) decentered to the average decentered location and c) decentered to the geometric center. In Figures 4-7 below, gray transparent bars represent changes observed when the correction is applied at the average decentered location and green bars represent changes observed when the correction is applied at the geometric center. Figures 4-7 contain a red ‘x’, denoting the eye represented in Figure 3. For each graph, the change from the eye-specific pupil center to the average decentered location or the geometric center for the same eye is plotted together for comparison. The order of eyes presented in Figures 5-7 is consistent with the ordering of eyes used in Figure 4.
Figure 4.
Vector length (mm) from eye-specific pupil center to average decentered location (gray transparent bars) and geometric center (green bars) for each individual eye. The location of the geometric center was further than the average decentered location for 34 out of 36 eyes.
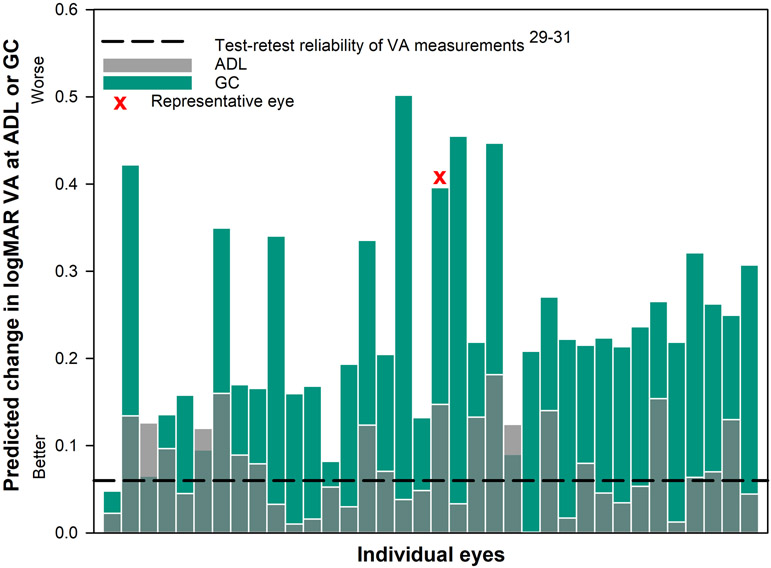
Figure 7.
The predicted loss in logMAR visual acuity28 for each individual eye with corneal ectasia when the wavefront-guided correction was located at the average decentered location (ADL: gray transparent bars) and the geometric center (GC: green bars) of each scleral lens. The dashed black line represents the threshold change of 0.06 logMAR or 3 letters based on test-retest reliability of acuity measurements.29-31 Nineteen out of 36 eyes at the ADL and 35 out of 36 eyes at the GC had a predicted loss in visual acuity of more than three letters (0.06 logMAR).
Figure 5.
The change in higher-order root mean square wavefront error HORMS (μm) over a 5mm pupil from eye-specific pupil center to average decentered location (gray transparent bars) and geometric center (green bars) for each individual eye. The change in HORMS (μm) was greater at the geometric center than at the average decentered location for 34 out of 36 eyes.
Vector Length from the Pupil to the Average Decentered Location and the Geometric Center
The average ± standard deviation vector length (mm) to translate from the eye-specific pupil center to the average decentered location was 0.27 ± 0.13 (first quartile (1Q): 0.15, median (M): 0.27, third quartile (3Q): 0.37) and to the geometric center was 0.79 ± 0. 24 (first quartile (1Q): 0.60, median (M): 0.81, third quartile (3Q): 1.02). Thirty four out of 36 eyes (Figure 4) at the average decentered location had shorter vector length compared to the geometric center (P < .001).
Change in Coma and Higher-order Root Mean Square Wavefront Error
The average ± standard deviation change in vertical coma (μm) at the average decentered location was 0.026 ± 0.070 (first quartile (1Q): −0.018, median (M): 0.020, third quartile (3Q): 0.059). At the geometric center, the values were 0.202 ± 0.231 (first quartile (1Q):0.035, median (M): 0.194, third quartile (3Q): 0.393) at the geometric center. The average ± standard deviation change in horizontal coma (μm) at average decentered location was −0.012 ± 0.056 (first quartile (1Q):−0.035, median (M): −0.005, third quartile (3Q): 0.018) and 0.033 ± 0.158 (first quartile (1Q): −0.067, median (M):0.016, third quartile (3Q): 0.123) at the geometric center. The average ± standard deviation change in higher-order root mean square wavefront error (μm) when the wavefront-compensating optics were moved to the average decentered location was 0.09 ± 0.06 (first quartile (1Q): 0.04, median (M): 0.08, third quartile (3Q): 0.13) and the average ± standard deviation change in higher-order root mean square wavefront error (μm) when the wavefront-compensating optics were moved to the geometric center was 0.38 ± 0. 21 (first quartile (1Q): 0.18, median (M): (0.41, third quartile (3Q): 0.54). Thirty four out of 36 eyes (Figures 4 and 5) at the geometric center had greater change in higher-order root mean square wavefront error compared to the average decentered location. As expected, there was a statistically significant difference in higher-order root mean square wavefront error when the wavefront-guided correction was misaligned to the either average decentered location or the geometric center of the lens rather than to the eye-specific pupil position (both P < .001).
Change in log of the Visual Strehl Ratio (logVSX)
Average ± standard deviation change in logVSX observed at the average decentered location was −0.31 ± 0.20 (first quartile (1Q): −0.50, median (M): −0.27, third quartile (3Q): −0.14) and the average ± standard deviation change in logVSX for geometric center was −0.92 ± 0. 45 (first quartile (1Q): −1.23, median (M): −0.86, third quartile (3Q): −0.64). Thirty three out of 36 eyes (figure 6) had greater change in logVSX at the geometric center compared to the average decentered location .There was a statistically significant difference in the change in logVSX when the wavefront-guided correction was misaligned to either average decentered location or the geometric center of the lens, rather than to the eye-specific pupil position (pupil center) (both P < .001).
Figure 6.
The change in logVSX over a 5mm pupil from eye-specific pupil center to average decentered location (gray transparent bars) and geometric center (green bars) for each individual eye. The change in logVSX was smaller at the average decentered location than the geometric center for 33 out of 36 eyes.
Calculating Predicted Change in logMAR Visual Acuity Based on Change in logVSX
The average ± standard deviation change in predicted logMAR visual acuity at the average decentered location was 0.08 ± 0.05 (first quartile (1Q): 0.04, median (M): 0.07, third quartile (3Q): 0.13) and the average ± standard deviation change in logMAR visual acuity for geometric center was 0.24 ± 0.11 (first quartile (1Q): 0.16, median (M): 0.22, third quartile (3Q): 0.31).All measurements are made relative to the eye-specific pupil center. Thirty three out of 36 eyes (Figure 7) had greater predicted change in logMAR visual acuity at the geometric center compared to the average decentered location. There was a statistically significant difference in change in logMAR visual acuity when the wavefront-guided correction was misaligned to either average decentered location or the geometric center of the lens rather than to the eye-specific pupil center (both P < .001). From a clinical perspective, 19 out of 36 eyes at the average decentered location and 35 out of 36 eyes at the geometric center of the lens had a loss in predicted logMAR visual acuity by more than 3 letters, which is a reported level of test-retest reliability of visual acuity measurements.29-31
DISCUSSION
The goal of this study was not to quantify whether placing a wavefront-guided correction at two non-pupil centered locations (the average decentered location and the geometric center of each lens) would lead to a loss in optical and visual performance, it was known that such offsets would lead to such losses.13,14,15 Instead, the goal was to test the viability of a common, rather than individualized, decentration rule across eyes. The results suggest that the change in higher-order root mean square wavefront error, visual image quality, and predicted change in logMAR visual acuity were significant at both locations when compared to the eye-specific pupil center. Importantly, the average change in logMAR visual acuity anticipated at either location exceeded the test-retest reliability for high contrast logMAR visual acuity of 3 letters for more than half of eyes studied.29-31
In this study, the actual translation and underlying residual aberrations through conventional scleral lenses were used, and the eyes with the greatest level of decentration do not necessarily have the greatest change in higher-order root mean square, logVSX or predicted change in visual acuity. The correlation (R2) between vector length and predicted change in acuity was 0.00 at the average decentered location and 0.07 at the geometric center, highlighting the fact that the interactions between individual terms,23,24,25 and not simply vector length, are important factors in understanding visual impact. This is expected, as the magnitudes and direction of translation in both horizontal and vertical meridians, as well as eye-specific levels of residual uncorrected aberration all play a complex, interconnecting role in the resultant impact on an individual’s performance. Shi et al.32 suggested that the translation and rotation of the lens induce asymmetrical optical tolerance to movement and induced errors are depended on the underlying wavefront error, the wavefront-guided correction design, and the amount of registration error. Shi et al.32 also reported that the registration tolerance to maintain good visual acuity is unique for each wavefront error and wavefront-guided correction design. These questions were not addressed on an individual level in the current work, rather the question that was addressed was more direct: can one of these two locations be used universally in this population? Considering the answer to this question on the basis of a group was necessary, if either location were to be adopted for use clinically on any and all individuals with ectatic corneas seeking wavefront-guided correction. The answer was that the use of either location left a significant portion of eyes with visual deficit from the eye-specific pupil center.
Given the fact that wavefront-guided lenses are so highly customized, such a compromise would only be accepted if the consequence of that compromise was small. We chose a strict criterion of logMAR visual acuity loss of 3 letters (0.06 logMAR) for identifying a meaningful change in visual acuity at the average decentered and geometric center locations. Use of either the average decentered location or the geometric center as a common location for placement of the correction led to a predicted change in visual acuity that, exceeded this 3 letter benchmark for over half of the eyes studied. This work was intended to provide insight to the clinical community that for custom wavefront-guided scleral corrections, the optics must be aligned to the underlying wavefront error measured over the pupil.
This study has several limitations. The results presented here are derived from simulation and do not consider the dynamic movement of the lens on-eye (small levels of dynamic lens translation and rotation) which may occur with blink. The effect of the tear film and tear break up time is also not considered in this simulation while calculating final residual aberrations through the wavefront-guided correction. Also, scleral lenses are a specialty device and wavefront-guided scleral lenses make up a small portion of the scleral lens management. However, scleral lenses are gaining popularity with their broader applications for other ocular surface conditions.7 Wavefront-guided scleral lens corrections are the unrivaled options for some highly-aberrated eyes and have helped with the recent resurgence of scleral lenses. 3,33 Conceptually demonstrative papers like this are necessary to increase the use and adoption of these technologies.
In conclusion, decentering the wavefront-guided correction to either the average decentered location or the geometric center leads to elevated residual higher-order aberrations and reduced visual image quality at levels that are predicted to reduce visual acuity on average by more than three letters in the majority of cases. This level of deficit is expected to be noticeable to the patient, suggesting the simplification that would be gained in the fitting process is not worth the cost in terms of visual and optical performance.
ACKNOWLEDGMENTS
Funding: NIH/NEI R01 EY019105 to JDM and RAA; NIH/NEI P30 EY07551
The authors would like to thank Dr. Ayeswarya Ravikumar for assistance with the predictive model. Dr. Larry Thibos and Hope Queener for the metrics calculation. Dr. Ed and Charlene Sarver of Sarver and Associates for use of Visual Optics Laboratory.
Contributor Information
Sujata Rijal, College of Optometry, University of Houston, Houston, Texas.
Gareth D. Hastings, College of Optometry, University of Houston, Houston, Texas; School of Optometry, University of California, Berkeley, Berkeley, California.
Lan Chi Nguyen, College of Optometry, University of Houston, Houston, Texas.
Matthew J. Kauffman, College of Optometry, University of Houston, Houston, Texas.
Raymond A. Applegate, College of Optometry, University of Houston, Houston, Texas.
Jason D. Marsack, College of Optometry, University of Houston, Houston, Texas.
REFERENCES
- 1.Sabesan R, Johns L, Tomashevskaya O, et al. Wavefront-Guided Scleral Lens Prosthetic Device for Keratoconus. Optom Vis Sci 2013;90:314–23. [DOI] [PMC free article] [PubMed] [Google Scholar]
- 2.Marsack JD, Ravikumar A, Nguyen C, et al. Wavefront-Guided Scleral Lens Correction in Keratoconus. Optom Vis Sci 2014;91:1221–30. [DOI] [PMC free article] [PubMed] [Google Scholar]
- 3.Hastings GD, Applegate RA, Nguyen LC, et al. Comparison of Wavefront-guided and Best Conventional Scleral Lenses after Habituation in Eyes with Corneal Ectasia. Optom Vis Sci 2019;96:238–47. [DOI] [PMC free article] [PubMed] [Google Scholar]
- 4.Schornack MM. Scleral lenses: a Literature Review. Eye Contact Lens 2015;41:3–11. [DOI] [PubMed] [Google Scholar]
- 5.Rathi VR, Mandathara PS, Taneja M, et al. Scleral Lens for Keratoconus: Technology Update. Clin Ophthalmol 2015;9:2013–18. [DOI] [PMC free article] [PubMed] [Google Scholar]
- 6.Jinabhai AN. Customised Aberration-controlling Corrections for Keratoconic Patients using Contact Lenses. Clin Exp Optom 2020;103:31–43. [DOI] [PubMed] [Google Scholar]
- 7.Visser E-S, Van Der Linden BJJJ, Otten HM, et al. Medical Applications and Outcomes of Bitangential Scleral Lenses. Optom Vis Sci 2013;90:1078–85. [DOI] [PubMed] [Google Scholar]
- 8.Ticak A, Marsack JD, Koenig DE, et al. A Comparison of Three Methods to Increase Scleral Contact Lens On-eye Stability. Eye Contact Lens. 2015;41:386–90. [DOI] [PMC free article] [PubMed] [Google Scholar]
- 9.Vincent SJ, Alonso-Caneiro D, Collins MJ. The Temporal Dynamics of Miniscleral Contact Lenses: Central Corneal Clearance and Centration. Contact Lens Anterior Eye 2018;41:162–68. [DOI] [PubMed] [Google Scholar]
- 10.Vincent SJ, Collins MJ. A Topographical Method to Quantify Scleral Contact Lens Decentration. Contact Lens Anterior Eye. 2019;42:462–6. [DOI] [PubMed] [Google Scholar]
- 11.Vincent SJ, Fadel D. Optical Considerations for Scleral Contact Lenses: A Review. Contact Lens Anterior Eye. 2019;42:598–13. [DOI] [PubMed] [Google Scholar]
- 12.Kowalski LP, Collins MJ, Vincent SJ. Scleral Lens Centration: The Influence of Centre Thickness, Scleral topography, and Apical Clearance. Contact Lens Anterior Eye 2019:December 20:e-pub ahead of print:doi 10.1016/j.clae.2019.11.013. [DOI] [PubMed] [Google Scholar]
- 13.Guirao A, Cox IG, Williams DR. Method for Optimizing the Correction of the Eye’s Higher-order Aberrations in the Presence of Decentrations. J Opt Soc Am (A) 2002;19:126–8. [DOI] [PubMed] [Google Scholar]
- 14.Shi Y, Queener HM, Marsack JD, et al. Optimizing Wavefront-guided Corrections for Highly Aberrated Eyes in the Presence of Registration Uncertainty. J Vis 2013;13:1–15. [DOI] [PMC free article] [PubMed] [Google Scholar]
- 15.Guirao A, Williams DR, Cox IG. Effect of Rotation and Translation on the Expected Benefit of an Ideal Method to Correct the Eye’s Higher-order Aberrations. J Opt Soc Am (A) 2001;18:1003–15. [DOI] [PubMed] [Google Scholar]
- 16.Brabander JD, Chateau N, Marin G, et al. Simulated Optical Performance of Custom Wavefront Soft Contact Lenses for Keratoconus. Optom Vis Sci 2003;80:637–43. [DOI] [PubMed] [Google Scholar]
- 17.Yoon G, Jeong TM. Effect of the Movement of Customized Contact Lens on Visual Benefit in Abnormal eyes. J Vis 2003;3:38. [Google Scholar]
- 18.Thibos LN, Applegate RA, Schwiegerling JT, Webb R. Standards for Reporting the Optical Aberrations of Eyes. J Refract Surg 2002;18:S652–60. [DOI] [PubMed] [Google Scholar]
- 19.Dai G Wavefront Optics for Vision Correction. Washington, DC: Society of Photo-Optical Instrumentation Engineers; 2008. [Google Scholar]
- 20.Thibos LN, Hong X, Bradley A, Applegate RA. Accuracy and Precision of Objective Refraction from Wavefront Aberrations. J Vis 2004;4:329–51. [DOI] [PubMed] [Google Scholar]
- 21.Gumus K, Gire A, Pflugfelder SC. The impact of the Boston Ocular Surface Prosthesis on Wavefront Higher-order Aberrations. Am J Ophthalmol 2011;151:682–90. [DOI] [PubMed] [Google Scholar]
- 22.Salmon TO, van de Pol C. Normal-eye Zernike Coefficients and Root-mean-square Wavefront Errors. J Cataract Refract Surg 2006;32:2064–74. [DOI] [PubMed] [Google Scholar]
- 23.Applegate RA, Sarver EJ, Khemsara V. Are all Aberrations Equal? J Refract Surg 2002;18:S556–62. [DOI] [PubMed] [Google Scholar]
- 24.Applegate RA, Marsack JD, Ramos R, Sarver EJ. Interaction between Aberrations to Improve or Reduce Visual Performance. J Cataract Refract Surg 2003;29:1487–95. [DOI] [PubMed] [Google Scholar]
- 25.McLellan JS, Prieto PM, Marcos S, Burns SA. Effects of Interactions among Wave Aberrations on Optical Image Quality. Vision Res 2006;46:3009–16. [DOI] [PMC free article] [PubMed] [Google Scholar]
- 26.Hastings GD, Marsack JD, Thibos LN, Applegate RA. Normative Best-corrected Values of the Visual Image Quality Metric VSX as a Function of Age and Pupil Size. J Opt Soc Am (A) 2018;35:732–9. [DOI] [PMC free article] [PubMed] [Google Scholar]
- 27.Marsack JD, Thibos LN, Applegate RA. Metrics of Optical Quality Derived from Wave Aberrations Predict Visual Performance. J Vis 2004;4:322–28. [DOI] [PubMed] [Google Scholar]
- 28.Ravikumar A, Marsack JD, Bedell HE, et al. Change in Visual Acuity is Well Correlated with Change in Image-quality Metrics for both Normal and Keratoconic Wavefront Errors. J Vis 2013;13:1–16. [DOI] [PMC free article] [PubMed] [Google Scholar]
- 29.Elliot DB, Yang KC, Whitaker D. Visual Acuity Changes throughout Adulthood in Normal, Healthy Eyes: Seeing Beyond 6/6. Optom Vis Sci 1995;72:186–91. [DOI] [PubMed] [Google Scholar]
- 30.Raasch TW, Bailey IL, Bullimore MA. Repeatability of Visual Acuity Measurement. Optom Vis Sci 1998;75:342–8. [DOI] [PubMed] [Google Scholar]
- 31.Hastings GD, Marsack JD, Nguyen LC, et al. Is an Objective Refraction Optimised Using the Visual Strehl Ratio Better than a Subjective Refraction? Ophthalmic Physiol Opt 2017;37:317–25. [DOI] [PMC free article] [PubMed] [Google Scholar]
- 32.Shi Y, Applegate RA, Wei X, et al. Registration Tolerance of a Custom Correction to Maintain Visual Acuity. Optom Vis Sci 2013;90:1370–84. [DOI] [PubMed] [Google Scholar]
- 33.Hastings GD, Zanayed JZ, Nguyen LC, et al. Do Polymer Coatings Change the Aberrations of Conventional and Wavefront-guided Scleral Lenses? Optom Vis Sci 2020;97:28–35. [DOI] [PMC free article] [PubMed] [Google Scholar]


