

Abstract
Little is known about the functional relationship of delaying second-line treatment initiation for human immunodeficiency virus–positive patients and mortality, given a patient’s immune status. We included 7,255 patients starting antiretroviral therapy during 2004–2017, from 9 South African cohorts, with virological failure and complete baseline data. We estimated the impact of switch time on the hazard of death using inverse probability of treatment weighting of marginal structural models. The nonlinear relationship between month of switch and the 5-year survival probability, stratified by CD4 count at failure, was estimated with targeted maximum likelihood estimation. We adjusted for measured time-varying confounding by CD4 count, viral load, and visit frequency. Five-year mortality was estimated to be 10.5% (95% CI: 2.2, 18.8) for immediate switch and to be 26.6% (95% CI: 20.9, 32.3) for no switch (51.1% if CD4 count was <100 cells/mm3). The hazard of death was estimated to be 0.37 (95% CI: 0.30, 0.46) times lower if everyone had been switched immediately compared with never. The shorter the delay in switching, the lower the hazard of death—delaying 30–59 days reduced the hazard by 0.53 (95% CI: 0.43, 0.65) times and 60–119 days by 0.58 (95% CI: 0.49, 0.69) times, compared with no switch. Early treatment switch is particularly important for patients with low CD4 counts at failure.
Keywords: causal inference, HIV, second-line ART, targeted learning, treatment switching
Abbreviations
- ART
antiretroviral treatment
- CI
confidence interval
- HIV
human immunodeficiency virus
- IPTW
inverse probability of treatment weighting
- MSM
marginal structural model
- NRTI
nucleoside reverse transcriptase inhibitor
- NNRTI
nonnucleoside reverse transcriptase inhibitor
- TMLE
targeted maximum likelihood estimation
- VL
viral load
- WHO
World Health Organization
Antiretroviral treatment (ART) was received by an estimated 4.4 million (61%) people living with human immunodeficiency virus (HIV) in South Africa in 2017 (1). As the number of HIV-positive patients with access to ART has increased, so has the number of patients who have experienced failure of first-line ART. Patients with virological failure on first-line ART should, in principle, switch to second-line therapy as soon as possible, because a delay in switching treatment regimens has been shown to lead to increased mortality (2–7). South African guidelines recommend switching from 2 nucleoside reverse transcriptase inhibitors (NRTIs) and 1 nonnucleoside reverse transcriptase inhibitor (NNRTI) to 2 NRTIs and 1 protease inhibitor if 2 consecutive viral loads on first-line therapy are greater than 1,000 copies/mL. However, in resource-limited settings it is still common to delay the switch (8–10). Reasons for delays include doubts about adequate patient adherence, availability of viral-load (VL) testing, and the cost of second-line regimens (11, 12).
The estimated effect of delayed switch to second-line therapy on mortality has been investigated in several observational studies that adjusted for measured time-varying confounders using causal inference methods. Gsponer et al. (5) showed the drastic reduction in mortality for patients switching to second-line therapy, compared with no switch, based on an immunological criterion of failing, as well as the benefit of switching early. Petersen et al. (6) estimated the effect of delayed switch after confirmed virological failure on survival and quantified the relative benefit of earlier switch based on the assumption of a linear relationship between timing of switch and probability of death. Other studies have looked into the impact of delayed switch in South Africa (7), the estimated effects of using different viral failure definitions (2), and the relative efficacy of various monitoring strategies (4).
Few studies have explored the functional relationship between time of switch and mortality (13), and there is potential for further research into whether there is a “breaking point” beyond which further delays could be particularly risky, especially for patients with an already compromised immune system. In particular, it would be of interest to know whether the estimated effect of delayed switch is modified by CD4 count at failure. Previous studies have looked at this, albeit in different contexts (6, 7). Moreover, from a programmatic perspective there might also be a benefit to minimizing the time between first viral load of >1,000 copies/mL and switch given that, with new technologies like resistance testing, patients with adequate adherence and proven resistance could potentially be switched earlier. In addition, most of the studies to date have had relatively small patient numbers and limited follow-up times.
Our study aimed to address these gaps. We assessed the impact of delayed switch from first-line ART treatment to second-line ART treatment on mortality in 9 South African treatment programs, a large cohort with long follow-up. We used 2 related but distinct causal approaches, inverse probability of treatment weighting (IPTW) and targeted maximum likelihood estimation (TMLE), which allow us to present our findings on the hazard and incidence scales. The impact of delayed switch was flexibly modeled for patients with different disease severities based on CD4 count at time of VL failure. We also investigated the importance of monitoring the delay between the first VL measurement over 1,000 copies/mL and confirmed failure (second VL measurement of >1,000 copies/mL) as part of the delay in switch on mortality outcomes.
METHODS
Study setting and definitions
We included 9 HIV treatment facilities in South Africa that took part in the International Epidemiology Databases to Evaluate AIDS Collaboration, Southern Africa (IeDEA-SA) collaboration (https://www.iedea-sa.org/), namely Desmond Tutu HIV Centre Gugulethu, Hlabisa HIV Treatment and Care Programme, Tygerberg, McCord Hospital, 3 treatment facilities at the Khayelitsha ART Programme, Themba Lethu Clinic, and Masiphumelele Clinic. The collaboration has been described in detail elsewhere (14).
Adult patients who started treatment on a first-line treatment regime (2 NRTIs +1 NNRTI) and whose first-line therapy failed after January 1, 2004, were included in the analysis. Failure was defined as 2 consecutive VL measurements greater than 1,000 copies/mL and measured at least 4 weeks apart. If measurements were taken less than 4 weeks apart, the next measurement was considered. We excluded patients with no record of receiving ART, those that experienced virologic failure within 6 months of ART initiation, those that were not receiving ART at the time of first VL failure, and those that switched before VL failure. In total, we included 7,255 patients for the main complete-case analysis (Figure 1) and 8,008 patients in the sensitivity analysis with multiple imputation for missing baseline data. Earliest entry date into our sample was October 4, 2004, and the database was closed on August 16, 2017.
Figure 1.
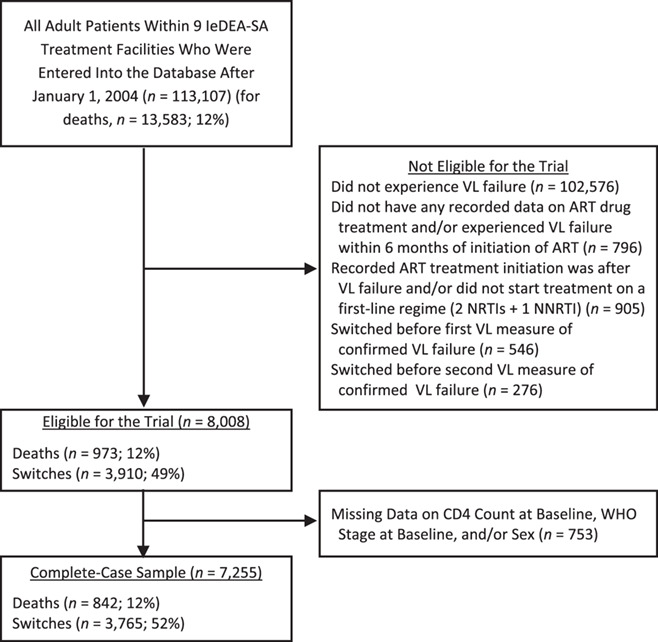
Flow diagram for inclusion of patients in our analysis, International Epidemiology Databases to Evaluate AIDS Collaboration, Southern Africa (IeDEA-SA), 2004–2017. ART, antiretroviral treatment; NRTI, nucleoside reverse transcriptase inhibitor; NNRTI, nonnucleoside reverse transcriptase inhibitor; VL, viral load; WHO,World Health Organization.
In the main analysis, baseline was defined at the time of first-line viral failure (i.e., the date at which the second of the 2 consecutive viral loads was over 1,000 copies/mL). A secondary analysis was performed using as the baseline the date at which the first of the 2 consecutive VLs was greater than 1,000 copies/mL, which represents the earliest indication of viral failure. The sample of patients was the same regardless of the definition used because only patients with 2 elevated viral loads were included. A switch from first-line ART to second-line ART was broadly defined as a switch from 2 NRTIs and 1 NNRTI to 2 NRTIs and 1 protease inhibitor. A detailed list of second-line regimens in our data is provided in Web Table 1 (available at https://academic.oup.com/aje). Patients were defined as being lost to follow-up if there was no visit or event for 9 months after their last recorded visit and before database closure.
The primary endpoint was mortality, which was recorded through clinic patient files and updated through data from the South African national vital registry where available (this approach is expected to give >96% completeness of mortality data (15)).
Analysis
Analysis time started at the date of first-line failure, defined as 2 VL measurements of >1,000 copies/mL in the main analysis and 1 VL measurement of >1,000 copies/mL in the secondary analysis, as described above. Our primary exposure was the timing of the switch to second-line ART, measured in months since the respective date of failure, and we used this to estimate the effect on both the hazard of death and 5-year survival.
Measured and included baseline characteristics (at time of confirmed failure) were age, sex, highest and lowest CD4 count prior to failure, highest and lowest log VL prior to failure, an indicator for whether a patient was ever suppressed prior to failure, World Health Organization (WHO) clinical stage at time of ART initiation, year of ART initiation, and treatment facility. Time-varying variables that potentially determined the decision to switch as well as mortality, and were affected by prior treatment regimes, were CD4 count, VL, and treatment frequency (defined as number of visits within the past 6 months). It is possible to adjust for confounding of these variables using appropriate causal inference methods (16).
We estimated the effect of the timing of the switch on the hazard of death using IPTW of marginal structural models (MSMs) (2). To estimate the effect of treatment switch, as well as the nonlinear relationship between month since failure and month of switch on the probability of 5-year mortality, stratified by CD4 count at failure, we used TMLE for longitudinal marginal structural working models (17).
For IPTW, we used 7 different switching delay strategies, no switch and 6 delayed-switch durations: <30 days, 30–59 days, 60–119 days, 120–179 days, 180–359 days, and ≥360 days. We created 7 clones/replicates per patient, one for each treatment strategy, as described previously (7). A clone/replicate is censored after it ceases to follow the respective switching strategy. The remaining uncensored observations were weighted to represent what would have happened if the censored patients had continued to follow the respective switching strategy. We used pooled logistic regression models weighted by the stabilized inverse probabilities of treatment and censoring to estimate the effect of the different strategies on the hazard of death. The logistic regression models used to derive the weights contained the above-mentioned time-dependent and baseline variables in the denominator and included baseline variables only in the numerator. Web Table 2 and Web Appendix 1 contain a detailed description of implementation of the method and model specifications. In sensitivity analyses, missing baseline CD4 count and WHO stage were imputed using multiple imputation by chained equations (18).
With TMLE, we first estimated 5-year mortality under immediate switch after confirmed failure and no switch using the R (R Foundation for Statistical Computing, Vienna, Austria) package ltmle (19). The iterated outcome regressions (i.e., the relationship between mortality and the covariates at each point in time, based on 3-month intervals) were estimated using super learning. Super learning is a data-adaptive approach that combines different modeling approaches, such as logistic regression or other regression approaches, such that the expected prediction error (estimated via cross validation) is minimized. See the Web material for more details. We then specified marginal structural working models to model the relationship between month since failure, month of switching, and survival, conditional on CD4 count at failure. See Web material for more details. The fitted models, calculated based on the approach described in Petersen et al. (17), were then used to visualize the relationship.
All analyses were performed using Stata, version 13 (StataCorp LP, College Station, Texas) (20) and R, version 3.5.1 (R Foundation for Statistical Computing) (21).
Ethics
This International Epidemiology Databases to Evaluate AIDS Collaboration, Southern Africa, collaboration study was approved by the University of Cape Town and University of Bern human research ethics committees. At most sites, the requirement for informed consent was waived, because only anonymized data that were already collected as part of routine monitoring contributed to the collaborative data set.
RESULTS
Median time from ART initiation to failure was 1,218 days (about 3.3 years); median time from confirmed failure to switch was 121 days (first quartile: 49 days; third quartile: 288 days), with follow-up times from confirmed failure ranging between 1 and 4,409 days (median, 1,835 days; interquartile range, 1183–2,470). During follow-up, 3,765 patients (52%) switched, and 842 (12%) died. The included patients were mostly female (65%) and had advanced WHO stage at ART initiation (60%) (Tables 1 and 2). Among patients that never switched, a substantial proportion (19%) had a viral load of >100,000 copies/mL at confirmed VL failure.
Table 1.
Summary of Patient Characteristics at Confirmed Viral Load Failurea Using Data from the International Epidemiology Databases to Evaluate AIDS Collaboration, Southern Africa, 2004–2017
| No. of Days After Viral-Load Failure That Switch to Second-Line ART Occurred | ||||||||||||||||
|---|---|---|---|---|---|---|---|---|---|---|---|---|---|---|---|---|
|
Never
Switched (n = 3,490) |
0–29
(n = 627) |
30–59
(n = 619) |
60–119
(n = 624) |
120–179
(n = 442) |
180–359
(n = 701) |
 360 360
(n = 752) |
Total
(n = 7,255) |
|||||||||
| Characteristic | No. | % | No. | % | No. | % | No. | % | No. | % | No. | % | No. | % | No. | % |
| No. of switches | 0 | 0 | 627 | 100 | 619 | 100 | 624 | 100 | 442 | 100 | 701 | 100 | 752 | 100 | 3,765 | 52 |
| No. of deaths | 475 | 14 | 61 | 10 | 63 | 10 | 59 | 9 | 46 | 10 | 76 | 11 | 62 | 8 | 842 | 12 |
| Female sex | 2,247 | 64 | 378 | 60 | 420 | 68 | 394 | 63 | 282 | 64 | 471 | 67 | 509 | 68 | 4,701 | 65 |
| Age at viral-load failure, years | ||||||||||||||||
| <30 | 624 | 18 | 101 | 16 | 124 | 20 | 117 | 19 | 76 | 17 | 144 | 21 | 209 | 28 | 1,395 | 19 |
| 31–40 | 1,611 | 46 | 265 | 42 | 264 | 43 | 293 | 47 | 205 | 46 | 337 | 48 | 344 | 46 | 3,319 | 46 |
| >40 | 1,255 | 36 | 261 | 42 | 231 | 37 | 214 | 34 | 161 | 36 | 220 | 31 | 199 | 26 | 2,541 | 35 |
| WHO stage at ART initiation | ||||||||||||||||
| I/II | 1,334 | 38 | 324 | 52 | 317 | 51 | 263 | 42 | 165 | 37 | 267 | 38 | 228 | 30 | 2,898 | 40 |
| III/IV | 2,156 | 62 | 303 | 48 | 302 | 49 | 361 | 58 | 277 | 63 | 434 | 62 | 524 | 70 | 4,357 | 60 |
| CD4 count at viral-load failure |
||||||||||||||||
| 0–49 | 337 | 10 | 67 | 11 | 45 | 7 | 45 | 7 | 31 | 7 | 39 | 6 | 37 | 5 | 601 | 8 |
| 50–99 | 334 | 10 | 56 | 9 | 64 | 10 | 46 | 7 | 34 | 8 | 54 | 8 | 51 | 7 | 639 | 9 |
| 100–199 | 753 | 22 | 151 | 24 | 131 | 21 | 156 | 25 | 124 | 28 | 165 | 24 | 185 | 25 | 1,665 | 23 |
| 200–349 | 1,076 | 31 | 221 | 35 | 211 | 34 | 218 | 35 | 151 | 34 | 262 | 37 | 303 | 40 | 2,442 | 34 |
| 350–499 | 567 | 16 | 77 | 12 | 110 | 18 | 99 | 16 | 61 | 14 | 115 | 16 | 126 | 17 | 1,155 | 16 |
| ≥500 | 423 | 12 | 55 | 9 | 58 | 9 | 60 | 10 | 41 | 9 | 66 | 9 | 50 | 7 | 753 | 10 |
| RNA measurement at viral-load failure | ||||||||||||||||
| 1,000–4,999 | 1,152 | 33 | 154 | 25 | 214 | 35 | 212 | 34 | 159 | 36 | 235 | 34 | 308 | 41 | 2,434 | 34 |
| 5,000–99,999 | 457 | 13 | 97 | 25 | 88 | 14 | 79 | 13 | 69 | 16 | 130 | 19 | 127 | 17 | 1,047 | 14 |
| 10,000–49,999 | 913 | 26 | 199 | 32 | 168 | 27 | 207 | 33 | 121 | 27 | 195 | 28 | 194 | 26 | 1997 | 28 |
| 50,000–999,999 | 306 | 9 | 62 | 10 | 54 | 9 | 49 | 8 | 44 | 10 | 54 | 8 | 52 | 7 | 621 | 9 |
| ≥100,000 | 662 | 19 | 115 | 18 | 95 | 15 | 77 | 12 | 49 | 11 | 87 | 12 | 71 | 9 | 1,156 | 16 |
| RNA suppression prior to viral-load failure |
2,652 | 76 | 432 | 69 | 436 | 70 | 469 | 75 | 315 | 71 | 534 | 76 | 578 | 77 | 5,416 | 75 |
Abbreviations: ART, antiretroviral therapy; WHO, World Health Organization.
a Second consecutive viral-load measurement greater than 1,000 copies/ml.
Table 2.
Summary of Patient Characteristics, Displayed as Median (Interquartile Range), Using Data From the International Epidemiology Databases to Evaluate AIDS Collaboration, Southern Africa, 2004–2017
| Characteristic |
Never Switched
(n = 3,490) |
No. of Days After Viral-Load Failure Before Switch to Second-Line ART |
Total
(n = 7,255) |
|||||
|---|---|---|---|---|---|---|---|---|
| 0–29 (n = 627) | 30–59 (n = 619) | 60–119 (n = 624) | 120–179 (n = 442) | 180–359 (n = 701) |
 360
(n = 752) 360
(n = 752)
|
|||
| No. of days from confirmed failurea to switch |
0 | 28 (21–28) | 49 (36–56) | 85 (77–106) | 145 (132–162) | 245 (210–292) | 638 (481–940) | 121 (49–288) |
| No. of days from ART initiation to confirmed failurea, days |
1,456 (893–165) | 1,021 (569–1,679) | 964 (568–1,597) | 986 (589–1,678) | 1,107 (631–1,724) | 1,064 (696–1,728) | 1,028 (678–1,516) | 1,218 (730–1916) |
| No. of days from RNA >1,000 to confirmed failurea |
141 (91–257) | 84 (56–113) | 91 (58–127) | 90 (56–136) | 112 (78–157) | 115 (84–171) | 134 (84–185) | 115 (83–190) |
| No. of days from ART start to last contact |
2,425 (1686–3,108) | 2,762 (1884–3,564) | 2,762 (1811–3,447) | 2,808 (1995–3,564) | 2,929 (2211–3,661) | 3,009 (2266–3,665) | 3,316 (2727–3,981) | 2,688 (1898–3,431) |
| No. of days from confirmed failurea to last contact |
592.5 (294–1,175) | 1,435 (777–2080) | 1,306 (722–2008) | 1,481 (749–2,132) | 1,538 (1013–21,426) | 1,653 (1087–2,109) | 2,110 (1556–2,664) | 1,095 (481–1885) |
| No. of CD4A measurements from failurea to last contact |
1 (0–3) | 2 (1–5) | 3 (1–5) | 3 (1–6) | 3 (2–6) | 4 (2–6) | 6 (3–9) | 2 (1–5) |
| No. of RNA measurements from failurea to last contact |
3 (1–5) | 5 (3–9) | 5 (3–8) | 6 (3–9) | 7 (5–10) | 7 (5–10) | 9 (7–13) | 4 (2–8) |
Abbreviation: ART, antiretroviral therapy.
a Second consecutive viral-load measurement greater than 1,000 copies/ml.
The probability of being switched was higher among patients with low current CD4 count, high VL, and a higher visit frequency (Table 3). These variables also predicted the probability of death, confirming that they are likely time-varying confounders.
Table 3.
Predictors of Switch from First-Line to Second-Line Antiretroviral Therapy and Predictors of Deatha, International Epidemiology Databases to Evaluate AIDS Collaboration, Southern Africa, 2004–2017
| Dependent Variable | Switch | Death | ||||
|---|---|---|---|---|---|---|
| OR | P Value | 95% CI | OR | P Value | 95% CI | |
| Time-dependent | ||||||
| CD4 cell count, per mm3b | ||||||
| 50–99 | 0.90 | 0.38 | 0.72, 1.14 | 0.44 | 0.00 | 0.35, 0.55 |
| 100–199 | 0.83 | 0.10 | 0.66, 1.04 | 0.21 | 0.00 | 0.16, 0.27 |
| 200–349 | 0.82 | 0.11 | 0.65, 1.04 | 0.13 | 0.00 | 0.10, 0.18 |
| 350–499 | 0.95 | 0.71 | 0.72, 1.25 | 0.06 | 0.00 | 0.04, 0.09 |
| ≥500 | 0.72 | 0.06 | 0.52, 1.02 | 0.03 | 0.00 | 0.02, 0.06 |
| RNA, copies/mLc | ||||||
| 250–499 | 0.68 | 0.21 | 0.37, 1.24 | 1.09 | 0.69 | 0.71, 1.68 |
| 500–999 | 2.29 | 0.00 | 1.49, 3.54 | 1.59 | 0.06 | 0.98, 2.57 |
| 1,000–9,999 | 12.56 | 0.00 | 9.26, 17.02 | 2.40 | 0.00 | 1.73, 3.31 |
| 10,000–99,999 | 17.84 | 0.00 | 12.89, 24.69 | 3.04 | 0.00 | 2.12, 4.37 |
| ≥100,000 | 16.62 | 0.00 | 11.47, 24.08 | 4.37 | 0.00 | 2.86, 6.66 |
| Time-CD4 interaction | 1.00 | 0.04 | 1.00, 1.00 | 1.00 | 0.25 | 1.00, 1.00 |
| Time-RNA interaction | 1.00 | 0.53 | 1.00, 1.00 | 1.00 | 0.01 | 1.00, 1.00 |
| No. of visits within past 6 months | 1.27 | 0.00 | 1.26, 1.29 | 0.94 | 0.00 | 0.91, 0.97 |
| Baseline | ||||||
| CD4 cell count, per mm3d | ||||||
| 50–99 | 1.31 | 0.04 | 1.01, 1.69 | 1.02 | 0.88 | 0.78, 1.34 |
| 100–199 | 1.49 | 0.00 | 1.16, 1.91 | 0.97 | 0.80 | 0.73, 1.27 |
| 200–349 | 1.70 | 0.00 | 1.30, 2.22 | 1.05 | 0.76 | 0.77, 1.44 |
| 350–499 | 1.50 | 0.01 | 1.11, 2.04 | 1.31 | 0.18 | 0.88, 1.95 |
| ≥500 | 1.58 | 0.01 | 1.10, 2.27 | 1.73 | 0.05 | 1.00, 3.01 |
| RNA, copies/mLe | ||||||
| 5,000–9,999 | 1.10 | 0.07 | 0.99, 1.22 | 0.98 | 0.88 | 0.76, 1.27 |
| 10,000–49,999 | 0.92 | 0.12 | 0.82, 1.02 | 1.13 | 0.27 | 0.91, 1.40 |
| 50,000–99,999 | 0.99 | 0.95 | 0.85, 1.16 | 1.31 | 0.06 | 0.99, 1.71 |
| ≥100,000 | 0.90 | 0.24 | 0.77, 1.07 | 1.40 | 0.01 | 1.09, 1.81 |
| Prefailure VL suppression | 1.03 | 0.86 | 0.71, 1.51 | 1.23 | 0.66 | 0.48, 3.15 |
| WHO stage III/IV at ART initiation | 0.91 | 0.02 | 0.85, 0.99 | 1.18 | 0.05 | 1.00, 1.40 |
| Age | 1.00 | 0.02 | 1.00, 1.01 | 1.02 | 0.00 | 1.01, 1.03 |
| Sex | 1.07 | 0.10 | 0.99, 1.15 | 0.91 | 0.20 | 0.78, 1.05 |
Abbreviations: ART, antiretroviral therapy; CI, confidence interval; OR, odds ratio; VL, viral load; WHO, World Health Organization.
a The analysis adjusted for follow-up time using restricted cubic splines. Other controls include prefailure highest and prefailure lowest CD4 and RNA, binary indicator of clinic, and year of failure.
b Reference category: 0–49 per mm3.
c Reference category: 0–249 copies/mL.
d Reference category: 0–49 per mm3.
e Reference category: 0–4,999 copies/mL.
The effect of immediate switch compared with no switch on mortality, if confirmed failure was used as failure definition, was estimated to be 0.49 (95% confidence interval (CI): 0.42, 0.58) in a crude analysis and 0.37 (95% CI: 0.30, 0.46) using IPTW. Results with multiple imputation were 0.47 (95% CI: 0.40, 0.54) in a crude analysis and 0.36 (95% CI: 0.30, 0.44) using IPTW. If first VL of >1,000 copies/mL was used as definition of failure, the estimates were 0.52 (95% CI: 0.45, 0.61) and 0.42 (95% CI: 0.34, 0.52), respectively. After imputation the results were 0.50 (95% CI: 0.43, 0.58) and 0.41 (95% CI: 0.34, 0.51) (Web Table 3). Figure 2 shows that the shorter the delay in switching, the lower the hazard of death. There are stronger benefits of early switch when considering 1 VL of >1,000 copies/mL as the failure definition. Similar results are obtained after multiple imputation of baseline CD4 count and WHO stage (Web Table 3). Sensitivity analyses show that truncation of the stabilized weights at the 1st and 99th quantile yields the most stable results (Web Table 4).
Figure 2.
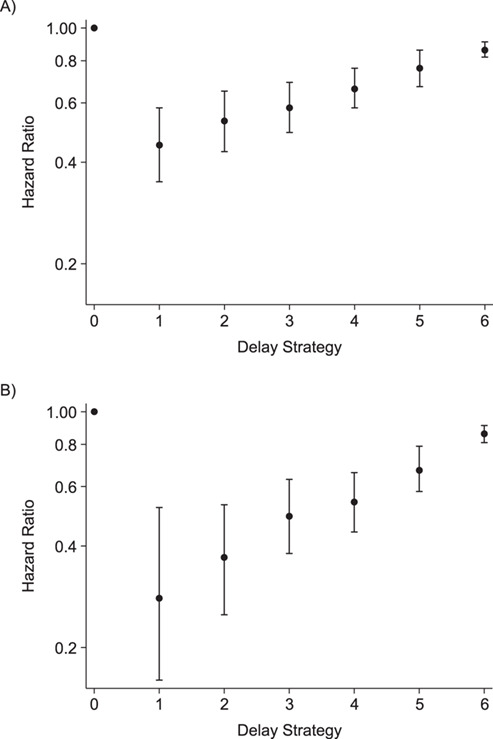
Hazard ratio for death of each switching-delay duration subgroup, International Epidemiology Databases to Evaluate AIDS Collaboration, Southern Africa, 2004–2017. ”No switch” is the referent, and the analysis used inverse probability of treatment weighting of marginal structural models. A) Main analysis, baseline: confirmed failure (second viral load (VL) > 1,000). B) Secondary analysis, baseline: first VL > 1,000. Delay strategy refers to the duration of switching delay: strategy 0, no switch (reference category); strategy 1, <30 days; strategy 2, 30–59 days; strategy 3, 60–119 days; strategy 4, 120–179 days; strategy 5, 180–359 days; strategy 6, ≥360 days.
Using TMLE, 5-year mortality was estimated to be 10.5% (95% CI: 2.2, 18.8) if everyone had been switched immediately and 26.6% (95% CI: 20.9, 32.3) if everyone had stayed on their failing regimen. The corresponding risk difference was −16.1% (95% CI: −26.1,−6.1), and the odds ratio was 0.32 (95% CI: 0.13; 0.82). The working MSMs, fitted with TMLE, are visualized in Figure 3. The black dashed line shows the estimated 5-year mortality (i.e., 60 months after failure) to be about 25% under no switching (month of switch = 60). However, this varies considerably by immune status at failure. Approximately 51% would have died among those who had a CD4 count of <100 at failure (solid black line), but only a small proportion (17.5%) among those with a CD4 count of >200 cells/mm3 (light gray line). Moreover, the effect of delaying treatment was estimated to be more severe (i.e., steeper ascent) among patients failing with CD4 count of <100 cells/mm3. Similar results are obtained when evaluating probabilities of death prior to 5 years of follow-up (Web Figure 1). Overall, the estimated relationship between switch time and mortality was nonlinear, as visualized in Figure 3. This is because the estimated coefficients of the nonlinear switch time terms in the working MSMs were important, and also significant at the 5% level.
Figure 3.
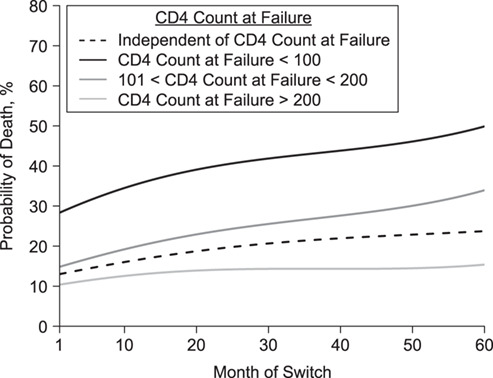
Probability of death 5 years after virologic failure for different CD4 count categories at time of failure and depending on month of switch (i.e., extent of delay), International Epidemiology Databases to Evaluate AIDS Collaboration, Southern Africa, 2004–2017. Estimates are based on working marginal models estimated with longitudinal targeted maximum likelihood estimation, as specified in Web Appendix 1. Note that the causal quantity of interest is defined as a projection of the true causal dose-response curve (i.e., the true relationship between time/switch time and mortality) onto the specified working model.
DISCUSSION
Our study highlights that it often takes a long time to switch patients to second-line antiretroviral treatment in South Africa. We have shown that an early switch of regimen is highly beneficial in terms of reduced mortality. Patients with low CD4 counts at time of failure are at particularly high risk of increased mortality, whereas a moderate delay in healthy patients comes with a comparatively lower risk.
Strengths and limitations
Our study is based on a large data set, with a multitude of different treatment regimens and long follow-up, which allowed us to model the relationships in the data in a flexible and robust way. Because our patients have relatively regular VL measurements for the setting, we have been able to evaluate the estimated effect of switching based on viral failure, rather than immunological failure, which is of great interest. VL monitoring is typically not available in public-sector programs in resource-limited settings, although it is currently being expanded. Another strength is the use of causal inference methods to adjust for time-dependent confounding affected by prior treatment, which would not be possible with traditional regression analyses (16). This helped us to contrast switching strategies under different viral-failure definitions. We also used TMLE, which has desirable statistical properties (double robustness), to confirm and extend the MSM analysis. In contrast to previous studies, we have even been able to implement this method for a MSM that postulated nonlinear relationships between treatment strategies and survival.
Our study has some limitations. Our analysis is based on routine data from South African treatment programs. It is possible that patients defined to be lost to follow-up are in fact cycling in and out of care, possibly in different provinces (22), or that the complication of capturing start and stop dates of different drugs might lead to inaccuracies that could potentially also affect our ability to accurately define switch dates. The diagnostics further suggested that there could be some positivity violations in our data, which means that individuals might not have a positive probability of continuing to receive treatment according to a specific treatment rule, given that they have done so thus far and irrespective of the covariate history (Web Table 5, Web Figure 2). This could have affected our estimates. Another limitation is the unavailability of patient-level adherence data.
There are additional limitations associated with the analysis based on the first VL of >1,000 copies/mL at baseline (secondary analysis), which occur due to the definition of the sample. Eligibility for the sample was based on confirmed failure. After the first VL of >1,000 copies/mL, those included cannot switch or die until after their next VL measurement, thus creating a period of immortal time. Table 1 indicates that the period of time between first VL of >1,000 and confirmed failure is greater, on average, for those with longer delays between confirmed failure and switch. Hence, this might cause some bias in the comparisons of delay strategies. Furthermore, the restriction of the “first VL of >1,000 copies/mL” sample to patients that attained confirmed failure (VL of >1,000 copies/mL) at next VL measurement means that the secondary analysis can be interpreted only in reference to the confirmed-failure population, and therefore is not generalizable to the wider population.
Interpretation of findings
It is no surprise that delayed treatment switch could affect patient’s health. However, according to our results, earlier switch is of particular benefit when switching after the first sign of failure (i.e., the first VL of >1,000 copies/mL) for those that go on to confirmed failure. HIV specialists might be reluctant to switch patients who have adherence problems or are unstable, but for stable patients who fail because of resistance or toxicities, early switching after a first elevated viral load could be of benefit.
Our results confirm that switching is determined partly by visit frequency, which might relate to clinician concern for patients based on health status but also strongly relates to patient’s engagement in care and adherence. To reduce the risk of failure of another regimen, patients on second-line treatment should be adherent. We have shown the benefit of switching even under imperfect adherence, but ideally patients should be psychologically prepared to adhere to their new treatment regimen.
Results in context
Our results comparing immediate switch to no switch yield similar conclusions to those of studies that used other definitions of failure and were done in different patient populations, for different follow-up times, and had different methodological approaches (5–7, 17). Like Rohr et al. (7) we show the that the effectiveness of switching strategies depends on disease severity, although in a more refined way, given that we modeled the relationship nonlinearly for different patient groups. Similar to other studies, we have shown that remaining on first-line therapy leads to an increase in mortality compared with switching and that earlier switching is beneficial in terms of survival (6, 17). Our marginal structural working models were more complex than the MSMs in these studies, which makes a more refined interpretation of the dose-response relationship between delay in switching and mortality possible; however, both previous studies (13) and current research (23) suggest that it could be important to allow for even more flexible approaches to model specification and fitting than ours. Nevertheless, whatever methodological approach is chosen, it is important to note that the beneficial effect associated with switching can be observed for different definitions of treatment failure (5, 6).
Our results have 2 direct implications for current program guidance. First, for stable virologically suppressed patients, it is no longer recommended in South Africa that they receive regular CD4 counts. However, once a patient is viremic, our results demonstrate the critical importance of CD4 count in further risk-stratifying patients. The value of dropping routine CD4 count testing in the interests of cost-savings needs to be considered alongside the benefits of the additional information it provides on disease severity and mortality risk, which could be used to highlight groups that are in more urgent need of early switch.
In patients who subsequently fail virologically, we have demonstrated that the delay between the first and second elevated viral load contributed to the nonlinear early increase in mortality resulting from delayed switching, especially in patients with low CD4 counts. This points to the importance of either accelerating confirmation of virological failure in patients with advanced immunological suppression or considering a switch at the first evidence of viremia if cost and regimen-sparing are no longer important considerations driving the need to confirm virologic failure.
Further research
In the South African context, and according to WHO guidelines, switching treatments is permitted after confirmed failure. Hence, our analyses were restricted to a subgroup of patients with 2 consecutive VL measurements of >1,000 copies/mL. The wider data set, indicated in Figure 1, shows that some patients switch to second-line treatment prior to confirmed virologic failure. It would be interesting to investigate the impact of time to switch from first elevated VL using a sample defined with the eligibility criterion of 1 VL of >1,000 copies/mL. In this larger sample, the additional complication of the competing risk of virologic resuppression would need to be considered in the analysis, as resuppressing patients would no longer be eligible for switch.
Conclusions
Our study highlights the importance of early treatment switch, particularly for patients with low CD4 counts at failure.
Supplementary Material
ACKNOWLEDGMENTS
Author affiliations: Health Economics and Decision Science, School of Health and Related Research, University of Sheffield, Sheffield, United Kingdom (Helen Bell-Gorrod); Center for Global Health and Development, Boston University, Boston, Massachusetts (Matthew P. Fox); Centre for Infectious Disease Epidemiology and Research, University of Cape Town, Cape Town, South Africa (Andrew Boulle, Mary-Ann Davies, Michael Schomaker); Division of Infectious Diseases, Department of Medicine, University of Stellenbosch, Stellenbosch, South Africa (Hans Prozesky); Tygerberg Hospital, Cape Town, South Africa (Hans Prozesky); Desmond Tutu HIV Centre, Cape Town, South Africa (Robin Wood); Institute of Infectious Diseases and Molecular Medicine, University of Cape Town, Cape Town, South Africa (Robin Wood); Africa Health Research Institute, KwaZulu-Natal, South Africa (Frank Tanser); Lincoln International Institute for Rural Health, University of Lincoln, Lincoln, United Kingdom (Frank Tanser); School of Nursing and Public Health, University of KwaZulu-Natal, Durban, South Africa (Frank Tanser); Centre for the AIDS Programme of Research in South Africa (CAPRISA), University of KwaZulu-Natal, South Africa (Frank Tanser); and Institute of Public Health, Medical Decision Making and Health Technology Assessment, UMIT—University for Health Sciences, Medical Informatics and Technology, Hall in Tirol, Austria (Michael Schomaker).
This project was supported by the National Institutes of Health (grant U01AI069924).
We thank Dr. Maya Petersen for feedback on an earlier version of our targeted maximum likelihood estimation analysis and Dr. Julia Rohr for feedback on our inverse probability of treatment weighting analysis.
The contents of this work are solely the responsibility of the authors and do not necessarily represent the official views of the National Institutes of Health.
Conflict of interest: none declared.
REFERENCES
- 1. UNAIDS UNAIDS data 2018. https://www.unaids.org/sites/default/files/media_asset/unaids-data-2018_en.pdf. Accessed March 18, 2020.
- 2. Cain LE, Saag MS, Petersen M, et al. Using observational data to emulate a randomized trial of dynamic treatment-switching strategies: an application to antiretroviral therapy. Int J Epidemiol. 2016;45(6):2038–2049. [DOI] [PMC free article] [PubMed] [Google Scholar]
- 3. Cain LE, Sterne JAC, May MT, et al. When to switch cART: novel methods for the comparison of switching strategies using observational data. Am J Epidemiol. 2012;175(suppl):S117. [Google Scholar]
- 4. Ford D, Robins JM, Petersen ML, et al. The impact of different CD4 cell-count monitoring and switching strategies on mortality in HIV-infected African adults on antiretroviral therapy: an application of dynamic marginal structural models. Am J Epidemiol. 2015;182(7):633–643. [DOI] [PMC free article] [PubMed] [Google Scholar]
- 5. Gsponer T, Petersen M, Egger M, et al. The causal effect of switching to second-line ART in programmes without access to routine viral load monitoring. AIDS. 2012;26(1):57–65. [DOI] [PMC free article] [PubMed] [Google Scholar]
- 6. Petersen ML, Tran L, Geng EH, et al. Delayed switch of antiretroviral therapy after virologic failure associated with elevated mortality among HIV-infected adults in Africa. AIDS. 2014;28(14):2097–2107. [DOI] [PMC free article] [PubMed] [Google Scholar]
- 7. Rohr JK, Ive P, Horsburgh CR, et al. Marginal structural models to assess delays in second-line HIV treatment initiation in South Africa. PLoS One. 2016;11(8):e0161469. [DOI] [PMC free article] [PubMed] [Google Scholar]
- 8. Fox MP, Cutsem GV, Giddy J, et al. Rates and predictors of failure of first-line antiretroviral therapy and switch to second-line ART in South Africa. J Acquir Immune Defic Syndr. 2012;60(4):428–437. [DOI] [PMC free article] [PubMed] [Google Scholar]
- 9. Levison JH, Orrell C, Losina E, et al. Early outcomes and the virological effect of delayed treatment switching to second-line therapy in an antiretroviral roll-out programme in South Africa. Antivir Ther. 2011;16(6):853–861. [DOI] [PMC free article] [PubMed] [Google Scholar]
- 10. Madec Y, Leroy S, Rey-Cuille MA, et al. Persistent difficulties in switching to second-line ART in sub-Saharan Africa—a systematic review and meta-analysis. PLoS One. 2013;8(12):e82724. [DOI] [PMC free article] [PubMed] [Google Scholar]
- 11. ART-LINC of IeDEA Study Group, Keiser O, Tweya H, et al. Switching to second-line antiretroviral therapy in resource-limited settings: comparison of programmes with and without viral load monitoring. AIDS. 2009;23(14):1867–1874. [DOI] [PMC free article] [PubMed] [Google Scholar]
- 12. Long L, Fox M, Sanne I, et al. The high cost of second-line antiretroviral therapy for HIV/AIDS in South Africa. AIDS. 2010;24(6):915–919. [DOI] [PubMed] [Google Scholar]
- 13. Petersen ML, van der Laan MJ, Napravnik S, et al. Long-term consequences of the delay between virologic failure of highly active antiretroviral therapy and regimen modification. AIDS. 2008;22(17):2097–2106. [DOI] [PMC free article] [PubMed] [Google Scholar]
- 14. Egger M, Ekouevi DK, Williams C, et al. Cohort profile: the international epidemiological databases to evaluate AIDS (IeDEA) in sub-Saharan Africa. Int J Epidemiol. 2012;41(5):1256–1264. [DOI] [PMC free article] [PubMed] [Google Scholar]
- 15. Johnson LF, Dorrington RE, Laubscher R, et al. A comparison of death recording by health centres and civil registration in South Africans receiving antiretroviral treatment. J Int AIDS Soc. 2015;18(1):20628. [DOI] [PMC free article] [PubMed] [Google Scholar]
- 16. Daniel RM, Cousens SN, De Stavola BL, et al. Methods for dealing with time-dependent confounding. Stat Med. 2013;32(9):1584–1618. [DOI] [PubMed] [Google Scholar]
- 17. Petersen M, Schwab J, Gruber S, et al. Targeted maximum likelihood estimation for dynamic and static longitudinal marginal structural working models. J Causal Inference. 2014;2(2):147–185. [DOI] [PMC free article] [PubMed] [Google Scholar]
- 18. White IR, Royston P, Wood AM. Multiple imputation using chained equations: issues and guidance for practice. Stat Med. 2011;30(4):377–399. [DOI] [PubMed] [Google Scholar]
- 19. Lendle SD, Petersen ML, Schwab J, et al. ltmle: an R package implementing targeted minimum loss-based estimation for longitudinal data. J Stat Softw. 2017;81(1):1–21. [Google Scholar]
- 20. Stata Statistical Software: Release 13 (computer program). College Station, TX: StataCorp LP; 2013. [Google Scholar]
- 21. R-Core-Team R: A language and environment for statistical computing. Vienna, Austria: R Foundation for Statistical Computing; 2018. [Google Scholar]
- 22. Kaplan SR, Oosthuizen C, Stinson K, et al. Contemporary disengagement from antiretroviral therapy in Khayelitsha, South Africa: a cohort study. PLoS Med. 2017;14(11):e1002407. [DOI] [PMC free article] [PubMed] [Google Scholar]
- 23. Kennedy EH, Ma Z, McHugh MD, et al. Nonparametric methods for doubly robust estimation of continuous treatment effects. J R Stat Soc Series B Stat Methodol. 2017;79(4):1229–1245. [DOI] [PMC free article] [PubMed] [Google Scholar]
Associated Data
This section collects any data citations, data availability statements, or supplementary materials included in this article.