

Abstract
Motivation
Time courses utilizing genome scale data are a common approach to identifying the biological pathways that are controlled by the circadian clock, an important regulator of organismal fitness. However, the methods used to detect circadian oscillations in these datasets are not able to accommodate changes in the amplitude of the oscillations over time, leading to an underestimation of the impact of the clock on biological systems.
Results
We have created a program to efficaciously identify oscillations in large-scale datasets, called the Extended Circadian Harmonic Oscillator application, or ECHO. ECHO utilizes an extended solution of the fixed amplitude oscillator that incorporates the amplitude change coefficient. Employing synthetic datasets, we determined that ECHO outperforms existing methods in detecting rhythms with decreasing oscillation amplitudes and in recovering phase shift. Rhythms with changing amplitudes identified from published biological datasets revealed distinct functions from those oscillations that were harmonic, suggesting purposeful biologic regulation to create this subtype of circadian rhythms.
Availability and implementation
ECHO’s full interface is available at https://github.com/delosh653/ECHO. An R package for this functionality, echo.find, can be downloaded at https://CRAN.R-project.org/package=echo.find.
Supplementary information
Supplementary data are available at Bioinformatics online.
1 Introduction
Circadian rhythms are 24-h oscillations that allow for the anticipation of the day/night cycle. They confer an evolutionary advantage by enabling an organism to optimize the timing of their cellular physiology such that biological processes occur at advantageous times (Dunlap, 1999). Daily oscillations occur in many processes, including metabolic regulation, immune function and sleep (Decoursey et al., 1997; Klarsfeld and Rouyer, 1998; Levi et al., 2010; Ouyang et al., 1998). Conversely, chronic disruption of circadian rhythms is strongly associated with an increased risk of disease development, e.g. cancer, diabetes and cardiovascular disease (Evans and Davidson, 2013). Circadian rhythms are generated at the molecular level by a highly conserved circadian ‘clock’ comprising a transcription-translation negative feedback loop that cycles once every 24 h (Hurley et al., 2016; Partch et al., 2014). While it is known that there is widespread regulation originating from the components of the clock at both the transcriptional and translational levels, termed the clock’s ‘output’, the field is only beginning to appreciate the complexity of the cellular circadian regulatory network (e.g. Hurley et al., 2014; Mure et al., 2018; Robles et al., 2014; Wang et al., 2017).
In higher eukaryotes, the circadian clock exists in each cell and these independent clocks are synchronized by a master regulator in the brain, e.g. the Suprachiasmatic Nucleus (SCN) in mammals (Antle and Silver, 2005; Kowalska and Brown, 2007; Ralph et al., 1990). While the master regulators maintain a robust circadian rhythm regardless of their environment, rhythms in peripheral tissues have been suggested to damp, or decrease in amplitude over time, without persistent entrainment cues (Aton et al., 2005; Yamazaki et al., 2000). Thus, under LD or similar entrainment conditions, clock and clock-regulated genes are observed to be harmonic, whereas without these cues many genes have been observed to damp in their oscillation over time. A debate as to the cause of this damping is still underway, suggesting either global circadian damping or the desynchronization of individual cell rhythms as the cause, with recent models being unable to reject either hypothesis (Westermark et al., 2009). Regardless of the cause, models of the clock have predicted that damping is an essential part of proper circadian time-keeping and reports have shown that damping plays a role in proper biological timing, including photoperiodicity, temperature compensation and entrainment (Beer et al., 2017; Horikawa et al., 2005; Tseng et al., 2012). However, the impact of circadian damping has not been explored on the output of the clock, presumably due to a lack of computational tools to examine damping in high-throughput datasets (Loros et al., 2007).
To investigate clock output (referred to here as clock-controlled elements or CCEs) researchers conduct comprehensive omics analyses over circadian time (e.g. Hurley et al., 2014, 2018; Jang et al., 2015; Menet et al., 2012; Robles et al., 2014; Rodriguez et al., 2012). To enable analysis of these datasets, researchers take advantage of the idea that CCEs exhibit oscillatory patterns that follow sinusoidal curves and categorize data as rhythmic based on the similarity between an oscillation and reference curves, such as cosine curves (Hughes et al., 2010; Hutchison et al., 2015; Wu et al., 2016). However, most CCE detection methods cannot take into account damping. Moreover, CCE detection methods that can account for damping are not effective on a high-throughput scale, as these approaches generally work directly with the original differential equation, creating a computationally expensive method (Eser et al., 2014; Westermark et al., 2009). Therefore, the current circadian detection algorithms likely miss many damped CCEs.
To better elucidate CCEs, we created the Extended Circadian Harmonic Oscillator (ECHO) application (app), a publicly available, easy-to-use interface that rapidly detects rhythms with or without a change in amplitude in large scale datasets. ECHO uses an optimization approach that fits the solution to the differential equation corresponding to an underlying negative feedback loop with external influences to omics scale data, thus extending the simple harmonic equation to identify the degree of amplitude change. ECHO detects not only the change in amplitude of oscillating genes, but is more robust to noise than current circadian detection algorithms. Applying ECHO to previously published large scale transcriptomic and proteomic datasets, we detected CCEs that fell into damped, harmonic and even forced (oscillations that increase in amplitude over circadian time) groups. CCEs that were classified as damped or forced fell into distinct Gene Ontological categories, even across several different species. Moreover, we found the environmental conditions of sampling impacted whether genes are damped or forced. Finally, we uncovered potential transcriptional connections stemming from the clock that could lead to the differential regulation of clock output, suggesting that damping is primarily a directed process rather than a by-product of desynchronization.
2 Materials and methods
State-of-the-art methods for the identification of circadian rhythms in large scale datasets utilize fixed amplitude models (Hughes et al., 2010; Hutchison et al., 2015; Wu et al., 2016). These methods are encompassed by the solution to the simple harmonic oscillator differential equation, a fixed amplitude model:
| (1) |
where x(t) is the resulting change in amplitude at time t, A is the initial amplitude, ω is the frequency of oscillation, ϕ is the phase shift and y is the equilibrium value. This solution to the harmonic oscillator differential equation (1) corresponds to an underlying negative feedback loop (Pigolotti et al., 2007), with a set of activators and repressors corresponding to the rise and fall of an oscillation’s trends. Though this equation can capture the oscillations in large-scale circadian datasets, it cannot account for outside forces that can change the amplitude of a negative feedback loop over time. However, it is important to note this system can be (and in reality, almost always is) influenced by outside biological forces, such as experimental conditions, that can decrease (damp) or increase (force) the amplitude of the oscillation it is describing over time. For example, when organisms are kept in ‘constant conditions’ (e.g. darkness or without a media change that can lead to nutrient depletion), these environmental factors have the potential to force the amplitude of the oscillation to change (Aton et al., 2005; Yamazaki et al., 2000). To account for these more realistic biological conditions in the identification of oscillations in large scale datasets, we used the extended harmonic oscillator equation:
| (2) |
where γ is the amplitude change (AC) coefficient, and all other parameters retain their meaning from (1). Of the utmost importance in this equation is the inclusion of the amplitude change coefficient, which quantifies the amount of change in amplitude within the system. A positive value of γ indicates damping, or decreasing amplitude over time, and a negative value of γ indicates forcing or increasing amplitude over time. This equation reduces to (1) in the ideal case, as a truly harmonic oscillator has a γ value of 0. By utilizing (2), changes in amplitude can be accounted for, leading to the more complete identification of circadian rhythms. In addition, by using (2) we can capture the magnitude of γ to categorize each oscillation as damped, forced or harmonic.
2.1 Fitting data with the extended harmonic oscillator equation
Building off the approach proposed in De los Santos et al. (2017), to find the parameter values in (2), we use the method of nonlinear least squares. Given experimental data and parameters β = (A, γ, ω, ϕ, y), this method minimizes the squared difference between experimental and fitted data in the following manner:
| (3) |
where n is the total number of data points and f(ti, β) refers to (2). We find a local solution to this minimization problem using the package minpack.lm in R, which uses the Levenberg-Marquadt algorithm for nonlinear least squares (Elzhov et al., 2016). Confidence intervals for all parameters can be computed by bootstrapping, as computed by the package boot (Canty and Ripley, 2019; Davison and Hinkley, 1997).
As nonlinear least squares is a nonconvex problem, choosing the correct starting values is important. We thus choose our starting points for each of the parameters (denoted with subscript 0) with heuristics based on the experimental data (Supplementary Section S1).
2.2 Analyzing datasets with multiple replicates
The equation given above (3) for nonlinear least squares assumes that for β to be an unbiased estimator, the variance at each time point must be equal (Strutz, 2010). In the case where there is a single replicate, this is vacuously true, as each replicate with a single time point must have zero variance. However, if a given dataset has multiple measurements at each time point, one cannot assume that variances are equal. To compensate for this discrepancy and obtain an unbiased β, we add weights at each time point equal to the variance at each time point (Strutz, 2010). Thus, (3) becomes:
where R is the total number of replicates, is the estimated variance at each time point and xr(ti) represents the expression value of replicate r at time point i, and all other variables retain their meaning from (3). From first principles, we surmise that we should ‘trust’ time points more if their values are closer together (lower variance) rather than far apart (higher variance).
2.3 Estimating goodness of fit
Once the parameters are obtained, we determine goodness of fit by computing the P-value using Kendall’s tau correlation coefficient, which measures the concordance between two series of data. In this case, we compare the fitted data values y = (y1,…, yn) to the experimental data values x = (x1,…, xn), with n corresponding to the total number of data points in the series. Then Kendall’s τ is measured as follows (Hutchison et al., 2015):
where sgn(x) is 1 if x is positive and –1 if x is negative. The numerator corresponds to the number of pairs that vary concordantly minus the number that vary discordantly. The denominator corresponds to the total amount of comparisons, such that τ is normalized to be between –1 and 1. P-values are calculated using the exact Kendall’s tau statistic. P-values are then adjusted, either using the Benjamini-Hochberg or Benjamini-Yekutieli criteria to account for multiple hypothesis testing, and evaluated for significance using a 0.05 cutoff.
2.4 Identifying the harmonics of oscillating elements
Once a fit is determined to be significant, the rhythm is categorized based on its value of the amplitude change coefficient (γ). We determined empirically that if 0.15 ≥ γ ≥ 0.03, the rhythm should be categorized as damped; if –0.15 ≤ γ ≤-0.03 the rhythm should be categorized as forced; if –0.03 ≤ γ ≤ 0.03, the rhythm should be categorized as harmonic, though we feel that this determination may be dependent upon the noise in the data (see further discussion in Supplementary Section S3, Supplementary Figs S1A–C and S2A). Should γ be less than –0.15 or greater than 0.15 for a specific rhythm, the gene is considered to be overexpressed or repressed, respectively (Supplementary Figs S1D and E and S2B and C). Rhythms with these magnitudes of γ are not considered to be circadian, as their expression patterns more accurately represent a sharp increase or decrease in the amplitude with a small amount of noise rather than an oscillation over time (Supplementary Section S3).
2.5 The Extended Circadian Harmonic Oscillator (ECHO) application
We created an ECHO interface which allows researchers to both identify rhythms and visualize their results (Supplementary Section S4.1, Supplementary Fig. S3), available on GitHub (https://github.com/delosh653/ECHO) and as an R package through CRAN (De los Santos et al., 2019a). The ECHO application allows for the use of a variety of preprocessing techniques. However, preprocessing, as with any editing of values, will likely change the estimated parameter values (Supplementary Section S4.2). ECHO’s interface allows for searches for rhythms of any period length up to the total length of the time course, a ‘free run’. (Supplementary Fig. S4A and B). Free runs also prevent suboptimal rhythms from being detected at a specified lower or higher period bound, when their optimal periods fit outside of the user specified range (Supplementary Section S4.3, Fig. 4C and D). It should be noted that the ECHO method works with any numerical data, including standard genome-wide data analysis techniques, such as microarray and RNA-seq, as well as longer time courses, such as real-time luciferase assays.
Fig. 4.

Gene Ontological analysis suggests specific biological functions for damped, forced and harmonic CCEs. All transcriptomic data (microarray and RNA-seq derived) were included in a meta-analysis of Gene Ontologies. All significant (FDR adjusted P-value < 0.1) ontology subcategories were grouped by parent hierarchical term and the total number of CCEs in the corresponding categories are shown above in bar graphs. Heat maps show the enrichment P-value for the subcategories from a given parent ontology. Ontological subcategories are classified by their AC coefficient group, with exact false discovery rates given in Supplementary Table S1
3 Results
3.1 ECHO exceeds current methodologies in rhythm and phase detection
To evaluate the capabilities of ECHO as compared to existing approaches (Hughes et al., 2010; Wu et al., 2016), we applied ECHO, JTK and MetaCycle to synthetically generated datasets with circadian and non-circadian data (Supplementary Section S5.1) and calculated the area under the receiver operating characteristic (ROC) curve (AUC) for all three programs. We utilized two basic synthetic dataset structures, one that consisted of a realistic circadian to noncircadian ratio and total number of genes (ratio of circadian: non-circadian of 1:4, 10 000 total expression patterns), and one that allowed us to examine the effects of multiple hypothesis testing (ratio of circadian: non-circadian of 1:1, 4000 total expression patterns). Within each of these datasets, we further varied the noise levels (low, medium and high), the time point resolution (2, 4 and 6 h), and the type of circadian Amplitude Change (AC) categories (damped, forced and harmonic) that were associated with each of the gene expression patterns.
In the dataset with a circadian to non-circadian ratio of 1:4, a damped AC coefficient, low level of noise and high resolution sampling, each of the three programs performed well (Fig. 1A, Supplementary Table S1). However, as noise increased and resolution decreased to levels similar to what is seen in the literature, ECHO outperformed JTK and MetaCycle (Fig. 1A, Supplementary Table S1). To explore the effects of multiple hypothesis testing on ECHO, we examined the 1:1 circadian to non-circadian ratio dataset with ECHO. As in the 1:4 dataset, ECHO strongly outperformed the other two analysis methods (Supplementary Table S4).
Fig. 1.
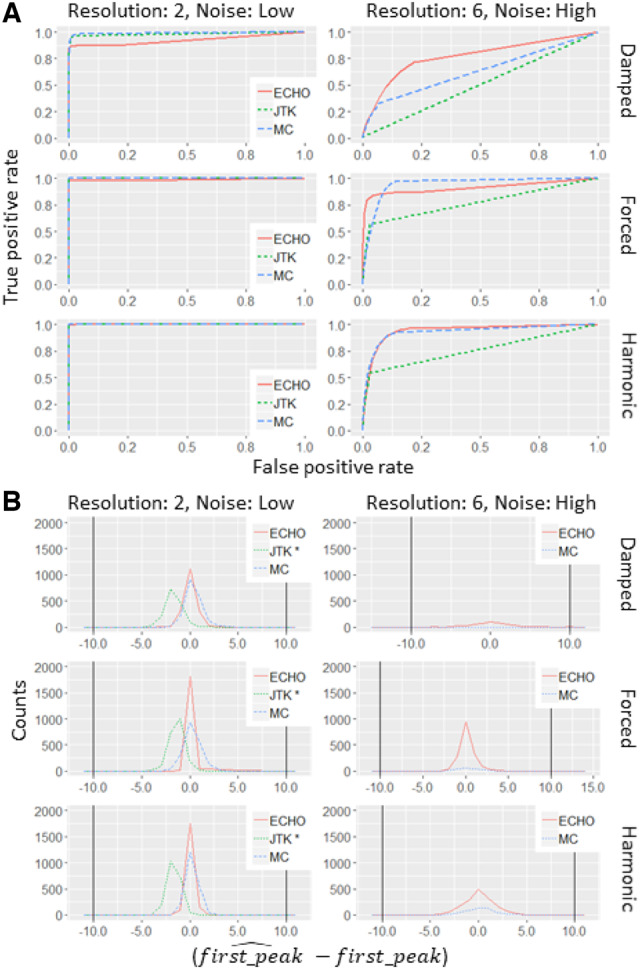
ROC curves demonstrate that ECHO robustly detects oscillations and precisely defines period. (A) ROC curves for ECHO, JTK and MetaCycle when analyzing expression patterns with low noise and 2-h resolution or high noise and 6-h resolution with amplitude change coefficients which fall into the damped, forced and harmonic ranges, respectively, in a dataset with a 1:4 circadian to non-circadian ratio. (B) Frequency polygon plots for ECHO, JTK and MetaCycle when analyzing phase in data with low noise and 2-h resolution or high noise and 6-h resolution with amplitude change coefficients which fall into the damped, forced and harmonic ranges, respectively, in a dataset with a 1:4 circadian to non-circadian ratio. ECHO, the ECHO method; JTK, the JTK_CYCLE method; MC, the MetaCycle method
In the case of the forced and harmonic AC coefficient datasets, at low noise and high resolution, JTK, MetaCycle and ECHO all maintained similar AUC scores in both the 1:4 and 1:1 datasets (Fig. 1A, Supplementary Tables S2, S3, S5 and S6). As the noise was increased and the resolution decreased, ECHO demonstrated similar and slightly higher AUC scores than MetaCycle, and ECHO and MetaCycle consistently outperformed JTK (Fig. 1A, Supplementary Tables S2, S3, S5 and S6). In the cases where ECHO did not have the highest AUC, it was numerically very similar to the highest, being no more than 0.08 from the AUC highest score (Supplementary Tables S1–S6).
We tested the accuracy of each program to recover phase by computing the difference between the predicted phase shift from each program and the original generated phase shift for detected circadian genes with a BH-adjusted P-value cutoff of 0.05 (Supplementary Section S5.1). For our 1:4 ratio data, both ECHO and MetaCycle have distributions centered around 0 with a relatively low spread (Fig. 1B;Supplementary Figs S5–S7A). This spread increases with noise and resolution, regardless of amplitude change coefficient category, though ECHO consistently recovers more circadian genes than MetaCycle. JTK, however, has a distribution centered between −1 and −2 with a low spread, indicating that JTK consistently underestimates phase. It also identifies far fewer circadian genes than ECHO and MetaCycle, to the point that at high noises and resolutions, no synthetic circadian expression patterns are recovered by JTK. We noted that ECHO retains accuracy and continues to identify circadian genes at high noise and wider hour resolution for damped genes, and maintains this robustness for all amplitude change coefficient categories. In our 1:1 ratio data, ECHO, MetaCycle and JTK identify phase and gene numbers similar to the 1:4 ratio dataset; these observations are consistent with the observations from our ROC curves (Fig. 1B;Supplementary Figs S5–S7B).
We examined the false discovery rates (FDRs) and true positive rates (TPRs) for each method at a 1:1 ratio of circadian to noncircadian genes at a BH-adjusted cutoff of 0.05, as well as several other BH-adjusted cutoffs and ratios (Supplementary Sections S5.1, S6.1.3, Supplementary Figs 8–10, Supplementary Tables S2–S4). We observed that under optimal conditions (low noise and high resolution), ECHO’s FDR in the damped, forced and harmonic subsets averaged 5.9%, while at sub-optimal conditions (high noise and low resolution), ECHO’s FDR averaged 12.8%. Compared to JTK and MetaCycle, ECHO’s FDR was higher (JTK 0.22 and 0% and MetaCycle 1 and 5.8%, respectively). However, ECHO’s TPR was substantially higher than that of JTK and MetaCycle, particularly in the damped category (average TPR over all conditions for damped rhythms: ECHO 66.7%, JTK 20.1%, MetaCycle 38%) and as noise increased and sample resolution decreased (average TPR for rhythms at high noise and 6-h resolution over all AC categories: ECHO 72%, JTK 0%, MetaCycle 23.8%). This suggests that, under common experimental conditions and for damped rhythms, ECHO’s higher FDR, as compared to JTK and MetaCycle, is counterbalanced by ECHO’s improved TPR. However, we recommend that users select their BH-adjusted cutoffs dependent on sample quality and quantity, lowering BH-adjusted cutoffs to reduce the amount of false positives if necessary.
3.2 ECHO analysis with biological data reveals extent and sources of damping and forcing
To demonstrate ECHO’s increased efficiency and determine the extent of damping in circadian networks, we applied ECHO to publicly available 48-h time course transcriptomic and proteomic datasets gathered from Neurospora crassa (Supplementary Sections S5.2, S6.2, S6.3) (Hurley et al., 2014, 2018). Of the 4747 Neurospora proteins that were detected by tandem mass tag mass spectrometry, ECHO identified 2146 CCEs, 935 (43.6%) of which were damped, 594 (27.7%) were forced and 617 (28.8%) were harmonic (Fig. 2A). From the Neurospora transcriptome, ECHO identified 6685 CCEs with a comparable proportion of harmonic CCEs (32.7%), a lower proportion of forced CCEs (16.0%) and a higher proportion of damped CCEs (51.3%)(Fig. 2B, Supplementary Fig. S11A) as compared to the proteome. Of note, multiple circadian clock genes were identified as damped (Supplementary Fig. S12, Supplementary Section S6.5). To examine if damping/forcing of genes at the transcriptional level is also reflected at the translational level, we created a confusion matrix of CCEs that were detected and modeled in both datasets. In addition to the damped transcripts that were not rhythmic (29.3%), or damped/repressed at protein level as expected (38.6%), a comparable proportion were also found to be harmonic, forced or overexpressed (31.9%) despite damping at the transcriptional level (Supplementary Table S7). These differences between the proportion of damped and forced CCEs at the transcriptional and post-transcriptional levels suggested that there is extensive differential regulation of CCE expression by the circadian system to generate damping or forcing in a directed manner.
Fig. 2.
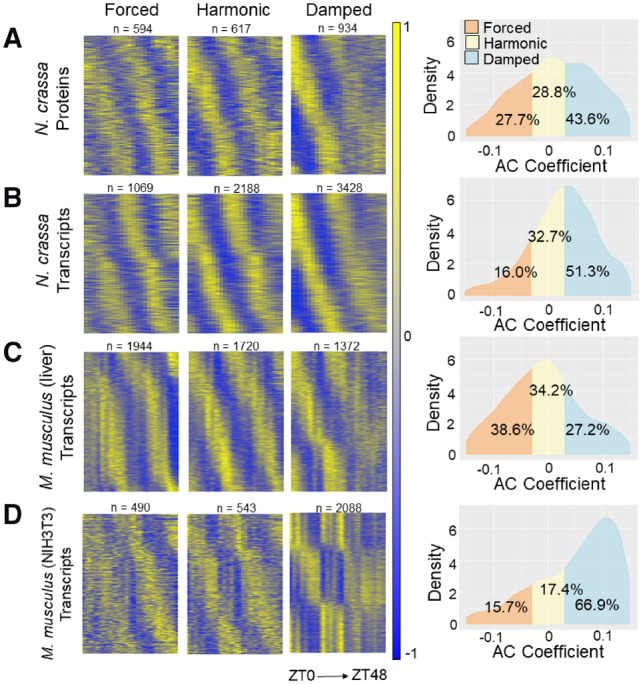
The ratio of harmonic to damped to forced CCEs depends on sampling conditions. Heatmaps and AC coefficient density graphs of the CCEs determined by ECHO to be circadian in (A) the N. crassa proteome (Hurley et al., 2018), (B) the N. crassa transcriptome (Hurley et al., 2014), (C) the M. musculus liver transcriptome (Hughes et al., 2009) and (D) the M. musculus NIH3T3 transcriptome (Hughes et al., 2009). For each dataset, the heat maps show mean-centered normalized expression values at a given time point for the transcripts that fall into the AC coefficient categories damped, forced or harmonic, and are sorted vertically by phase
When we compared the ECHO analysis of the Neurospora transcriptome with a JTK analysis of the same transcriptomic data, we found that ECHO identified 882 CCEs in addition to the 7441 CCEs identified by both ECHO and JTK, including those considered overexpressed or repressed by ECHO. Only 397 CCEs found by JTK were not encompassed by ECHO. Of the 882 CCEs missed by JTK, the majority, 62.2%, were determined by ECHO to be damped, 24.8% were forced and 12.9% harmonic, which is consistent with our synthetic data finding that ECHO has an improved capability to detect damped gene expression patterns that cannot be detected with existing methods, identifying many additional CCEs.
We hypothesized that the environmental conditions under which the samples were acquired may impact the AC of output genes, as the Neurospora time course was sampled in a depleting media condition. Therefore, we analyzed a high-resolution transcriptomic analysis of pooled liver samples taken in vivo from mice in complete darkness and compared the ratio of damped/forced/harmonic CCEs to an in vitro transcriptomic time course with NIH3T3 mouse fibroblast cells acquired with identical depth/duration of sampling (Hughes et al., 2009). In the mouse liver dataset, a total of 20 662 liver transcripts were analyzed by ECHO and 5036 were identified to be CCEs (Fig. 2C). The majority of CCEs were classified as forced (38.6%), 34.2% classified as harmonic and only 27.2% classified as damped. In contrast, the NIH3T3 time course had more than double the proportion of damped CCEs (66.9%), and far smaller proportions of harmonic (17.4%) and forced (15.7%) CCEs (Fig. 2D). Though these are very different tissue types, the overall trends indeed suggest that nutrient sensing mechanisms are integrated with the clock to globally dampen rhythmic gene expression in nutrient limited conditions.
To probe additional environmental sources that may impact the damping/forcing ratio, and because we noted a strong correlation between the light response and damped CCEs, we investigated the influence of light entrainment cues on circadian output AC. We focused on two transcriptomic time courses done in Anopheles gambiae that differ only in their lighting schemes: either maintaining a program of 12 h of light followed by 12 h of dark (LD) or complete darkness (DD) throughout the time course (Rund et al., 2011). We identified 2405 CCEs from the DD dataset (Fig. 3A, Supplementary Fig. S11B) and 3.277 CCEs from the LD dataset (Fig. 3B), suggesting that over all, light cues increase the number of CCEs. As would have been expected if continued light entrainment prevents damped and forced rhythms, there was a lower proportion of harmonic CCEs (40.4% versus 55.3%) and a higher proportion of damped CCEs (33.7% versus 21%) in the DD dataset compared to the LD dataset. In addition, the distribution of amplitude change coefficients for each dataset’s CCEs showed a wider spread in DD (1st quartile: −0.032, 3rd quartile: 0.044) than in LD (1st quartile: −0.028, 3rd quartile: 0.023), demonstrating that AC is more pronounced in the absence of light entrainment cues (Fig. 3A and B).
Fig. 3.

The ratio of damped, forced and harmonic CCEs varies depending on lighting schemes in Anopheles gambiae. (A and B) Heat maps and AC coefficient density graphs of the transcripts defined as damped, forced or harmonic by ECHO in Anopheles gambiae (mosquito) heads gathered in either complete darkness (DD) (A) or 12:12 Light/Dark (LD) (B) (Rund et al., 2011). (C) A Venn diagram describing the overlap of transcripts found to be rhythmic in Anopheles in DD and LD. (D) A confusion matrix comparing the best fit models (damped, forced and harmonic) for CCEs in Anopheles identified as circadian by ECHO in either DD or LD conditions
To ensure that the increase in CCEs under LD conditions was not due to differences in microarray detection and/or number of transcripts analyzed by ECHO, we confirmed that there were similar numbers of transcripts that were unexpressed (i.e. detected in <70% of time points) or with no deviation (having completely flat expression across the time course). We then investigated the overlap of CCEs between the two lighting conditions and found that the majority of CCEs are rhythmic in both conditions (1751), though there were also some that were rhythmic only under LD conditions (1526) or only under DD conditions (654) (Fig. 3C). To further parse the expression patterns observed for each CCE under one condition compared to the other, we created a confusion matrix for the 3412 total unique CCEs detected and modeled with ECHO in both datasets (Fig. 3D). For the CCEs that were rhythmic in LD, the majority of damped, forced or harmonic CCEs were found to be not rhythmic under DD conditions, indicating that light responsive genes were highly prevalent in all three expression categories. As would be expected if desynchronization were a major factor in damping, many of the forced, damped and harmonic LD CCEs that do not lose rhythmicity, become damped under DD conditions. However, of the CCEs that were forced, harmonic or damped under LD conditions, the largest proportions (128, 449, 130, respectively) remained harmonic under DD conditions, suggesting that most circadian genes in fact do not become acutely damped or forced without synchronization cues and that intercellular desynchronization many not be responsible for circadian damping.
3.3 Meta-analysis of damped, forced and harmonic gene ontologies identifies distinct functions
To identify differences in the functional roles of the AC coefficient categories, we conducted a gene ontology enrichment meta-analysis of the CCEs identified in the four transcriptional datasets tested with ECHO (Supplementary Section S5.3.1). The ontologies enriched in each AC category were found to be highly category-specific and suggestive of distinct functional roles for damping or forcing CCEs (Fig. 4). Distinct functional differences between the forced, damped and harmonic CCEs became apparent in analyzing the enrichment of child-level ontology categories. Out of 247 total unique child ontology terms significant in at least one subset, the majority of terms (65%) were enriched in only one of the damped/forced/harmonic subsets, highlighting the unique specificity of gene functions present in each subset.
We examined the top twenty scoring ontologies unique to each expression pattern to further characterize the divergent biological roles of genes with damping, forcing or harmonic expression (Supplementary Section S6.4). Most notable from the enriched damped CCEs (Supplementary Table S8) were several terms related to protein transport and localization within the cell (intracellular protein transport, localization, regulation of cellular component organization, macromolecule localization), kinase and transferase activity (kinase activity, phosphotransferase activity), transferring alkyl or aryl (other than methyl) groups, as well as transcription (transcription DNA templated, rRNA binding, RNA binding) and ribosome. Alternatively, the ontological categories unique to forced CCEs (Supplementary Table S9) pertained to catalysis of phosphate groups into free phosphate, such as in fatty acid activation (pyrophophatase activity, hydrolase activity, in phosphorus-containing anhydrides). Also uniquely forced were genes involved in RNA processing and translation (mRNA processing, translation, mRNA binding, etc.), and finally ubiquitin-mediated proteolysis (protein ubiquitination, proteasome-mediated ubiquitin-dependent protein catabolic process). Lastly, harmonic CCEs (Supplementary Table S10) were most notably related to macromolecule metabolism (macromolecule metabolic process, hydrolase activity acting on ester bonds, disulfide oxidoreductase activity), ribosome biogenesis (preribosome, rRNA processing, ribosome biogenesis), actin cytoskeleton maintenance (actin binding, cytoskeleton, actin cytoskeleton) and ion transmembrane gradient maintenance (proton transmembrane transporter activity, ion transmembrane transport). The distinctions between the functions of genes found in each category, in particular their unique metabolic functions, hint that environment/nutrient sensing underlies the regulation of circadian damping and forcing as a directed response to metabolize and preserve specific cellular functions efficiently in times of nutrient stress.
3.4 Enriched regulatory motifs suggest transcriptional regulation contributes to damped and forced oscillations in Neurospora crassa
We hypothesized that transcription factor (TF) activity might explain the differential regulation of the forced, harmonic or damped gene expression profiles. We therefore applied Discriminative Regular Expression Motif Elicitation (DREME) analysis (Bailey, 2011) to the promoter regions of the three sets of CCEs identified by ECHO from the Neurospora crassa transcriptomic dataset to determine if there were enriched motifs (Supplementary Section S5.3.2). DREME analysis detected many similar versions of four previously identified circadian motifs (Hurley et al., 2014): STACASTA, GVCAGCCA, GRCGGGA, GCRCTAAC. Of note, the previous STACASTA motif that was enriched for cell cycle processes (Hurley et al., 2014), matches our TACASTA motif that was identified in all three sets of our CCE promoters. When we compared this motif to a database of Neurospora transcription factor binding motifs (Weirauch et al., 2014), we found that it matches a known binding motif for the transcription factor sgr-21 (NCU06173), which is a ‘forkhead’ type transcription factor that is involved in the cell cycle in other fungi (eg. S. cerevisiae, Pramila, 2006) and has a slower growth rate when knocked out in Neurospora (Carrillo et al., 2017).
We also identified several novel motifs that only occurred in either the forced, harmonic or damped gene sets. In the forced gene set, the unique GATAAG motif can be bound by two different transcription factors, nit-2 (NCU09068) and asd-4 (NCU15829), and their orthologs have been shown to co-regulate genes in response to nitrogen levels in Aspergillus nidulans (Fu and Marzluf, 1990; Wong et al., 2009). Meanwhile, the unique harmonic motif, CGGSCGG, could be bound by rrg-2 (NCU02413), an oxidative stress response regulator that like it’s yeast homolog, Skn7, may be regulated by cAMP/PKA (Basenko et al., 2018; Fan et al., 2015; Hanlon et al., 2011; Pérez-Landero et al., 2015; Tian et al., 2011; Weirauch et al., 2014). Finally, a motif that was enriched in the damped gene set only, CCCSKC, encodes a binding site for the transcription factor cre-1 (NCU08807). CRE-1 is involved in carbon catabolite repression (Cupertino et al., 2015; Sun and Glass, 2011; Ziv et al., 2008), and ECHO classified cre-1 as harmonic (BH adjusted P-value = 1.34e-07; Supplementary Fig. S13). Cupertino et al. (2015) identified binding motifs for CRE-1 within genes involved in glycogen metabolism, including gsn (NCU06687), gdn (NCU00743), gnn (NCU06698), gbn (NCU05429) (all down-regulated by CRE-1) and gpn (NCU07027) (up-regulated by CRE-1) (Cupertino et al., 2015). Importantly, our ECHO analysis confirmed that known targets of CRE-1 repression were identified as either damped or repressed, (gdn, gnn and gbn), while a known target of CRE-1 activation, gpn, was up-regulated and classified as forced (Supplementary Fig. S13). The gene expression for gsn which is predicted to be down-regulated was considered harmonic, but it is known to be further regulated by phosphorylation (Cupertino et al., 2015) and also shows a slightly decreasing amplitude over time (AC coefficient = 0.0043).
4 Discussion and conclusion
Guidelines outlined by the circadian community for the analysis of genome-scale experiments emphasizes the need for robust models to identify rhythmic expression patterns (Hughes et al., 2017). By including the amplitude change coefficient (2), ECHO answers this call by providing an easy-to-use, enhanced approach to detect circadian patterns in large datasets, providing a freely available point-and-click application with visualization and exploration tools rather than the standard code tutorial (Supplementary Fig. S3). This approach enhancement is verified by both ECHO’s superior recovery of circadian rhythms from synthetic data and previously published biological data (Figs 1–3), its robustness to noise, resolution and multiple hypothesis testing (Fig. 1), and its ability to provide the amplitude change coefficient (Supplementary Fig. S1).
Strikingly, ECHO’s extensive identification of damped and forced rhythms suggests a previously unforeseen impact of circadian damping. We also found the overall proportion of damped transcripts as compared to forced or harmonic transcripts was dependent on the environmental conditions in which the samples were collected; e.g. nutrient depletion increased damping (Fig. 2). This finding corresponded with the observation that metabolic regulation can have a strong impact on the circadian clock and suggests novel ways that the clock interacts with its environment (Eckel-Mahan and Sassone-Corsi, 2013). However, as the proteome revealed less bias towards damping at the protein level than observed in their corresponding transcripts, this demonstrates that a large proportion of CCEs that are damped at the transcriptional level are buffered at the translational level by currently unknown mechanisms, as has been previously predicted (Hurley et al., 2018). The corresponding changes in mRNA degradation and translation rates for these genes would need to be further investigated in exploring whether this resistance to damping is derived from gene-specific or global mechanisms. ECHO would be a valuable tool in accomplishing such future work.
When we examine the roles of circadian entrainment cues, i.e. light, in the damping and forcing of output, we found that the lack of continued entrainment significantly impacted the downstream regulation of circadian output, further highlighting how the environmental state of the organism can impact its circadian output (Fig. 3) (Rund et al., 2011). However, we found that many of the rhythmic genes in LD were more strongly influenced by light, as opposed to circadian regulation, as they were not rhythmic under DD conditions. Of those in LD that were harmonic, a large majority remained harmonic in DD, supporting that the loss of entrainment cues does not acutely result in global damping of CCEs via intercellular desynchronization. Further, when comparing all datasets analyzed with ECHO representing a variety of organisms, tissues and 48-h experimental designs (Table 1), we found that experiments done in a static artificial media have higher proportions of damped CCEs than experiments done under conditions where organisms had access to nutrients Ad Libitum regardless of their lighting conditions. This indicated that the loss of nutrients has a greater impact on the global proportion of damping of CCEs than a loss of light-based entrainment cues.
Table 1.
Proportions of damped/harmonic/forced CCEs vary by experimental conditions
| Nutrient availability |
Ad Libitum
|
Static artificial media
|
||||
|---|---|---|---|---|---|---|
| Organism |
Mus musculus (Liver)
|
Anopheles gambiae (Heads)
|
Neurospora crassa
|
Mus musculus (NIH3T3 Fibroblasts)
|
||
| Zeitgeber scheme |
DD |
LD |
DD |
Forskolin synchronized |
||
| Technique | Microarray | RNA-seq | TMT-MS | Microarray | ||
| # Circadian genes | 5036 | 2405 | 3277 | 6685 | 2146 | 3121 |
| % Forced | 38.6 | 25.9 | 23.7 | 16.0 | 27.7 | 15.7 |
| % Harmonic | 34.2 | 40.4 | 55.3 | 32.7 | 28.8 | 17.4 |
| % Damped | 27.2 | 33.7 | 21.0 | 51.3 | 43.6 | 66.9 |
Note: Comparisons between relative number of CCEs found to be damped, forced or harmonic, separated by experimental condition and organisms.
The observation of an impact on circadian output by the environment of the organism is bolstered by the distinct gene ontologies enriched in damped, forced or harmonic transcripts (Fig. 4). While the damping and forcing of presumably different cellular functions and metabolic pathways is indicative of a response to an environment with increasing stress from nutrient loss, of interest are the categories of genes that remain robustly harmonic. The harmonic preservation of genes involved in ribosome biogenesis, metabolism of macromolecules, ion transmembrane transport and actin cytoskeleton suggests a biological advantage to ensuring that these functions remain robust in all conditions. Alternatively, genes that dampen over time are involved in localization and bulk transcription and translation, suggesting that in order to preserve energy efficiently, it is advantageous to damp processes like localization and transcription/translation machinery when undergoing nutrient stress. Finally, genes that demonstrate forced expression over time involve the processing of mRNA, activation of fatty acids and protein degradation, indicating that maintaining these processes ensures efficient, selective gene transcription and utilization of energy stored in fatty acids and proteins. Further, forced processes facilitate the robust degradation and recycling of protein and fatty acids, whereas harmonic processes serve to continue maintaining essential central macromolecular metabolic processes, ion gradients, cellular structure and pre-processing mRNA and creating ribosomes to ensure continued efficient expression of critical genes. Taken together, the distribution of these unique categories indicates that through damping/forcing/harmonic circadian regulation there is a built-in fine tuning of cellular processes to adapt advantageously to environmental changes. Thus, separate ontological consideration of AC categories is essential, and tools, such as ENCORE, which consider these categories separately, are vital to circadian analysis (De los Santos et al., 2019b).
Our DREME analysis on the Neurospora transcriptome suggests that Neurospora is using transcriptional programming to integrate environmental cues into circadian output (Hanlon et al., 2011). Indeed, the activity of some of these transcription factors, such as RRG-2 and CRE-1, are regulated by conserved signaling pathways, suggesting again that forced or damped gene expression could be the outcome of sensed changes in the environment (e.g. Pérez-Landero et al., 2015). As we know there is a connection between the clock and MAPK signaling, as well as some evidence for an interconnection between the clock and cAMP-PKA signaling, further studies using ECHO could help elucidate the important contributions of these and other signaling pathways to damped and forced circadian expressions (de Paula et al., 2008; Liu et al., 2015; O’Neill et al., 2008).
In summary, we have demonstrated that ECHO analysis is a powerful tool to not only identify previously undetectable oscillations in genome-scale circadian datasets but also allows the user to gain insights into the architecture of the circadian system’s control of gene regulation and integration with environmental cues. Moreover, as ECHO is able to identify rhythms of almost any period (Supplementary Fig. S4), we predict that this easy-to-use application will allow a broad community to investigate the underlying principles of environmental signaling in biological rhythms.
Supplementary Material
Acknowledgements
We would like to thank Carol Ringelberg for her guidance and expertise in pre-processing of microarray data. We would also like to thank Thomas Willemain for his statistical expertise, and Chendi Guan and Kristin Pratt for their assistance in developing and testing the ECHO application.
Funding
This work was supported by the National Institutes of Health (NIBIB U01 EB022546, NIGMS R35 GM128687 to J.H., T32GM067545 to E.C.); the Department of Energy (PNNL 47818 to J.H.); Rensselaer Polytechnic Institute (to J.H. and H.D.l.S.); and the National Science Foundation (#1331023 to K.B.).
Conflict of Interest: none declared.
References
- Antle M.C., Silver R. (2005) Orchestrating time: arrangements of the brain circadian clock. Trends Neurosci., 28, 145–151. [DOI] [PubMed] [Google Scholar]
- Aton S.J. et al. (2005) Vasoactive intestinal polypeptide mediates circadian rhythmicity and synchrony in mammalian clock neurons. Nat. Neurosci., 8, 476.. [DOI] [PMC free article] [PubMed] [Google Scholar]
- Bailey T.L. (2011) DREME: motif discovery in transcription factor ChIP-seq data. Bioinformatics, 27, 1653–1659. [DOI] [PMC free article] [PubMed] [Google Scholar]
- Basenko E. et al. (2018) FungiDB: an integrated bioinformatic resource for fungi and oomycetes. J. Fungi, 4, 39.. [DOI] [PMC free article] [PubMed] [Google Scholar]
- Beer K. et al. (2017) A damping circadian clock drives weak oscillations in metabolism and locomotor activity of aphids (Acyrthosiphon pisum). Sci. Rep., 7, [DOI] [PMC free article] [PubMed] [Google Scholar]
- Canty A., Ripley B.D. (2019) boot: Bootstrap R (S-Plus) Functions. R package version 1.3-22.
- Carrillo A.J. et al. (2017) Functional profiling of transcription factor genes in Neurospora crassa. G3 Genes Genomes Genet., 7, 2945–2956. [DOI] [PMC free article] [PubMed] [Google Scholar]
- Cupertino F.B. et al. (2015) Regulation of glycogen metabolism by the CRE-1, RCO-1 and RCM-1 proteins in Neurospora crassa. The role of CRE-1 as the central transcriptional regulator. Fungal Genet. Biol., 77, 82–94. [DOI] [PubMed] [Google Scholar]
- Davison A.C., Hinkley D.V. (1997) Bootstrap Methods and Their Applications. Cambridge University Press, Cambridge. [Google Scholar]
- De los Santos H. et al. (2017) Circadian rhythms in neurospora exhibit biologically relevant driven and damped harmonic oscillations In: Proceedings of the 8th ACM International Conference on Bioinformatics, Computational Biology, and Health Informatics, ACM-BCB ’17, pp. 455–463. ACM, New York, NY, USA. [DOI] [PMC free article] [PubMed] [Google Scholar]
- De los Santos H. et al. (2019a) Finding Rhythms Using Extended Circadian Harmonic Oscillators (ECHO). Journal of Statistical Software R package version 2.0.
- De los Santos H. et al. (2019b). Encore: a visualization tool for insight into circadian omics In: Proceedings of the 10th ACM International Conference on Bioinformatics, Computational Biology and Health Informatics, ACM-BCB ’19. ACM, New York, NY, USA. [DOI] [PMC free article] [PubMed] [Google Scholar]
- de Paula R.M. et al. (2008) A connection between MAPK pathways and circadian clocks. Cell Cycle (Georgetown, Tex.), 7, 2630–2634. [DOI] [PMC free article] [PubMed] [Google Scholar]
- Decoursey P.J. et al. (1997) Circadian performance of suprachiasmatic nuclei (SCN)-lesioned antelope ground squirrels in a desert enclosure. Physiol. Behav., 62, 1099–1108. [DOI] [PubMed] [Google Scholar]
- Dunlap J.C. (1999) Molecular bases for circadian clocks. Cell, 96, 271–290. [DOI] [PubMed] [Google Scholar]
- Eckel-Mahan K., Sassone-Corsi P. (2013) Metabolism and the circadian clock converge. Physiol. Rev., 93, 107–135. [DOI] [PMC free article] [PubMed] [Google Scholar]
- Elzhov T.V. et al. (2016) minpack.lm: R Interface to the Levenberg-Marquardt Nonlinear Least-Squares Algorithm Found in MINPACK, Plus Support for Bounds. R package version 1.2-1.
- Eser P. et al. (2014) Periodic mRNA synthesis and degradation co-operate during cell cycle gene expression. Mol. Syst. Biol., 10, 717.. [DOI] [PMC free article] [PubMed] [Google Scholar]
- Evans J.A., Davidson A.J. (2013) Health consequences of circadian disruption in humans and animal models. In: Gillette,M.U. (ed.) Progress in Molecular Biology and Translational Science. Academic Press, Vol. 119, pp. 283–323. doi: 10.1016/B978-0-12-396971-2.00010-5. [DOI] [PubMed]
- Fan F. et al. (2015) Genome-wide analysis of the endoplasmic reticulum stress response during lignocellulase production in Neurospora crassa. Biotechnol. Biofuels, 8, 66.. [DOI] [PMC free article] [PubMed] [Google Scholar]
- Fu Y.H., Marzluf G.A. (1990) nit-2, the major nitrogen regulatory gene of Neurospora crassa, encodes a protein with a putative zinc finger DNA-binding domain. Mol. Cell. Biol., 10, 1056–1065. [DOI] [PMC free article] [PubMed] [Google Scholar]
- Hanlon S.E. et al. (2011) The stress response factors Yap6, Cin5, Phd1, and Skn7 direct targeting of the conserved co-repressor Tup1-Ssn6 in S. cerevisiae. PLoS One, 6, e19060.. [DOI] [PMC free article] [PubMed] [Google Scholar]
- Horikawa K. et al. (2005) Rapid damping of food-entrained circadian rhythm of clock gene expression in clock-defective peripheral tissues under fasting conditions. Neuroscience, 134, 335.. [DOI] [PubMed] [Google Scholar]
- Hughes M.E. et al. (2009) Harmonics of circadian gene transcription in mammals. PLoS Genet., 5, e1000442.. [DOI] [PMC free article] [PubMed] [Google Scholar]
- Hughes M.E. et al. (2010) JTK-CYCLE: an efficient nonparametric algorithm for detecting rhythmic components in genome-scale data sets. J. Biol. Rhythms, 25, 372.. [DOI] [PMC free article] [PubMed] [Google Scholar]
- Hughes M.E. et al. (2017) Guidelines for Genome-Scale Analysis of Biological Rhythms. J. Biol. Rhythms, 32, 380–393. [DOI] [PMC free article] [PubMed] [Google Scholar]
- Hurley J.M. et al. (2014) Analysis of clock-regulated genes in Neurospora reveals widespread posttranscriptional control of metabolic potential. Proc. Natl. Acad. Sci. USA, 111, 16995.. [DOI] [PMC free article] [PubMed] [Google Scholar]
- Hurley J.M. et al. (2016) Circadian oscillators: around the transcription–translation feedback loop and on to output. Trends Biochem Sci, 41, 834–846. [DOI] [PMC free article] [PubMed] [Google Scholar]
- Hurley J.M. et al. (2018) Circadian proteomic analysis uncovers mechanisms of post-transcriptional regulation in metabolic pathways. Cell Syst., 7, 613.. [DOI] [PMC free article] [PubMed] [Google Scholar]
- Hutchison A.L. et al. (2015) Improved statistical methods enable greater sensitivity in rhythm detection for genome-wide data. PLoS Comput. Biol., 11, e1004094.. [DOI] [PMC free article] [PubMed] [Google Scholar]
- Jang C. et al. (2015) Ribosome profiling reveals an important role for translational control in circadian gene expression. Genome Res., 25, 1836.. [DOI] [PMC free article] [PubMed] [Google Scholar]
- Klarsfeld A., Rouyer F. (1998) Effects of circadian mutations and LD periodicity on the life span of drosophila melanogaster. J. Biol. Rhythms, 13, 471–478. [DOI] [PubMed] [Google Scholar]
- Kowalska E., Brown S.A. (2007) Peripheral clocks: keeping up with the master clock. Cold Spring Harbor Symp. Quant. Biol., 72, 301.. [DOI] [PubMed] [Google Scholar]
- Levi F. et al. (2010) Circadian timing in cancer treatments. Annu. Rev. Pharmacol. Toxicol, 50, 377–421. [DOI] [PubMed] [Google Scholar]
- Liu X. et al. (2015) Role for protein kinase A in the neurospora circadian clock by regulating white collar-independent frequency transcription through phosphorylation of RCM-1. Mol. Cell. Biol., 35, 2088.. [DOI] [PMC free article] [PubMed] [Google Scholar]
- Loros J.J. et al. (2007) Circadian output, input, and intracellular oscillators: insights into the circadian systems of single cells. Cold Spring Harbor Symp. Quant. Biol., 72, 201.. [DOI] [PMC free article] [PubMed] [Google Scholar]
- Menet J.S. et al. (2012) Nascent-seq reveals novel features of mouse circadian transcriptional regulation. eLife, 1, e00011. doi: 10.7554/eLife.00011. [DOI] [PMC free article] [PubMed] [Google Scholar]
- Mure L.S. et al. (2018) Diurnal transcriptome atlas of a primate across major neural and peripheral tissues. Science, 359, eaao0318.. [DOI] [PMC free article] [PubMed] [Google Scholar]
- O’Neill J.S. et al. (2008) cAMP-dependent signaling as a core component of the mammalian circadian pacemaker. Science, 320, 949–53. [DOI] [PMC free article] [PubMed] [Google Scholar]
- Ouyang Y. et al. (1998) Resonating circadian clocks enhance fitness in cyanobacteria. Proc. Natl. Acad. Sci., 95, 8660–8664. [DOI] [PMC free article] [PubMed] [Google Scholar]
- Partch C.L. et al. (2014) Molecular architecture of the mammalian circadian clock. Trends Cell Biol., 24, 90–99. [DOI] [PMC free article] [PubMed] [Google Scholar]
- Pérez-Landero S. et al. (2015) Complex regulation of Hsf1-Skn7 activities by the catalytic subunits of PKA in Saccharomyces cerevisiae: experimental and computational evidences. BMC Syst. Biol., 9, 42.. [DOI] [PMC free article] [PubMed] [Google Scholar]
- Pigolotti S. et al. (2007) Oscillation patterns in negative feedback loops. Proc. Natl. Acad. Sci. USA, 104, 6533–6537. [DOI] [PMC free article] [PubMed] [Google Scholar]
- Pramila T. (2006) The forkhead transcription factor hcm1 regulates chromosome segregation genes and fills the s-phase gap in the transcriptional circuitry of the cell cycle. Genes Dev., 20, 2266–2278. [DOI] [PMC free article] [PubMed] [Google Scholar]
- Ralph M.R. et al. (1990) Transplanted suprachiasmatic nucleus determines circadian period. Science, 247, 975.. [DOI] [PubMed] [Google Scholar]
- Robles M.S. et al. (2014) In-vivo quantitative proteomics reveals a key contribution of post-transcriptional mechanisms to the circadian regulation of liver metabolism. PLoS Genet., 10, e1004047.. [DOI] [PMC free article] [PubMed] [Google Scholar]
- Rodriguez J. et al. (2012) Nascent-seq indicates widespread cotranscriptional RNA editing in drosophila. Mol. Cell, 47, 27.. [DOI] [PMC free article] [PubMed] [Google Scholar]
- Rund S.S.C. et al. (2011) Genome-wide profiling of diel and circadian gene expression in the malaria vector Anopheles gambiae. Proc. Natl. Acad. Sci. USA, 108, E421–E430. [DOI] [PMC free article] [PubMed] [Google Scholar]
- Strutz T. (2010) Data Fitting and Uncertainty: A Practical Introduction to Weighted Least Squares and Beyond. Vieweg and Teubner, Germany. [Google Scholar]
- Sun J., Glass N.L. (2011) Identification of the CRE-1 cellulolytic regulon in Neurospora crassa. PLoS One, 6, e25654.. [DOI] [PMC free article] [PubMed] [Google Scholar]
- Tian C. et al. (2011) Exploring the bZIP transcription factor regulatory network in Neurospora crassa. Microbiology, 157, 747–759. [DOI] [PMC free article] [PubMed] [Google Scholar]
- Tseng Y.Y. et al. (2012) Comprehensive modelling of the Neurospora circadian clock and its temperature compensation. PLoS Comput. Biol., 8, e1002437.. [DOI] [PMC free article] [PubMed] [Google Scholar]
- Wang J. et al. (2017) Nuclear proteomics uncovers diurnal regulatory landscapes in mouse liver. Cell Metab., 25, 102.. [DOI] [PMC free article] [PubMed] [Google Scholar]
- Weirauch M.T. et al. (2014) Determination and inference of eukaryotic transcription factor sequence specificity. Cell, 158, 1431–1443. [DOI] [PMC free article] [PubMed] [Google Scholar]
- Westermark P.O. et al. (2009) Quantification of circadian rhythms in single cells. PLoS Comput. Biol., 5, e1000580.. [DOI] [PMC free article] [PubMed] [Google Scholar]
- Wong K.H. et al. (2009) Deletion and overexpression of the Aspergillus nidulans GATA factor AreB reveals unexpected pleiotropy. Microbiology, 155, 3868–3880. [DOI] [PubMed] [Google Scholar]
- Wu G. et al. (2016) MetaCycle: an integrated R package to evaluate periodicity in large scale data. Bioinformatics, 32, 3351.. [DOI] [PMC free article] [PubMed] [Google Scholar]
- Yamazaki S. et al. (2000) Resetting central and peripheral circadian oscillators in transgenic rats. Science, 288, 682.. [DOI] [PubMed] [Google Scholar]
- Ziv C. et al. (2008) Carbon source affects PKA-dependent polarity of Neurospora crassa in a CRE-1-dependent and independent manner. Fungal Genet. Biol., 45, 103–116. [DOI] [PubMed] [Google Scholar]
Associated Data
This section collects any data citations, data availability statements, or supplementary materials included in this article.