

Abstract
Objective.
To develop and validate an expanded obstetric comorbidity score for predicting severe maternal morbidity (SMM) that can be applied consistently across contemporary U.S. patient discharge datasets.
Methods.
Discharge data from birth hospitalizations in California during 2016–2017 were used to develop the score. The outcomes were SMM, defined using the CDC index, and non-transfusion SMM (excluding cases where transfusion was the only indicator of SMM). We selected 27 potential patient-level risk factors for SMM, identified using ICD-10-CM diagnosis codes. We used a targeted causal inference approach integrated with machine learning to rank the risk factors based on adjusted risk ratios (aRR). We used these results to assign scores to each comorbidity, which sum to a single numeric score. We validated the score in California and national data sets and compared the performance to that of a previously developed obstetric comorbidity index.
Results.
Among 919,546 births, the rates of SMM and non-transfusion SMM were 168 and 74 per 10,000 births, respectively. The highest risk comorbidity was placenta accreta spectrum (aRR of 30.5 for SMM and 54.7 for non-transfusion SMM) and the lowest was gestational diabetes mellitus (aRR of 1.06 for SMM and 1.12 for non-transfusion SMM). Normalized scores based on the aRR were developed for each comorbidity, which ranged from 1–59 points for SMM and from 1–36 points for non-transfusion SMM. The overall performance of the expanded comorbidity scores was good (C-statistics were 0.78 for SMM and 0.84 for non-transfusion SMM in California data and 0.82 and 0.87, respectively, in national data) and improved upon prior comorbidity indexes developed for obstetric populations. Calibration plots showed good concordance between predicted and actual risks of the outcomes.
Conclusion.
We developed and validated an expanded obstetric comorbidity score to improve comparisons of SMM rates across patient populations with different comorbidity case mixes.
Précis
We developed and validated an expanded obstetric comorbidity score to improve comparisons of severe maternal morbidity rates across patient populations with different comorbidity case mixes.
Introduction
Severe maternal morbidity (SMM) has emerged over the past several years as a promising measure for surveillance and quality improvement in obstetrics.1–3 In 2012, the U.S. Centers for Disease Control and Prevention (CDC) and its partners created an index of indicators to identify SMM consistently across administrative data using International Classification of Diseases Clinical Modification (ICD-CM) diagnosis and procedure codes.4 The current version of the SMM index includes 21 indicators of specific, well-defined severe events during birth hospitalization, such as sepsis, acute renal failure, and hysterectomy.4 The SMM index has been widely used in research, surveillance, and quality improvement projects;2–8 however, preexisting comorbidities strongly affect the risk of SMM,5,9 necessitating a sufficient adjustment strategy to compare SMM rates across patient populations.
Comorbidity indices are widely used tools to summarize and adjust for preexisting conditions in many types of health outcomes studies using administrative data. The most commonly used general comorbidity index was developed by Elixhauser et al.10 and modified into a single comorbidity score by van Walraven et al.11 In this index and others, ICD-CM codes are used to identify a list of preexisting comorbidities, which can then be used for prediction and adjustment. A weighted numeric comorbidity score, versus a set of dichotomous variables from an index, can be used to describe a patient population, to improve regression model fitting, and to assess interactions with other variables. Initially, obstetric studies used the Elixhauser and other general comorbidity indices for these purposes, although obstetric patients were explicitly excluded from the development of these indices.10,12 Bateman et al.13 first recognized the need for an obstetric comorbidity index for use in administrative data, which they created using a national sample of Medicaid-funded birth hospitalizations during 2000–2007. The comorbidity score developed by Bateman et al. significantly improved upon other available measures but generalizability is limited by development and testing among Medicaid patients only, use of a non-standard definition of SMM as the outcome to be predicted, and data and scoring based on ICD-9 CM. In addition, discrimination among predictors was modest (area under the curve (ROC-AUC) of 0.657), predictive power was unvalidated, and constrictive statistical modeling was used. Other researchers have also created obstetric comorbidity indices, but these are not applicable to administrative data in the U.S.9,14–16
The goal of this study was to develop and validate an expanded obstetric comorbidity score that can be applied consistently across U.S. administrative datasets.
Methods
This study used patient discharge data for all live births occurring in California-licensed hospitals during 2016 and 2017 (N = 919,546). Data were obtained from the California Maternal Quality Care Collaborative (CMQCC) through a data use agreement with the California Office of Statewide Health Planning and Development. Ethics approval was obtained from the State of California Committee for the Protection of Human Subjects and the Stanford University Research Compliance Office. We followed the STROBE and TRIPOD (Transparent Reporting of a Multivariable Prediction Model for Individual Prognosis) Statements in the reporting of our study.17
Severe maternal morbidity was the outcome of interest, identified following the CDC SMM Index indicators and corresponding ICD-10-CM codes (Appendix 1, available online at http://links.lww.com/AOG/B996). Severe maternal morbidity excluding blood transfusion-only cases, which we refer to hereafter as non-transfusion SMM, was also studied as an outcome of interest because blood transfusion is the only indicator of SMM in approximately half of cases. Some of these cases may represent less severe forms of SMM.3 The CDC and others now commonly report both forms of SMM.4
Preexisting comorbidities considered in analyses were selected based on previous knowledge, maternal comorbidity indices, and relevant literature.5,9,13,18–21 The full list of 27 comorbidities, how they were defined, and how they compare to the obstetric comorbidities considered by Bateman and colleagues is provided in Appendix 2, available online at http://links.lww.com/AOG/B996. In brief, we considered medical comorbidities, comorbidities related to the current pregnancy, previous cesarean birth, and maternal age. The ICD-10-CM diagnosis codes used to identify each predictor were selected by the study team in consultation with an obstetric medical billing coding expert. Maternal age was obtained from the birth certificate, which was previously linked to the patient discharge data by CMQCC but is also widely available in hospital discharge files. The dataset was generated using SAS 9.4 (SAS Institute Inc., Cary, NC, USA).
We used a targeted causal inference approach to rank the importance of potential SMM risk factors based on adjusted risk ratios (RR) and risk differences (RD) with 95% confidence intervals (CI). Targeted learning methods have been shown repeatedly to produce more accurate and more precise estimates than conventional statistical approaches.22,23 We used the varimpact package in R 3.6.1 (R Core Team, Vienna, Austria) to conduct the analyses (https://github.com/ck37/varimpact).24,25 To assess the index performance, we randomly selected 75% of the births for the training set, holding out the remaining 25% as the validation set. Four-fold cross-validation was also used in the variable importance analysis.
We retained risk factors with significant p-values (<0.05) after adjustment for multiple comparisons using the Benjamini-Hochberg false discovery rate procedure.29 We then followed the methods described by Sullivan et al.30 and van Walraven et al.11 to create a single numeric comorbidity score. Akin to their approach, we assigned points to each comorbidity by dividing the log of the risk ratio by the log of the smallest comorbidity risk ratio. This approach results in a comorbidity assigned 4 points as 4 times “more important” than a comorbidity assigned 1 point. More details on the development of the comorbidity index, including sensitivity analyses, are available in Appendices 3–4, available online at http://links.lww.com/AOG/B996.
We assessed discrimination and calibration of the index to determine its accuracy. For discrimination, we plotted a receiver operating characteristic (ROC) curve and a precision-recall (PR) curve and calculated the respective areas under the curve (AUC). The ROC curve shows how the true positive rate varies with the false positive rate.31,32 The baseline for the ROC AUC is 0.5 with 1.0 being perfect discrimination. In contrast, the PR curve shows how the positive predictive value (precision) varies with the true positive rate (recall). The baseline for the PR AUC is the mean of the outcome. The PR curve is informative when datasets are highly imbalanced (i.e., when the outcome is rare, such as SMM at 1–2% of births) because the ROC curve can be misleadingly high.33 We additionally assessed calibration of the comorbidity scores using Lowess-smoothed and grouped visualizations comparing the actual with the predicted risk of SMM and non-transfusion SMM.17
We compared the performance of the final scoring system with that of the scoring system developed by Bateman et al.13 as well as a proposed update of that scoring system (using clinical diagnoses only) by the same research group.19 To do so, we updated ICD-9-CM codes included in Bateman et al.13 to ICD-10-CM but excluded ICD-CM codes that are also used to define the CDC definition of SMM, the outcome (Appendix 2, http://links.lww.com/AOG/B996).
We further evaluated external validity of the final scoring system by applying it to patient discharge data in the Optum® Clinformatics® Data Mart. This national commercial claims dataset included 132,669 live births during 2017. We identified live births in the dataset following the approach described by MacDonald et al.34 Score performance was assessed, as described above.
Results
The study included 919,546 births in California during 2016 and 2017. Severe maternal morbidity affected 15,494 births (168 per 10,000) and non-transfusion SMM (excluding transfusion-only cases) affected 6,761 births (74 per 10,000) (Table 1). Comorbidities varied widely in prevalence; the most common comorbidities (>10%) were maternal age ≥ 35 years, previous cesarean birth, and anemia, and the least common comorbidities (<0.14%) were pulmonary hypertension, placenta accreta spectrum, and HIV/AIDS. Approximately 40% of women had a high school degree or less, 44% paid for delivery using public insurance, and 75% were nonwhite.
Table 1.
Descriptive characteristics of the study population, California, 2016–2017 (N = 919,546).
| Characteristics | n | % |
|---|---|---|
| Outcomes | ||
| Severe maternal morbidity | 15,494 | 1.68 |
| Non-transfusion severe maternal morbidity | 6,761 | 0.74 |
| Comorbidities | ||
| Maternal age ≥ 35 years | 203,826 | 22.2 |
| Previous cesarean birth | 164,398 | 17.9 |
| Anemia, preexisting | 108,474 | 11.8 |
| Gestational diabetes mellitus | 87,279 | 9.5 |
| Preterm birth (< 37 weeks) | 73,610 | 8.0 |
| Preeclampsia without severe features or gestational hypertension | 53,738 | 5.8 |
| Gastrointestinal disease | 48,848 | 5.3 |
| Major mental health disorder | 44,709 | 4.9 |
| Asthma, acute or moderate/severe | 43,969 | 4.8 |
| Delivery BMI ≥ 40 | 37,484 | 4.1 |
| Preeclampsia with severe features | 24,833 | 2.7 |
| Substance use disorder | 24,441 | 2.7 |
| Chronic hypertension | 22,052 | 2.4 |
| Bleeding disorder, preexisting | 19,079 | 2.1 |
| Neuromuscular disease | 18,532 | 2.0 |
| Twin/multiple pregnancy | 15,201 | 1.7 |
| Preexisting diabetes mellitus | 12,371 | 1.4 |
| Placental abruption | 9,107 | 0.99 |
| Cardiac disease, preexisting | 7,804 | 0.85 |
| Placenta previa, complete or partial | 5,355 | 0.58 |
| Thyrotoxicosis | 3,781 | 0.41 |
| Bariatric surgery | 2,362 | 0.26 |
| Chronic renal disease | 1,991 | 0.22 |
| Connective tissue or autoimmune disease | 1,734 | 0.19 |
| Placenta accreta spectrum | 1,131 | 0.12 |
| Pulmonary hypertension | 181 | 0.02 |
| HIV/AIDS | 104 | 0.01 |
| Demographics | ||
| Educational attainment | ||
| Less than high school completion | 127,000 | 15 |
| High school degree or equivalent | 221,623 | 25 |
| Some college | 240,115 | 28 |
| College degree or higher | 284539 | 33 |
| Expected payment method | ||
| Private insurance | 4505,460 | 49 |
| Public insurance | 405,195 | 44 |
| Other | 63,123 | 7 |
| Maternal race/ethnicity | ||
| Latina/Hispanic | 437,632 | 48 |
| White | 230,552 | 25 |
| Asian or Pacific Islander | 134,582 | 15 |
| Black | 42,573 | 5 |
| Other | 47,943 | 5 |
Variable importance analyses identified placenta accreta spectrum, pulmonary hypertension, and chronic renal disease as conferring the highest risks of SMM and non-transfusion SMM (Table 2). Associated significant risks were lowest for gestational diabetes mellitus, maternal age ≥ 35 years, and previous cesarean birth. Certain potential predictors dropped out of the analyses due to small and inconsistent effect estimates (previous cesarean birth and thyrotoxicosis for non-transfusion SMM, and bariatric surgery for both SMM and non-transfusion SMM). Scores were assigned to each comorbidity retained in the analyses in relation to the lowest risk factor (gestational diabetes mellitus). Comorbidity scores ranged from 1–59 for SMM and 1–36 for non-transfusion SMM.
Table 2.
Associations and derived risk scores for comorbidities in relation to severe maternal morbidity and non-transfusion severe maternal morbidity.
| Severe Maternal Morbidity | Non-Transfusion Severe Maternal Morbidity | |||||
|---|---|---|---|---|---|---|
| Factor | aRR (95% CI) | aRD per 10,000 births (95% CI) | Score | aRR (95% CI) | aRD per 10,000 births (95% CI) | Score |
| Placenta accreta spectrum | 30.5 (29.9, 31.1) | 4737 (4720, 4750) | 59 | 54.7 (53.1, 56.3) | 3600 (3580, 3610) | 36 |
| Pulmonary hypertension | 17.3 (17.0, 17.7) | 2725 (2720, 2730) | 50 | 34.2 (33.2, 35.2) | 2396 (2390, 2400) | 32 |
| Chronic renal disease | 9.14 (8.94, 9.34) | 1328 (1310, 1350) | 38 | 16.7 (16.2, 17.3) | 1083 (1070, 1100) | 26 |
| Bleeding disorder, preexisting | 6.94 (6.65, 7.25) | 879 (839, 919) | 34 | 12.7 (12.0, 13.5) | 677 (642, 711) | 23 |
| Cardiac disease, preexisting | 6.04 (5.83, 3.25) | 800 (774, 827) | 31 | 10.9 (10.4, 11.4) | 654 (630, 678) | 22 |
| HIV/AIDS | 5.62 (5.52, 5.73) | 773 (768, 778) | 30 | 4.27 (4.13, 4.41) | 239 (236, 243) | 13 |
| Placenta previa, complete or partial | 4.75 (4.59, 4.91) | 606 (586, 626) | 27 | 4.19 (3.96, 4.43) | 224 (211, 237) | 13 |
| Preeclampsia with severe features | 4.55 (4.35, 4.76) | 539 (510, 567) | 26 | 5.74 (5.38, 6.13) | 304 (283, 324) | 16 |
| Anemia, preexisting | 3.59 (3.46, 3.73) | 328 (314, 342) | 20 | 2.25 (2.11, 2.39) | 78 (70, 86) | 7 |
| Twin/multiple pregnancy | 3.19 (3.02, 3.36) | 351 (325, 377) | 20 | 2.33 (2.12, 2.57) | 95 (80, 110) | 8 |
| Placental abruption | 2.89 (2.77, 3.01) | 309 (291, 326) | 18 | 2.17 (2.02, 2.34) | 84 (74, 95) | 7 |
| Preterm birth (< 37 weeks) | 2.75 (2.62, 2.88) | 249 (232, 265) | 18 | 3.54 (3.31, 3.37) | 146 (135, 158) | 12 |
| Gastrointestinal disease | 1.96 (1.85, 2.09) | 153 (135, 171) | 12 | 2.31 (2.12, 2.50) | 88 (76, 100) | 8 |
| Preeclampsia without severe features or gestational hypertension | 1.88 (1.77, 1.87) | 140 (123, 157) | 11 | 1.85 (1.69, 2.01) | 59 (48, 70) | 6 |
| Asthma, acute or moderate/severe | 1.88 (1.76, 2.00) | 140 (121, 158) | 11 | 2.82 (2.60, 3.06) | 119 (105, 134) | 9 |
| Substance use disorder | 1.80 (1.67, 1.94) | 131 (109, 152) | 10 | 1.69 (1.51, 1.89) | 49 (36, 63) | 5 |
| Connective tissue or autoimmune disease | 1.80 (1.73, 1.87) | 133 (124, 143) | 10 | 2.18 (2.05, 2.31) | 85 (77, 93) | 7 |
| Chronic hypertension | 1.78 (1.66,1.90) | 127 (108, 146) | 10 | 2.22 (2.02, 2.43) | 85 (71, 98) | 7 |
| Preexisting diabetes mellitus | 1.72 (1.61, 1.84) | 119 (101, 137) | 9 | 2.03 (1.85, 2.23) | 74 (61, 87) | 6 |
| Neuromuscular disease | 1.65 (1.54, 1.78) | 108 (90, 127) | 9 | 2.33 (2.11, 2.56) | 93 (78, 109) | 8 |
| Major mental health disorder | 1.46 (1.36, 1.57) | 76 (59, 93) | 7 | 1.58 (1.42, 1.75) | 42 (30, 53) | 4 |
| Thyrotoxicosis | 1.40 (1.34, 1.46) | 67 (58, 76) | 6 | NS | NS | 0 |
| Delivery BMI ≥ 40 | 1.35 (1.24, 1.46) | 57 (40, 75) | 5 | 1.52 (1.35, 1.70) | 37 (25, 49) | 4 |
| Previous cesarean birth | 1.26 (1.20, 1.31) | 41 (32, 49) | 4 | NS | NS | 0 |
| Maternal age ≥ 35 years | 1.10 (1.06, 1.15) | 17 (9, 24) | 2 | 1.15 (1.09, 1.23) | 11 (6, 16) | 1 |
| Gestational diabetes mellitus | 1.06 (1.00, 1.12) | 10 (0, 20) | 1 | 1.12 (1.02, 1.22) | 8 (2, 15) | 1 |
| Bariatric surgery | NS | NS | 0 | NS | NS | 0 |
aRR, adjusted risk ratio; aRD, adjusted risk difference
NS indicates non-significant results (P-value < 0.05).
The discrimination of the comorbidity scores in prediction of SMM and non-transfusion was good based on ROC curves and corresponding AUC statistics (Figure 1). Discrimination is the ability of the scores to correctly classify those with and without the outcome. In the California validation data, the ROC-AUC was 0.78 for SMM and 0.84 for non-transfusion SMM (baseline of 0.5). The ROC curve summarizes the trade-off between the true positive rate (sensitivity) and false positive rate (1 - specificity) for a predictive model.31
Figure 1.

Receiver operating characteristic (ROC) curves for comorbidity index in predicting severe maternal morbidity (area under curve [AUC]: 0.78) (A) and nontransfusion severe maternal morbidity (AUC: 0.84) (B). Assessed using California validation data set (n=229,887).
We further assessed discrimination using precision-recall curves (Appendix 5, available online at http://links.lww.com/AOG/B996) because the outcomes studied are very rare, which can cause the ROC curve and AUC to appear misleadingly high.33 Unlike the ROC, precision-recall curves and AUC are dependent on the prevalence of the outcome. We found the precision-recall AUC was 0.13 for SMM (baseline of 0.017) and 0.14 for non-transfusion SMM (baseline of 0.007). The shape of the precision-recall curves indicated good detection of “strong” positive outcomes with worse performance on less clear candidates.
We additionally assessed the performance of the comorbidity indices using calibration plots (Figure 2). The plots demonstrated the models had a good fit with the data.32 That is, the predicted values of the outcomes using the comorbidity index scores matched well with the actual values. Grouped calibration plots with confidence intervals were also plotted and are provided in Appendix 6, available online at http://links.lww.com/AOG/B996.
Figure 2.
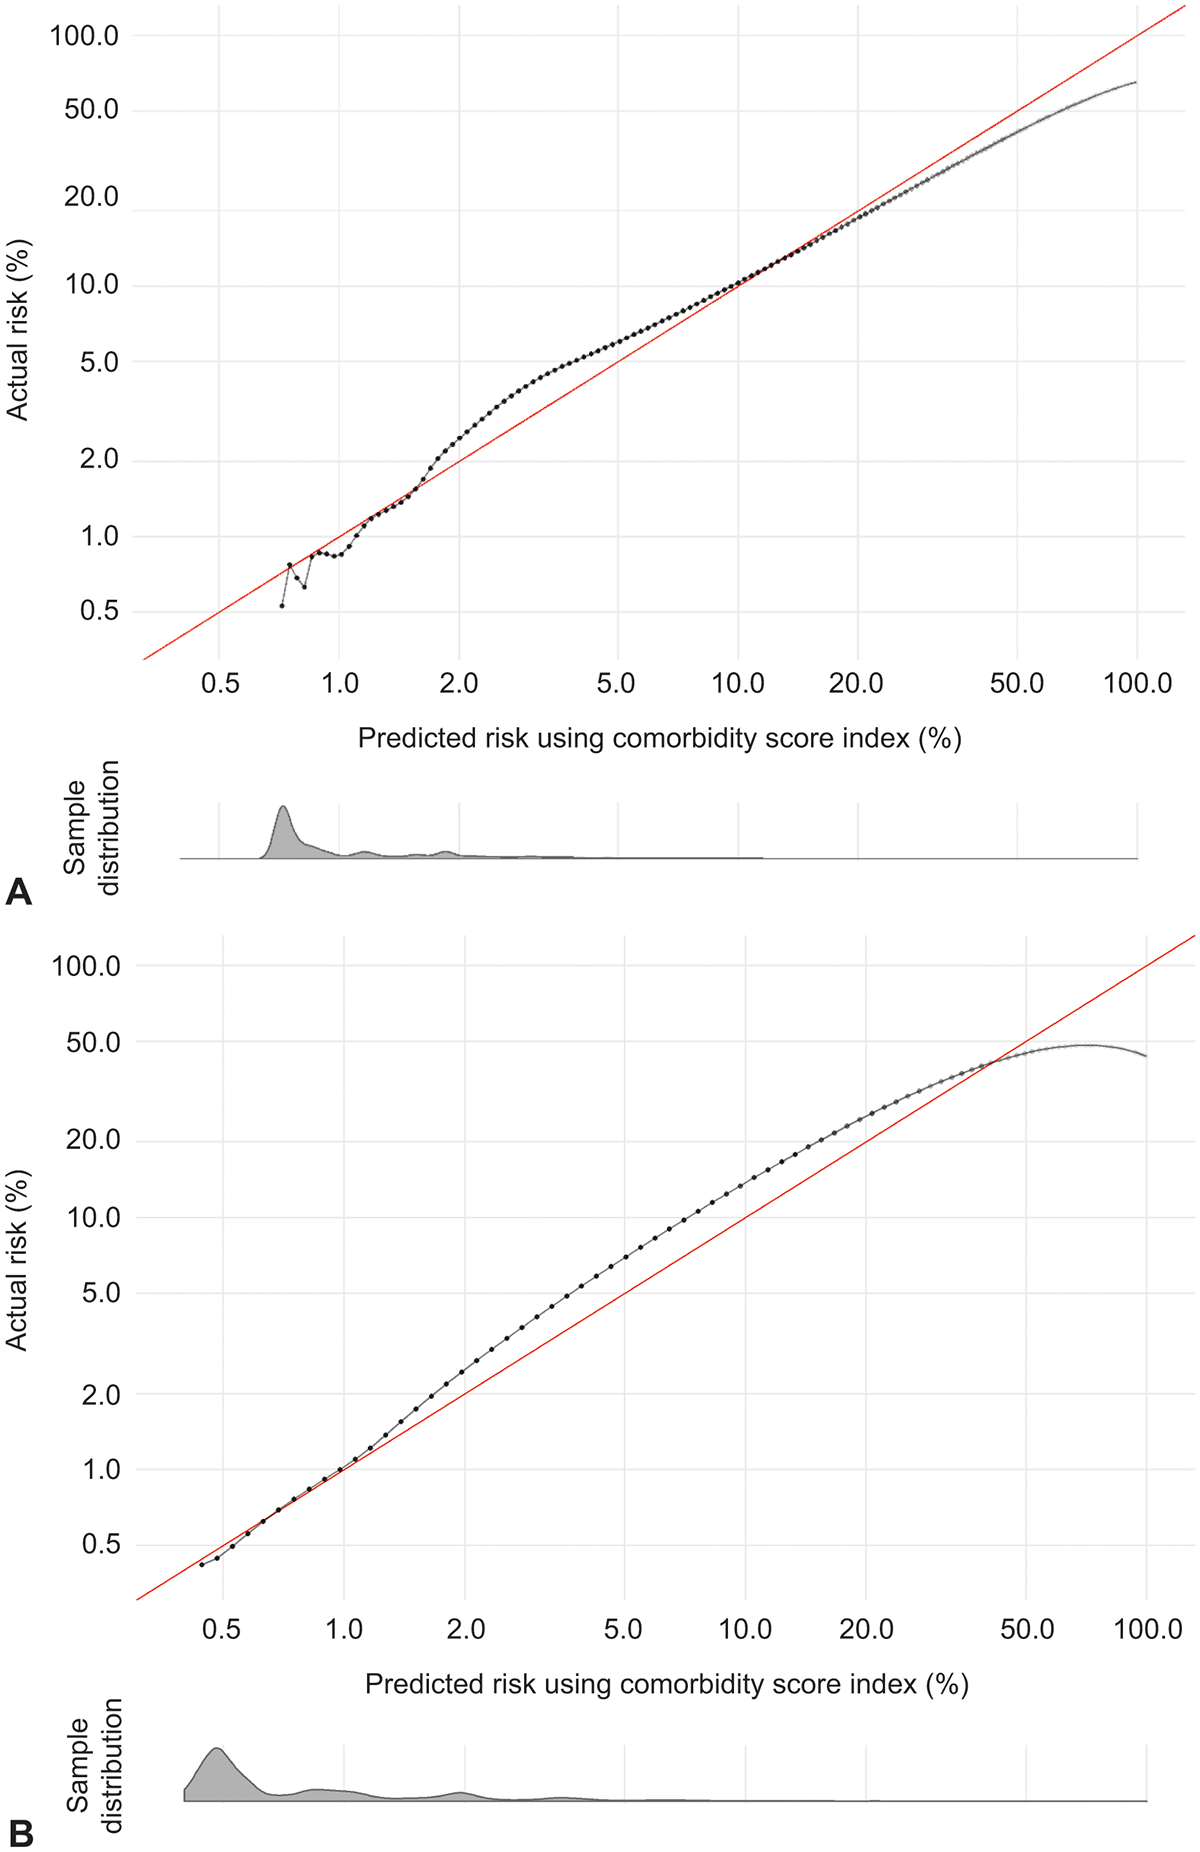
Calibration curves of comorbidity index in predicting severe maternal morbidity (A) and nontransfusion severe maternal morbidity (B). Assessed using California validation data (n=229,887). Density plot below calibration curve shows distribution of the sample across predicted risks.
Results were similar using national claims data (Optum® Clinformatics® Data Mart) for external validation (Appendix 7, available online at http://links.lww.com/AOG/B996). The ROC-AUC was 0.82 for SMM and 0.87 for non-transfusion SMM, and the precision-recall AUC was 0.15 for SMM and 0.17 for non-transfusion SMM.
To aid in interpretation, we created a table and a figure to compare our approach and results with those of Bateman and colleagues after updating their diagnoses to ICD-10-CM (Table 3 and Figure 3). The proposed comorbidity scoring system for SMM improved upon the prior systems. The ROC-AUC was 0.78 for our score compared with 0.65 and 0.70 after updating to ICD-10-CM for the prior scores, which is consistent with Bateman et al.13 (Easter et al.19 did not report performance statistics.) The precision-recall AUC statistic was 0.13 for our score, compared with 0.05 and 0.07 for the prior scores (Table 3). Further, the plots of these AUC statistics show this study’s score had a higher level of precision (positive predictive value) for any level of recall (true positive rate), particularly in the recall range of 0–25% (Figure 3). Precision-recall AUC statistics were not calculated in the prior reports.
Table 3.
Comparison of obstetric comorbidity indices for use in U.S. administrative data.
| Primary Outcome | Maternal Comorbidities | Study Cohort | Methodology | Index Discrimination When Applied to California Data1 | |
|---|---|---|---|---|---|
| Bateman, et al.13 2013 | Death or maternal end-organ injury (defined by ICD-9-CM codes) through 30 days post-partum; ~50% overlap of ICD-9-CM codes with CDC SMM Index | 20 conditions, defined by ICD-9-CM codes plus maternal age (see Bateman, 2013: Table 3) | Medicaid Analytic Abstract (nationally representative Medicaid data set), 2000 to 2007 (n = 854,823) | Logistic regression models to determine weights. Validated in hold-out test data. |
For SMM: ROC-AUC: 0.65 Precision-Recall AUC: 0.049 |
| Easter, et al.19 2019 | Death or SMM outlined by scenarios and case reviews rather than ICD-CM codes | 19 conditions (some added, and some removed from above) defined by clinical scenarios and clinical diagnoses (not ICD-CM codes) plus maternal age and BMI (see Easter 2019: Table 2) | Single center, case reviews (n = 2,828) | Observational study of the utility of primary collection of comorbidity data. No validation. |
For SMM: ROC-AUC: 0.70 Precision-Recall AUC: 0.069 |
| Leonard, et al. 2020 | SMM as defined by the CDC using ICD-10-CM codes | 27 conditions defined by ICD-10 CM codes plus maternal age | All California hospital live births, 2016 to 2017 (n = 919,546), plus external validation in Optum® Clinformatics® Data Mart (national commercial claims), 2017 (n = 132,669) | Targeted causal inference approach integrated with machine learning. Validated in hold-out test data and national commercial claims data. |
For SMM: ROC-AUC: 0.782 and 0.823 Precision-Recall AUC: 0.132 and 0.153 For non-transfusion SMM: ROC-AUC: 0.842 and 0.873 Precision-Recall AUC: 0.142 and 0.173 |
AUC, area under the curve; CDC, Centers for Disease Control and Prevention; ROC, receiver operating characteristic curve; SMM, severe maternal morbidity
Index discrimination statistics (ability to correctly predict the outcome) shown for California validation data (n = 229,887) after translating ICD-9-CM codes from Bateman et al. and comorbidities from Easter et al. to ICD-10-CM codes. Baseline for precision-recall AUC was 0.017 for SMM and 0.007 for non-transfusion SMM.
Calculated in the California validation data (n = 229,887)
Calculated in the national claims validation data (Optum® Clinformatics® Data Mart) (n = 132,669)
Figure 3.

Precision-recall curves for prediction of severe maternal morbidity using proposed comorbidity index and previous obstetric comorbidity indices. Previous indices described by Bateman et al13 and Easter et al.19 Dotted line shows baseline precision (0.017).
Discussion
We developed and validated an expanded obstetric comorbidity score to predict SMM using administrative data in California. We further externally validated the score using national commercial claims data and replicated analyses for SMM excluding cases for which blood transfusion was the only indicator. The obstetric comorbidity scores are designed to be widely applicable to contemporary administrative health datasets in the U.S. and may be useful for a variety of purposes. In particular, the scores can serve as an adjustment strategy to compare SMM and non-transfusion SMM rates across hospitals and other patient populations that vary in comorbidity case mix.
The comorbidity scores developed in this study had overall good performance and meaningfully improved upon previous obstetric comorbidity scores for administrative data.13,19 The ROC-AUC for this study’s scores was approximately 0.8 for both SMM outcomes and in the California and national data. We calculated additional AUC statistics for precision-recall curves because ROC curves can be misleadingly high when an outcome is rare, such as SMM.33 To compare with prior studies, we translated ICD-9-CM diagnosis codes from Bateman et al.13 and conditions from Easter et al.19 to ICD-10-CM diagnosis codes. Notably, the ROC-AUC we calculated for the comorbidity index by Bateman et al.13 was the same as reported in the original paper (0.65) using national Medicaid data. When we compared the AUC statistics between the comorbidity scores from this study and from Bateman and colleagues, we found both the ROC-AUC (0.78 versus 0.65 for SMM) and the precision-recall AUC (0.13 versus 0.05 for SMM) were substantially higher. Furthermore, the very low precision-recall AUC, particularly in the low-risk range, may indicate that the modest ROC-AUC statistic (0.657) previously reported by Bateman could be overly optimistic about score performance.
We believe the improvement in model performance may be due to different comorbidity selections, more robust statistical methods, and a larger range of scores. We added and modified a number of comorbidities compared with the previous studies (detailed in Appendix 2). Further, we used a targeted causal inference approach to create our prediction models, which overcomes many limitations of traditional regression modeling. Finally, our scoring approach gave scores ranging from 1 to 59 for each comorbidity; in comparison, the range of scores from Bateman and colleagues ranged from 1 to 5. We also created scores for non-transfusion SMM (range of 1–36 for comorbidity scores), which the CDC and others now commonly report.4 Using our results, a patient’s total comorbidity score is calculated by summing the scores for each comorbidity. For example, a patient with preexisting cardiac disease and a twin pregnancy would have a total score of 51 for SMM and 30 for non-transfusion SMM. The predicted risk of SMM and non-transfusion SMM based on these total scores closely matched the actual risks (i.e., the model was well-calibrated), which is an important but often overlooked component of assessing the performance of a prediction model for clinical utility.32
The primary motivation for developing these obstetric comorbidity scores is to provide a strategy to compare SMM across patient populations with different case mixes. In particular, the large variation in patient case mix among maternity hospitals has precluded the ability to compare their rates of SMM. A sufficient case-mix adjustment would also enable within-hospital comparisons of SMM rates between patient populations, such as racial and ethnic and socioeconomic groups. Further, an obstetric comorbidity score provides a consistent way to describe the SMM risk of a patient population and improves statistical modeling of SMM by reducing the number of model covariates and enabling the inclusion of interactions between comorbidity and other risk factors.
Scores for several of the specific comorbidities merit further discussion. The most severe comorbidities in obstetric care, placenta accreta spectrum and maternal pulmonary hypertension, are now given appropriate very high scores (≥50) whereas in prior indices each comorbidity score was capped at 5.13,19 Newly added comorbidities, such as major mental health disorders and substance use disorder, all contributed to the model and will be important as we begin to consider the role of social determinants. Inclusion of available sociodemographic factors in a sensitivity analysis (Appendix 4, http://links.lww.com/AOG/B996) did not meaningfully change results, which warrants further investigation. The finding that high maternal age and high BMI contributed less to the model than many other factors may indicate that much of the risk of SMM among these women is due to other concomitant comorbidities.
This study’s results should be interpreted in light of its limitations. In particular, administrative patient discharge data have limitations compared with health record data in accuracy and detail. Very rare obstetric complications can be underreported in patient discharge data,35 and comorbidity ascertainment can be low when only data from delivery hospitalization are available.36 The indices used to identify SMM and non-transfusion SMM in patient discharge data are also limited in identifying true cases.3 Further, vital signs, laboratory values, medications, and severity of a condition are generally not available in patient discharge data but can be informative for predicting obstetric complications.14,15 We recognized these limitations in the design of our study, which was intended to create a tool that can be used in any administrative dataset with ICD-10-CM codes, given that datasets with electronic health record data are not widely available or used for SMM surveillance. The study analyses were limited in part by the very large sample size and number of comorbidities considered, which prevented incorporation of a wider variety of machine-learning algorithms than those that we considered in a sensitivity analysis for these reasons. The analytical approach also required dichotomization of the comorbidities, which prevented assigning different scores for different degrees of severity of a given comorbidity.
This study benefits from a number of strengths. The comorbidity score was developed from a large, contemporary, unselected cohort of all births in the state of California during 2016–2017. These features enable the study of rare comorbidities as well as non-transfusion SMM, which was not considered previously in risk prediction analyses but may comprise more serious complications than SMM that includes cases with only blood transfusion as the indicator of a severe event. Our study is also the first, to our knowledge, to use ICD-10-CM diagnosis and procedure codes to study comorbidities and SMM in the U.S. We carefully selected ICD-10-CM codes for comorbidities in a team of an obstetric medical billing expert, obstetric epidemiologist, and a Maternal-Fetal Medicine physician. By using ICD-10-CM, as opposed to ICD-9-CM, the comorbidity scores provide tools for current and future healthcare quality evaluation. In addition, our study applied rigorous methodology in the development and validation of the comorbidity scores. We utilized sophisticated causal inference statistical analyses and evaluated the model performance using multiple measures, including not only ROC AUC statistics but precision-recall AUC statistics and calibration plots as recommended by TRIPOD.17 We also both internally and externally validated the comorbidity scores, which supports generalizability of our findings to the U.S. obstetric population.
In conclusion, we developed and validated an expanded obstetric comorbidity scoring system to predict the outcomes of SMM and non-transfusion SMM during hospitalization for childbirth. These scores can be applied in any maternity patient discharge dataset with ICD-10-CM diagnosis and procedure codes, and may be a useful tool for maternal health research and quality improvement efforts.
Supplementary Material
Acknowledgments
Funding for this work was provided in part by the Eunice Kennedy Shriver National Institute of Child Health and Development (F32 HD091945), National Institute for Nursing Research (R01 NR017020), and the Stanford Maternal and Child Health Research Institute.
The authors thank Kristi Pollard for reviewing the ICD-10-CM comorbidity diagnosis codes used in this study and the California Office of Statewide Health Planning and Development and the California Maternal Quality Care Collaborative for providing the patient discharge data.
Footnotes
Financial Disclosure
The authors did not report any potential conflicts of interest.
Each author has confirmed compliance with the journal’s requirements for authorship.
References
- 1.Callaghan WM, Creanga AA, Kuklina EV. Severe maternal morbidity among delivery and postpartum hospitalizations in the United States. Obstet Gynecol. 2012;120(5):1029–1036. [DOI] [PubMed] [Google Scholar]
- 2.Creanga AA, Berg CJ, Ko JY, et al. Maternal mortality and morbidity in the United States: where are we now? J Womens Health (Larchmt). 2014;23(1):3–9. [DOI] [PMC free article] [PubMed] [Google Scholar]
- 3.Main EK, Abreo A, McNulty J, et al. Measuring severe maternal morbidity: validation of potential measures. Am J Obstet Gynecol. 2016;214(5):643 e641–643 e610. [DOI] [PubMed] [Google Scholar]
- 4.Prevention CfDCa. Severe Maternal Morbidity in the United States. 2020; https://www.cdc.gov/reproductivehealth/maternalinfanthealth/severematernalmorbidity.html. Accessed March 6, 2020. [Google Scholar]
- 5.Leonard SA, Main EK, Carmichael SL. The contribution of maternal characteristics and cesarean delivery to an increasing trend of severe maternal morbidity. BMC Preg Childbirth. 2019;19(1):16. [DOI] [PMC free article] [PubMed] [Google Scholar]
- 6.Fingar KR, Hambrick MM, Heslin KC, Moore JE. Trends and disparities in delivery hospitalizations involving severe maternal morbidity, 2006–2015. Rockville (MD): Agency for Healthcare Research and Quality (US); 2018. September 04 2018. [PubMed] [Google Scholar]
- 7.Main EK, Cape V, Abreo A, et al. Reduction of severe maternal morbidity from hemorrhage using a state perinatal quality collaborative. Am J Obstet Gynecol. 2017;216(3):298.e291–298.e211. [DOI] [PubMed] [Google Scholar]
- 8.Wall-Wieler E, Carmichael SL, Gibbs RS, et al. Severe Maternal Morbidity Among Stillbirth and Live Birth Deliveries in California. Obstet Gynecol. 2019;134(2):310–317. [DOI] [PMC free article] [PubMed] [Google Scholar]
- 9.Grobman WA, Bailit JL, Rice MM, et al. Frequency of and Factors Associated With Severe Maternal Morbidity. Obstet Gynecol. 2014;123(4):804–810. [DOI] [PMC free article] [PubMed] [Google Scholar]
- 10.Elixhauser A, Steiner C, Harris DR, Coffey RM. Comorbidity measures for use with administrative data. Med Care. 1998;36(1):8–27. [DOI] [PubMed] [Google Scholar]
- 11.van Walraven C, Austin PC, Jennings A, Quan H, Forster AJ. A Modification of the Elixhauser Comorbidity Measures Into a Point System for Hospital Death Using Administrative Data. Med Care. 2009;47(6):626–633. [DOI] [PubMed] [Google Scholar]
- 12.Charlson M, Szatrowski TP, Peterson J, Gold J. Validation of a combined comorbidity index. J Clin Epidemiol. 1994;47(11):1245–1251. [DOI] [PubMed] [Google Scholar]
- 13.Bateman BT, Mhyre JM, Hernandez-Diaz S, et al. Development of a Comorbidity Index for Use in Obstetric Patients. Obstet Gynecol. 2013;122(5):957–965. [DOI] [PMC free article] [PubMed] [Google Scholar]
- 14.Aoyama K, D’Souza R, Pinto R, et al. Risk prediction models for maternal mortality: A systematic review and meta-analysis. PLoS ONE. 2019;13(12):e0208563. [DOI] [PMC free article] [PubMed] [Google Scholar]
- 15.Betts KS, Kisely S, Alati R. Predicting common maternal postpartum complications: leveraging health administrative data and machine learning. BJOG. 2019;126:702–709. [DOI] [PubMed] [Google Scholar]
- 16.Rosenbloom JI, Tuuli MG, Stout MJ, et al. A Prediction Model for Severe Maternal Morbidity in Laboring Patients at Term. Am J Perinatol. 2019;36(1):8–14. [DOI] [PubMed] [Google Scholar]
- 17.Collins GS, Reitsma JB, Altman DG, Moons KGM. Transparent reporting of a multivariable prediction model for individual prognosis or diagnosis (TRIPOD): the TRIPOD statement. BMJ. 2015;350:g7594. [DOI] [PubMed] [Google Scholar]
- 18.Leonard SA, Main EK, Scott KA, Profit J, Carmichael SL. Racial and ethnic disparities in severe maternal morbidity prevalence and trends. Ann Epidemiol. 2019;33:30–36. [DOI] [PMC free article] [PubMed] [Google Scholar]
- 19.Easter SR, Bateman BT, Sweeney VH, et al. A comorbidity-based screening tool to predict severe maternal morbidity at the time of delivery. Am J Obstet Gynecol. 2019;221(3):271.e271–271.e210. [DOI] [PubMed] [Google Scholar]
- 20.Lyndon A, Lee HC, Gilbert WM, Gould JB, Lee KA. Maternal morbidity during childbirth hospitalization in California. J Matern Fetal Neonatal Med. 2012;25(12):2529–2535. [DOI] [PMC free article] [PubMed] [Google Scholar]
- 21.Leonard SA, Carmichael SL, Main EK, Lyell DJ, Abrams B. Risk of severe maternal morbidity in relation to prepregnancy body mass index: Roles of maternal co-morbidities and caesarean birth. Paediatr Perinat Epidemiol. 2020;[Epub ahead of print]. [DOI] [PMC free article] [PubMed] [Google Scholar]
- 22.Dorie V, Hill J, Shalit U, Scott M, Cervone D. Automated versus do-it-yourself methods for causal inference: Lessons learned from a data analysis competition. Stat Sci. 2019;34(1):43–68. [Google Scholar]
- 23.Gruber S, Laan MVD. tmle: An R Package for Targeted Maximum Likelihood Estimation. J Stat Software. 2012;51(i13). [Google Scholar]
- 24.Hubbard AE, Kennedy CJ, Van der Laan MJ. Data-Adaptive Target Parameters Targeted Learning in Data Science:. Springer; 2018:125–142. [Google Scholar]
- 25.Figueroa SC, Kennedy CJ, Wesseling C, Wiemels JL, Morimoto L, Mora AM. Early immune stimulation and childhood acute lymphoblastic leukemia in Costa Rica: A comparison of statistical approaches. Environ Res. 2020;182:109023. [DOI] [PMC free article] [PubMed] [Google Scholar]
- 26.Schuler MS, Rose S. Targeted Maximum Likelihood Estimation for Causal Inference in Observational Studies. Am J Epidemiol. 2017;185(1):65–73. [DOI] [PubMed] [Google Scholar]
- 27.Van der Laan MJ, Polley EC, Hubbard AE. Super learner. Stat Appl Genet Mol Biol. 2007;6:Article 25. [DOI] [PubMed] [Google Scholar]
- 28.Polley EC, LeDell E, Kennedy CJ, van der Laan MJ. SuperLearner: Super Learner Prediction. R package version 2.0–26. 2019; https://CRAN.R-project.org/package=SuperLearner. Accessed January 7, 2020. [Google Scholar]
- 29.Benjamini Y, Hochberg Y. Controlling the false discovery rate: a practical and powerful approach to multiple testing. J Royal Stat Soc Series B (Method). 1995;57(1):289–300. [Google Scholar]
- 30.Sullivan LM, Massaro JM, D’Agostino Sr RB. Presentation of multivariate data for clinical use: The Framingham Study risk score functions. Stat Med. 2004;23(10):1631–1660. [DOI] [PubMed] [Google Scholar]
- 31.Davis J, Goadrich M. The relationship between precision-recall and ROC curves. Paper presented at: 23rd International Conference on Machine Learning 2006; Pittsburgh, PA. [Google Scholar]
- 32.Steyerberg EW. Evaluation of Performance Clinical Prediction Models: Statistics for Biology and Health: Springer Nature; 2019. [Google Scholar]
- 33.Saito T, Rehmsmeier M. The precision-recall plot is more informative than the ROC plot when evaluating binary classifiers on imbalanced datasets. PLoS ONE. 2015;10(3). [DOI] [PMC free article] [PubMed] [Google Scholar]
- 34.MacDonald SC, Cohen JM, Panchaud A, McElrath TF, Huybrechts KF, Hernández-Díaz S. Identifying pregnancies in insurance claims data: Methods and application to retinoid teratogenic surveillance. Pharmacoepidemiol Drug Safety. 2019;28(9):1211–1221. [DOI] [PMC free article] [PubMed] [Google Scholar]
- 35.Lydon-Rochelle MT, Holt VL, Nelson JC, et al. Accuracy of reporting maternal in-hospital diagnoses and intrapartum procedures in Washington State linked birth records. Paediatr Perinat Epidemiol. 2005;19(6):460–471. [DOI] [PubMed] [Google Scholar]
- 36.Salemi JL, Hansen MA, Modak S, et al. Estimating the obstetric co-morbidity burden using administrative data: The impact of the pregnancy-related assessment window. Paediatr Perinat Epidemiol. 2020. [Epub ahead of print.] [DOI] [PubMed] [Google Scholar]
Associated Data
This section collects any data citations, data availability statements, or supplementary materials included in this article.