Abstract
Assessment of skeletal maturity is crucial for managing growth related problems. Tanner and Whitehouse (TW) hand and wrist bone age assessment is an accurate method; however, it is complex and labor-intensive. Several simplified methods derived from the TW method were proposed, and each had its own character. The purpose of this study is to explore the relationship between these methods for accurate usage.
Between 2018 and 2019, a cross-sectional study was performed with consecutive left hand and wrist x-rays obtained from a pediatric orthopedic clinic. Bone age assessments included the distal radius and ulna (DRU) classification, Sanders staging (S), thumb ossification composite index (T), and TW method. Somers delta correlation was conducted to determine the interchangeability of these stages. The mean bone age and standard deviation (SD) of each subgrade were compared and analyzed.
Totally 103 films (92 girls) were analyzed with mean age of 12.1 years (range: 8.0–17.9 years). The radius (R) stages had good correlation with S, T, and U stages with a very high Somers delta correlation (P < .05). R5 had relatively large SD (1.5) and referred to T2 and T3; R6 and R7 had the smallest SD (0.3) with reference to T4 or S2; R8 referred to T5 or S3, S4, S5; R9 referred to S6 and S7.
The internal relationship between the DRU and digital stages system was well proven. We also provided a simple and accurate way to assess the bone age by combination of some subgrades with smaller SD: 10y-proximal thumb covered without sesamoid (T2); 10.5y-sesamoid just appearing (T3); 11y-distal radial physis just covered (medial double joint line, R6); 11.5y-medial capping of distal radial physis (R7); 12y-bilateral capping of distal radial physis (R8) / phalangeal capping without fusion (S3); 12.5y-distal phalangeal physes start to fuse (S4); 13y-distal phalangeal physes fused (S5); 13.5y-proximal phalangeal physes start to fuse (S6); 14.5y-proximal phalangeal physes fused (S7); 15y-distal radial physis almost fused (R10).
Level of Evidence: Diagnostic study, level III.
Keywords: distal radius and ulna, DRU, Sanders staging, TOCI, Tanner and Whitehouse, bone age
1. Introduction
Accurate assessment of bone age is a crucial step in managing growth related problems, such as intervening for lower limb discrepancy, or preventing curve progression in scoliosis. The traditional method is to apply Greulich-Pyle atlas,[1] or more complicated Tanner-Whitehouse (TW) scoring methods,[2] both of which are relatively complex for rapid application in a busy clinical setting. Sanders et al[3] simplified the TW methods into 8 stages for the Sanders staging system (S). It is based on the digital age scores aimed for simplified clinical use. Hung et al[4] further proposed a simpler scoring system with the thumb ossification composite index (T), and high interchangeability was demonstrated for the thumb index and Sanders stages.[5]
Compared to these, the distal radius and ulna (DRU) epiphysis were initially found to have the least correlation with growth because of the wide interval between each stage.[6] Luk et al[7] modified the distal radius and ulna stages of TW3, and further divided the distal radius into 11 stages (R1-11) from original 8 stages (B–I), and ulna into 9 stages (U1-9) from original 7 stages (B–H). It covered the whole growth periods and was evenly distributed throughout the pubertal phase. The peak height velocity is at R6 and U5 and cessation of growth is at R9 and U7.[8] It has shown to be instrumental in management of scoliosis.[9–12]
All 3 classifications have been confirmed to be reliable tools in predicting skeletal maturity[3,5,13]; however, each has its character and flaw. The thumb index does not cover the whole growth periods; the Sanders staging system was found to be associated with a steep learning curve[14]; and the DRU classification had average 15% of 1 grade disagreement for radius grade, and 25% of 1 grade disagreement for ulna grade intra- and interobserver reliability assessments.[15] So, it is our belief that estimating the bone age can be more accurate if the internal relationship of those established staging systems is revealed.
The objective of this study was to compare the DRU with the digital staging systems of Sanders staging, thumb index, and each substage of TW staging. Our hypothesis is that there is high correlation between these various systems. Understanding this correlation will provide a reference for different stages of DRU and provide more accurate assessment of bone maturity.
2. Materials and Methods
Between 2018 and 2019, a cross-sectional study was conducted using left hand and wrist x-ray films taken in a pediatric orthopedics outpatient clinic, which aimed for bone age assessment. Only girls were included for better accordance with previous studies. The exclusion criteria were patients who were male, who had congenital skeletal dysplasia involving the hand, and age <8 years and >18 years. Ethics was approved by the local institutional review board.
Each hand radiograph was scored with the DRU,[16] S, T, and TW methods. As described in the TW stage system, there is a sequence of 4 basic epiphyseal shapes before bone matures: Uncovered, width of the epiphysis not wider than that of the metaphysis for Radius grade 5 (R5), S1 and T1; Covered, width of the epiphysis wider than that of the metaphysis but without capping, which include R6, T2-3, S2; Capping, spread of the lower border of the epiphysis around the metaphysis, which include R7-8, T4-5, S3-4; Fusion, near fusion or fusion of the epiphysis, which include R9-11, T6-8, S5-8. The ulna grades of the DRU are slightly different depending on the shape of the epiphysis.
Three orthopedic surgeons, with good experience (>10 years of use) of using the rating systems, performed all scoring of the radiographs with the DRU, S, T staging systems independently. Images were viewed in DICOM format on a high-resolution computer monitor (at least 1024 × 768 pixels) with reference to the classification materials as required. The accurate bone age was scored with Chinese standard TW bone age methods (CHN methods[17]) by an experienced radiologist. In CHN methods, 14 bones of the hand and wrist were evaluated, including distal radial, 1st, 3rd, 5th metacarpal, proximal phalangeal and distal phalangeal, 3rd, 5th middle phalangeal, capitate and hamate physes.
Frequency and descriptive statistics were performed of the data set. The mean bone age, range (95% confidence interval [CI]), and standard deviation (SD) of each substage for the 3 classifications were analyzed. We explored the most representative sub-stages, which have a relatively smaller standard deviation, to serve as references for TW bone age. Correlation analysis was conducted to carry out a stage-to-stage comparison of the R stage with T, S, and U. Somers delta correlation was conducted to determine the interchangeability of these stages. P <.05 was considered significant. SPSS version 14 (SPSS Inc, Chicago, IL) was utilized to perform statistical analysis.
3. Results
Totally 103 films (92 girls) were analyzed with mean age of 12.1 years (±SD 2.6; range: 8.0–17.9 years). The reasons of bone age x-rays were as followed: evaluating for the progression of idiopathic scoliosis (72 patients), predicting lower limb discrepancy (8 patients), and predicting the height of a normal child (12 patients).
Mean value bone age, SD, and 95% CI of each substage was calculated and compared (Table 1). The substages with similar bone age or with overlapped CI were grouped: first group with mean age between 9.1 and 10.7 years corresponding with R5, T2, T3 (Fig. 1); second group with mean age between 10.8 and 11.4 years corresponding with R6, R7, S2, T4 (Fig. 2); third group with mean age between 11.8 and 13 years corresponding with R8, S3, S4, S5, T5 (Fig. 3); fourth group with mean age between 13.7 and 14.5 years corresponding with R9, S6, S7 (Fig. 4). These were used as references for each other.
Table 1.
The accurate bone age of each substages in DRU, S, and T. The sub-grades with similar bone age are grouped (same color), which can be references to each other.
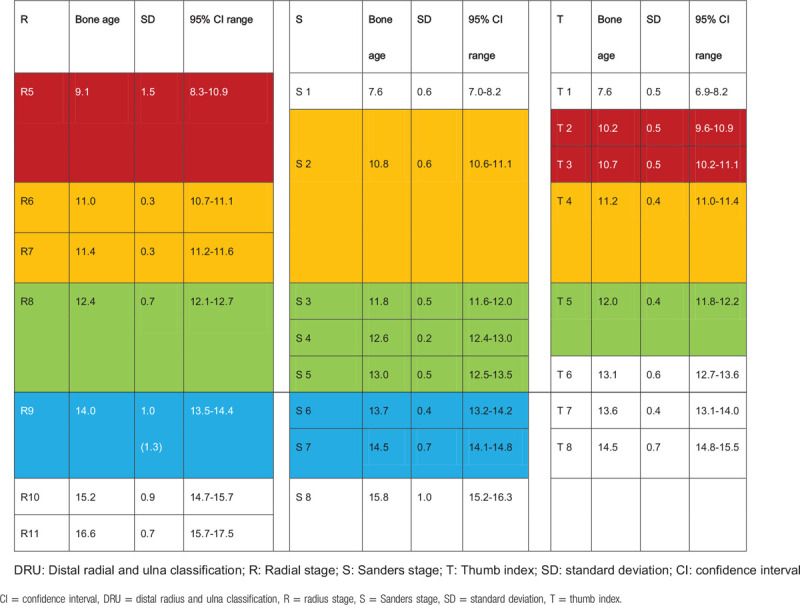
Figure 1.
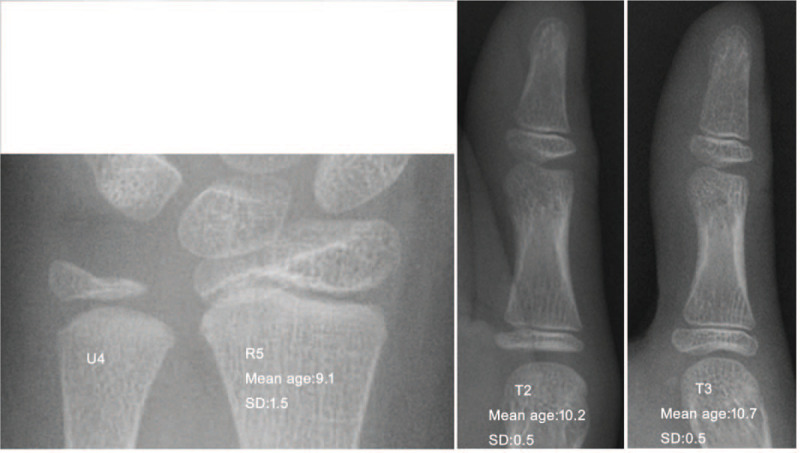
R5 (uncovered-width of the epiphysis not as wide as the metaphysis) with reference to T2 (covered without sesamoid) and T3 (covered with sesamoid).
Figure 2.
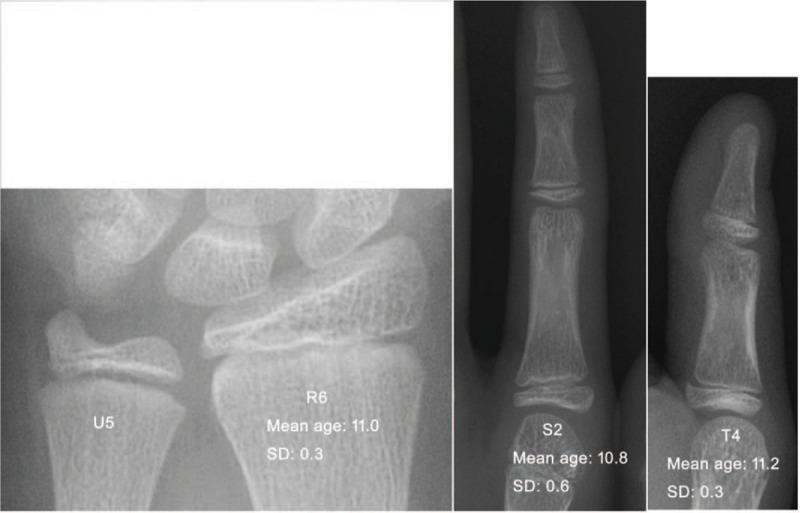
R6 (covered without capping-double line can be seen at ulna side) with reference to S2 (digital covered) and T4 (thumb starts capping).
Figure 3.
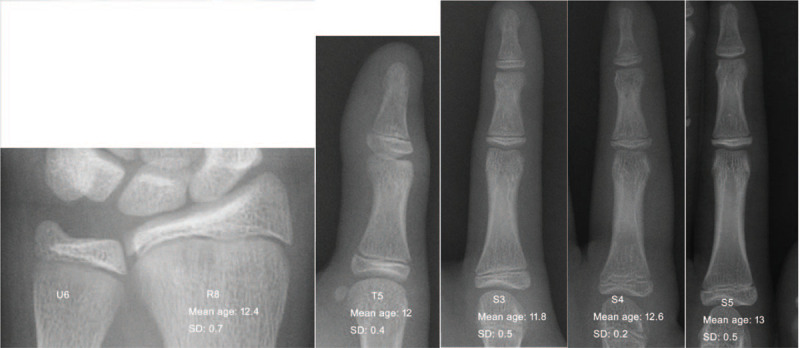
R8 (capping at both sides) with reference to T5 (thumb fully capped) and S3 (digital capping), S4 (distal starts fusing), S5 (distal fused).
Figure 4.
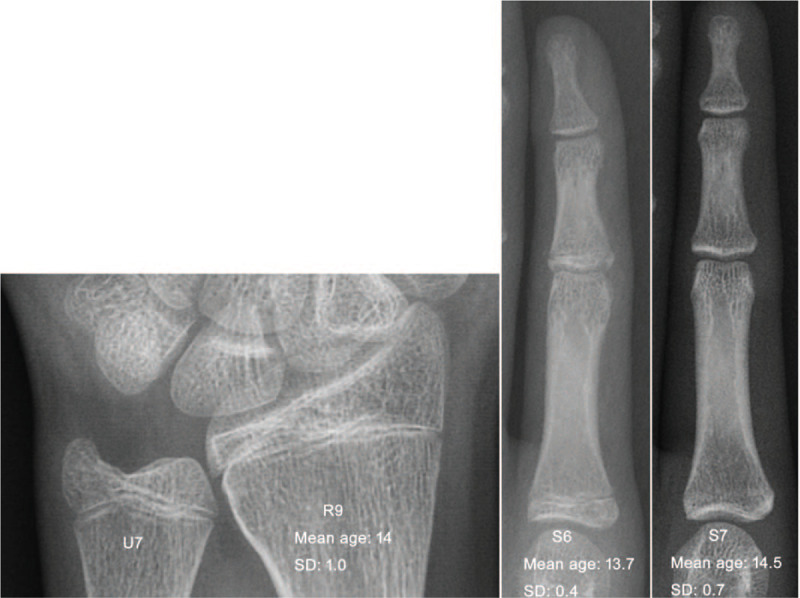
R9 (start fusing-the central physis is blurred) with reference to S6 (proximal and middle digital epiphyses start to fusing) and S7 (proximal and middle digital epiphyses fused).
Stage-to-stage matching of R grade with T, S, and U stages showed significant correlations with a very high Somers delta correlation (P < .05), which meant some substages could be interchangeable. However, the standard deviation of each substage showed different results: The R grades covered the whole pubertal growth period, with average SD of 0.77 (range 0.3–1.5), and R6 (covered) and R7 (ulna side capping) had the smallest SD (SD = 0.3 years). The average SD of Sanders staging was 0.56 (range 0.2–1.0). S4 (distal phalangeal physes fused) had the smallest SD (SD = 0.2). The average SD of the Thumb index was 0.5 (range 0.4–0.7). These smaller SD substages could be used to determine bone age for accuracy and easy usage (Fig. 5).
Figure 5.
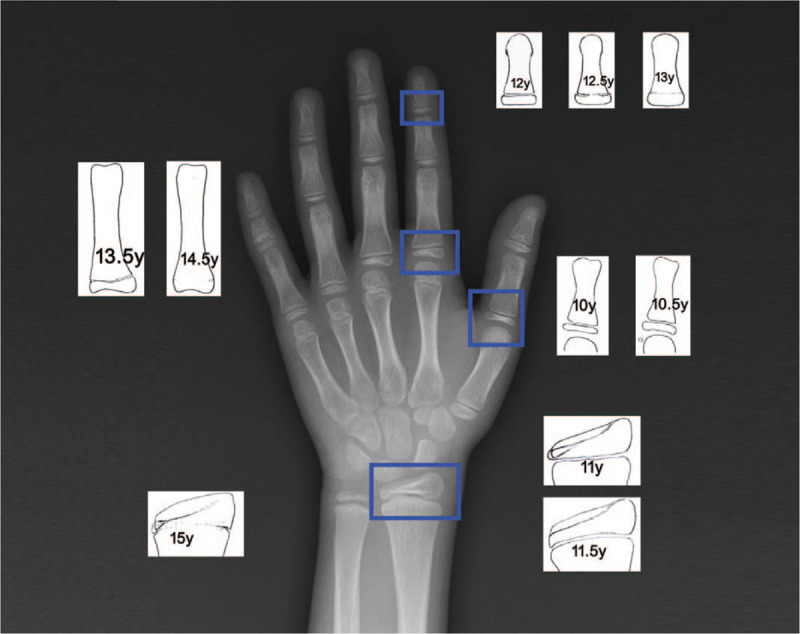
Illustrated diagram used for determination of bone age in females from aged 10 to 15 years: 10.2 y (10y∗): proximal thumb physis covered without sesamoid (T2); 10.7 y (10.5∗): sesamoid just appears, not capped yet (T3); 11y: distal radial physis just covered (medial double joint line, R6); 11.5y: medial capping of distal radial physis (R7); 12y: bilateral capping of distal radial physis (R8) / phalangeal capping without fusion (S3/T5); 12.5y: distal phalangeal physes start fusing (S4); 13y: distal phalangeal physes fused (S5); 13.5y: proximal phalangeal physes start fusing (S6); 14.5y: proximal phalangeal physes fused(S7); 15.2y (15y∗): distal radial physis almost fused (R10). (∗: rounded number with the nearest 0.5y for simplification).
4. Discussion
Because of the discrepancy existing between chronological age and bone age, accurate assessment of skeletal maturity is crucial in many clinical situations.[6,7,18] Three simplified classification systems, DRU, S, and T, which are derived from TW scoring system have proved to be reliable and simple to estimate the bone age.[3–5,7,8,13,16] Our results further demonstrate correlation and internal relationship between these systems.
In the TW scoring process, maximum 20 bones including radius, ulna, carpals, metacarpals, and phalangeal physes are evaluated. The maturity level of each bone is first categorized into a stage (from stage A to H or I). Afterwards, each stage is replaced by a score. Finally, a total score is calculated and transformed into the bone age. Greulich and Pyle atlas (GP) is another commonly used method. Bone age is evaluated by comparing the radiograph of the patient with the nearest standard radiograph in the atlas. The GP method is simpler and faster; however, it may be difficult to assess precisely in some age group as radiographic morphological changes are difficult to interpret.[15] TW method is considered to be more objective and have higher reproducibility than the GP method. The main drawbacks of the TW method include its time-consuming and difficulty to use in the outpatient clinical setting.[7]
DRU, S, and T are all derived from TW methods. Each system comes from a different part of the hand. During peripubertal period, the R is divided to 7 substages from R5 to R11, S is divided to 8 substages, and T has 8 substages. Our study has proved these substages are highly correlated. It can be explained as they are all coming from similar maturity rating system.
First, as described in TW rating system for each hand bone, the epiphysis undergoes certain shape changes during maturity, from uncovered to covered, and then to capping and finally fusing. The DRU, S, and T systems all follow this rule.
Second, as with increasing age, the various epiphyses undergo changes in an orderly sequence compared with each other, such as the thumb epiphyses maturing a little earlier than the remaining digital epiphyses. As we found during R5, when the distal radius epiphyses are uncovered, the digital epiphyses gradually turn from uncovered (T1/S1) to covered (T2-3/S2). Thumb epiphyses mature a little earlier than the remaining digital epiphyses, so the mean bone ages of T2 and T3 are smaller than S2 (Fig. 1). Similar phenomenon is found during R6: The distal radial epiphyses are covered and all digital epiphyses gradually turn from covered (T3/S2) to capped (T4/S3). The thumb is capped first (T4, 11.2 years old), whereas other fingers are still uncapped (S2, 10.8 years old) (Fig. 2). The fusion of various hand bones also has a certain sequence: the distal phalangeal physes close before the proximal and middle phalangeal physes, and the distal radial physes is the last to fuse. This sequence is confirmed in this study through the different TW bone ages.
Third, the time span of each maturity stage is different. For example, during radius H (capping, R7 and R8), the distal phalangeal undergoes F (covered), G (capping), and I (fusing). Each maturity stage actually represents a certain bone age, but the time span of each stage is variable. The shorter the time span, the better it represents a certain bone age. For the DRU classification, R6 and R7 have the smallest SD (0.3 years) as compared to S whereby S4 has the smallest SD (0.2 years). The average SD of T is relatively small (0.5 years) overall. Hence, combining the DRU with other digital staging systems and using the smaller SD substages will provide a more accurate way to assess bone maturity, and also help to decrease the intra- and interobserver difference. The bone age of males can be estimated using this method by adding 2 more years as a rule of thumb.[19]
Apart from the hand and wrist approach, many other methods are used clinically for bone maturity assessment. Peak height velocity (PHV) is an important assessment time period, which occurs around 11 to 13 years of bone age in girls and 13 to 15 years in boys.[20] Risser stage 1 (iliac ossification) and menarche occur around a bone age of 13 years in girls which is post PHV. Triradiate cartilaginous closure occurs around the bone age of 12 years in girls which is near the end of PHV. Sauvégrain elbow method, and later simplified olecranon method modified by Dimeglio provide methods to assess skeletal maturity during PHV.[21] All these methods can be applied in combination for a more comprehensive assessment.
The present study has limitations mainly in the form of lacking growth-related data. Accurate assessment of bone age helps to better predict the growth phase. Normally, when a girl reaches puberty at about 10 to 11 years, the growth follows a predictable pattern. The pubertal growth spurt spans >2 years. Up to 90% of children ceased to grow by 3.6 years after the PHV.[22] The PHV is reported to be variable, at R6: 11.0 ± 0.3 years; or between S2 and S3: 11.7 ± 1 years; or between T4 and T5: 11.9 ± 0.9 years.[4,8,23] Further study is needed to validation the relationship between growth rate and bone age.
This is the first study to compare the DRU with other digital bone age staging systems. The internal relationship among the classifications is well proven. The substages with similar bone age can be used as a reference for each other. The substages with smaller SD were selected to be the references for certain bone age: 10-years proximal thumb physis covered without sesamoid (T2); 10.5-year sesamoid just appear (T3); 11-year distal radial physis just covered (medial double joint line, R6); 11.5-year medial capping of distal radial physis (R7); 12-year bilateral capping of distal radial physis (R8)/phalangeal capping without fusion (S3); 12.5-year distal phalangeal physes start fusing (S4); 13-year distal phalangeal physes fused (S5); 13.5-year proximal phalangeal physes start fusing (S6); 14.5-year proximal phalangeal physes fused (S7); 15-year distal radial physis almost fused (R10). This provides a simple way to assess skeletal maturity.
Author contributions
Conceptualization: Zhen Bian, Jason Pui Yin Cheung.
Data curation: Zhen Bian, XueMin Lyu, Zheng Yang, Jason Pui Yin Cheung.
Formal analysis: Zhen Bian, Jason Pui Yin Cheung.
Funding acquisition: Zhen Bian, Jason Pui Yin Cheung.
Investigation: Zhen Bian, Jason Pui Yin Cheung.
Methodology: Zhen Bian, Jason Pui Yin Cheung.
Project administration: Zhen Bian, Yuan Guo, Jason Pui Yin Cheung.
Resources: Zhen Bian, Yuan Guo, Jason Pui Yin Cheung.
Software: Zhen Bian.
Supervision: Yuan Guo, Jason Pui Yin Cheung.
Validation: Jason Pui Yin Cheung.
Visualization: Jason Pui Yin Cheung.
Writing – original draft: Zhen Bian.
Writing – review & editing: Zhen Bian, Yuan Guo, XueMin Lyu, Zheng Yang, Jason Pui Yin Cheung.
Footnotes
Abbreviations: CHN = Chinese standard TW bone age methods, DRU = distal radius and ulna, GP = Greulich and Pyle atlas, PHV = peak height velocity, R = radius, S = sanders staging, SD = standard deviation, T = Thumb ossification composite index, TW = Tanner and Whitehouse, U = ulna.
How to cite this article: Bian Z, Guo Y, Lyu XM, Yang Z, Cheung JPY. Relationship between hand and wrist bone age assessment methods. Medicine. 2020;99:39(e22392).
Sources of support: This study was funded by “Beijing Municipal Administration of Hospitals’ Youth Programme, code: QML20180401”.
The authors report no conflicts of interest.
Ethical approval: All procedures performed in studies involving human participants were in accordance with the ethical standards of the institutional and/or national research committee and with the 1964 Helsinki declaration and its later amendments or comparable ethical standards.
All data generated or analyzed during this study are included in this published article [and its supplementary information files]
References
- [1].Stanford University Press, Greulich WW, Pyle SI. Radiographic Atlas of Skeletal Development of the Hand and Wrist. 1959. [Google Scholar]
- [2].W.B. Saunders, Tanner JM, Healy MJR, Cameron N, et al. Assessment of Skeletal Maturity and Prediction of Adult Height (TW3 Method). 2001. [Google Scholar]
- [3].Sanders JO, Khoury JG, Kishan S, et al. Predicting scoliosis progression from skeletal maturity: a simplified classification during adolescence. J Bone Joint Surg Am 2008;90:540–53. [DOI] [PubMed] [Google Scholar]
- [4].Hung ALH, Chau WW, Shi B, et al. Thumb Ossification Composite Index (TOCI) for predicting peripubertal skeletal maturity and peak height velocity in idiopathic scoliosis: a validation study of premenarchal girls with adolescent idiopathic scoliosis followed longitudinally until skeletal maturity. J Bone Joint Surg Am 2017;99:1438–46. [DOI] [PMC free article] [PubMed] [Google Scholar]
- [5].Hung AL, Shi B, Chow SK, et al. Validation study of the Thumb Ossification Composite Index (TOCI) in idiopathic scoliosis: a stage-to-stage correlation with classic tanner-whitehouse and sanders simplified skeletal maturity systems. J Bone Joint Surg Am 2018;100:88. [DOI] [PMC free article] [PubMed] [Google Scholar]
- [6].Sanders JO, Browne RH, McConnell SJ, et al. Maturity assessment and curve progression in girls with idiopathic scoliosis. J Bone Joint Surg Am 2007;89:64–73. [DOI] [PubMed] [Google Scholar]
- [7].Luk KD, Saw LB, Grozman S, et al. Assessment of skeletal maturity in scoliosis patients to determine clinical management: a new classification scheme using distal radius and ulna radiographs. Spine J 2014;14:315–25. [DOI] [PubMed] [Google Scholar]
- [8].Cheung JP, Cheung PW, Samartzis D, et al. The use of the distal radius and ulna classification for the prediction of growth: peak growth spurt and growth cessation. Bone Joint J 2016;98-b:1689–96. [DOI] [PubMed] [Google Scholar]
- [9].Yamamoto Y, Shigematsu H, Cheung PWH, et al. How do we follow-up patients with adolescent idiopathic scoliosis? Recommendations based on a multicenter study on the distal radius and ulna classification. Eur Spine J 2020;29:2064–74. [DOI] [PubMed] [Google Scholar]
- [10].Cheung JPY, Cheung PWH, Yeng WC, et al. Does curve regression occur during underarm bracing in patients with adolescent idiopathic scoliosis? Clin Orthop Relat Res 2020;478:334–45. [DOI] [PMC free article] [PubMed] [Google Scholar]
- [11].Cheung JPY, Cheung PWH, Luk KD. When should we wean bracing for adolescent idiopathic scoliosis? Clin Orthop Relat Res 2019;477:2145–57. [DOI] [PMC free article] [PubMed] [Google Scholar]
- [12].Cheung JPY, Cheung PWH, Samartzis D, et al. Curve progression in adolescent idiopathic scoliosis does not match skeletal growth. Clin Orthop Relat Res 2018;476:429–36. [DOI] [PMC free article] [PubMed] [Google Scholar]
- [13].Cheung PWH, Wong CKH, Cheung JPY. Psychometric validation of the adapted Traditional Chinese version of the Japanese Orthopaedic Association Back Pain Evaluation Questionnaire (JOABPEQ). J Orthop Sci 2018;23:750–7. [DOI] [PubMed] [Google Scholar]
- [14].Verma K, Sitoula P, Gabos P, et al. Simplified skeletal maturity scoring system: learning curve and methods to improve reliability. Spine (Phila Pa 1976) 2014;39:E1592–8. [DOI] [PubMed] [Google Scholar]
- [15].Cheung JP, Samartzis D, Cheung PW, et al. Reliability analysis of the distal radius and ulna classification for assessing skeletal maturity for patients with adolescent idiopathic scoliosis. Global Spine J 2016;6:164–8. [DOI] [PMC free article] [PubMed] [Google Scholar]
- [16].Cheung JP, Samartzis D, Cheung PW, et al. The distal radius and ulna classification in assessing skeletal maturity: a simplified scheme and reliability analysis. J Pediatr Orthop B 2015;24:546–51. [DOI] [PubMed] [Google Scholar]
- [17].Zhang SY, Liu LJ, Wu ZL, et al. Standards of TW3 skeletal maturity for Chinese children. Ann Hum Biol 2008;35:349–54. [DOI] [PubMed] [Google Scholar]
- [18].Loder RT, Farley FA, Herring JA, et al. Bone age determination in children with Legg-Calve-Perthes disease: a comparison of two methods. J Pediatr Orthop 1995;15:90–4. [DOI] [PubMed] [Google Scholar]
- [19].Heyworth BE, Osei DA, Fabricant PD, et al. The shorthand bone age assessment: a simpler alternative to current methods. J Pediatr Orthop 2013;33:569–74. [DOI] [PubMed] [Google Scholar]
- [20].Dimeglio A. Growth in pediatric orthopaedics. J Pediatr Orthop 2001;21:549–55. [PubMed] [Google Scholar]
- [21].Charles YP, Dimeglio A, Canavese F, et al. Skeletal age assessment from the olecranon for idiopathic scoliosis at Risser grade 0. J Bone Joint Surg Am 2007;89:2737–44. [DOI] [PubMed] [Google Scholar]
- [22].Little DG, Song KM, Katz D, et al. Relationship of peak height velocity to other maturity indicators in idiopathic scoliosis in girls. J Bone Joint Surg Am 2000;82:685–93. [DOI] [PubMed] [Google Scholar]
- [23].Sanders JO, Browne RH, Cooney TE, et al. Correlates of the peak height velocity in girls with idiopathic scoliosis. Spine (Phila Pa 1976) 2006;31:2289–95. [DOI] [PubMed] [Google Scholar]


