

Supplemental Digital Content is available in the text.
Keywords: bacteremia; critical care; fungemia, physiologic monitoring; sepsis; statistical models
Abstract
Objectives:
Bloodstream infection is associated with high mortality rates in critically ill patients but is difficult to identify clinically. This results in frequent blood culture testing, exposing patients to additional costs as well as the potential harms of unnecessary antibiotics. The purpose of this study was to assess whether the analysis of bedside physiologic monitoring data could accurately describe a pathophysiologic signature of bloodstream infection in patients admitted to the ICU.
Design:
Development of a statistical model using physiologic data from a retrospective observational cohort.
Setting:
University of Virginia Medical Center (Charlottesville, VA), a tertiary-care academic medical center.
Patients:
Critically ill patients consecutively admitted to either the medical or surgical/trauma ICUs with available physiologic monitoring data between February 2011 and June 2015.
Interventions:
None.
Measurements and Main Results:
We analyzed 9,954 ICU admissions with 144 patient-years of vital sign and electrocardiography waveform data, totaling 1.3 million hourly measurements. There were 15,577 blood culture instances, with 1,184 instances of bloodstream infection (8%). The multivariate pathophysiologic signature of bloodstream infection was characterized by abnormalities in 15 different physiologic features. The cross-validated area under the receiver operating characteristic curve was 0.78 (95% CI, 0.69–0.85). We also identified distinct signatures of Gram-negative and fungal bloodstream infections, but not Gram-positive bloodstream infection.
Conclusions:
Signatures of bloodstream infection can be identified in the routine physiologic monitoring data of critically ill adults. This may assist in identifying infected patients, maximizing diagnostic stewardship, and measuring the effect of new therapeutic modalities for sepsis.
Bloodstream infection (BSI) is associated with a high risk of mortality (1–3). This is especially true in critically ill patients, in whom BSI has reported mortality rates of 30–47% (4–7). Clinical signs and symptoms of BSI are nonspecific, and published guidelines do not provide clear indications for when it is most appropriate to obtain blood cultures (8). Therefore, clinicians often have a low threshold to perform blood culture testing (9). This leads to a low diagnostic yield, with true positive rates of 4–7% (9, 10). In addition, there are a significant number of false positives (i.e., contaminants), which lead to increased cost, length of hospital stay, and unnecessary antibiotic use (11–15). Smaller studies have attempted to better identify distinguishing features of BSI in hospitalized patients; however, many of these have had a narrow focus regarding the types of patients or the types of infections included (e.g., only patients with urinary tract infection), as opposed to focusing on defining features of BSI as a whole (16–19). Additionally, attempts to compose multivariate scoring systems and clinical prediction rules for BSI often categorize continuous variables (18–20), which leads to loss of information and predictive capability (21).
Routine physiologic monitoring data contain dynamic multivariate signatures of critical illness states (22). There is a growing recognition of the heterogeneity of sepsis physiology, including the recent identification of four physiologic phenotypes of sepsis (23). We tested the hypothesis that routine monitoring data could describe a detailed and distinct pathophysiologic phenotype of BSI in critically ill adult patients. This physiologic description could provide a basis for future predictive modeling in order to improve recognition of infected patients, maximize diagnostic stewardship of blood cultures, measure the effectiveness of treatments, and identify opportunities for the development of novel therapeutics.
MATERIALS AND METHODS
Study Design
We retrospectively analyzed blood cultures associated with admissions to a 15-bed adult surgical/trauma ICU and 29-bed medical ICU from February 2011 to June 2015 at the University of Virginia (UVa) Medical Center, an academic tertiary-care center. Each ICU was equipped with continuous physiologic monitoring systems whose signals were archived in an electronic data warehouse along with the entire medical record.
The primary outcome was BSI, defined as a single blood culture with growth of a pathogenic organism. We focused on physiologic data from 12 hours before until 24 hours after a positive blood culture. As controls, we included data from patients with negative blood cultures as well as from those who did not have blood cultures obtained, along with data greater than 12 hours before acquisition of a positive blood culture for patients with BSI. We censored data more than 24 hours following a BSI instance unless they were within 12 hours before to 24 hours after another BSI instance. We performed a secondary analysis comparing instances of Gram-positive (GP), Gram-negative (GN), and fungal BSIs with negative culture instances. The UVa Institutional Review Board approved this study with a waiver of informed consent.
Outcome Definition and Contaminant Identification
We defined a blood culture “set” as a single culture acquisition, typically an inoculation of two blood culture bottles. We grouped all sets into blood culture “instances,” defined as a sequence of sets from a single patient where each set was within 1 hour of the last. We categorized each instance as positive, negative, or contaminated. To do this, we identified all the unique organisms that were isolated and labeled them as either potential contaminants or true pathogens. We labeled all instances that grew true pathogens as positive. Organisms deemed potential contaminants included coagulase-negative staphylococci, Propionibacterium species, Bacillus species, Corynebacterium species, and viridans group streptococci. For these, we labeled the organism as a contaminant if it was present in only one set of a culture instance (15) or in only one of the two bottles in an instance comprised of a single set. We adjudicated instances with potential contaminants that did not meet these criteria (i.e., multiple sets grew a potential contaminant) by an independent review of the medical record by two separate clinicians who were blinded to each other’s decisions (A.N.Z. and C.C.M.). A third clinician (T.D.B.) adjudicated discordant decisions, also in a blinded fashion. We labeled instances as contaminated if a contaminant was the only growth. We labeled instances with both true pathogens and contaminants as positive. We labeled instances with growth of multiple true pathogens as a single positive instance. For individual isolate modeling, these polymicrobial culture instances were labeled as positive for all true pathogen isolate classes that were grown (i.e., an instance with growth of Staphylococcus aureus and Escherichia coli was labeled as both GP and GN).
Model Development and Validation
We performed modeling in R 3.5.1 (R Core Team 2018, Vienna, Austria) using the “rms” package (24). We used the Transparent Reporting of a multivariable prediction model for Individual Prognosis or Diagnosis (TRIPOD) guidelines and followed the recommendations set forth by Leisman et al (21) to analyze and report this study (25). For the univariate analysis, we calculated predictiveness curves to show the independent association of 40 vital signs, laboratory values, and continuous cardiorespiratory monitoring (CRM) variables with instances of BSI compared with negative cultures. In order to reduce bias due to repeated measures and missing data, we used a bootstrapping technique to estimate the predictiveness curves. We randomly sampled one measurement within 12 hours before to 24 hours after each instance. We calculated the relative risk of BSI at each decile of the sampled variable and then interpolated the risk to 20 points evenly spaced in the range of the variable. We repeated this process of sampling, calculating relative risk, and interpolating 30 times. Finally, we averaged the 30 risk estimate curves to obtain a bootstrapped predictiveness curve at the 20 evenly spaced points and displayed the results as a heat map.
For multivariate modeling (both for the aggregate BSI model and the individual isolate models), we assessed 40 physiologic variables and developed a statistical model on the entire cohort, using cross-validation to reduce bias in feature selection and performance characteristics. We used multivariate logistic regression adjusted for repeated measures to relate physiologic data to the BSI outcome. We systematically built the models by: 1) removing, blinded to the outcome, the most predictable features correlated more than R2 of 0.9 with other features, 2) imputing missing values with median values for the study population, 3) building a model with all remaining features, adjusting for repeated measures using the Huber-White method (24), 4) using fast backward elimination to remove features most predictable by other features in the model, based on an Akaike information criterion (AIC) threshold of zero (26), 5) repeating steps 3 and 4 with restricted cubic splines (three, four, and five knots of nonlinearity) on each feature with enough unique values (22, 24), and (6) selecting the model (linear or nonlinear with three, four, or five knots) that maximized the AIC. Finally, to ensure unbiased feature selection, we performed 10-fold cross-validation with fast backward elimination, removing eliminated features and retraining the model.
In the absence of a suitable second extrinsic dataset, we performed internal validation using 10-fold cross-validation (TRIPOD type 1b model study) (25, 27). We randomly split the patient-admissions into 10 groups, excluded a single group’s data as a test set, trained a model on the remaining data, and then used that model to estimate the risk of BSI (or specifically GP, GN, or fungal BSIs, depending on the model being tested) for the test set. We repeated this procedure until each of the 10 groups had served as a test set. We evaluated the performance of the models based on the resulting predicted risks instead of the in-sample predicted risks. Although this method calculated out-of-sample predictions with the same features, we made the predictions with slightly different models, one for each test set. For continuous risk estimation, we calculated the area under the receiver operating characteristic curve (AUC) and 95% CIs using 200 bootstrap runs, each accounting for repeated measures from each hospital admission. For the individual isolate class models, we calculated AUCs for all three classes of BSI—that is, for each model, we calculated its AUC for GP, GN, and fungal BSIs compared with negative cultures.
As sensitivity analyses, we repeated our modeling procedure for the aggregate model with the following changes: 1) using only data 12 hours prior to a positive culture, censoring any data afterward unless those data were 12 hours prior to a subsequent positive culture, 2) using only patients with negative blood cultures as the control group, 3) using only patients without blood cultures obtained as the control group, and 4) using only data surrounding the first positive blood culture during an ICU admission.
RESULTS
Demographics, Clinical/Microbiologic Characteristics, and Outcomes
We analyzed 9,954 ICU admissions with over 144 patient-years of physiologic data, totaling 1.3 million hourly measurements. Patients were primarily male (56%) and White (81%), with a median age of 59 years (Table 1). At least one blood culture was obtained in 5,671 admissions (57%). There were 15,577 blood culture instances comprising 27,337 blood culture sets, with 1,184 instances (8%) of BSI (Fig. S1, Supplemental Digital Content, http://links.lww.com/CCX/A380). The most common isolated organisms can be found in Table S1 (Supplemental Digital Content, http://links.lww.com/CCX/A382).
Table 1.
Clinical and Demographic Characteristics of Critically Ill Adult Patients Admitted to the ICU, 2011–2015
| Demographic/Clinical Variable | All (n = 9,954) | Positive Blood Cultures (n = 744) | Negative Blood Cultures Only (n = 4,927) | No Blood Cultures Obtained (n = 4,283) |
|---|---|---|---|---|
| Age, mean yr (range) | 59 (47–71) | 61 (51–72) | 60 (49–71) | 58 (45–71) |
| Sex, n (%) | ||||
| Male | 5,584 (56) | 399 (54) | 2,764 (56) | 2,424 (57) |
| Female | 4,370 (44) | 345 (46) | 2,163 (44) | 1,859 (43) |
| Race, n (%) | ||||
| White | 8,022 (81) | 585 (79) | 3,859 (78) | 3,578 (84) |
| Black | 1,681 (17) | 142 (19) | 940 (19) | 599 (14) |
| Other | 197 (2) | 14 (2) | 95 (2) | 88 (2) |
| Asian | 41 (< 1) | 2 (< 1) | 23 (< 1) | 16 (< 1) |
| Unspecified | 10 (< 1) | 0 (< 1) | 8 (< 1) | 2 (< 1) |
| Native American | 3 (< 1) | 1 (< 1) | 2 (< 1) | 0 (< 1) |
| Medical ICU admissions, n (%) | 5,157 (52) | 509 (68) | 3,326 (67.5) | 1,323 (31) |
| Surgical ICU admissions, n (%) | 4,797 (48) | 235 (32) | 1,601 (33) | 2,960 (69) |
| Acute Physiology and Chronic Health Evaluation score, median (range) | 14 (10–24) | 25 (15–30) | 17 (12–26) | 12 (9–16) |
The median (interquartile range) length of hospital stay for patients with BSI was 15 days (8–30 d) compared with 10 days (6–17 d) (p < 0.0001) for patients with negative cultures and 5 days (3–8 d) (p < 0.0001) for patients without any blood cultures obtained. Of the 744 patients with BSI, 207 (28%) died in hospital, compared with 774 of 4,927 patients (16%) with negative blood cultures (odds ratio [OR] 2.07; 95% CI, 1.73–2.47; p < 0.0001) and 171 of 4,283 patients (4%) without any blood cultures obtained (OR 9.27; 95% CI, 7.43–11.57; p < 0.0001). The length of stay and mortality by ICU and isolate class are shown in Figure S2 (Supplemental Digital Content, http://links.lww.com/CCX/A381).
Pathophysiologic Signatures of BSI
Univariate analysis of 40 physiologic variables (Table S2, Supplemental Digital Content, http://links.lww.com/CCX/A383) identified trends in each, which were associated with BSI classes (Fig. 1). Multivariate logistic regression modeling identified a signature of 15 independent physiologic features that best characterized BSI (Fig. 2A). These features were, in decreasing strength of association: temperature, serum bicarbonate, platelet count, systolic blood pressure, blood urea nitrogen (BUN)/creatinine ratio, serum glucose, serum chloride, WBC count, age, respiratory rate, pulse rate, the cross-correlation coefficient of heart rate and oxygen saturation, serum calcium, serum potassium, and the cross-correlation coefficient of heart rate and electrocardiogram-derived respiratory rate. Several of the features in the model had nonlinear associations with BSI (e.g., temperature and WBC concentration). The cross-validated AUC was 0.78 (95% CI, 0.69–0.85). The model developed solely on data 12 hours prior to a positive blood culture included 13 physiologic features, nine of which were identical or similar to features in the original model (platelet count, pulse rate, BUN/creatinine ratio, temperature, diastolic blood pressure, serum bicarbonate concentration, serum chloride concentration, age, and cross-correlation coefficient of heart rate and clinician-documented respiratory rate). The cross-validated AUC of this model was 0.76 (95% CI, 0.75–0.76). The sensitivity analyses with different control groups identified a similar set of pathophysiologic features and trends characterizing BSI with similar AUCs (patients with negative cultures as controls, AUC = 0.73 [95% CI, 0.67–0.78]; and patients without blood cultures obtained as controls, AUC = 0.85 [95% CI, 0.80–0.89]). Finally, the analysis using data surrounding only the first positive culture instance from an admission also identified similar features to our aggregate model, also with a similar AUC (0.78; 95% CI, 0.74–0.83).
Figure 1.
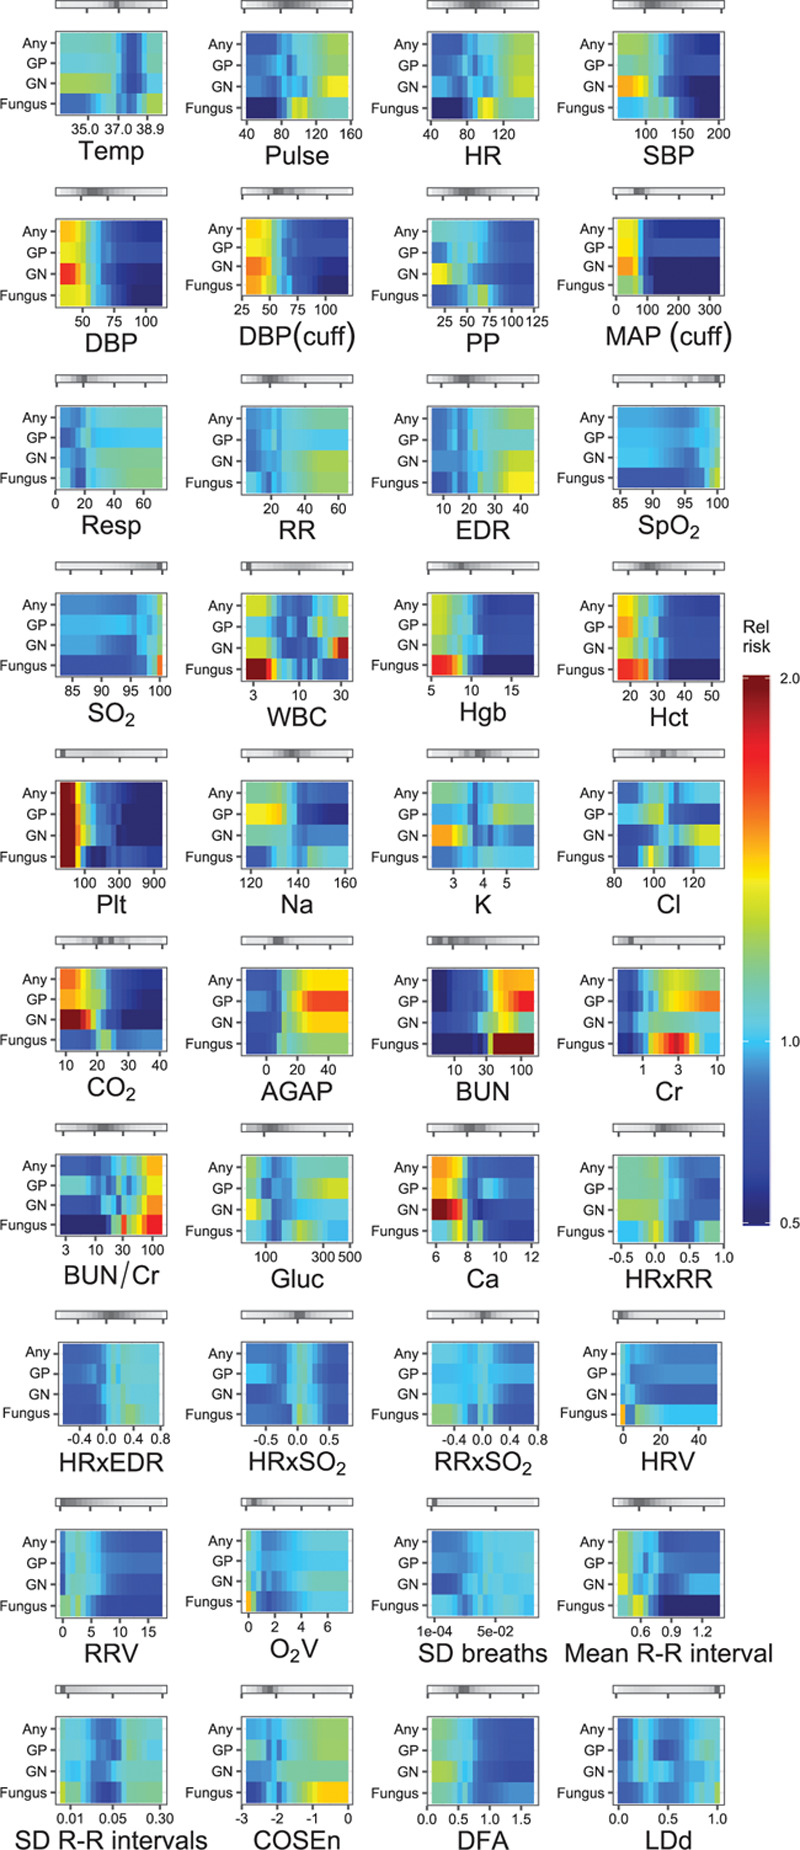
Heat map depiction of the univariate risk of different classes of bloodstream infection (BSI) as a function of 40 measured physiologic variables in 9,954 critically ill patients, 2011–2015. Each tile plots the value of the variable on the x-axis against the relative risk of BSI isolate class per ventile of the variable on the y-axis. A red color saturation indicates higher relative risk of the isolate class for that ventile of the variable; a blue saturation indicates a lower relative risk. The gray bars above each tile indicate the distribution of measurements for each variable—darker gray indicates more measurements present in that range of the variable. AGAP = anion gap (mEq/L), BUN = blood urea nitrogen (mg/dL), BUN/Cr = blood-urea-nitrogen-to-serum-creatinine ratio, Ca = serum calcium concentration (mg/dL), Cl = serum chloride concentration (mmol/L), CO2 = serum bicarbonate (mmol/L), COSEn = coefficient of sample entropy of R-R interval, Cr = serum creatinine (mg/dL), DBP (cuff) = cuff-measured diastolic blood pressure (mm Hg), DBP = invasive diastolic blood pressure (mm Hg), DFA = detrended fluctuation analysis applied to R-R intervals, EDR = electrocardiogram-derived respiratory rate (breaths/min), Gluc = blood glucose (mg/dL), GN = Gram negative, GP = Gram positive, Hct = hematocrit (%), HR = heart rate measured by cardiac telemetry (beats/min), HRV = sd of heart rate by cardiac telemetry (beats/min), HRxEDR = cross-correlation coefficient of heart rate and electrocardiogram-derived respiratory rate, HRxRR = cross-correlation coefficient of heart rate measured by cardiac telemetry and respiratory rate measured by chest impedance, HRxSO2 = cross-correlation coefficient of heart rate measured by cardiac telemetry and oxygen saturation measured by continuous pulse oximetry, K = serum potassium concentration (mmol/L), LDd = local dynamics density of heart rate, MAP (cuff) = cuff-measured mean arterial pressure (mm Hg), Mean R-R interval = mean R-R interval by cardiac telemetry (s), Na = serum sodium concentration (mEq/L), O2V = sd of oxygen saturation by pulse oximetry (%), Plt = platelet concentration (k/uL), PP = pulse pressure (mm Hg), Pulse = heart rate measured by pulse oximetry (beats/min), Resp = clinician-documented respiratory rate (breaths/min), RR = respiratory rate measured by chest impedance (breaths/min), RRV = sd of respiratory rate by chest impedance (breaths/min), RRxSO2 = cross-correlation coefficient of respiratory rate measured by chest impedance and oxygen saturation measured by pulse oximetry, SBP = invasive systolic blood pressure (mm Hg), sd breaths = sd of electrocardiogram-derived respiratory rate (breaths/min), sd R-R intervals = sd of the R-R interval by cardiac telemetry (s), SO2 = oxygen saturation measured by continuous pulse oximetry (%), Hgb = hemoglobin (g/dL), SpO2 = clinician-documented oxygen saturation (%), Temp = temperature (°C).
Figure 2.
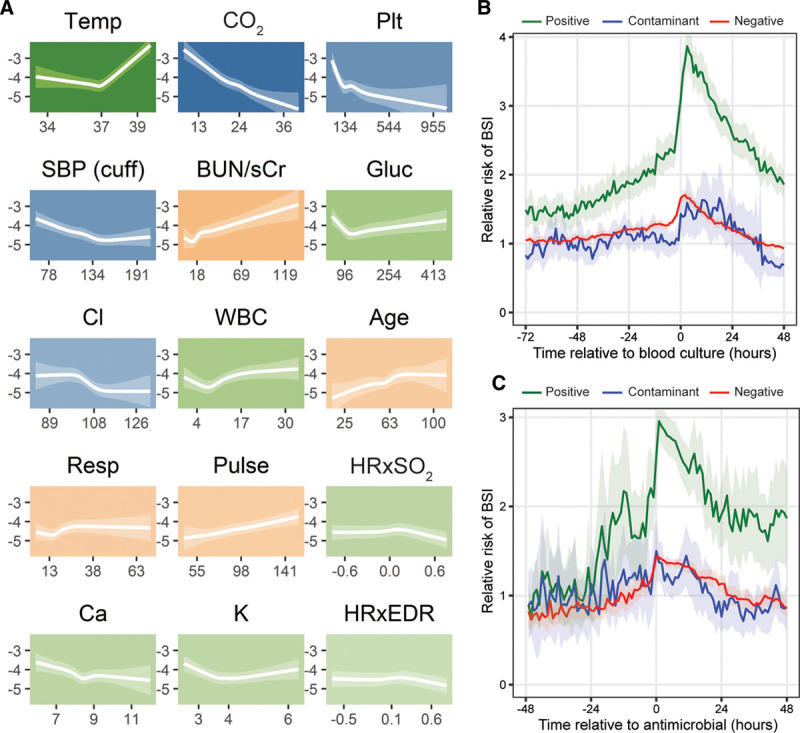
Pathophysiologic model of bloodstream infection (BSI) in critically ill adults. A, Fifteen pathophysiological features comprising a signature of BSI in 9,954 critically ill patients, 2011–2015. Each tile plots the value of the feature on the x-axis against the log-odds of BSI on the y-axis. The translucent ribbon represents the 95% CI. Background hue represents the direction of association with BSI—orange indicates positive association, blue indicates negative association, and green indicates nonlinear or biphasic association. Background color saturation indicates the strength of the association with BSI. B, Predicted risk of BSI according to a multivariate logistic regression model as a function of time relative to blood culture. The translucent ribbon represents the 95% CI. C, Predicted risk of BSI according to a multivariate logistic regression model as a function of time relative to antimicrobial administration. The translucent ribbon represents the 95% CI. Patient data were grouped as positive, negative, or contaminant based on the ultimate result of the culture instance at time 0. BUN/sCr = blood-urea-nitrogen-to-serum-creatinine ratio, Ca = serum calcium concentration (mg/dL), Cl = serum chloride concentration (mmol/L), CO2 = serum bicarbonate (mmol/L), Gluc = blood glucose (mg/dL), HRxEDR = cross-correlation coefficient of heart rate and electrocardiogram-derived respiratory rate, HRxSO2 = cross-correlation coefficient of heart rate and oxygen saturation by continuous pulse oximetry, K = serum potassium concentration (mmol/L), Plt = platelet concentration (k/uL), Pulse = heart rate measured by pulse oximetry (beats/min), Resp = clinician-documented respiratory rate (breaths/min), SBP (cuff) = cuff-measured systolic blood pressure (mm Hg), Temp = temperature (degrees Celsius).
In order to describe the time frame during which BSI physiology was detectable, we assessed whether the identified signature was present in a window of 72 hours leading up to the time of culture and whether it changed after systemic antimicrobial administration. Figure 2B shows the relative risk of BSI as a function of time to blood culture. For patients with positive cultures, the average relative risk began to rise 24–48 hours prior to the culture. Patterns for patients who ultimately had negative or contaminated cultures were similar to consistently lower relative risks compared with the positive group. The relative risk of BSI in patients with positive cultures began to fall soon after antimicrobial administration (Fig. 2C); however, it did not return to the pretreatment average baseline risk during the subsequent 48 hours.
We also identified individual signatures of illness arising from different isolate classes (Fig. 3). Only six of the physiologic variables assessed were present in multiple isolate models; otherwise, each of these models was composed of unique features. These isolate class models performed variably when estimating risk of different classes of BSI (Fig. 4).
Figure 3.
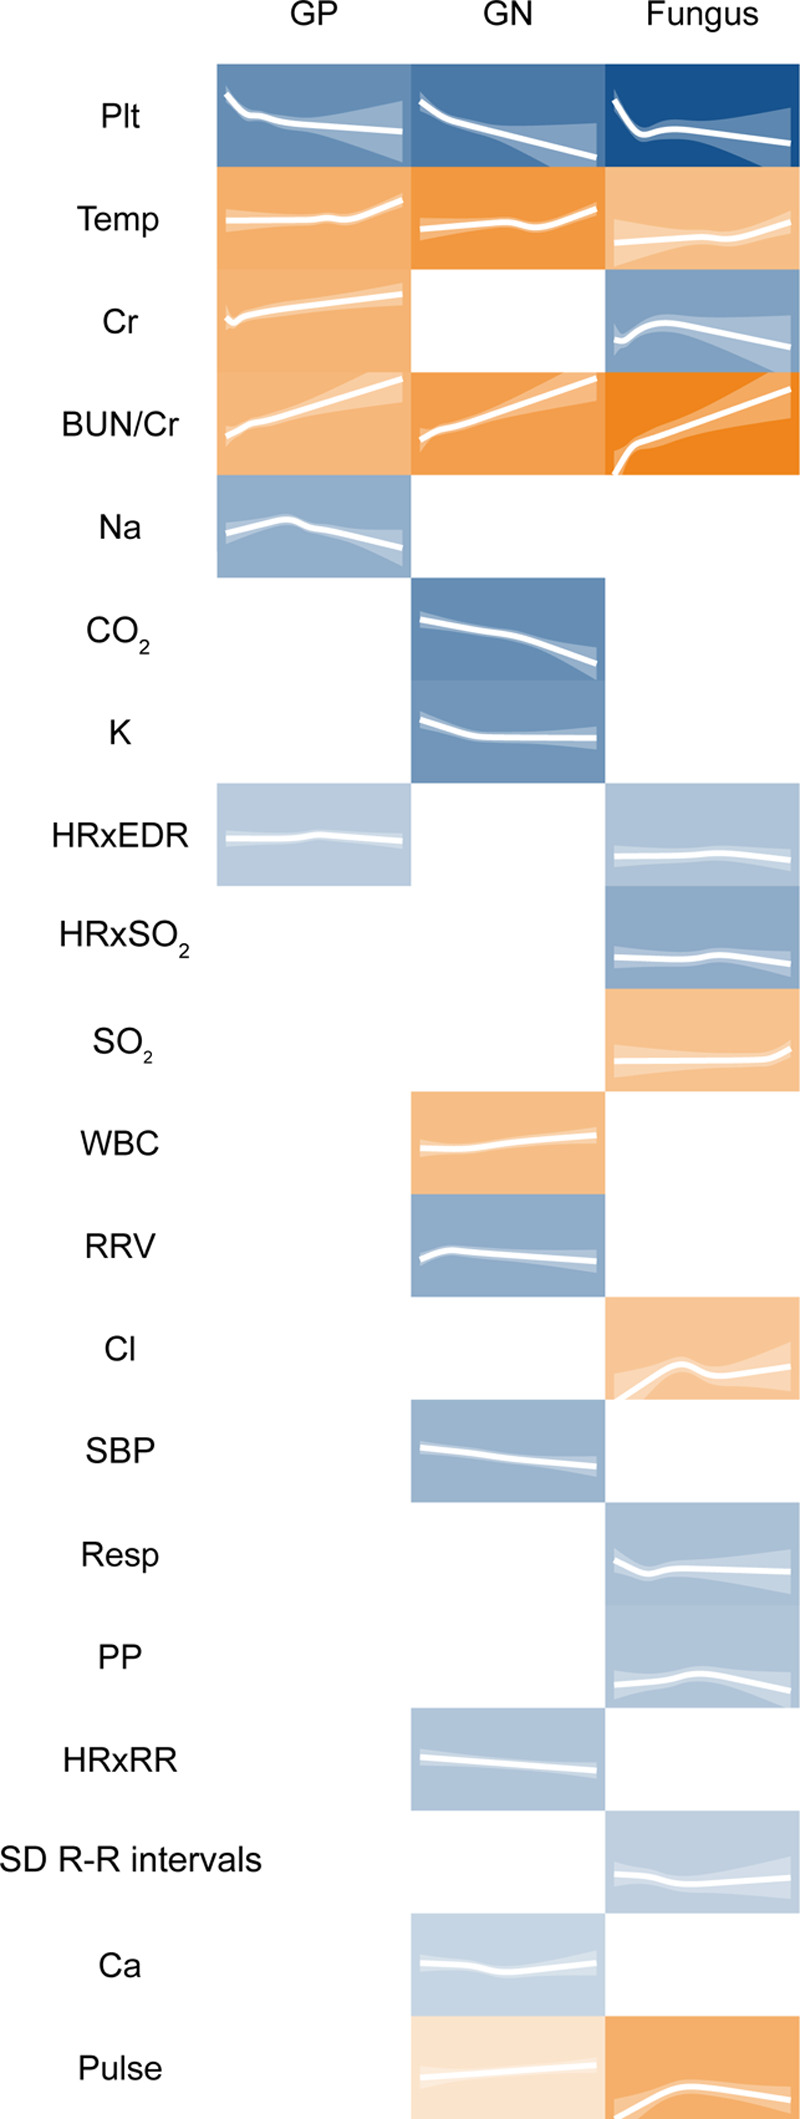
Individual pathophysiological signatures of Gram-positive (GP), gram-negative (GN), and fungal bloodstream infections (BSIs) identified from 9,954 critically ill patients, 2011–2015. Each tile plots the value of the feature against the log-odds of BSI. The translucent ribbon represents the 95% CI. Background hue represents the direction of association with BSI—orange indicates positive association and blue indicates negative association. Background color saturation indicates the strength of the association with BSI. BUN/sCr = blood-urea-nitrogen-to-serum-creatinine ratio, Ca = serum calcium concentration (mg/dL), Cl = serum chloride concentration (mmol/L), CO2 = serum bicarbonate (mmol/L), Cr = serum creatinine (mg/dL), HRxEDR = cross-correlation coefficient of heart rate and electrocardiogram-derived respiratory rate, HRxRR = cross-correlation coefficient of heart rate measured by cardiac telemetry and respiratory rate measured by chest impedance, HRxSO2 = cross-correlation coefficient of heart rate and oxygen saturation by continuous pulse oximetry, K = serum potassium concentration (mmol/L), Na = serum sodium concentration (mEq/L), Plt = platelet concentration (k/uL), PP = pulse pressure (mm Hg), Pulse = heart rate measured by pulse oximetry (beats/min), Resp = clinician-documented respiratory rate (breaths/min), SBP = invasive systolic blood pressure (mm Hg), sd R-R intervals = sd of the R-R interval by cardiac telemetry (s), SO2 = oxygen saturation measured by continuous pulse oximetry (%), Temp = temperature (°C), RRV = sd of respiratory rate by chest impedance (breaths/min).
Figure 4.
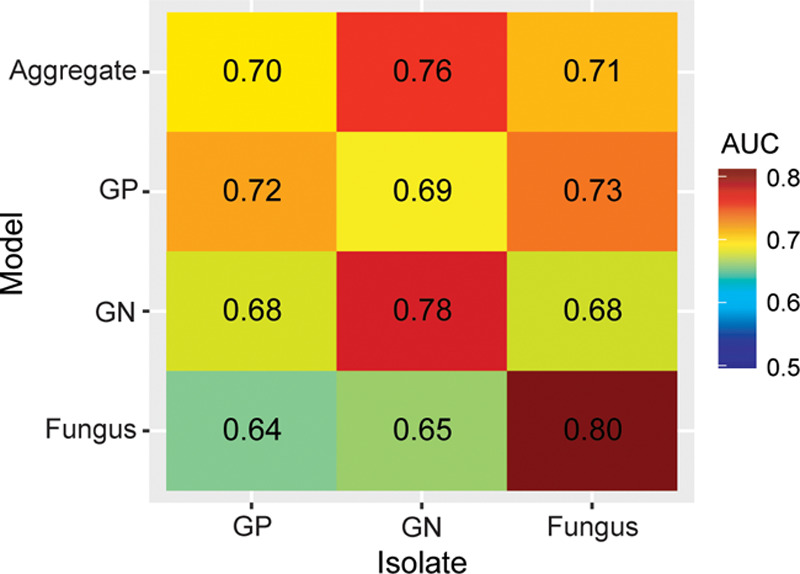
Area under the receiver operating characteristic curve (AUC) for models of aggregate, Gram-positive (GP), Gram-negative (GN), and fungal bloodstream infections (BSI), evaluated on all isolate classes against negative blood cultures among 1,184 instances of BSI in critically ill patients, 2011–2015. GN and fungal BSIs are well predicted by their own models, whereas fungal BSI is also reasonably well predicted by the GP model. GP BSI is not well predicted by any model.
DISCUSSION
We applied multivariate logistic regression to describe signatures of BSI in the physiologic data of critically ill adults. The comprehensive signature was composed of 15 different features from vital sign, laboratory, and CRM data, with an AUC of 0.78, indicating good discriminatory capability. To our knowledge, this is the first study that provides a comprehensive and quantitative model of the clinical pathophysiology of BSI.
The features of the aggregate model described a pathophysiologic response to BSI, which was consistent with the syndrome of systemic inflammation that often precipitates blood culture testing, including fever or hypothermia, altered hemodynamics, tachypnea, and leukocytosis or leukopenia (9, 16, 18). There were also markers of end-organ damage, including low serum bicarbonate, markers of kidney dysfunction, and low platelet count (28). Additional laboratory values present in the model represented other metabolic derangements frequently seen in critically ill states—hyperglycemia, hyper- and hypokalemia, hypochloremia, and hypocalcemia (29, 30). The model identified rising risk in patients with BSI 24–48 hours prior to the time blood cultures were obtained (Fig. 2B), reflecting a rising degree of physiologic or biochemical abnormality in the hours prior to clinical recognition of BSI.
Notably, none of the abnormalities included in the model are necessarily specific to BSI as opposed to other focal infections. This may explain the concomitant, though less steep, increase in relative risk among the negative and contaminant cohorts leading up to the time of blood culture (Fig. 2B). These patients may have exhibited similar pathophysiologic abnormalities due to the presence of focal infections, but those derangements did not escalate to the level characteristic of BSI. Despite these small rises among the negative and contaminant groups, there remained a clear difference in relative risk among patients who eventually had positive blood cultures as early as 48–72 hours prior to obtaining the culture. This suggests that the deranged physiology escalates to an identifiable level in patients with BSI well prior to the time of clinical recognition prompting blood culture testing. The sensitivity analysis focusing only on data 12 hours prior to obtaining a blood culture had similar features and performed comparably with the original model, further suggesting that a distinct signature can be identified from data prior to the time of blood culture acquisition.
The physiology described in the GN model appeared unique to GN infection, and the aggregate model was better able to describe GN BSI compared with GP and fungal isolates (Fig. 4). This suggests that GN BSI elicits an especially distinct pathophysiology. The derangements most strongly correlated with GN BSI were hypotension, thrombocytopenia, metabolic acidosis, and hypocalcemia (Fig. 1), all markers of organ dysfunction and critical illness (28–30). These findings are consonant with the classic conception of endotoxin-mediated GN sepsis as a characteristically inflammatory syndrome, with a higher likelihood of progression to shock than other types of infection (31).
GP BSI was not clearly distinguishable, as GP isolates were not well predicted by any model (Fig. 4). The ability to detect a distinct GP signature may be impeded by the heterogeneity of infections within this isolate group. Among common GP pathogens, there is a wide distribution of more virulent organisms (such as S. aureus) and less virulent organisms (such as enterococci). This may lead to an array of different pathophysiologic responses to GP BSI and, thus, a less clear signal attributable to this isolate class. Fungal isolates were well predicted by the fungal model (Fig. 4), and the univariate analysis showed several individual physiologic variables that correlated strongly with fungal BSI, such as cytopenias (Fig. 1). However, we suspect this constellation of abnormalities was more representative of severe comorbid conditions (e.g., hematological malignancies) that predisposed to invasive fungal infection, rather than the pathophysiologic response of the host.
Aside from the identification of clinical phenotypes, physiologic modeling of BSI may also prove useful in the assessment of novel therapeutic modalities for sepsis. As multidrug-resistant organisms outpace the development of new antibiotics, there is a growing line of research investigating modulation of the molecular pathways that drive the pathophysiologic response to infection as a means of reducing morbidity and mortality in sepsis (32–35). A detailed description of the pathophysiology of infection, as we performed in this study, could help generate hypotheses for potential targets of future therapeutics. Additionally, our model shows an ability to detect a change in the pathophysiology of BSI in response to therapy (Fig. 2C). This suggests a potential utility in the quantification of response to standard and novel therapeutics for sepsis if the model were further refined for such a purpose.
A major strength of our study is the size of the dataset. To our knowledge, with over 27,000 blood culture sets, 1,184 instances of BSI, and 1.3 million hours of physiologic data, this is the largest study of the clinical correlates of BSI yet described. Another strength is the model’s ability to produce an instantly updated, quantitative description of BSI physiology composed of continuous physiologic variables. The most successful studies for identifying BSI to date have primarily categorized continuous variables in order to compose clinical prediction rules (18, 19). This leads to inappropriate assumptions about the significance of different values of the variables in question and foregoes useful information about changes in those variables (21). Our model immediately quantifies the change in risk from small changes in any of its physiologic features to produce a new and continuously updated estimate of BSI physiology in a given patient. This has the potential to describe more faithfully the pathophysiology of infection in a critically ill patient. The model we present here could be refined for predictive purposes to assist with recognition of BSI (or lack thereof) in critically ill adults and, thus, affect clinical outcomes, but that was not the goal of this study.
There are several limitations to this study. First, we elected to include data associated with repeat positive blood culture instances from the same patient-admission. This may have introduced bias by allowing individual patients’ physiology to overly influence the model if they had multiple positive cultures. However, when we repeated modeling using only data surrounding the first positive culture instance during an admission, we identified similar features and trends with good discrimination. Since data from repeat positive cultures did not have a significant impact on the features or trends seen in the model, we retained them in our models.
Additionally, our model was generated using single-center, retrospective, observational data. The addition of a larger, more diverse patient population would allow for external validation and improve the generalizability of our findings. Our model was also designed purely for descriptive purposes as opposed to bedside prediction of BSI risk. A bedside display of sepsis risk based on physiologic data has been shown to reduce mortality in very low birth weight infants, even without establishing thresholds or guidelines for interpretation (36); however, validation of the predictive utility of our modeling would require future refinement specifically for predictive purposes, ideally accompanied by a multicenter prospective study.
Finally, the inclusion of patients with no blood cultures in the control group introduces uncertainty as to whether all control group patients were truly without BSI, since a substantial portion (43%) was not tested during their ICU admission. However, our sensitivity analysis using only patients with negative blood cultures as controls identified a distinct BSI pathophysiologic profile with good discrimination. This finding supports our strategy of including patients without any blood cultures as controls, which allowed us to describe comprehensively pathophysiologic differences between the patients with BSI and all other ICU patients, not just those who underwent blood culture testing.
CONCLUSIONS
We used data from a large number of critically ill patients to identify pathophysiologic signatures of BSI. We believe this type of physiologic modeling could have a future role in bedside decision-making regarding the utility of blood culture testing and could be integrated into the investigation of novel therapeutics for sepsis.
ACKNOWLEDGMENTS
We thank the members of the Center for Advanced Medical Analytics, University of Virginia for their mentorship and guidance in statistical analysis and interpretation. We especially thank Prof. D. E. Lake for his willingness to give advice while maintaining intense focus on competing valiantly in the PhysioNet sepsis challenge.
Supplementary Material
Footnotes
This study was performed at the University of Virginia Medical Center.
Supplemental digital content is available for this article. Direct URL citations appear in the printed text and are provided in the HTML and PDF versions of this article on the journal’s website (http://journals.lww.com/ccejournal).
The Center for Advanced Medical Analytics, University of Virginia, is supported by the Frederick Thomas Advanced Medical Analytics Fund. This study was also supported by the University of Virginia Global Infectious Disease Institute.
Dr. Clark is employed by and holds equity in Advanced Medical Predictive Devices, Diagnostics, and Displays (AMP3D), Charlottesville, VA, which has licensed technologies from the University of Virginia Licensing and Ventures Group. Dr. Moorman is the chief medical officer of and holds equity in AMP3D. The remaining authors have disclosed that they do not have any potential conflicts of interest.
REFERENCES
- 1.Weinstein MP, Murphy JR, Reller LB, et al. The clinical significance of positive blood cultures: A comprehensive analysis of 500 episodes of bacteremia and fungemia in adults. II. Clinical observations, with special reference to factors influencing prognosis. Rev Infect Dis. 1983; 5:54–70 [DOI] [PubMed] [Google Scholar]
- 2.Weinstein MP, Towns ML, Quartey SM, et al. The clinical significance of positive blood cultures in the 1990s: A prospective comprehensive evaluation of the microbiology, epidemiology, and outcome of bacteremia and fungemia in adults. Clin Infect Dis. 1997; 24:584–602 [DOI] [PubMed] [Google Scholar]
- 3.Laupland KB, Church DL. Population-based epidemiology and microbiology of community-onset bloodstream infections. Clin Microbiol Rev. 2014; 27:647–664 [DOI] [PMC free article] [PubMed] [Google Scholar]
- 4.Edgeworth JD, Treacher DF, Eykyn SJ. A 25-year study of nosocomial bacteremia in an adult intensive care unit. Crit Care Med. 1999; 27:1421–1428 [DOI] [PubMed] [Google Scholar]
- 5.Pittet D, Tarara D, Wenzel RP. Nosocomial bloodstream infection in critically ill patients. Excess length of stay, extra costs, and attributable mortality. JAMA. 1994; 271:1598–1601 [DOI] [PubMed] [Google Scholar]
- 6.Laupland KB, Davies HD, Church DL, et al. Bloodstream infection-associated sepsis and septic shock in critically ill adults: A population-based study. Infection. 2004; 32:59–64 [DOI] [PubMed] [Google Scholar]
- 7.Dat VQ, Long NT, Hieu VN, et al. Clinical characteristics, organ failure, inflammatory markers and prediction of mortality in patients with community acquired bloodstream infection. BMC Infect Dis. 2018; 18:535. [DOI] [PMC free article] [PubMed] [Google Scholar]
- 8.Baron EJ, Miller JM, Weinstein MP, et al. Executive summary: A guide to utilization of the microbiology laboratory for diagnosis of infectious diseases: 2013 recommendations by the Infectious Diseases Society of America (IDSA) and the American Society for Microbiology (ASM)(a). Clin Infect Dis. 2013; 57:485–488 [DOI] [PMC free article] [PubMed] [Google Scholar]
- 9.Linsenmeyer K, Gupta K, Strymish JM, et al. Culture if spikes? Indications and yield of blood cultures in hospitalized medical patients. J Hosp Med. 2016; 11:336–340 [DOI] [PubMed] [Google Scholar]
- 10.Bates DW, Cook EF, Goldman L, et al. Predicting bacteremia in hospitalized patients. A prospectively validated model. Ann Intern Med. 1990; 113:495–500 [DOI] [PubMed] [Google Scholar]
- 11.Bates DW, Goldman L, Lee TH. Contaminant blood cultures and resource utilization. The true consequences of false-positive results. JAMA. 1991; 265:365–369 [PubMed] [Google Scholar]
- 12.Hall KK, Lyman JA. Updated review of blood culture contamination. Clin Microbiol Rev. 2006; 19:788–802 [DOI] [PMC free article] [PubMed] [Google Scholar]
- 13.Roth A, Wiklund AE, Pålsson AS, et al. Reducing blood culture contamination by a simple informational intervention. J Clin Microbiol. 2010; 48:4552–4558 [DOI] [PMC free article] [PubMed] [Google Scholar]
- 14.Dawson S. Blood culture contaminants. J Hosp Infect. 2014; 87:1–10 [DOI] [PubMed] [Google Scholar]
- 15.Rupp ME, Cavalieri RJ, Marolf C, et al. Reduction in blood culture contamination through use of initial specimen diversion device. Clin Infect Dis. 2017; 65:201–205 [DOI] [PMC free article] [PubMed] [Google Scholar]
- 16.Coburn B, Morris AM, Tomlinson G, et al. Does this adult patient with suspected bacteremia require blood cultures? JAMA. 2012; 308:502–511 [DOI] [PubMed] [Google Scholar]
- 17.Bahagon Y, Raveh D, Schlesinger Y, et al. Prevalence and predictive features of bacteremic urinary tract infection in emergency department patients. Eur J Clin Microbiol Infect Dis. 2007; 26:349–352 [DOI] [PubMed] [Google Scholar]
- 18.Jaimes F, Arango C, Ruiz G, et al. Predicting bacteremia at the bedside. Clin Infect Dis. 2004; 38:357–362 [DOI] [PubMed] [Google Scholar]
- 19.Shapiro NI, Wolfe RE, Wright SB, et al. Who needs a blood culture? A prospectively derived and validated prediction rule. J Emerg Med. 2008; 35:255–264 [DOI] [PubMed] [Google Scholar]
- 20.Jones GR, Lowes JA. The systemic inflammatory response syndrome as a predictor of bacteraemia and outcome from sepsis. QJM. 1996; 89:515–522 [DOI] [PubMed] [Google Scholar]
- 21.Leisman DE, Harhay MO, Lederer DJ, et al. Development and reporting of prediction models. Crit Care Med. 2020; 48:623–633 [DOI] [PMC free article] [PubMed] [Google Scholar]
- 22.Moss TJ, Lake DE, Calland JF, et al. Signatures of subacute potentially catastrophic illness in the ICU: Model development and validation. Crit Care Med. 2016; 44:1639–1648 [DOI] [PMC free article] [PubMed] [Google Scholar]
- 23.Seymour CW, Kennedy JN, Wang S, et al. Derivation, validation, and potential treatment implications of novel clinical phenotypes for sepsis. JAMA. 2019; 321:2003–2017 [DOI] [PMC free article] [PubMed] [Google Scholar]
- 24.Harrell F. RMS: Regression Modeling Strategies. 2015. Berlin, Springer International Publishing [Google Scholar]
- 25.Moons KG, Altman DG, Reitsma JB, et al. Transparent reporting of a multivariable prediction model for individual prognosis or diagnosis (TRIPOD): Explanation and elaboration. Ann Intern Med. 2015; 162:W1, 73 [DOI] [PubMed] [Google Scholar]
- 26.Lawless J, K S. Efficient screening of nonnormal regression methods. Biometrics. 1978; 34:318–327 [Google Scholar]
- 27.Hawkins DM, Basak SC, Mills D. Assessing model fit by cross-validation. J Chem Inf Comput Sci. 2003; 43:579–586 [DOI] [PubMed] [Google Scholar]
- 28.Singer M, Deutschman CS, Seymour CW, et al. The third international consensus definitions for sepsis and septic shock (Sepsis-3). JAMA. 2016; 315:801–810 [DOI] [PMC free article] [PubMed] [Google Scholar]
- 29.Zivin JR, Gooley T, Zager RA, et al. Hypocalcemia: A pervasive metabolic abnormality in the critically ill. Am J Kidney Dis. 2001; 37:689–698 [DOI] [PubMed] [Google Scholar]
- 30.Kelly A, Levine MA. Hypocalcemia in the critically ill patient. J Intensive Care Med. 2013; 28:166–177 [DOI] [PubMed] [Google Scholar]
- 31.Suffredini AF, Fromm RE, Parker MM, et al. The cardiovascular response of normal humans to the administration of endotoxin. N Engl J Med. 1989; 321:280–287 [DOI] [PubMed] [Google Scholar]
- 32.Morelli A, Ertmer C, Westphal M, et al. Effect of heart rate control with esmolol on hemodynamic and clinical outcomes in patients with septic shock: A randomized clinical trial. JAMA. 2013; 310:1683–1691 [DOI] [PubMed] [Google Scholar]
- 33.Lv S, Han M, Yi R, et al. Anti-TNF-α therapy for patients with sepsis: A systematic meta-analysis. Int J Clin Pract. 2014; 68:520–528 [DOI] [PubMed] [Google Scholar]
- 34.Cain BS, Meldrum DR, Dinarello CA, et al. Tumor necrosis factor-alpha and interleukin-1beta synergistically depress human myocardial function. Crit Care Med. 1999; 27:1309–1318 [DOI] [PubMed] [Google Scholar]
- 35.Kakihana Y, Ito T, Nakahara M, et al. Sepsis-induced myocardial dysfunction: Pathophysiology and management. J Intensive Care. 2016; 4:22. [DOI] [PMC free article] [PubMed] [Google Scholar]
- 36.Moorman JR, Carlo WA, Kattwinkel J, et al. Mortality reduction by heart rate characteristic monitoring in very low birth weight neonates: A randomized trial. J Pediatr. 2011; 159:900–6.e1 [DOI] [PMC free article] [PubMed] [Google Scholar]
Associated Data
This section collects any data citations, data availability statements, or supplementary materials included in this article.