

Abstract
Aims
Left ventricular ejection fraction (EF) is required to categorize heart failure (HF) [i.e. HF with preserved (HFpEF), mid‐range (HFmrEF), and reduced (HFrEF) EF] but is often not captured in population‐based cohorts or non‐HF registries. The aim was to create an algorithm that identifies EF subphenotypes for research purposes.
Methods and results
We included 42 061 HF patients from the Swedish Heart Failure Registry. As primary analysis, we performed two logistic regression models including 22 variables to predict (i) EF≥ vs. <50% and (ii) EF≥ vs. <40%. In the secondary analysis, we performed a multivariable multinomial analysis with 22 variables to create a model for all three separate EF subphenotypes: HFrEF vs. HFmrEF vs. HFpEF. The models were validated in the database from the CHECK‐HF study, a cross‐sectional survey of 10 627 patients from the Netherlands. The C‐statistic (discrimination) was 0.78 [95% confidence interval (CI) 0.77–0.78] for EF ≥50% and 0.76 (95% CI 0.75–0.76) for EF ≥40%. Similar results were achieved for HFrEF and HFpEF in the multinomial model, but the C‐statistic for HFmrEF was lower: 0.63 (95% CI 0.63–0.64). The external validation showed similar discriminative ability to the development cohort.
Conclusions
Routine clinical characteristics could potentially be used to identify different EF subphenotypes in databases where EF is not readily available. Accuracy was good for the prediction of HFpEF and HFrEF but lower for HFmrEF. The proposed algorithm enables more effective research on HF in the big data setting.
Keywords: Electronic health records, Heart failure, Ejection fraction, Prediction, HFrEF, HFmrEF, HFpEF
Introduction
Left ventricular ejection fraction (EF) is used in heart failure (HF) for diagnosis, characterization and treatment selection and is a key inclusion criterion for HF trials. 1 Current European guidelines classify HF according to EF as HF with preserved EF (HFpEF; EF ≥50%), HF with mid‐range EF (HFmrEF; EF = 40–49%), and HF with reduced EF (HFrEF; HF <40%). 2
Electronic health records (EHRs) provide an abundance of routine clinical care data, which may contribute to assess quality of care and uncover the current unmet needs in HF, i.e. identifying underuse of evidence‐based therapies and reasons for undertreatment in order to implement care. 3 , 4 , 5 Furthermore, phenotyping real‐world HF patients could facilitate the development of new treatments or the establishment of new uses of existing treatments and may also help in designing of and pre‐screening for randomized trials in all EF categories. However, EHRs frequently lack readily available phenotypic information that is needed to discern relevant subphenotypes. 6 , 7 , 8 , 9 In the case of HF, EF is often missing or not documented in EHRs, thereby preventing analyses focusing on specific EF subphenotypes and limiting EHRs use in HF research.
Previous algorithms have been developed for the purpose of identifying EF subphenotypes (i.e. HFpEF vs. HFmrEF vs. HFrEF) in routine care data using International Classification of Diseases (ICD) codes, but none have considered routine clinical information that may be relevant for EF prediction in trials data sets, registries, and EHRs. 10 , 11
Therefore, we aimed to develop and validate algorithms to discern HFrEF, HFmrEF, and HFpEF subphenotypes using two representative, large, contemporary HF registries.
Methods
Development cohort
The Swedish Heart Failure Registry (SwedeHF) has been previously described. 12 Briefly, it was created in 2000 and broadly implemented throughout Sweden by 2003. The only inclusion criterion is clinician‐judged HF. Patients are registered at discharge from hospital or after outpatient clinic visit on a web‐based care report form and entered into the database (managed by Uppsala Clinical Research Center, Uppsala, Sweden).
All permanent residents in Sweden have unique personal identification numbers that allows linking of disease‐specific health registries, governmental health, and statistical registries. For the current analysis, we linked SwedeHF to the National Patient Registry, which provided more data on baseline comorbidities.
In this study, we included 42 061 patients with known EF registered between 11 May 2000 and 31 December 2012. In SwedeHF, EF is recorded as a categorical variable, i.e. <30%, 30–39%, 40–49%, and ≥50%. We defined HFrEF as EF <40%, HFmrEF as EF between 40% and 49%, and HFpEF as EF ≥50%. The study flow diagram is reported in Supporting Information, Figure S1A.
Validation cohort
The CHECK‐HF (Chronic Heart Failure ESC‐guideline based Cardiology Practice Quality project) registry is a cross‐sectional collection of 10 910 unselected patients with the diagnosis of chronic HF treated at outpatient HF clinics (96%) of 34 Dutch hospitals or encountered at the general cardiology outpatient clinic of the same hospitals (4%) between September 2013 and September 2016. 13 Inclusion criteria for this study were 18 years of age or older and known EF (n = 10 627). EF was recorded as a continuous variable but recoded to HFrEF <40%, HFmrEF = 40–49%, and HFpEF ≥50%. The study flow diagram is reported in Supporting Information, Figure S1B.
Statistical methods
Baseline characteristics and missing data
Patient characteristics were summarized by HF subphenotype as mean (SD) or median (interquartile range [IQR]) for continuous variables and percentages for categorical variables. Multiple imputation using the mice algorithm in the statistical software package R was used to impute missing data for the variables included in the models. 14 Supporting Information, Table S1 shows the variables included in the multiple imputation models and the amount of missing records in the SwedeHF data set. We generated 10 imputed data sets, and analyses were performed on each imputed data set separately. The results were then pooled using Rubin's rules. All the analyses, except for descriptive statistics, were performed on imputed data.
Development of predictive models
In the primary analysis, we used multivariable logistic regression to fit two different predictive models: one for ≥50% (HFpEF) vs. EF <50% (HFrEF and HFmrEF) and one for EF <40% (HFrEF) vs. ≥40% (HFmrEF and HFpEF). For the secondary analysis, we used a multinomial logistic model to separately predict HFpEF, HFmrEF, and HFrEF (HFrEF was used as reference).
We screened several sources of EHR for commonly available variables to assess as potential predictors of EF subphenotypes in our analyses, and we selected the following 6 , 7 , 8 , 9 : age, sex, clinical characteristics [N terminal pro b‐type natriuretic peptide (NT‐proBNP), New York Heart Failure Association (NYHA) class, mean arterial pressure, heart rate, body mass index (BMI), and estimated glomerular filtration rate (eGFR)], comorbidities [history of ischaemic heart disease, atrial fibrillation, chronic obstructive pulmonary disease (COPD), diabetes, hypertension, anaemia, cancer in the previous 3 years, and valvular disease], and treatments [device therapy (implantable cardioverter defibrillator or cardiac resynchronization therapy), renin–angiotensin system (RAS) inhibitors, beta‐blockers, diuretics, mineralocorticoid receptor antagonist (MRA), and digoxin].
Variance inflation factor was used to test for multicollinearity among predictors. If a pair of predictors was highly correlated (variance inflation factor > 10), we included only one of the predictors in the multivariable model. We performed backward selection on the multivariable model based on Akaike's information criterion to regress the full model towards the final model. Predicted probability threshold cut‐offs for the prediction of EF subphenotypes were investigated to maximize accuracy, sensitivity, and specificity of the model.
Model discrimination
Area under the receiver operating curves were used to discern model discrimination. The C‐statistic was used to assess model performance. For the secondary analysis, i.e. multinomial models, discrimination and calibration were calculated with a one‐vs.‐rest approach. The outcome for each EF category j was dichotomized, i.e. HFrEF vs. HFmrEF and HFpEF. The C‐statistic was then obtained by evaluating the predicted risk of EF category j vs. the predicted risk of the remaining categories. 15 , 16 Observed vs. predicted plots were created to visually assess model calibration. We externally validated the models in the CHECK‐HF registry.
Sensitivity analysis
In a sensitivity analysis, we simplified the models by excluding the clinical variables (NT‐proBNP, NYHA class, mean arterial pressure, heart rate, BMI, and eGFR) and therefore only investigated demographics, comorbidities, and treatments. This was done because many EHRs, such as claim databases, include categorical data but not clinical variables that are often continuous (e.g. chronic kidney disease rather than eGFR) or ordinal (e.g. NYHA class).
In further sensitivity analyses, we excluded only NT‐proBNP and then NT‐proBNP + NYHA class because both are HF specific variables that are not always recorded in EHRs.
All statistical analyses were performed in R software version 3.5.1.
Results
Baseline characteristics
Baseline patient characteristics are summarized in Table 1 . In the SwedeHF cohort, 56% of patients had HFrEF, 21% HFmrEF, and 23% HFpEF. Overall, HFpEF patients were older, more likely female patients, and had higher blood pressure and BMI. Generally, comorbidities were more likely observed in HFpEF compared with HFrEF and HFmrEF, except for history of myocardial infarction, which was considerably more common in HFrEF and HFmrEF. HFrEF but also HFmrEF patients were more likely to receive RAS inhibitors, beta‐blockers, MRAs, and device therapy compared with HFpEF patients, while diuretics were more often prescribed in HFpEF patients. Baseline characteristics of the external validation cohort are summarized in Supporting Information, Table S2 . Similar characteristics were overall observed in the CHECK‐HF population and its subphenotypes. However, in the CHECK‐HF vs. SwedeHF cohort, there were slightly less HFmrEF (15%) and HFpEF (21%) patients but more HFrEF (64%) patients. HFrEF patients were slightly more likely female patients (35% vs. 29%, respectively) and had lower NYHA class (28% vs. 46% NYHA class III/IV, respectively). Regardless of the EF subphenotype, in the CHECK‐HF vs. SwedeHF cohort, there were less patients with anaemia and cardiovascular comorbidities such as hypertension, ischaemic heart disease, atrial fibrillation, and valvular disease. CHECK‐HF patients were more likely to receive MRAs and device therapy but less likely to receive RAS inhibitors and beta‐blockers compared with those in SwedeHF, regardless of the EF subphenotype.
Table 1.
Baseline characteristics of the SwedeHF cohort
| HFrEF | HFmrEF | HFpEF | P‐value | |
|---|---|---|---|---|
| N | 23402 (55.6%) | 9019 (21.4%) | 9640 (22.9%) | |
| Demographics | ||||
| Age [years, mean (SD)] | 71.66 (12.33) | 74.33 (11.72) | 77.38 (10.61) | <0.001 |
| Sex [female (%)] | 6745 (28.8) | 3536 (39.2) | 5260 (54.6) | <0.001 |
| Heart failure measurements | ||||
| NYHA class [Class III/IV (%)] | 8187 (45.8) | 2075 (31.7) | 2358 (38.8) | <0.001 |
| NT‐proBNP [= >median (%)] | 4015 (55.8) | 1214 (44.2) | 1279 (41.6) | <0.001 |
| Clinical variables | ||||
| Systolic blood pressure [mean (SD)] | 124.39 (20.49) | 130.64 (20.89) | 133.42 (21.90) | <0.001 |
| Diastolic blood pressure [mean (SD)] | 73.38 (12.26) | 73.79 (12.09) | 73.13 (12.39) | 0.001 |
| MAP [≥90 mmHg (%)] | 11964 (51.8) | 5303 (59.5) | 5734 (60.6) | <0.001 |
| Heart rate [≥70 BPM (%)] | 13244 (60.5) | 4673 (55.7) | 5312 (59.7) | <0.001 |
| BMI (%) | <0.001 | |||
| <18.5 kg/m2 | 336 (3.1) | 111 (2.7) | 142 (3.4) | |
| 18.5–24.9 kg/m2 | 4369 (40.1) | 1456 (35.3) | 1455 (34.5) | |
| 25–29.9 kg/m2 | 3896 (35.8) | 1467 (35.6) | 1397 (33.1) | |
| ≥30 kg/m2 | 2290 (21.0) | 1087 (26.4) | 1223 (29.0) | |
| eGFR (%) | <0.001 | |||
| ≥90 mL/min/1.73 m2 | 2761 (11.8) | 1011 (11.2) | 919 (9.6) | |
| 60–89.9 mL/min/1.73 m2 | 9630 (41.3) | 3598 (40.0) | 3394 (35.3) | |
| 30–59.9 mL/min/1.73 m2 | 9273 (39.7) | 3707 (41.2) | 4420 (46.0) | |
| <30 mL/min/1.73 m2 | 1669 (7.2) | 673 (7.5) | 875 (9.1) | |
| Anaemia [Yes (%)] | 7348 (31.4) | 3110 (34.5) | 3945 (40.9) | <0.001 |
| Revascularised [Yes (%)] | 7536 (32.2) | 2939 (32.6) | 2130 (22.1) | <0.001 |
| Comorbidities | ||||
| Atrial fibrillation [Yes (%)] | 11936 (51.0) | 5235 (58.0) | 6128 (63.6) | <0.001 |
| COPD [Yes (%)] | 3710 (15.9) | 1570 (17.4) | 2089 (21.7) | <0.001 |
| Diabetes [Yes (%)] | 6257 (26.7) | 2408 (26.7) | 2705 (28.1) | 0.035 |
| Hypertension [Yes (%)] | 12670 (54.1) | 5677 (62.9) | 6809 (70.6) | <0.001 |
| Ischaemic heart disease [Yes (%)] | 12994 (57.8) | 5006 (57.1) | 4328 (46.3) | <0.001 |
| Myocardial infarction [Yes (%)] | 9975 (42.6) | 3710 (41.1) | 2805 (29.1) | <0.001 |
| Peripheral artery disease [Yes (%)] | 2277 (9.7) | 915 (10.1) | 981 (10.2) | 0.338 |
| Cancer previous 3 years [Yes (%)] | 2896 (12.4) | 1212 (13.4) | 1454 (15.1) | <0.001 |
| Valvular disease [Yes (%)] | 5335 (23.4) | 2230 (25.4) | 3152 (33.6) | <0.001 |
| Therapy | ||||
| RAS inhibitor [Yes (%)] | 21037 (90.4) | 7487 (83.6) | 6836 (71.7) | <0.001 |
| Beta‐blocker [Yes (%)] | 21045 (90.3) | 7689 (85.7) | 7503 (78.4) | <0.001 |
| Loop diuretic [Yes (%)] | 18534 (79.6) | 6659 (74.2) | 8125 (84.7) | <0.001 |
| MRA [Yes (%)] | 7591 (32.7) | 2104 (23.5) | 2503 (26.2) | <0.001 |
| Digoxin [Yes (%)] | 4092 (17.6) | 1430 (15.9) | 1737 (18.1) | <0.001 |
| Device therapy [Yes (%)] | 1421 (6.1) | 195 (2.2) | 95 (1.0) | <0.001 |
BMI, body mass index; BPM, beats per minute; COPD, chronic obstructive pulmonary disease; eGFR, estimated Glomerular filtration rate; HFmrEF, heart failure with mid‐range ejection fraction; HFpEF, heart failure with preserved ejection fraction; HFrEF, heart failure with reduced ejection fraction; MAP, mean arterial pressure; mean (SD), mean (standard deviation); MRA, mineralocorticoid receptor antagonist; NT‐proBNP, N‐terminal pro b‐type natriuretic peptide; NYHA class, New York Heart Association class; RAS inhibitor, renin‑angiotensin system inhibitor.
Prediction models
Primary analysis
The model predicting EF ≥50% vs. <50% is presented in Figure 1 . The strongest predictors [those with an odds ration (OR) > 1.5] for EF ≥50% were older age, female sex, hypertension, anaemia, and atrial fibrillation. Device therapy, use of RAS inhibitors, and higher NT‐proBNP levels had the strongest association with EF < 50% (OR < 0.5). The model discriminated well, with a C‐statistic of 0.775 [95% confidence interval (95% CI) 0.770–0.780] (Figure 3 A ). There was a slight overestimation for the predicted probabilities between 0.4 and 0.6 (Figure 4 A ). With a predicted probability threshold of 0.21, we maximized the sensitivity and specificity of predicting EF ≥50%, while a higher threshold of 0.44 led to a higher overall accuracy and higher specificity to predict EF <50% (Supporting Information, Table S3 ).
Figure 1.
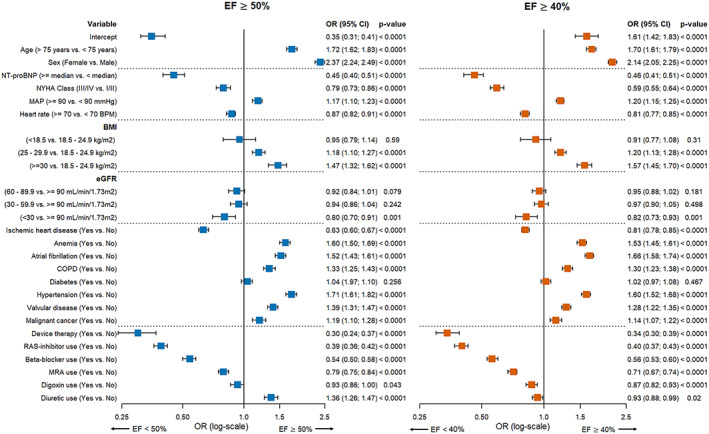
Multivariable logistic prediction models predicting EF ≥ 50% vs. EF < 50% and EF ≥ 40% vs. <40%. BMI, body mass index; BPM, beats per minute; COPD, chronic obstructive pulmonary disease; eGFR, estimated Glomerular filtration rate; MAP, mean arterial pressure; MRA, mineralocorticoid receptor antagonist; NT‐proBNP, N‐terminal pro b‐type natriuretic peptide; NYHA class, New York Heart Association class; RAS inhibitor, renin‑angiotensin system inhibitor.
Figure 3.
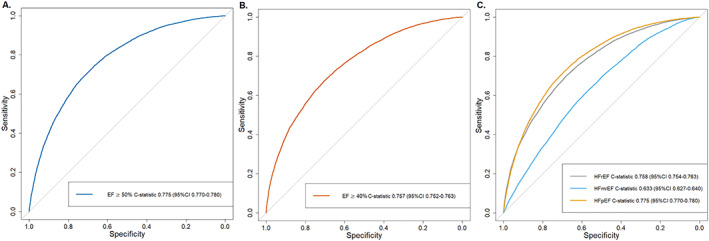
Discrimination plots. Discrimination plots displaying ROC curves for (A) logistic model EF cut‐off ≥50%, (B) logistic model EF cut‐off ≥40%, and (C) multinomial model predicting HFrEF, HFmrEF, and HFpEF with the plot displaying one vs. all discrimination, that is, HFrEF vs. HFmrEF + HFpEF, HFmrEF vs. HFrEF + HFpEF, and HFpEF vs. HFmrEF + HFrEF.
Figure 4.
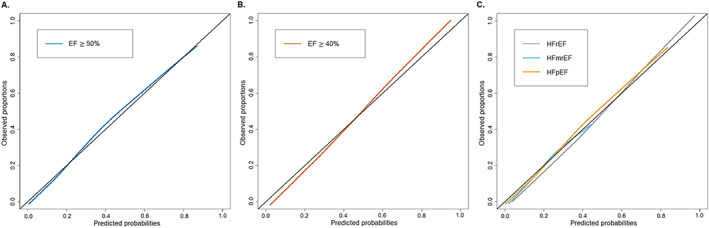
Calibration plots. Calibration plots of observed proportions vs. predicted probabilities to assess the goodness of fit for (A) logistic model EF cut‐off ≥50%, (B) logistic model EF cut‐off ≥40%, and (C) multinomial model predicting HFrEF, HFmrEF, and HFpEF with the plot displaying one vs. all calibration plots, that is, HFrEF vs. HFmrEF + HFpEF, HFmrEF vs. HFrEF + HFpEF, and HFpEF vs. HFmrEF + HFrEF.
Comparable results were observed for the model predicting EF ≥40% vs. <40%, with older age and female sex as strongest predictors for EF ≥40% (Figure 1 ). Furthermore, BMI ≥30 kg/m2, atrial fibrillation, hypertension, and anaemia were strong predictors for EF ≥40% (OR > 1.5), while device therapy, RAS inhibitors, and higher NT‐proBNP levels were the strongest predictors for EF <40% (OR < 0.5). The discrimination of this model was good, with a C‐statistic of 0.757 (95% CI 0.752–0.763) (Figure 3 B ) and slight underestimation and overestimation in the lower and higher ends of the predicted probabilities (Figure 4 B ). Predicted probability thresholds to maximize overall accuracy or sensitivity + specificity was similar, with cut‐offs of 0.48 and 0.45, respectively (Supporting Information, Table S3 ).
Secondary analysis
The results from the multinomial model are shown in Figure 2 . HFrEF was the reference category. Compared with HFrEF, older age, female sex, higher BMI and atrial fibrillation were the strongest predictors for HFmrEF. Predictors for HFpEF were similar to those for HFmrEF, but the associations were much stronger. C‐statistics according to the one‐vs.‐rest approach for HFrEF and HFpEF were similar to the logistic models for EF ≥40% or EF ≥50% in the primary analysis, 0.758 (95% 0.754–0.763) and 0.775 (95% 0.770–0.780), respectively (Figure 3 C ). However, the discriminative performance for predicting HFmrEF was only moderate, with a C‐statistic of 0.633 (95% CI 0.627–0.640). Model calibration was not optimal (Figure 4 C ). Overall accuracy was much lower for the multinomial model than for the primary analyses, with an accuracy of 58.1–60.8% (Supporting Information, Table S3 ).
Figure 2.
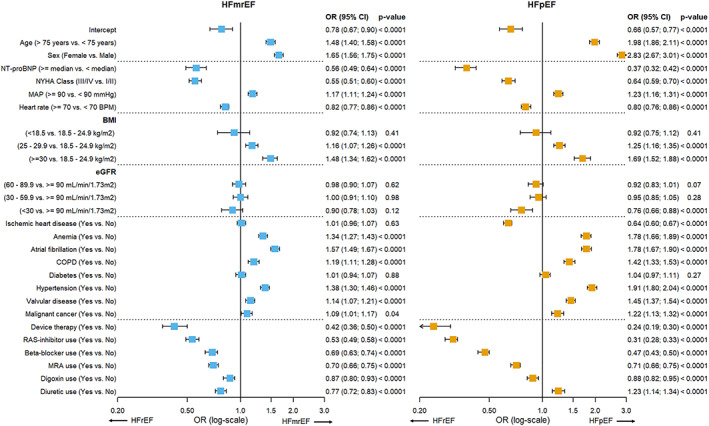
Multinomial prediction model predicting HFmrEF or HFpEF with HFrEF as reference category. BMI, body mass index; BPM, beats per minute; COPD, chronic obstructive pulmonary diseas; eGFR, estimated Glomerular filtration rate; HFmrEF, heart failure with mid‐range ejection fraction; HFpEF, heart failure with preserved ejection fraction; MAP, mean arterial pressure; MRA, mineralocorticoid receptor antagonist; NT‐proBNP, N‐terminal pro b‐type natriuretic peptide; NYHA class, New York Heart Association class; RAS inhibitor, renin‑angiotensin system inhibitor.
External validation
Models were externally validated in the CHECK‐HF data set, with good discriminative performance that was comparable with the development cohort, and the EF ≥50% models performing best with a C‐statistic of 0.728 (0.724–0.731) for the main model (Supporting Information, Table S4 ).
Sensitivity analyses
We performed sensitivity analyses to investigate simpler models, i.e. excluding clinical characteristics (NT‐proBNP, NYHA class, mean arterial pressure, heart rate, BMI, and eGFR) (Supporting Information, Tables S5 , S6 , and S 11 ) as well as models excluding only NT‐proBNP (Supporting Information, Tables S7 , S 8 , and S 12 ) and models excluding NT‐proBNP and NYHA (Supporting Information, Table S9 , S 10 , and S 13 ). The models had lower but good discriminative ability for EF ≥ 50% vs. <50% (Supporting Information, Figures S2 , S 4 , and S 6 ), with a C‐statistic for the simple model of 0.737 (95% CI 0.732–0.743), 0.753 (95% CI 0.748–0.759) for the model without NT‐proBNP, and 0.750 (95% CI 0.744–0.755) for the model without NT‐proBNP and NYHA. This was similar for the logistic model predicting EF ≥40% vs. <40%, with a C‐statistic of 0.703 (95% CI 0.698–0.708) for the simpler model, 0.734 (95% CI 0.729–0.739) for the logistic model excluding NT‐proBNP, and 0.721 (95% CI 0.716–7.26) for the model excluding NT‐proBNP and NYHA (Supporting Information, Figures S3 , S 5 , and S 7 ). Likewise, HFrEF and HFpEF at the multinomial analysis had good discriminative ability, while predicting HFmrEF was only moderate (Supporting Information, Figures S8 –S 10 ).
We externally validated these sensitivity analyses in the CHECK‐HF data set, with similar discriminative performances as in the development cohort (Supporting Information, Table S4 ).
Discussion
EHRs and routine clinical care data represent a great potential resource for HF research. 6 , 7 , 8 , 9 While these databases provide for large samples sizes ensuring generalizability and many clinically relevant variables, the main limitation is often the depth of phenotypic information required to identify and investigate specific HF subphenotypes. 6 , 7 , 8 , 9 Currently, EF is the key to phenotype HF patients and is used for treatment selection in clinical practice and as inclusion criterion in HF trials. Moreover, as shown in numerous previous studies, patients with different EF subphenotypes have different risk profiles, disease trajectories, and outcomes. 17 , 18 , 19 , 20 Absence of readily available EF measurements limits research on HF in routine EHR data. Several natural language processing models could be used to extract data on left ventricular systolic function reported as free text in EHR. 21 , 22 For those instances that this information is not available, simple prediction models for EF might be used to gain more knowledge on HF phenotypic information in EHRs, claim databases, trials, and large cohorts. With recent data on angiotensin‐receptor‐Neprilysin inhibitors and potentially emerging data on sodium/glucose cotransporter 2 inhibitors in HF, the use of these drugs may be expanded. 23 , 24 It would be important for regulators, payers, and health systems to be able to use EF prediction models to assess implications of these new drugs in their own health care systems and databases.
We hereby propose prediction models that could be used to infer EF category in secondary care HF patients based on patients' characteristics for research purposes. Our models discriminated well, especially for HFpEF and HFrEF, while predicting HFmrEF was more challenging.
Two previous studies aimed to create algorithms to predict EF category in HF patients. 10 , 11 Bovitz et al. realized a predictive model for EF based on ICD‐9 codes for systolic and diastolic HF in 2714 patients encountered in a single centre. The area under the curve for this model was 0.821 and had a predicted probability threshold cut‐off for EF of 43.5%. 10 The main limitation was generalizability. Indeed, no external validation was performed, and this study enrolled a small cohort of patients from only one centre, whereas ICD coding practice is highly varying from one centre to another. Furthermore, this model did not incorporate clinical or laboratory data such as blood pressure, eGFR, or NT‐proBNP. A predictive model from Desai et al. included 11 073 patients (of which 7105 patients are in the development cohort) and aimed to predict HFrEF, HFmrEF, or HFpEF as well as with EF< or ≥45% in patients with known EF from a centre referring to Medicare (claim database). 11 The discriminative performance varied between 0.84 and 0.88. This model was externally validated in a cohort of patients from a different hospital but still limited to Medicare patients only.
Compared with previous models that have been developed to be mainly applied to claim data, our model, which considers also clinically relevant variables, can be used as well in clinical cohorts or trials where HF is diagnosed at baseline but EF is not collected. 25 Furthermore, we have developed predicted probability thresholds to optimize accuracy or sensitivity and specificity that can guide researchers in classifying patients based on our models.
We created prediction models for HFrEF, HFmrEF, and HFpEF as well as for EF ≥ 40% vs <40% and EF ≥50% vs. <50% in SwedeHF. Our models had good performance, with the lowest C‐statistic 0.633 for HFmrEF in the multinomial model and the highest performance for the EF ≥50% model with a C‐statistic of 0.775. The lower C‐statistic for HFmrEF may be explained by the heterogeneity that characterizes this subphenotype, 18 , 26 , 27 with a large proportion of patients having transitioning EF for different reasons (e.g. atrial fibrillation and ischaemic heart disease) that may make EF prediction more challenging. 28 Most trials use EF 40% or 50% as cut‐offs for enrolment, and we provided models to identify patients based on these cut‐offs (i.e. EF ≥40% vs <40% and EF ≥50% vs. <50). If a trial or other research programme wishes to specifically select HFrEF, HFpEF, or HFmrEF patients, our models to identify the specific subphenotype could be applied, albeit that the area under the curve was worse (0.633) than for the dichotomous models (0.775 and 0.757, respectively).
Similar to the binary model by Desai et al. 11 male sex, implantable devices, and use of ACE inhibitors, beta‐blockers, and MRAs predicted HFrEF in both models using an EF of 40% and 50% as cut‐offs, while anaemia, valvular disease, obesity, and hypertension were predictive of HFpEF. Out of the comorbidities we included in our model, only ischaemic heart disease was predictive for HFrEF or EF <50%. This is comparable with what is known from recent studies, i.e. HFpEF is more related to ageing, female sex, and comorbidities, while HFrEF (and HFmrEF) are more likely to be associated to ischaemic heart disease. 17 , 18 , 19 , 20 The main variables associated with HFrEF were medication use and variables associated with worsening or symptomatic HF, such as higher NYHA class and higher NT‐proBNP levels. While medication use is not directly involved in the pathophysiology of any HF subphenotype, it is still helpful as a marker reflecting clinician decisions that in turn reflect EF. Interestingly, only severe renal disease (eGFR < 30 mL/min/1.73 m2) was associated with HFrEF, while mildly reduced kidney function was not associated with either EF subphenotype.
Strengths and limitations
SwedeHF and CHECK‐HF are both large, unselected, contemporary HF cohorts, collecting data on demographics, clinical characteristics, biomarkers, medication use, and, notably, EF measurements. A strength of our analysis is that we were able to externally validate our models from SwedeHF in an independent sample with good discriminative performance (CHECK‐HF). Furthermore, SwedeHF data was collected between 2000‐2012, while the CHECK‐HF registry was conducted between 2013‐2016, indicating that the model performs well over time. However, there are also several limitations which need to be mentioned. First, EF is collected as a categorical variable in SwedeHF; therefore, we were unable to investigate linear associations between predictors and EF. However, clinical guidelines and trials use EF categories as well and would not be improved by linear information. Based on our models, it remains difficult to classify HFmrEF, which may be misclassified as HFrEF or HFpEF, and, therefore, we rather suggest using the models pooling HFmrEF with HFpEF or HFrEF. Second, many of the HF therapies were predictive for HFrEF/HFpEF and thus, when applying our models, we suggest considering the use of medications for 3–6 months after the initial HF diagnosis to allow for optimizing therapies and reflection of clinician decision making. Third, the inclusion criterion for SwedeHF is clinician‐judged HF, which differs from the ICD definition of HF in EHRs and thus our model should be further evaluated and validated in an EHR setting. Finally, repeated measurements of clinical characteristics (e.g. NYHA class, blood pressure, etc.) and EF are limited in SwedeHF and thus we could not assess how sensitive our model is to reclassify the patient EF subphenotype based on changes in clinical measurements.
Conclusions
We created an algorithm based on patient demographics, clinical characteristics and use of treatments to identify EF subphenotypes in HF patients without an available EF assessment. Accuracy was good for the prediction of HFpEF and HFrEF but lower for HFmrEF, perhaps due to the heterogeneity that characterizes this subphenotype. Our model could significantly support more effective research in the ‘big data’ setting.
Conflict of interest
A. U., I. V., J. B., G. L., F. A., A. H., and S. K. have nothing to disclose. U. D. reports grants from AstraZeneca, Boehringer Ingelheim, and personal fees from Novartis Pharma, AstraZeneca, and Amgen, outside the submitted work. G. S. reports grants and personal fees from Vifor, grants and non‐financial support from Boehringer Ingelheim, personal fees from SPA, grants from MSD, grants and personal fees from AstraZeneca, and personal fees from Roche, Medtronic, and Cytokinetics outside the submitted work. L. H. L. reports personal fees from Merck, grants and personal fees from Boehringer Ingelheim, personal fees from Sanofi, grants and personal fees from Vifor‐Fresenius, personal fees from AstraZeneca, grants and personal fees from Relypsa, personal fees from Bayer, grants from Boston Scientific, grants and personal fees from Novartis, personal fees from Pharmacosmos, personal fees from Abbott, grants and personal fees from Mundipharma, and personal fees from Medscape, outside the submitted work.
Funding
The Swedish Heart Failure Registry is funded by the Swedish National Board of Health and Welfare, the Swedish Association of Local Authorities and Regions, the Swedish Society of Cardiology, and the Swedish Heart‐Lung Foundation. Servier, the Netherlands, partially funded the inclusion of data and software program for CHECK‐HF. The CHECK‐HF steering committee (J. B., G. L., H. P. B., and A. H.) received no funding for this project. The current study was initiated by the authors and was designed, conducted, interpreted, and reported independently of the sponsor. This work has received support from the EU/EFPIA Innovative Medicines Initiative 2 Joint Undertaking BigData@Heart (grant no. 116074). This study was supported by grants to L. H. L.'s institution from the Swedish Research Council (grants 2013‐23897‐104604‐23 and 523‐2014‐2336), the Swedish Heart Lung Foundation (grants 20150557 and 20170841), and the Stockholm County Council (grants 20140220 and 20170112). F. W. Asselbergs is supported by UCL Hospitals NIHR Biomedical Research Centre. I. Vaartjes is supported by the Dutch Heart Foundation, a part of ‘Facts and Figures’.
Supporting information
Table S1. Missing data baseline characteristics and variables included in the multiple imputation for SwedeHF.
Table S2. Baseline characteristics of the external validation cohort (CHECK‐HF) including missing data in percentages.
Table S3. Prediction thresholds for maximizing overall accuracy or sensitivity + specificity.
Table S4. External validation of the models in CHECK‐HF.
Table S5. Simplified logistic model (i.e. not including NT‐proBNP, NYHA class, mean arterial pressure, heart rate, BMI and eGFR) for EF cut‐off ≥50%.
Table S6. Simplified logistic model (i.e. not including NT‐proBNP, NYHA class, mean arterial pressure, heart rate, BMI and eGFR) for EF ≥40%.
Table S7. Sensitivity analysis of the logistic model EF ≥50% without NT‐proBNP.
Table S8. Sensitivity analysis of the logistic model EF cut‐off ≥40% without NT‐proBNP.
Table S9. Sensitivity analysis of the logistic model EF ≥50% without NT‐proBNP and NYHA class.
Table S10. Sensitivity analysis of the logistic model EF ≥40% without NT‐proBNP and NYHA class.
Table S11. Simplified multinomial model (i.e. not including NT‐proBNP, NYHA class, mean arterial pressure, heart rate, BMI and eGFR).
Table S12. Sensitivity analysis of the multinomial model without NT‐proBNP.
Table S13. Sensitivity analysis of the multinomial model without NT‐proBNP and NYHA class.
Figure S1. (A) Study flow SwedeHF. (B) Study flow CHECK‐HF.
Figure S2. Discrimination and calibration of the simplified logistic model (i.e. not including NT‐proBNP, NYHA class, mean arterial pressure, heart rate, BMI and eGFR) predicting EF ≥50%.
Figure S3. Discrimination and calibration simplified logistic model (i.e. not including NT‐proBNP, NYHA class, mean arterial pressure, heart rate, BMI and eGFR) predicting EF cut‐off ≥40%.
Figure S4. Discrimination and calibration of the logistic model EF cut‐off ≥50% without NT‐proBNP.
Figure S5. Discrimination and calibration of the logistic model EF cut‐off ≥40% without NT‐proBNP.
Figure S6. Discrimination and calibration of the logistic model EF cut‐off ≥50% without NT‐proBNP and NYHA class.
Figure S7. Discrimination and calibration of the logistic model EF cut‐off ≥40% without NT‐proBNP and NYHA class.
Figure S8. Simplified multinomial model discrimination and calibration (i.e. not including NT‐proBNP, NYHA class, mean arterial pressure, heart rate, BMI and eGFR).
Figure S9. Discrimination and calibration of the multinomial model without NT‐proBNP.
Figure S10. Discrimination and calibration of the multinomial model without NT‐proBNP and NYHA class.
Uijl, A. , Lund, L. H. , Vaartjes, I. , Brugts, J. J. , Linssen, G. C. , Asselbergs, F. W. , Hoes, A. W. , Dahlström, U. , Koudstaal, S. , and Savarese, G. (2020) A registry‐based algorithm to predict ejection fraction in patients with heart failure. ESC Heart Failure, 7: 2388–2397. 10.1002/ehf2.12779.
References
- 1. Lund LH, Vedin O, Savarese G. Is ejection fraction in heart failure a limitation or an opportunity? Eur J Heart Fail 2018; 20: 431–432. [DOI] [PubMed] [Google Scholar]
- 2. Ponikowski P, Voors AA, Anker SD, Bueno HH, Cleland JGF, Coats AJS, Falk V, Gonzalez‐Juanatey JR, Harjola V‐P, Jankowska EA, Jessup M, Linde C, Nihoyannopoulos P, Parissis JT, Pieske B, Riley JP, Rosano GMC, Ruilope LM, Ruschitzka F, Rutten FH, van der Meer P, González‐Juanatey JR, Harjola V‐P, Jankowska EA, Jessup M, Linde C, Nihoyannopoulos P, Parissis JT, Pieske B, Riley JP, Rosano GMC, Ruilope LM, Ruschitzka F, Rutten FH, van der Meer P, Authors/Task Force Members Document Reviewers . 2016 ESC guidelines for the diagnosis and treatment of acute and chronic heart failure: the Task Force for the diagnosis and treatment of acute and chronic heart failure of the European Society of Cardiology (ESC). Developed with the special contribution. Eur J Heart Fail 2016; 18: 891–975. [DOI] [PubMed] [Google Scholar]
- 3. Thorvaldsen T, Benson L, Dahlstrom U, Edner M, Lund LH. Use of evidence‐based therapy and survival in heart failure in Sweden 2003‐2012. Eur J Heart Fail 2016; 18: 503–511. [DOI] [PubMed] [Google Scholar]
- 4. Savarese G, Carrero J‐J, Pitt B, Anker SD, Rosano GMC, Dahlström U, Lund LH. Factors associated with underuse of mineralocorticoid receptor antagonists in heart failure with reduced ejection fraction: an analysis of 11 215 patients from the Swedish Heart Failure Registry. Eur J Heart Fail 2018; 20: 1326–1334. [DOI] [PubMed] [Google Scholar]
- 5. Brunner‐La Rocca H‐P, Linssen GC, Smeele FJ, van Drimmelen AA, Schaafsma H‐J, Westendorp PH, Rademaker PC, van de Kamp HJ, Hoes AW, Brugts JJ. Contemporary drug treatment of Chronic Heart Failure With Reduced Ejection Fraction: the CHECK‐HF Registry. JACC Heart Fail 2019; 7: 13–21. [DOI] [PubMed] [Google Scholar]
- 6. Uijl A, Koudstaal S, Direk K, Denaxas S, Groenwold RHH, Banerjee A, Hoes AW, Hemingway H, Asselbergs FW. Risk factors for incident heart failure in age‐ and sex‐specific strata: a population‐based cohort using linked electronic health records. Eur J Heart Fail 2019; 21: 1197–1206. [DOI] [PMC free article] [PubMed] [Google Scholar]
- 7. Vijayakrishnan R, Steinhubl SR, Ng K, Sun J, Byrd RJ, Daar Z, Williams BA, DeFilippi C, Ebadollahi S, Stewart WF. Prevalence of heart failure signs and symptoms in a large primary care population identified through the use of text and data mining of the electronic health record. J Card Fail 2014; 20: 459–464. [DOI] [PMC free article] [PubMed] [Google Scholar]
- 8. Störk S, Handrock R, Jacob J, Walker J, Calado F, Lahoz R, Hupfer S, Klebs S. Epidemiology of heart failure in Germany: a retrospective database study. Clin Res Cardiol 2017; 106: 913–922. [DOI] [PMC free article] [PubMed] [Google Scholar]
- 9. Chen J, Normand S‐LT, Wang Y, Krumholz HM. National and regional trends in heart failure hospitalization and mortality rates for Medicare beneficiaries, 1998‐2008. JAMA 2011; 306: 1669. [DOI] [PMC free article] [PubMed] [Google Scholar]
- 10. Bovitz T, Gilbertson DT, Herzog CA. Administrative data and the philosopher's stone: turning heart failure claims data into quantitative assessment of left ventricular ejection fraction. Am J Med 2016; 129: 223–225. [DOI] [PubMed] [Google Scholar]
- 11. Desai RJ, Lin KJ, Patorno E, Barberio J, Lee M, Levin R, Evers T, Wang SV, Schneeweiss S. Development and preliminary validation of a Medicare claims‐based model to predict left ventricular ejection fraction class in patients with heart failure. Circ Cardiovasc Qual Outcomes 2018; 11: e004700. [DOI] [PubMed] [Google Scholar]
- 12. Savarese G, Vasko P, Jonsson Å, Edner M, Dahlström U, Lund LH. The Swedish Heart Failure Registry: a living, ongoing quality assurance and research in heart failure. Ups J Med Sci 2019; 124: 65–69. [DOI] [PMC free article] [PubMed] [Google Scholar]
- 13. Brugts JJ, Linssen GCM, Hoes AW, Brunner‐La Rocca HP. Real‐world heart failure management in 10,910 patients with chronic heart failure in the Netherlands. Netherlands Hear J 2018; 26: 272–279. [DOI] [PMC free article] [PubMed] [Google Scholar]
- 14. Buuren SV, Groothuis‐Oudshoorn K. Mice: multivariate imputation by chained equations in R. J Stat Softw 2011; 45: 1–67. [Google Scholar]
- 15. Van Hoorde K, Vergouwe Y, Timmerman D, Van Huffel S, Steyerberg EW, Van Calster B. Assessing calibration of multinomial risk prediction models. Stat Med 2014; 33: 2585–2596. [DOI] [PubMed] [Google Scholar]
- 16. Van Calster B, Vergouwe Y, Looman CWN, Van Belle V, Timmerman D, Steyerberg EW. Assessing the discriminative ability of risk models for more than two outcome categories. Eur J Epidemiol 2012; 27: 761–770. [DOI] [PubMed] [Google Scholar]
- 17. Lund LH. Heart failure with “mid‐range” ejection fraction—new opportunities. J Card Fail 2016; 22: 769–771. [DOI] [PubMed] [Google Scholar]
- 18. Lund LH, Claggett B, Liu J, Lam CS, Jhund PS, Rosano GM, Swedberg K, Yusuf S, Granger CB, Pfeffer MA, McMurray JJV, Solomon SD. Heart failure with mid‐range ejection fraction in CHARM: characteristics, outcomes and effect of candesartan across the entire ejection fraction spectrum. Eur J Heart Fail 2018; 20: 1230–1239. [DOI] [PubMed] [Google Scholar]
- 19. Sartipy U, Dahlstrom U, Fu M, Lund LH. Atrial fibrillation in heart failure with preserved, mid‐range, and reduced ejection fraction. JACC Heart Fail 2017; 5: 565–574. [DOI] [PubMed] [Google Scholar]
- 20. Chioncel O, Lainscak M, Seferovic PM, Anker SD, Crespo‐Leiro MG, Harjola V‐P, Parissis J, Laroche C, Piepoli MF, Fonseca C, Mebazaa A, Lund L, Ambrosio GA, Coats AJ, Ferrari R, Ruschitzka F, Maggioni AP, Filippatos G. Epidemiology and one‐year outcomes in patients with chronic heart failure and preserved, mid‐range and reduced ejection fraction: an analysis of the ESC Heart Failure Long‐Term Registry. Eur J Heart Fail 2017; 19: 1574–1585. [DOI] [PubMed] [Google Scholar]
- 21. Garvin JH, Kim Y, Gobbel GT, Matheny ME, Redd A, Bray BE, Heidenreich P, Bolton D, Heavirland J, Kelly N, Reeves R, Kalsy M, Goldstein MK, Meystre SM. Automating quality measures for heart failure using natural language processing:a descriptive study in the department of veterans affairs. JMIR Med Inform 2018; 6: e05. [DOI] [PMC free article] [PubMed] [Google Scholar]
- 22. Wagholikar KB, Fischer CM, Goodson A, Herrick CD, Rees M, Toscano E, MacRae CA, Scirica BM, Desai AS, Murphy SN. Extraction of ejection fraction from echocardiography notes for constructing a cohort of patients having heart failure with reduced ejection fraction (HFrEF). J Med Syst 2018; 42: 209. [DOI] [PMC free article] [PubMed] [Google Scholar]
- 23. McMurray JJV, Solomon SD, Inzucchi SE, Køber L, Kosiborod MN, Martinez FA, Ponikowski P, Sabatine MS, Anand IS, Bělohlávek J, Böhm M, Chiang C‐E, Chopra VK, de Boer RA, Desai AS, Diez M, Drozdz J, Dukát A, Ge J, Howlett JG, Katova T, Kitakaze M, Ljungman CEA, Merkely B, Nicolau JC, O'Meara E, Petrie MC, Vinh PN, Schou M, Tereshchenko S, Verma S, Held C, DeMets DL, Docherty KF, Jhund PS, Bengtsson O, Sjöstrand M, Langkilde A‐M, for the DAPA‐HF Trial Committees and Investigators . Dapagliflozin in patients with heart failure and reduced ejection fraction. N Engl J Med 2019; 381: 1995–2008. [DOI] [PubMed] [Google Scholar]
- 24. Solomon SD, McMurray JJV, Anand IS, Ge J, Lam CSP, Maggioni AP, Martinez F, Packer M, Pfeffer MA, Pieske B, Redfield MM, Rouleau JL, van Veldhuisen DJ, Zannad F, Zile MR, Desai AS, Claggett B, Jhund PS, Boytsov SA, Comin‐Colet J, Cleland J, Düngen H‐D, Goncalvesova E, Katova T, Kerr Saraiva JF, Lelonek M, Merkely B, Senni M, Shah SJ, Zhou J, Rizkala AR, Gong J, Shi VC, Lefkowitz MP, PARAGON‐HF Investigators and Committees . Angiotensin–neprilysin inhibition in heart failure with preserved ejection fraction. N Engl J Med 2019; 381: 1609–1620. [DOI] [PubMed] [Google Scholar]
- 25. Zinman B, Wanner C, Lachin JM, Fitchett D, Bluhmki E, Hantel S, Mattheus M, Devins T, Johansen OE, Woerle HJ, Broedl UC, Inzucchi SE. Empagliflozin, cardiovascular outcomes, and mortality in type 2 diabetes. N Engl J Med 2015; 373: 2117–2128. [DOI] [PubMed] [Google Scholar]
- 26. Tsuji K, Sakata Y, Nochioka K, Miura M, Yamauchi T, Onose T, Abe R, Oikawa T, Kasahara S, Sato M, Shiroto T, Takahashi J, Miyata S, Shimokawa H, CHART‐2 Investigators . Characterization of heart failure patients with mid‐range left ventricular ejection fraction‐a report from the CHART‐2 study. Eur J Heart Fail 2017; 19: 1258–1269. [DOI] [PubMed] [Google Scholar]
- 27. Koh AS, Tay WT, Teng THK, Vedin O, Benson L, Dahlstrom U, Savarese G, Lam CSP, Lund LH. A comprehensive population‐based characterization of heart failure with mid‐range ejection fraction. Eur J Heart Fail 2017; 19: 1624–1634. [DOI] [PubMed] [Google Scholar]
- 28. Savarese G, Vedin O, D'Amario D, Uijl A, Dahlström U, Rosano G, Lam CSP, Lund LH. Prevalence and prognostic implications of longitudinal ejection fraction change in heart failure. JACC Heart Fail 2019; 7: 306–317. [DOI] [PubMed] [Google Scholar]
Associated Data
This section collects any data citations, data availability statements, or supplementary materials included in this article.
Supplementary Materials
Table S1. Missing data baseline characteristics and variables included in the multiple imputation for SwedeHF.
Table S2. Baseline characteristics of the external validation cohort (CHECK‐HF) including missing data in percentages.
Table S3. Prediction thresholds for maximizing overall accuracy or sensitivity + specificity.
Table S4. External validation of the models in CHECK‐HF.
Table S5. Simplified logistic model (i.e. not including NT‐proBNP, NYHA class, mean arterial pressure, heart rate, BMI and eGFR) for EF cut‐off ≥50%.
Table S6. Simplified logistic model (i.e. not including NT‐proBNP, NYHA class, mean arterial pressure, heart rate, BMI and eGFR) for EF ≥40%.
Table S7. Sensitivity analysis of the logistic model EF ≥50% without NT‐proBNP.
Table S8. Sensitivity analysis of the logistic model EF cut‐off ≥40% without NT‐proBNP.
Table S9. Sensitivity analysis of the logistic model EF ≥50% without NT‐proBNP and NYHA class.
Table S10. Sensitivity analysis of the logistic model EF ≥40% without NT‐proBNP and NYHA class.
Table S11. Simplified multinomial model (i.e. not including NT‐proBNP, NYHA class, mean arterial pressure, heart rate, BMI and eGFR).
Table S12. Sensitivity analysis of the multinomial model without NT‐proBNP.
Table S13. Sensitivity analysis of the multinomial model without NT‐proBNP and NYHA class.
Figure S1. (A) Study flow SwedeHF. (B) Study flow CHECK‐HF.
Figure S2. Discrimination and calibration of the simplified logistic model (i.e. not including NT‐proBNP, NYHA class, mean arterial pressure, heart rate, BMI and eGFR) predicting EF ≥50%.
Figure S3. Discrimination and calibration simplified logistic model (i.e. not including NT‐proBNP, NYHA class, mean arterial pressure, heart rate, BMI and eGFR) predicting EF cut‐off ≥40%.
Figure S4. Discrimination and calibration of the logistic model EF cut‐off ≥50% without NT‐proBNP.
Figure S5. Discrimination and calibration of the logistic model EF cut‐off ≥40% without NT‐proBNP.
Figure S6. Discrimination and calibration of the logistic model EF cut‐off ≥50% without NT‐proBNP and NYHA class.
Figure S7. Discrimination and calibration of the logistic model EF cut‐off ≥40% without NT‐proBNP and NYHA class.
Figure S8. Simplified multinomial model discrimination and calibration (i.e. not including NT‐proBNP, NYHA class, mean arterial pressure, heart rate, BMI and eGFR).
Figure S9. Discrimination and calibration of the multinomial model without NT‐proBNP.
Figure S10. Discrimination and calibration of the multinomial model without NT‐proBNP and NYHA class.