

Abstract
Aims
Systemic inflammatory response, identified by increased total leucocyte counts, was shown to be a strong predictor of mortality after transcatheter aortic valve implantation (TAVI). Yet the mechanisms of inflammation‐associated poor outcome after TAVI are unclear. Therefore, the present study aimed at investigating individual inflammatory signatures and functional heterogeneity of circulating myeloid and T‐lymphocyte subsets and their impact on 1 year survival in a single‐centre cohort of patients with severe aortic stenosis undergoing TAVI.
Methods and results
One hundred twenty‐nine consecutive patients with severe symptomatic aortic stenosis admitted for transfemoral TAVI were included. Blood samples were obtained at baseline, immediately after, and 24 h and 3 days after TAVI, and these were analysed for inflammatory and cardiac biomarkers. Myeloid and T‐lymphocyte subsets were measured using flow cytometry. The inflammatory parameters were first analysed as continuous variables; and in case of association with outcome and area under receiver operating characteristic (ROC) curve (AUC) ≥ 0.6, the values were dichotomized using optimal cut‐off points. Several baseline inflammatory parameters, including high‐sensitivity C‐reactive protein (hsCRP; HR = 1.37, 95% CI: 1.15–1.63; P < 0.0001) and IL‐6 (HR = 1.02, 95% CI: 1.01–1.03; P = 0.003), lower counts of Th2 (HR = 0.95, 95% CI: 0.91–0.99; P = 0.009), and increased percentages of Th17 cells (HR = 1.19, 95% CI: 1.02–1.38; P = 0.024) were associated with 12 month all‐cause mortality. Among postprocedural parameters, only increased post‐TAVI counts of non‐classical monocytes immediately after TAVI were predictive of outcome (HR = 1.03, 95% CI: 1.01–1.05; P = 0.003). The occurrence of SIRS criteria within 48 h post‐TAVI showed no significant association with 12 month mortality (HR = 0.57, 95% CI: 0.13–2.43, P = 0.45). In multivariate analysis of discrete or dichotomized clinical and inflammatory variables, the presence of diabetes mellitus (HR = 3.50; 95% CI: 1.42–8.62; P = 0.006), low left ventricular (LV) ejection fraction (HR = 3.16; 95% CI: 1.35–7.39; P = 0.008), increased baseline hsCRP (HR = 5.22; 95% CI: 2.09–13.01; P < 0.0001), and low baseline Th2 cell counts (HR = 8.83; 95% CI: 3.02–25.80) were significant predictors of death. The prognostic value of the linear prediction score calculated of these parameters was superior to the Society of Thoracic Surgeons score (AUC: 0.88; 95% CI: 0.78–0.99 vs. 0.75; 95% CI: 0.64–0.86, respectively; P = 0.036). Finally, when analysing LV remodelling outcomes, ROC curve analysis revealed that low numbers of Tregs (P = 0.017; AUC: 0.69) and increased Th17/Treg ratio (P = 0.012; AUC: 0.70) were predictive of adverse remodelling after TAVI.
Conclusions
Our findings demonstrate an association of specific pre‐existing inflammatory phenotypes with increased mortality and adverse LV remodelling after TAVI. Distinct monocyte and T‐cell signatures might provide additive biomarkers to improve pre‐procedural risk stratification in patients referred to TAVI for severe aortic stenosis.
Keywords: Inflammation, T cells, Monocytes, Aortic stenosis, TAVI
Introduction
During the recent decade, transcatheter aortic valve implantation (TAVI) has become a standard treatment option in the management of patients with severe aortic stenosis and higher risk for cardiac surgery. 1 Improvements of the procedure and advancements in the valve design, as well as increased clinical experience, have led to a dramatic reduction in complication rates. Outcome data from the PARTNER 2A and SURTAVI trials have established evidence for TAVI in intermediate risk patients. 2 , 3 More recent trials, Partner 3 and Evolut Low Risk, show non‐inferiority (Evolut Low Risk) and even superiority (Partner 3) of TAVI compared with surgical aortic valve replacement in low‐risk populations as well. 4 , 5
Previous work reported that approximately one‐third of patients undergoing TAVI developed an acute inflammatory response within 48 h of the procedure in the absence of clinical infection. 6 This so‐called systemic inflammatory response syndrome (SIRS) is characterized by leucocytosis, hyperventilation, tachycardia, fever, or hypothermia and is associated with significantly elevated levels of inflammatory cytokines (such as IL‐6 or IL‐8) and C‐reactive protein. The occurrence of SIRS was shown to be a strong predictor of mortality in patients undergoing TAVI. 7 , 8 Given the rather non‐specific nature of SIRS criteria and their limited applicability in the modern era of TAVI, with its significant reduction in postprocedural complications and steadily decreasing duration of hospital stay, there is a clinical need to establish novel prognostic inflammatory markers in order to improve risk stratification of patients. Circulating cells of the mononuclear phagocyte system and T lymphocytes (T cells) play key functions in the genesis and resolution of the immune response. In humans, the monocyte pool comprises three subsets (classical, intermediate, and non‐classical), which are characterized based on the expression of cluster of differentiation (CD)14 (lipopolysaccharide receptor) and CD16 (Fc receptor). Classical monocyte are defined by CD14++CD16− and are critical for the initiation of the inflammatory response, by executing phagocytosis, secretion of various pro‐inflammatory cytokines, and recruitment of other immune cells to the sites of inflammation. 9 Intermediate and non‐classical monocytes are characterized by expression of CD14++CD16+ and CD14dimCD16++, respectively, and have reduced phagocytic activity, reduced production of reactive oxygen species, and lower levels of CCR2 (C‐C chemokine receptor type 2) expression. Although non‐classical patrolling monocytes seem to be involved primarily in promoting the resolution of inflammation, studies have shown that this monocyte subset can also contribute to the pathogenesis of disease. 10 T cells also comprise a heterogeneous family of immune cell including pro‐inflammatory T helper (Th)1 cells, which produce interferon (IFN)‐γ and interleukin (IL)‐2, and Th17 cells, which secrete IL‐17. Th2 cells play a crucial role in the negative regulation of immune responses, whereas regulatory T cells (Tregs) are positive and negative cell function modulators that maintain immune tolerance and a dynamic equilibrium in ongoing inflammatory processes. 11 , 12
Altered distributions of monocyte subsets are associated with various cardiovascular diseases such as coronary artery disease, stroke, and atrial fibrillation 13 , 14 , 15 ; and levels of circulating intermediate monocytes were shown to decline after TAVI. 16 However, the influence of monocyte and T‐cell subsets on prognosis of TAVI patients is unclear.
Therefore, the present study aimed at investigating individual inflammatory signatures and functional heterogeneity of circulating myeloid and T‐cell subsets and their impact on 1 year survival in a single‐centre cohort of patients with severe aortic stenosis undergoing TAVI.
Methods
See Supplemental Methods for detailed information.
Patients
From September 2016 to March 2018, 129 consecutive patients with severe, symptomatic aortic stenosis were included into the study. None of the patients were affected by neoplastic, autoimmune, or chronic infectious disease. All subjects with recent infections were also excluded. Follow‐up was performed by telephone calls (patient, relatives, and physicians) or directly by a follow‐up appointment in our cardiology outpatient clinic. Written informed consent was obtained from all patients. Ethical approval was obtained from the Goethe University Ethics Service Committee (REC ref. 38/11). The study was conducted according to the principles set out in the Declaration of Helsinki.
Laboratory measurements
Peripheral venous whole blood samples were obtained pre‐procedurally (pre‐TAVI), directly after the intervention (post‐TAVI), and after 24 h and 3 days post‐TAVI. Standard inflammatory parameters, including total leucocyte counts and high‐sensitivity C‐reactive protein, were analysed at all time points. Serum levels of IL‐6, high‐sensitivity troponin T, N‐terminal pro‐brain natriuretic peptide, serum albumin, and renal function parameters, were assessed at baseline in all patients.
Enumeration of immune cell subsets
Differential myeloid and T‐cell subsets (Th1, Th2, Th9, Th17, Th1/Th17, Th22, and Tregs) were enumerated using multiparameter flow cytometry assays. Please see Tables S1–S4 for further details.
Serum cytokine measurements
Cytokine concentrations were measured from baseline serum samples (collected before TAVI) available in 80 patients using a flow‐bead‐based multiplex assay.
Statistical methods
Categorical variables are presented as number and percentage and continuous variables as median and inter‐quartile range (IQR). Comparisons between categorical variables were performed using χ 2 or Fisher exact test. Continuous variables were compared using non‐parametric Mann–Whitney U test or Kruskal–Wallis H with Dunn's multiple comparison test for independent groups and paired Wilcoxon test or Friedman's test for related groups. The correlation between continuous variables was tested using Spearman rank coefficients. Non‐parametric tests were used owing to small sample size of the study.
To test the predictive performance of continuous variables the area under the curve (AUC) was calculated from the receiver operating characteristic (ROC) curve. When ROC AUC was ≥0.6, the parameters were dichotomized using the optimal cut‐off point as defined by Youden index. The hazard ratio of variables was analysed in two steps. After univariate Cox regression was performed, the variables associated with outcome were included in multivariate model performed by backward stepwise approach based on the Wald statistics. Because Society of Thoracic Surgeons (STS) score comprises multiple clinical variables (https://www.sts.org/resources/risk-calculator), it was excluded from the multivariate analysis. Based on the multivariate analysis, a linear predictor score (the sum of the product of mean‐centred covariate values and their corresponding parameter estimates for each case) was also calculated. Finally, ROC curve calculated for linear predictor score was compared with ROC curve calculated for STS score by DeLong test. A P‐value of <0.05 was considered significant. Statistical analyses were performed using IBM SPSS Statistics (version 26) and GraphPad Prism (Version 7).
Gradient boosted trees algorithm in the prediction of mortality after transcatheter aortic valve implantation
For gradient boosted trees model using the XGboost implementation, we applied a similar approach as previously described by us, which involved applications of machine learning (ML) methods in predicting the outcomes of acute coronary syndrome and balloon cryoablation of pulmonary veins. 17 , 18 , 19
Results
Baseline and procedural characteristics
One hundred twenty‐nine consecutive patients (58.9% male, median age 83 [IQR 79–86] years) with severe, symptomatic aortic stenosis (mean transaortic pressure gradient, Pmean 44 [IQR 30–53] mmHg), and high or prohibitive operative risk (EuroSCORE II of 3.3 [IQR 2.3–6.0]% and STS score of 3.4 [IQR 2.4–5.0]%) were included into this prospective, observational, cohort study. TAVI was performed using various new generation prostheses including Portico valve (Abbott, n = 66), Sapien 3 and Sapien XT valve (Edwards Lifesciences, n = 17 and n = 1, respectively), Evolut R valve (Medtronic, n = 14), and AcurateNeo Symetis valve (Boston Scientific, n = 31). Baseline clinical characteristics of the study population are summarized in Table 1 . Baseline absolute cell counts of myeloid and T‐cell subsets for total study population are summarized in Table S5 .
Table 1.
Baseline clinical characteristics and comparison of the 12 month survival groups
| Total cohort (n = 129) | Survivors (n = 103) | Non‐survivors (n = 26) | P‐value | |
|---|---|---|---|---|
| Age (years) | 83 [IQR 79–86] | 83 [IQR 79–86] | 82.5 [IQR 78–85] | 0.93 |
| Male gender, n (%) | 76 (58.9) | 61 (59.2) | 15 (57.7) | 1.0 |
| Body mass index (kg/m2) | 27.0 [IQR 24.4–30.3] | 27.4 [IQR 24.8–31.1] | 26.7 [IQR 23.3–29.3] | 0.24 |
| Frailty, n (%) | 81 (62.8) | 60 (58.3) | 21 (80.8) | 0.04 |
| Advanced CKD (eGFR < 60), n (%) | 79 (61.2) | 59 (57.3) | 20 (76.9) | 0.11 |
| Carotid artery disease, n (%) | 27 (20.9) | 18 (17.5) | 9 (34.6) | 0.06 |
| Peripheral artery disease, n (%) | 18 (14) | 14 (13.6) | 4 (15.4) | 0.76 |
| Previous cardiac surgery | 18 (14) | 13 (12.6) | 5 (19.2) | 0.36 |
| Coronary artery disease (CAD) | ||||
| One‐vessel CAD, n (%) | 35 (27.1) | 30 (29.1) | 5 (19.2) | 0.037 |
| Two‐vessel CAD, n (%) | 16 (12.4) | 15 (14.6) | 1 (3.9) | |
| Three‐vessel CAD, n (%) | 29 (22.5) | 18 (17.5) | 11 (42.3) | |
| Previous MI, n (%) | 15 (11.6) | 10 (9.7) | 5 (19.2) | 0.18 |
| Previous PCI, n (%) | 58 (45) | 43 (41.8) | 15 (57.7) | 0.19 |
| Previous stroke, n (%) | 19 (14.7) | 16 (15.5) | 3 (11.5) | 0.76 |
| Porcelain aorta, n (%) | 18 (14) | 13 (12.6) | 5 (19.2) | 0.36 |
| COPD, n (%) | 18 (14) | 12 (11.7) | 6 (23.1) | 0.20 |
| Diabetes, n (%) | 48 (37.2) | 33 (32.0) | 15 (57.7) | 0.023 |
| Hypertension, n (%) | 121 (93.8) | 97 (94.2) | 24 (92.3) | 0.66 |
| Left ventricular EF (%) | 60 [IQR 45–60] | 60 [IQR 55–65] | 47.5 [IQR 35–60] | 0.007 |
| EuroSCORE II | 3.31 [IQR 2.31–6.04] | 3.13 [IQR 2.25–5.99] | 4.81 [IQR 3.30–13.58] | 0.001 |
| STS score | 3.41 [IQR 2.45–4.94] | 3.40 [IQR 2.32–4.50] | 4.88 [IQR 3.14–6.04] | <0.001 |
CAD, coronary artery disease; CKD, chronic kidney disease; COPD, chronic obstructive pulmonary disease; eGFR, estimated glomerular filtration rate (mL/min/1.73 m2); MI, myocardial infarction; PCI, percutaneous coronary intervention.
Postprocedural kinetics of myeloid and T‐cell subsets
Polymorphonuclear neutrophil (4562 [IQR 3588–6181] vs. 2669 [IQR 2030–3416] cells/μL, P < 0.001 vs. BL, Figures 1 and S1 ) as well as classical (272 [IQR 199–346] vs. 177 [IQR 145–245]) and intermediate monocyte counts (28 [IQR 19–44] vs. 15 [IQR 9–25]) were significantly elevated at 24 h (both P < 0.0001 vs. BL), whereas non‐classical monocytosis developed 3 days after TAVI (P < 0.05 vs. BL, Figures 2A–C and S1 ). Among CD4+ T‐cell subsets, the percentage of Tregs among CD4+ T cells (8.2% [IQR 6.4–9.7] vs. 6.9% [IQR 5.4–8.2]) and Th17 cells (5.9% [IQR 4.4–8.0] vs. 5.3% [IQR 4.0–6.8]) significantly increased (both P < 0.0001 at 24 h vs. BL) after valve implantation (Figures 3B and C and S2 ). These changes seemed not to depend on the valve type (balloon‐expandable vs. self‐expandable, Figure S3 ), and no significant effects of predilatation were observed (P > 0.05 for all cell subtypes, data not shown). However, the study was not powered to examine these differences.
Figure 1.

Intraindividual time courses in circulating leucocyte subset counts. (A–C) Major leucocyte subsets of (A) neutrophils, (B) eosinophils, and (C) lymphocytes. (D–F) Kinetics of T‐cell counts including (D) total T cells, (E) CD4+ T cells, and (F) CD8+ T cells. Subset counts are shown as percentage change (median) during the prespecified time points after transcatheter aortic valve implantation (TAVI), with the baseline value (pre‐TAVI) set to 0% (Friedman test, with Dunn's multiple‐comparisons test).
Figure 2.
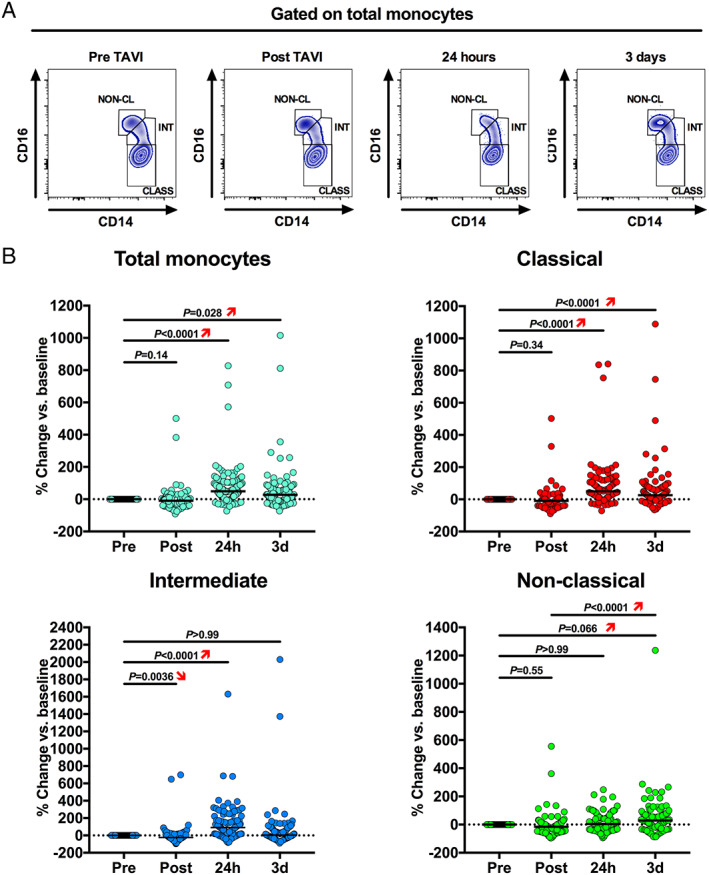
Intraindividual time courses in circulating monocyte subset counts. (A) Representative flow cytometry plots showing changes in monocyte subset distribution after transcatheter aortic valve implantation (TAVI). (B) Kinetics of monocyte counts including total monocytes, classical, intermediate, and non‐classical monocytes. Subset counts are shown as percentage change (median) during the prespecified time points after TAVI, with the baseline value (pre‐TAVI) set to 0% (Friedman test, with Dunn's multiple‐comparisons test).
Figure 3.
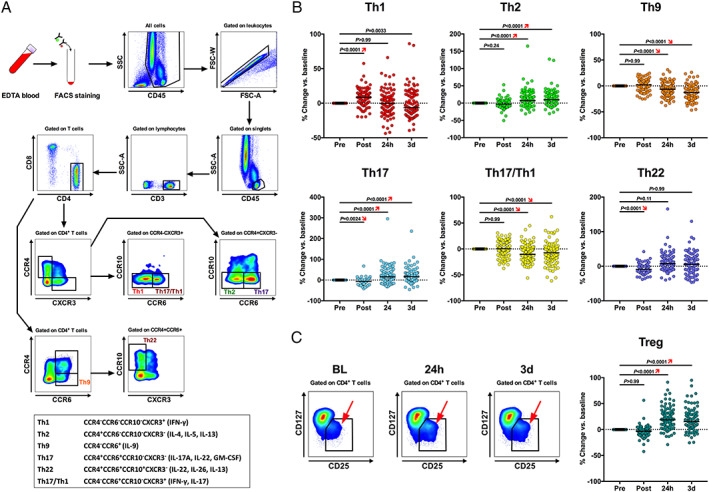
Intraindividual time courses in circulating CD4+ T‐cell subset counts. (A) CD4+ effector T‐cell subset flow gating strategy and immunophenotyped legend (box). (B) Kinetics of CD4+ effector T‐cell counts including Th1, Th2, Th9, TH17, Th17/Th1, and Th22 cells. (C) Gating strategy and representative flow plots showing changes in CD4+ T regulatory cells after transcatheter aortic valve implantation (TAVI). (D) Kinetics of Treg counts following TAVI. Subset counts are shown as percentage change (median) during the prespecified time points after TAVI, with the baseline value (pre‐TAVI) set to 0% (Friedman test, with Dunn's multiple‐comparisons test).
Baseline T‐cell subsets and postprocedural non‐classical monocytes and are associated with 1 year mortality after transcatheter aortic valve implantation
Overall mortality was 3.1% at 30 days, 8.5% at 6 months, and 20.5% at 12 months' follow‐up. The clinical characteristics of survivors and non‐survivors are summarized in Table 1 (for age‐tertile statistics, please see Tables S6–S8 ). In‐hospital complications after TAVI as reported using Valve Academic Research Consortium (VARC)‐2 criteria 20 and its association with 30 day mortality are presented in Table 2 . Whereas the occurrence of major vascular complications was associated with 30 day mortality (Table 2 ), none of the VARC‐2‐defined major complications was significantly associated with subsequent mortality (12 months) after TAVI (data not shown). SIRS criteria (as defined in Supplemental Methods ) were met in 13.8% of the population, and this was not associated with 12 month mortality (HR = 0.57, 95% CI: 0.13–2.43, P = 0.45).
Table 2.
Intra‐hospital complications and their association with 30 day mortality
| n = 129 | |||||
|---|---|---|---|---|---|
| Intra‐hospital complication | n | % | 30 day mortality | % | P‐value |
| Pacemaker | 24 | 19 | 0 | 0 | |
| Stroke | 4 | 3 | 1 | 25 | 0.120 |
| Myocardial infarction | 0 | 0 | 0 | ||
| Cardiac tamponade | 0 | 0 | 0 | ||
| Major vascular complication | 9 | 7 | 2 | 22.2 | 0.024 |
| Major bleeding | 6 | 5 | 1 | 16.7 | 0.175 |
| Total 30 day mortality | 4 | 3.1 | |||
Univariate analysis of inflammatory parameters showed that several baseline inflammatory parameters were associated with 12 month mortality after TAVI. Here, increased pre‐procedural levels of high‐sensitivity C‐reactive protein (hsCRP) and IL‐6, higher Granulocyte‐to‐Lymphocyte ratio, lower concentration of circulating Th2 cells, as well as increased percentages of Th17 cells, and higher percentage of Treg cells were predictive of outcome. Among postprocedural parameters, only elevated post‐TAVI counts of non‐classical monocytes proved to be associated with 12 month all‐cause mortality (Table 3 ). In order to assess medium‐term clinical outcome following TAVI, patients dying within the first 30 days after the procedure were excluded to avoid potential confounding effects of intra‐TAVI or early post‐TAVI complications leading to death. Hereafter, univariate analysis showed that among inflammatory parameters, increased baseline levels of hsCRP (HR = 1.52, 95% CI: 1.22–1.89; P < 0.0001) and IL‐6 (HR = 1.02, 95% CI: 1.01–1.03; P = 0.001), lower pre‐procedural Th2 counts (HR = 0.95, 95% CI: 0.91–0.99; P = 0.02), and increased non‐classical monocytes post‐TAVI (HR = 1.04, 95% CI: 1.01–1.08; P = 0.005) were still predictive of 12 month all course mortality.
Table 3.
Inflammatory predictors of 12 month mortality (univariate analysis)
| Univariate HR (95% CI) | P‐value | |
|---|---|---|
| hsCRP pre‐TAVI | 1.37 (1.151–1.631) | 0.000 |
| IL‐6 pre‐TAVI | 1.017 (1.006–1.028) | 0.003 |
| Non‐class monocytes (counts) post‐TAVI | 1.030 (1.010–1.050) | 0.003 |
| Th2 (counts) pre‐TAVI | 0.948 (0.912–0.987) | 0.009 |
| Treg (% CD4+ T cells) pre‐TAVI | 1.179 (1.025–1.357) | 0.021 |
| Gran/lymph ratio pre‐TAVI | 1.147 (1.019–1.292) | 0.023 |
| Th17 (% CD4+ T cells) pre‐TAVI | 1.189 (1.023–1.382) | 0.024 |
| Intermediate monocytes (count) pre‐TAVI a | 1.028 (0.997–1.060) | 0.081 |
| Intermediate monocytes (count) post‐TAVI a | 1.027 (0.995–1.059) | 0.094 |
| Classical monocytes (count) pre‐TAVI a | 1.001 (0.998–1.004) | 0.514 |
| Classical monocytes (count) post‐TAVI a | 1.002 (0.999–1.005) | 0.286 |
The hazard ratios of intermediate and classical monocytes shown for comparison of prognostic impact.
Machine learning algorithm identifies inflammatory T‐cell phenotypes among the strongest predictors of mortality after transcatheter aortic valve implantation
In order to gain a better understanding of the factors influencing the 12 month mortality after TAVI, we further used ML methods. The advantage of such an approach is that no assumptions are made about the model (e.g. about its linearity) or the data (e.g. distribution). Instead, the model is designed to adapt to existing data by gradually improving its ability to make the correct prediction during the learning process. We applied a gradient boosted trees model using the XGboost implementation. 21 This type of ML algorithm is an ensemble of decision trees that is also capable of providing the feature importance scores, which measure how much each feature contributed to the overall correctness of predictions in the validation dataset ( Figure S4A ). The XGboost algorithm achieved an AUC of 0.66 ± 0.1. Figure S4B shows the shapes of all the ROC curves for classification of the test set for each random data split. Feature importance scores were calculated for each data split, and then the importance scores for each feature were averaged. While STS score and frailty had the strongest influence on the correct decisions of machine‐learned algorithm, inflammatory response markers, including pre‐TAVI levels of Th17 CD4+ T cells and Th2 cell frequencies, were classified among the most important factors. Top features were sorted according to their impact on the model and presented in the form of a bar plot ( Figure S4C ). Exclusion of patients who died within 30 days after TAVI did not significantly affect the ML results ( Figure S5 ).
Inflammatory linear prediction score improve outcome assessment in transcatheter aortic valve implantation patients
To further investigate the prognostic performance of inflammatory parameters for outcome prediction after TAVI, we performed analysis of dichotomized parameters (Table 4 and Figure 4A ). Here, the presence of diabetes mellitus (DM), low left ventricular ejection fraction (<50%), increased baseline serum hsCRP (above the calculated cut‐off of 0.52 mg/dL), and lower baseline Th2 cell counts (below the calculated cut‐off of 24.3 cells/μL) were multivariate predictors of death. Moreover, the prognostic value of the linear predictor score of these parameters was superior to STS score (AUC: 0.88; 95% CI: 0.78–0.99 vs. 0.75; 95% CI: 0.64–0.86, respectively; P = 0.036, Figure 4B ).
Table 4.
Univariate and multivariate analysis of dichotomized 12 month mortality predictors
| Univariate | Multivariate | |||
|---|---|---|---|---|
| HR (95% CI) | P‐value | HR (95% CI) | P‐value | |
| Diabetes | 2.463 (1.130–5.369) | 0.023 | 3.499 (1.420–8.623) | 0.006 |
| Low LVEF (<50%) | 3.406 (1.574–7.367) | 0.002 | 3.155 (1.347–7.393) | 0.008 |
| Anaemia (Hb < 11 g/dL) | 5.732 (2.405–13.661) | <0.001 | ||
| NT‐proBNP > 2430 pg/dL | 5.186 (2.176–12.359) | <0.001 | ||
| hsCRP > 0.52 mg/dL | 3.491 (1.554–7.841) | 0.002 | 5.217 (2.091–13.012) | <0.001 |
| IL‐6 > 8.95 pg/dL | 3.075 (1.412–6.696) | 0.005 | ||
| Th17 > 4.9 (% CD4+ T cells) | 3.237 (1.115–9.397) | 0.031 | ||
| Th2 < 24.3 cells/μL | 5.825 (2.159–15.716) | 0.001 | 8.828 (3.021–25.800) | <0.001 |
LVEF, left ventricular ejection fraction.
Figure 4.

Inflammatory predictors of 12 month mortality after transcatheter aortic valve implantation (TAVI). (A) Circos plots showing significant predictors of 12 month mortality (univariate analysis of dichotomized parameters). (B) The composite (linear predictor score) of diabetes, low left ventricular ejection fraction (LVEF), increased C‐reactive protein (calculated optimal cut‐off 0.052 mg/dL), and decreased circulating Th2 cells (calculated cut‐off: 24.3 cells/μL) provided significantly higher area under receiver operating characteristic (ROC) curve (AUC) when compared with traditional Society of Thoracic Surgeons (STS) score. (C) Survival rate in patients with diabetes mellitus (DM) and preserved Th2 cell counts (higher than or equal to the calculated optimal cut‐off of 24.3 cells/μL) was comparable with that of patients without DM, whereas diabetic patients with reduced Th2 cells (<24.3 cells/μL) showed significantly higher mortality within 12 months after TAVI. (D) Serum levels of high‐sensitivity C‐reactive protein (hsCRP) did not show any significant impact on the prognosis of patients with DM.
Preserved Th2‐cell counts improve prognosis of diabetic patients undergoing transcatheter aortic valve implantation
Because previous studies have shown that the presence of DM is associated with poorer outcome after TAVI, 22 we further proved if the identified inflammatory phenotypes specifically impact the prognosis of diabetic patients in our cohort. Whereas presence of DM was associated with higher mortality in our cohort [15/48 (31%) for DM vs. 11/81 (14%) for non‐DM, P = 0.019], there were no significant differences in the baseline counts of inflammatory cell subsets between diabetic and non‐diabetic patients (data not shown). However, the survival rate in patients with DM and Th2 cell counts higher than or equal to the calculated optimal cut‐off of 24.3 cells/μL was comparable with that of patients without DM [25/28 (89%) vs. 36/38 (95%), P = 0.453]. In contrast, diabetic patients with reduced Th2 cells (<24.3 cells/μL) were less likely to survive [10/15 (67%) vs. 8/34 (24%), P = 0.003, patients with DM and without, respectively] (Figure 4C ). Interestingly, elevated hsCRP levels did not significantly affect survival of diabetic patients (Figure 4D ). These results exemplify a risk‐modulatory impact of T‐cell immunity in patients with severe degenerative aortic stenosis.
Pro‐inflammatory T‐cell polarization predicts adverse left ventricular remodelling after transcatheter aortic valve implantation
Finally, we tested the hypothesis that inflammatory processes are associated with different patterns of cardiac remodelling observed after TAVI. For this, post‐TAVI left ventricular remodelling patterns were categorized into four groups, according to changes in left ventricular mass index (LVMi) and relative wall thickness (RWT) after valve replacement. Reverse remodelling (Group 1) was defined as normalization of ventricular geometry with respect to decrease of both LVMi and RWT. Partial adverse ventricular remodelling was defined as an increase in LVMi and decrease in RWT (Group 2) or increase in RWT and decrease in LVMi (Group 3), and complete adverse remodelling was defined as an increase in both parameters (Group 4). ROC curve analysis revealed that among all tested baseline inflammatory parameters, low numbers of Tregs (P = 0.017; AUC: 0.69) and increased TH17/Treg ratio (P = 0.012; AUC: 0.70) were predictive of adverse (unfavourable) remodelling (Figure 5 ). These results reveal another pathophysiological link between pre‐existing pro‐inflammatory T‐cell polarization and the outcome of patients undergoing TAVI.
Figure 5.

Pro‐inflammatory T‐cell polarization predicts adverse (LV) remodelling after transcatheter aortic valve implantation (TAVI). Low numbers of T regulatory cells (Tregs) (A) and increased TH17/Treg ratio (B) were associated with adverse (Group 4) remodelling. The Kruskal–Wallis H test was used for multi‐group analysis (framed P‐values shown in the upper left‐hand corner of the graph) and post‐hoc Mann–Whitney U test for two‐group comparison was also performed.
Discussion
This is the first in‐depth study to investigate inflammatory cell signatures and their impact on survival in patients with severe degenerative aortic stenosis undergoing TAVI. Specifically, we show that higher baseline serum levels of hsCRP and IL‐6 and an immediate postprocedural increase in circulating non‐classical monocyte counts were associated with all‐cause mortality. Among the T‐cell subsets studied, lower baseline concentrations of circulating Th2 cells and increased levels of pro‐inflammatory Th17 cells were associated with reduced survival. These data were supported by unbiased ML approaches showing that next to STS score and frailty, higher proportion of Th17 cell and decreased counts of Th2 cells have the strongest influence on the correct decision. In addition, we show that a reduction in protective Th2 lymphocytes can deteriorate prognosis, especially in patients with concomitant diabetes, whereas preserved Th2 immunity may beneficially influence the outcome in this group. Thus, our results not only provide new insights into immunopathology of advanced degenerative aortic valve stenosis but also outline the feasibility of the adaptive immune status as a novel additive tool for pre‐procedural patient assessment.
Postprocedural non‐classical monocytes predict prognosis after transcatheter aortic valve implantation
The precise pathomechanism of how specific monocyte subsets impact the prognosis in an elderly patient population with degenerative aortic stenosis remains speculative. Previous studies suggested that baseline levels of circulating intermediate monocytes are associated with worsening heart function in TAVI patients. 15 In our study, the baseline counts of intermediate monocytes showed a trend to be predictive of 12 month mortality (Table 3 ). However, the increase in non‐classical monocytes post‐TAVI showed the strongest association with poor prognosis. Both non‐classical and intermediate monocytes secrete high levels of pro‐inflammatory cytokines, including tumour necrosis factor (TNF) α and IL‐1β, IL‐6, and IL‐8; and their accumulation has also been reported for various chronic inflammatory conditions. 23 , 24 , 25 , 26 Our results extend these findings by showing that higher serum concentrations of the C‐X‐C motif chemokine 10 (CXCL10) not only correlated with the elevated counts of non‐classical and intermediate monocytes but were also an independent predictor of mortality after TAVI ( Table S10 and Figure S6 ). CXCL10 is traditionally recognized for recruiting pathogenic T cells to inflamed sites. 27 More recently, Zhao and colleagues described a novel function of CXCL10 in the regulation of the inflammatory potential of human monocytes to produce cytokines. 28 In our cohort, CXCL10 correlated with the levels of several other cytokines, including those attributed to non‐classical and intermediate monocytes (IL‐1β, TNF‐α, TGF‐β, or IL‐8, Table S9 ), which indicates a possible role of CXCL10 in the amplification of myeloid cell‐mediated inflammatory responses in patients with severe aortic stenosis.
However, the specificity of the non‐classical monocytic response after TAVI could also, at least to some part, reflect a hyper‐responsiveness to non‐specific stimuli. Hyper‐responsiveness has been previously shown to be associated with unfavourable outcomes with patients with angina undergoing coronary angiography and could also account for an unfavourable outcome in patients undergoing TAVI. 29
Nonetheless, our present data suggest a prognostic impact of the peri‐interventional pro‐inflammatory CD16+ monocytes, and future studies will be warranted to elucidate specific anti‐inflammatory therapies targeting non‐classical monocyte‐driven inflammation in patients undergoing TAVI.
Pre‐existing inflammatory T‐cell polarization associates with adverse remodelling and increased mortality after transcatheter aortic valve implantation
Although T cells are known to influence cardiac function in mice after pressure overload 30 or aging, 31 the relation of circulating cells and tissue invasion in humans is unclear. In line with the traditional dogma of T‐cell immunology, we show that pre‐procedural ‘pro‐inflammatory’ polarization of T cells, indicated by lower baseline circulating Treg counts and increased Th17 over Treg ratio, were predictive of adverse left ventricular remodelling after TAVI. On the other hand, higher baseline percentages of Tregs also seem predictive of midterm mortality in our cohort. At least part of the explanation for this apparent paradox involves the newest experimental findings, which have recently changed our view on Treg heterogeneity, activation, and their involvement in inflammatory processes. Recent studies show that Th17 cells and Tregs share many similarities and do not simply antagonize each other, but instead, they stimulate each other reciprocally. 32 Moreover, there is strong evidence that specific subsets of Tregs can convert into Th17 cells in the presence of inflammatory cytokines, 33 and vice versa, Th17 cells can transdifferentiate into regulatory cells and contribute to the resolution of inflammation. 34 Our phenotypical data also concur with these reports showing a modulatory role of Tregs in Th17‐driven inflammation as indicated by a strong positive correlation between Treg and Th17 cell counts and by an inverse correlation between Treg and Th1 level before and after TAVI ( Figure S7 ). More recent studies also demonstrated that, based on IL‐10 and IL‐35 production, Tregs can be diversified into two functionally distinct subsets. IL‐10‐producing effector Treg cells act as amplifiers of negative regulatory circuits to restrain Th17 cell‐mediated inflammation. 35 Thus, the observed concomitant increase of Tregs in our study could also represent a surrogate of Th17‐driven inflammation in terms of a compensatory increase in inflammation‐dampening IL‐10‐Treg cells. 36 Our data on cytokine profiles seem to support this assumption by showing a correlation between baseline serum levels of IL‐10 and Th17 cells ( Table S11 ). Although the role of IL‐10 as anti‐inflammatory mediator, which improves cardiac function after injury in the myocardial infarction model, is well established, 37 a recent study suggests that it may also have mild but adverse effects in an experimental model of heart failure with preserved ejection fraction (HFpEF). 38 A common effect observed in HFpEF and post‐infarction remodelling is that IL‐10 activates fibroblasts. Because fibroblasts play an important role in wound healing and cardiac remodelling, their activation may contribute to the beneficial effect of IL‐10 in acute injury models, whereas a long‐term chronic activation of fibroblasts may explain the increase of myocardial fibrosis and development of diastolic dysfunction as seen in macrophage‐specific IL‐10‐deficiency in the HFpEF model. Indeed, myocardial fibrosis as identified by MRI pre‐TAVI was recently shown to be a powerful predictor of 2 year mortality in patients with aortic stenosis undergoing TAVI. 39 However, as the majority of studies on Treg regulation has been performed in murine models, any conclusions should be treated with caution when applying to our results, given the substantial distinctions between regulatory T‐cell biology in humans and mice. 40
In summary, we show that individual baseline T‐cell signatures rather than their postprocedural kinetics or positive SIRS criteria were predictive of outcome, which points towards a pre‐existing adaptive‐related immune predisposition to adverse outcome in patients undergoing TAVI.
Clinical perspective
The era of anti‐inflammatory therapies in cardiovascular disease and heart failure has just begun. 41 A recent subgroup analysis using placebo‐controlled data of the CANTOS (Canakinumab Anti‐Inflammatory Thrombosis Outcome Study) trial showed that IL‐1β‐targeting therapy may reduce heart failure hospitalization and heart failure‐related mortality. 42 At the cell‐specific level, novel immunomodulatory approaches targeting CD16+ monocytes in systemic inflammatory disease showed promising results in first clinical trials. 43
Considering therapeutic application of specific immune signatures in advanced valve disease, it would be important to prove whether our results specifically apply to distinct groups of patients and might be biased by, for example, particular T‐cell‐specific immunological (e.g. cytomegalovirus seropositivity and T‐cell immunosenescence) 44 or genetic [e.g. presence of distinct somatic mutations associated with clonal haematopoiesis of indeterminate potential (CHIP)] burden. CHIP is a classical age‐associated phenomenon, which affects about 30% of patients > 70 years, and mutations of the haematopoietic stem cells were shown to cause an enhanced inflammatory responsiveness of monocytes and T lymphocytes. 45 , 46 , 47 Epigenetic determinants of cellular immune signatures, as well as their impact on prognosis and responsiveness to potential anti‐inflammatory therapies in elderly patients with advanced aortic stenosis, remain to be further elucidated.
Study limitations
Owing to relatively small sample size and few event, this study should be considered hypothesis generating. Undoubtedly, a larger controlled trial (including standardized flow cytometry‐based assays) is needed to further validate our data and to strengthen the hypothesized prognostic impact of leucocytic signatures in patients undergoing TAVI, including vulnerable subgroups like diabetics. In terms of future applicability of the presented measures, further cross‐sectional studies in different populations of octogenarians should possibly define assay‐specific and gender‐adjusted or age‐adjusted cut‐off values for distinct cell subsets to facilitate their implementation into routine laboratory diagnostics and immunological assessment of the future TAVI candidates. In addition, a better and more standardized clinical characterization of patients (e.g. including Rockwood‐index criteria for definition of frailty) and well‐defined imaging follow‐up time points for remodelling data should be implemented in future study design.
Conclusions
Our findings demonstrate for the first time an association of specific inflammatory phenotypes with increased mortality after TAVI (Figure S1 ). Distinct monocyte and T‐cell signatures might provide novel additive biomarkers to improve individual risk stratification and possibly guide upcoming anti‐inflammatory therapies in patients with severe aortic stenosis.
Conflict of interest
Mariuca Vasa‐Nicotera is proctor for Abbott, Medtronic, and Boston Scientific. Stephan Fichtlscherer is proctor and reports consultancy activities for Abbott and Edwards Lifesciences. All other authors have no conflicts of interest related to the subject of the article.
Funding
SFB834 funding to Stefanie Dimmeler and Mariuca Vasa‐Nicotera and Cardiopulmonary Systems (CPI, Exc2026) by the German Research Foundation (Deutsche Forschungsgemeinschaft). This study was also supported by a postdoctoral grant by the DZHK (Bundesministerium für Bildung und Forschung).
Supporting information
Data S1. Supporting information.
Data S2. Supporting information.
Figure S1. Myeloid subset counts after TAVI. Absolute T‐cell subset counts (cell/μl) are shown during the prespecified time points after TAVI (Friedman test, with Dunn's multiple‐comparisons test).
Figure S2. T‐cell subset counts after TAVI. Absolute T‐cell subset counts (cell/μl) are shown during the prespecified time points after TAVI (Friedman test, with Dunn's multiple‐comparisons test).
Figure S3. Impact of valve type on leukocyte subsets kinetics after TAVI. (A) Schematic view showing distribution of Balloon‐Expandable (BE) versus Self‐Expandable (SE) valves in the study with corresponding patient numbers. (B) Changes (24 hours vs. Baseline, BL) in CRP levels and selected myeloid and T‐cell subsets for BE and SE valves.
Figure S4. Gradient boosted trees algorithm in the prediction of 12‐month mortality after TAVI. (A) Flow chart explaining the working principle of the algorithm. (B) Shapes of all the receiver–operating curves for classification of the test set for each random data split. (C) Features were sorted according to their impact on the model and presented in the form of a bar plot. For clarity, we present the top 25 features only.
Figure S5. Gradient boosted trees algorithm in the prediction of 12‐month mortality after exclusion of 30‐day deaths. Features were sorted according to their impact on the model and presented in the form of a bar plot. For clarity, we present the top 25 features only.
Figure S6. Receiver operator characteristics (ROC) curve analysis of sensitivity and specificity of CXCL10 in prediction of 12‐month mortality in patients post TAVI (based on n = 80 patients)
Figure S7. Correlations between regulatory T cells (Treg) and other pro‐inflammatory T‐cell subsets. Treg levels showed significant positive correlations with Th17 (upper panel) and inverse correlations with Th1 cells (lower panel) before and 24 hours after TAVI.
Table S1: List of antibodies used for Immunophenotyping studies.
Table S2: Multiparameter compensation setting for leukocyte enumeration (TruCount) panel.
Table S3: Multiparameter compensation setting for CD4 Th panel (‘CD4 Panel 1’).
Table S4: Multiparameter compensation setting for CD4 Treg panel (‘CD4 Panel 2’).
Table S5. Baseline leukocyte cell counts
Table S6. Age‐adjusted baseline characteristics for total population.
Table S7. Age‐adjusted characteristics for survivors.
Table S8. Age‐adjusted baseline for non‐survivors.
Table S9. Correlation matrix (Spearman rank coefficients) for serum cytokine levels (n = 80).
Table S10. Correlations between monocyte subset counts and cytokine levels (Spearman, n = 80).
Table S11. Correlations between T‐cell subsets and cytokine levels (Spearman, n = 80).
Hoffmann, J. , Mas‐Peiro, S. , Berkowitsch, A. , Boeckling, F. , Rasper, T. , Pieszko, K. , De Rosa, R. , Hiczkiewicz, J. , Burchardt, P. , Fichtlscherer, S. , Zeiher, A. M. , Dimmeler, S. , and Nicotera, M. V. (2020) Inflammatory signatures are associated with increased mortality after transfemoral transcatheter aortic valve implantation. ESC Heart Failure, 7: 2597–2610. 10.1002/ehf2.12837.
References
- 1. Lüscher TF. TAVI: from an experimental procedure to standard of care. Eur Heart J 2018; 39: 2605–2608. [DOI] [PubMed] [Google Scholar]
- 2. Leon MB, Smith CR, Mack MJ, Makkar RR, Svensson LG, Kodali SK, Thourani VH, Tuzcu EM, Miller DC, Herrmann HC, Doshi D, Cohen DJ, Pichard AD, Kapadia S, Dewey T, Babaliaros V, Szeto WY, Williams MR, Kereiakes D, Zajarias A, Greason KL, Whisenant BK, Hodson RW, Moses JW, Trento A, Brown DL, Fearon WF, Pibarot P, Hahn RT, Jaber WA, Anderson WN, Alu MC, Webb JG, PARTNER 2 Investigators . Transcatheter or surgical aortic‐valve replacement in intermediate‐risk patients. N Engl J Med 2016; 374: 1609–1620. [DOI] [PubMed] [Google Scholar]
- 3. Reardon MJ, Van Mieghem NM, Popma JJ, Kleiman NS, Søndergaard L, Mumtaz M, Adams DH, Deeb GM, Maini B, Gada H, Chetcuti S. Surgical or transcatheter aortic‐valve replacement in intermediate‐risk patients. N Engl J Med 2017; 376: 1321–1331. [DOI] [PubMed] [Google Scholar]
- 4. Mack MJ, Leon MB, Thourani VH, Makkar R, Kodali SK, Russo M, Kapadia SR, Malaisrie SC, Cohen DJ, Pibarot P, Leipsic J, Hahn RT, Blanke P, Williams MR, McCabe J, Brown DL, Babaliaros V, Goldman S, Szeto WY, Genereux P, Pershad A, Pocock SJ, Alu MC, Webb JG, Smith CR, PARTNER 3 Investigators . Transcatheter aortic‐valve replacement with a balloon‐expandable valve in low‐risk patients. N Engl J Med 2019; 380: 1695–1705. [DOI] [PubMed] [Google Scholar]
- 5. Popma JJ, Deeb GM, Yakubov SJ, Mumtaz M, Gada H, O'Hair D, Bajwa T, Heiser JC, Merhi W, Kleiman NS, Askew J, Sorajja P, Rovin J, Chetcuti SJ, Adams DH, Teirstein PS, Zorn GL 3rd, Forrest JK, Tchétché D, Resar J, Walton A, Piazza N, Ramlawi B, Robinson N, Petrossian G, Gleason TG, Oh JK, Boulware MJ, Qiao H, Mugglin AS, Reardon MJ, Evolut Low Risk Trial Investigators . Transcatheter aortic‐valve replacement with a self‐expanding valve in low‐risk patients. N Engl J Med 2019; 380: 1706–1715. [DOI] [PubMed] [Google Scholar]
- 6. Schwietz T, Behjati S, Gafoor S, Seeger F, Doss M, Sievert H, Zeiher AM, Fichtlscherer S, Lehmann R. Occurrence and prognostic impact of systemic inflammatory response syndrome in transfemoral and transapical aortic valve implantation with balloon‐ and self‐expandable valves. EuroIntervention 2015; 10: 1468–1473. [DOI] [PubMed] [Google Scholar]
- 7. Sinning JM, Scheer AC, Adenauer V, Ghanem A, Hammerstingl C, Schueler R, Müller C, Vasa‐Nicotera M, Grube E, Nickenig G, Werner N. Systemic inflammatory response syndrome predicts increased mortality in patients after transcatheter aortic valve implantation. Eur Heart J 2012; 33: 1459–1468. [DOI] [PubMed] [Google Scholar]
- 8. Lindman BR, Goldstein JS, Nassif ME, Zajarias A, Novak E, Tibrewala A, Vatterott AM, Lawler C, Damiano RJ, Moon MR, Lawton JS, Lasala JM, Maniar HS. Systemic inflammatory response syndrome after transcatheter or surgical aortic valve replacement. Heart 2015; 101: 537–545. [DOI] [PMC free article] [PubMed] [Google Scholar]
- 9. Patel AA, Zhang Y, Fullerton JN, Boelen L, Rongvaux A, Maini AA, Bigley V, Flavell RA, Gilroy DW, Asquith B, Macallan D, Yona S. The fate and lifespan of human monocyte subsets in steady state and systemic inflammation. J Exp Med 2017; 214: 1913–1923. [DOI] [PMC free article] [PubMed] [Google Scholar]
- 10. Narasimhan PB, Marcovecchio P, Hamers AAJ, Hedrick CC. Nonclassical monocytes in health and disease. Annu Rev Immunol 2019; 37: 439–456. [DOI] [PubMed] [Google Scholar]
- 11. Sharma A, Rudra D. Emerging functions of regulatory T cells in tissue homeostasis. Front Immunol 2018; 9: 883. [DOI] [PMC free article] [PubMed] [Google Scholar]
- 12. Saravia J, Chapman NM, Chi H. Helper T cell differentiation. Cell Mol Immunol 2019; 16: 634–643. [DOI] [PMC free article] [PubMed] [Google Scholar]
- 13. van der Vorst EPC, Weber C. Novel features of monocytes and macrophages in cardiovascular biology and disease. Arterioscler Thromb Vasc Biol 2019; 39: e30–e37. [DOI] [PubMed] [Google Scholar]
- 14. Nahrendorf M. Myeloid cell contributions to cardiovascular health and disease. Nat Med 2018; 24: 711–720. [DOI] [PMC free article] [PubMed] [Google Scholar]
- 15. Shahid F, Lip GYH, Shantsila E. Role of monocytes in heart failure and atrial fibrillation. J Am Heart Assoc 2018; 7. [DOI] [PMC free article] [PubMed] [Google Scholar]
- 16. Neuser J, Galuppo P, Fraccarollo D, Willig J, Kempf T, Berliner D, Bauersachs J, Widder JD. Intermediate CD14++CD16+ monocytes decline after transcatheter aortic valve replacement and correlate with functional capacity and left ventricular systolic function. PLoS ONE 2017; 12: e0183670. [DOI] [PMC free article] [PubMed] [Google Scholar]
- 17. Pieszko K, Hiczkiewicz J, Budzianowski P, Rzeźniczak J, Budzianowski J, Błaszczyński J, Słowiński R, Burchardt P. Machine‐learned models using hematological inflammation markers in the prediction of short‐term acute coronary syndrome outcomes. J Transl Med 2018; 16: 334. [DOI] [PMC free article] [PubMed] [Google Scholar]
- 18. Pieszko K, Hiczkiewicz J, Budzianowski P, Budzianowski J, Rzeźniczak J, Pieszko K, Burchardt P. Predicting long‐term mortality after acute coronary syndrome using machine learning techniques and hematological markers. Dis Markers 2019; 2019: 9056402. [DOI] [PMC free article] [PubMed] [Google Scholar]
- 19. Budzianowski J, Hiczkiewicz J, Burchardt P, Pieszko K, Rzeźniczak J, Budzianowski P, Korybalska K. Predictors of atrial fibrillation early recurrence following cryoballoon ablation of pulmonary veins using statistical assessment and machine learning algorithms. Heart Vessels 2019; 34: 352–359. [DOI] [PMC free article] [PubMed] [Google Scholar]
- 20. Kappetein AP, Head SJ, Généreux P, Piazza N, van Mieghem NM, Blackstone EH, Brott TG, Cohen DJ, Cutlip DE, van Es GA, Hahn RT, Kirtane AJ, Krucoff MW, Kodali S, Mack MJ, Mehran R, Rodés‐Cabau J, Vranckx P, Webb JG, Windecker S, Serruys PW, Leon MB. Updated standardized endpoint definitions for transcatheter aortic valve implantation: the Valve Academic Research Consortium‐2 consensus document. Eur Heart J 2012; 33: 2403–2418. [DOI] [PubMed] [Google Scholar]
- 21. Chen T, Guestrin C. XGBoost: a scalable tree boosting system. 2016; DOI: 10.1145/2939672.2939785 [DOI]
- 22. Abramowitz Y, Jilaihawi H, Chakravarty T, Mangat G, Maeno Y, Kazuno Y, Takahashi N, Kawamori H, Cheng W, Makkar RR. Impact of diabetes mellitus on outcomes after transcatheter aortic valve implantation. Am J Cardiol 2016; 117: 1636–1642. [DOI] [PubMed] [Google Scholar]
- 23. Mukherjee R, Kanti Barman P, Kumar Thatoi P, Tripathy R, Kumar Das B, Ravindran B. Non‐Classical monocytes display inflammatory features: Validation in Sepsis and Systemic Lupus Erythematous. Sci Rep 2015; 5: 13886. [DOI] [PMC free article] [PubMed] [Google Scholar]
- 24. Ong SM, Hadadi E, Dang TM, Yeap WH, Tan CTY, Ng TP, Larbi A, Wong SC. The pro‐inflammatory phenotype of the human non‐classical monocyte subset is attributed to senescence. Cell Death Dis 2018; 9: 266. [DOI] [PMC free article] [PubMed] [Google Scholar]
- 25. Thomas G, Tacke R, Hedrick CC, Hanna RN. Nonclassical patrolling monocyte function in the vasculature. Arterioscler Thromb Vasc Biol 2015; 35: 1306–1316. [DOI] [PMC free article] [PubMed] [Google Scholar]
- 26. Hoffmann J, Fišer K, Liebetrau C, Staubach N, Kost D, Voss S, Heiden A, Dörr O, Lipps C, Nef HM, Möllmann H, Hamm CW, Keller T, Troidl C. High‐Content Immunophenotyping and Hierarchical Clustering Reveal Sources of Heterogeneity and New Surface Markers of Human Blood Monocyte Subsets. Thromb Haemost 2020; 120: 141–155. [DOI] [PubMed] [Google Scholar]
- 27. Dufour JH, Dziejman M, Liu MT, Leung JH, Lane TE, Luster AD. IFN‐gamma‐inducible protein 10 (IP‐10; CXCL10)‐deficient mice reveal a role for IP‐10 in effector T cell generation and trafficking. J Immunol 2002; 168: 3195–3204. [DOI] [PubMed] [Google Scholar]
- 28. Zhao Q, Kim T, Pang J, Sun W, Yang X, Wang J, Song Y, Zhang H, Sun H, Rangan V, Deshpande S, Tang H, Cvijic ME, Westhouse R, Olah T, Xie J, Struthers M, Salter‐Cid L. A novel function of CXCL10 in mediating monocyte production of proinflammatory cytokines. J Leukoc Biol 2017; 102: 1271–1280. [DOI] [PubMed] [Google Scholar]
- 29. Liuzzo G, Buffon A, Biasucci LM, Gallimore JR, Caligiuri G, Vitelli A, Altamura S, Ciliberto G, Rebuzzi AG, Crea F, Pepys MB, Maseri A. Enhanced inflammatory response to coronary angioplasty in patients with severe unstable angina. Circulation 1998; 98: 2370–2376. [DOI] [PubMed] [Google Scholar]
- 30. Laroumanie F, Douin‐Echinard V, Pozzo J, Lairez O, Tortosa F, Vinel C, Delage C, Calise D, Dutaur M, Parini A, Pizzinat N. CD4+ T cells promote the transition from hypertrophy to heart failure during chronic pressure overload. Circulation 2014; 129: 2111–2124. [DOI] [PubMed] [Google Scholar]
- 31. Ramos GC, van den Berg A, Nunes‐Silva V, Weirather J, Peters L, Burkard M, Friedrich M, Pinnecker J, Abeßer M, Heinze KG, Schuh K, Beyersdorf N, Kerkau T, Demengeot J, Frantz S, Hofmann U. Myocardial aging as a T‐cell‐mediated phenomenon. Proc Natl Acad Sci U S A 2017; 114: E2420–E2429. [DOI] [PMC free article] [PubMed] [Google Scholar]
- 32. Chen X, Oppenheim JJ. Th17 cells and Tregs: unlikely allies. J Leukoc Biol 2014; 95: 723–731. [DOI] [PMC free article] [PubMed] [Google Scholar]
- 33. Yang XO, Nurieva R, Martinez GJ, Kang HS, Chung Y, Pappu BP, Shah B, Chang SH, Schluns KS, Watowich SS, Feng XH, Jetten AM, Dong C. Molecular antagonism and plasticity of regulatory and inflammatory T cell programs. Immunity 2008; 29: 44–56. [DOI] [PMC free article] [PubMed] [Google Scholar]
- 34. Gagliani N, Amezcua Vesely MC, Iseppon A, Brockmann L, Xu H, Palm NW, De Zoete MR, Licona‐Limón P, Paiva RS, Ching T, Weaver C. Th17 cells transdifferentiate into regulatory T cells during resolution of inflammation. Nature 2015; 523: 221–225. [DOI] [PMC free article] [PubMed] [Google Scholar]
- 35. Wei X, Zhang J, Gu Q, Huang M, Zhang W, Guo J, Zhou X. Reciprocal Expression of IL‐35 and IL‐10 Defines Two Distinct Effector Treg Subsets that Are Required for Maintenance of Immune Tolerance. Cell Rep 2017; 21: 1853–1869. [DOI] [PubMed] [Google Scholar]
- 36. Chaudhry A, Samstein RM, Treuting P, Liang Y, Pils MC, Heinrich JM, Jack RS, Wunderlich FT, Brüning JC, Müller W, Rudensky AY. Interleukin‐10 signaling in regulatory T cells is required for suppression of Th17 cell‐mediated inflammation. Immunity 2011; 34: 566–578. [DOI] [PMC free article] [PubMed] [Google Scholar]
- 37. Krishnamurthy P, Rajasingh J, Lambers E, Qin G, Losordo DW, Kishore R. IL‐10 inhibits inflammation and attenuates left ventricular remodeling after myocardial infarction via activation of STAT3 and suppression of HuR. Circ Res 2009; 104: e9–e18. [DOI] [PMC free article] [PubMed] [Google Scholar]
- 38. Hulsmans M, Sager HB, Roh JD, Valero‐Muñoz M, Houstis NE, Iwamoto Y, Sun Y, Wilson RM, Wojtkiewicz G, Tricot B, Osborne MT, Hung J, Vinegoni C, Naxerova K, Sosnovik DE, Zile MR, Bradshaw AD, Liao R, Tawakol A, Weissleder R, Rosenzweig A, Swirski FK, Sam F, Nahrendorf M. Cardiac macrophages promote diastolic dysfunction. J Exp Med 2018; 215: 423–440. [DOI] [PMC free article] [PubMed] [Google Scholar]
- 39. Musa TA, Treibel TA, Vassiliou VS, Captur G, Singh A, Chin C, Dobson LE, Pica S, Loudon M, Malley T, Rigolli M, Foley JRJ, Bijsterveld P, Law GR, Dweck MR, Myerson SG, McCann GP, Prasad SK, Moon JC, Greenwood JP. Myocardial scar and mortality in severe aortic stenosis. Circulation 2018; 138: 1935–1947. [DOI] [PMC free article] [PubMed] [Google Scholar]
- 40. Shevach EM. Foxp3+ T regulatory cells: still many unanswered questions—a perspective after 20 years of study. Front Immunol 2018; 9: 1048. [DOI] [PMC free article] [PubMed] [Google Scholar]
- 41. Ridker PM. Anticytokine agents: targeting interleukin signaling pathways for the treatment of atherothrombosis. Circ Res 2019; 124: 437–450. [DOI] [PMC free article] [PubMed] [Google Scholar]
- 42. Everett BM, Cornel JH, Lainscak M, Anker SD, Abbate A, Thuren T, Libby P, Glynn RJ, Ridker PM. Anti‐inflammatory therapy with canakinumab for the prevention of hospitalization for heart failure. Circulation 2019; 139: 1289–1299. [DOI] [PubMed] [Google Scholar]
- 43. Tanaka Y, Takeuchi T, Yamanaka H, Nanki T, Umehara H, Yasuda N, Tago F, Kitahara Y, Kawakubo M, Torii K, Hojo S. Efficacy and safety of e6011, an anti‐fractalkine monoclonal antibody, in Mtx‐Ir patients with rheumatoid arthritis. Ann Rheum Dis 2019; 78: 188. [Google Scholar]
- 44. Spyridopoulos I, Martin‐Ruiz C, Hilkens C, Yadegarfar ME, Isaacs J, Jagger C, Kirkwood T, von Zglinicki T. CMV seropositivity and T‐cell senescence predict increased cardiovascular mortality in octogenarians: results from the Newcastle 85+ study. Aging Cell 2016; 15: 389–392. [DOI] [PMC free article] [PubMed] [Google Scholar]
- 45. Fuster JJ, MacLauchlan S, Zuriaga MA, Polackal MN, Ostriker AC, Chakraborty R, Wu CL, Sano S, Muralidharan S, Rius C, Vuong J, Jacob S, Muralidhar V, Robertson AAB, Cooper MA, Andrés V, Hirschi KK, Martin KA, Walsh K. Clonal hematopoiesis associated with TET2 deficiency accelerates atherosclerosis development in mice. Science 2017; 355: 842–847. [DOI] [PMC free article] [PubMed] [Google Scholar]
- 46. Buscarlet M, Provost S, Zada YF, Bourgoin V, Mollica L, Dubé MP, Busque L. Lineage restriction analyses in CHIP indicate myeloid bias for TET2 and multipotent stem cell origin for DNMT3A. Blood 2018; 132: 277–280. [DOI] [PubMed] [Google Scholar]
- 47. Mas‐Peiro S, Hoffmann J, Fichtlscherer S, Dorsheimer L, Rieger MA, Dimmeler S, Vasa‐Nicotera M, Zeiher AM. Clonal haematopoiesis in patients with degenerative aortic valve stenosis undergoingvtranscatheter aortic valve implantation. Eur Heart J 2020; 41: 933–939. [DOI] [PMC free article] [PubMed] [Google Scholar]
Associated Data
This section collects any data citations, data availability statements, or supplementary materials included in this article.
Supplementary Materials
Data S1. Supporting information.
Data S2. Supporting information.
Figure S1. Myeloid subset counts after TAVI. Absolute T‐cell subset counts (cell/μl) are shown during the prespecified time points after TAVI (Friedman test, with Dunn's multiple‐comparisons test).
Figure S2. T‐cell subset counts after TAVI. Absolute T‐cell subset counts (cell/μl) are shown during the prespecified time points after TAVI (Friedman test, with Dunn's multiple‐comparisons test).
Figure S3. Impact of valve type on leukocyte subsets kinetics after TAVI. (A) Schematic view showing distribution of Balloon‐Expandable (BE) versus Self‐Expandable (SE) valves in the study with corresponding patient numbers. (B) Changes (24 hours vs. Baseline, BL) in CRP levels and selected myeloid and T‐cell subsets for BE and SE valves.
Figure S4. Gradient boosted trees algorithm in the prediction of 12‐month mortality after TAVI. (A) Flow chart explaining the working principle of the algorithm. (B) Shapes of all the receiver–operating curves for classification of the test set for each random data split. (C) Features were sorted according to their impact on the model and presented in the form of a bar plot. For clarity, we present the top 25 features only.
Figure S5. Gradient boosted trees algorithm in the prediction of 12‐month mortality after exclusion of 30‐day deaths. Features were sorted according to their impact on the model and presented in the form of a bar plot. For clarity, we present the top 25 features only.
Figure S6. Receiver operator characteristics (ROC) curve analysis of sensitivity and specificity of CXCL10 in prediction of 12‐month mortality in patients post TAVI (based on n = 80 patients)
Figure S7. Correlations between regulatory T cells (Treg) and other pro‐inflammatory T‐cell subsets. Treg levels showed significant positive correlations with Th17 (upper panel) and inverse correlations with Th1 cells (lower panel) before and 24 hours after TAVI.
Table S1: List of antibodies used for Immunophenotyping studies.
Table S2: Multiparameter compensation setting for leukocyte enumeration (TruCount) panel.
Table S3: Multiparameter compensation setting for CD4 Th panel (‘CD4 Panel 1’).
Table S4: Multiparameter compensation setting for CD4 Treg panel (‘CD4 Panel 2’).
Table S5. Baseline leukocyte cell counts
Table S6. Age‐adjusted baseline characteristics for total population.
Table S7. Age‐adjusted characteristics for survivors.
Table S8. Age‐adjusted baseline for non‐survivors.
Table S9. Correlation matrix (Spearman rank coefficients) for serum cytokine levels (n = 80).
Table S10. Correlations between monocyte subset counts and cytokine levels (Spearman, n = 80).
Table S11. Correlations between T‐cell subsets and cytokine levels (Spearman, n = 80).